

Translate this page into:
Macroalgae as an eco-friendly and successful green technology for the removal of crystal violet from synthetic and real wastewater
⁎Corresponding author. mohammad.alghouti@qu.edu.qa (Mohammad A. Al-Ghouti)
-
Received: ,
Accepted: ,
This article was originally published by Elsevier and was migrated to Scientific Scholar after the change of Publisher.
Peer review under responsibility of King Saud University.
Abstract
Crystal violet (CV) is one of the water pollutants that can cause potential harm to living beings and the environment. Different methods are applied for the removal of CV from wastewater, however, a cheap and environmentally friendly way is preferred. In this study, Hormophysa triquetra (HT) and its silver-modified form (AgHT) were used for the removal of CV from synthetic and real wastewater. Both physical and chemical characterizations of HT and AgHT were carried out using scanning electron microscopy – energy dispersive X-ray analysis (SEM-EDX), Transmission electron microscopy (TEM), Fourier transform infrared spectroscopy (FTIR), zeta potential (ζ-potential), and Brunauer-Emmet-Teller (BET) analysis. Different parameters such as pH, temperature, and concentration were studied for the adsorption process. The optimum pH of the adsorption process was 6 with a maximum adsorption capacity of 181.8 mg/g for HT and 312.5 mg/g for AgHT at 45◦C. The best-fitted adsorption isotherm model was the Langmuir model based on the correlation coefficient (R2) however; the chi-square (χ2) analysis indicated the Freundlich model to be the best-fit model. Moreover, the thermodynamics studies indicated a spontaneous and endothermic reaction with HT and the reverse with AgHT. The main functional groups contributing to the adsorption of CV on the adsorbents involve carboxyl, hydroxyl, carbonyl groups, and aromatic rings. The adsorbent removed more than 98 % of CV from real wastewater with AgHT being more efficient than HT. Desorption studies indicated that desorption agents such as NaOH and HCl reduced the electrostatic interactions between the adsorbate and the adsorbent, thereby regenerating the adsorbent. This study proves the use of naturally abundant and available macroalgae as an eco-friendly and successful green technology for the removal of CV from real wastewater.
Keywords
Waste management
Dyes
Macroalgae
Desorption
Adsorption models

1 Introduction
Due to rapid industrialization, the demand for life necessities has risen. This has led to an increase in environmental pollution in one way or the other. Not only the environment but also living beings are affected by the industrial revolution. With increasing environmental issues, water pollution is one of the major problems faced by the globe. Excess discharge of both domestic and industrial wastewater into the water bodies is anticipated to cause severe damage to the flora and fauna of the environment (Oualid et al., 2020). Among different water pollutants, the discharges from the textile industries are of major concern because of the presence of dyes in them. Considering the textile industry as one of the major contributors to water pollution, it is reported that for coloring 1 kg of cotton, approximately 70 L–150 L of water is required along with 40 L of dyes in their reactive forms. Moreover, about 80,000 metric tons of dyes are produced annually of which 2 g/L is wasted which is about 20–30 % of the total dye manufactured (Allègre et al., 2006). One such dye is crystal violet (CV) (C25H30N3Cl), also commonly known as gentian violet (MW: 407.98), belonging to the group of triaryl methane dyes (Mittal et al., 2010). It is a recalcitrant dye and stays in the environment for a long time. It has many functions in different fields including medicine, industry, biological laboratories, and others (Mittal et al., 2010). The immense use of CV in multiple industries has raised concerns over its toxicity (Al-Shahrani, 2020). With regards to health, CV is a well-known potential carcinogenic, mutagenic, and irritant compound with the ability to affect the endocrine system (Al-Shahrani, 2020; Nandhini et al., 2019; Roy et al., 2018; Sharma et al., 2018). Once the effluent with CV is discharged into water, smaller aquatic living organisms being sensitive are exposed to the hazardous CV. These smaller organisms are then targeted by higher organisms where the CV bioaccumulate. In this way, the dye reaches the next trophic level and ends up affecting human and other animal health (Lellis et al., 2019). Moreover, CV decreases the photosynthetic activities of the plants in the aquatic environment by inhibiting the light passing through it. Prevention or decrease of light penetration in water bodies highly affect the productivity of aquatic plants whereas in soil, it decreases the germination percentage of the seeds as well as the growth of the plants (Mani & Bharagava, 2016).
To tackle the global issue of water scarcity and improve water quality, different technologies are introduced and implemented. They are membrane filtration (Wang et al., 2021), chemical oxidation (Jana et al., 2010), electro-coagulation (Ghosh et al., 2008), electrochemical (El Brychy et al., 2021), and ion exchange (Xu et al., 2016). Almost all the mentioned technologies have drawbacks that include but are not limited to the use of unsafe chemicals, the generation of toxic by-products, high cost, and time-consuming (Laskar & Kumar, 2022). Other innovative techniques such as the adsorbents are currently utilized and have advantages over other conventional methods such as cost efficiency and a relatively easier system to develop (Prasetyo et al., 2022).
Seaweeds or marine macroalgae are multicellular protists and are found in the benthic zone. They resemble plants and attach themselves to different surfaces like rocks, aquatic plants, and other species (Bhuyar et al., 2020). They can produce many secondary compounds or metabolites that are rich in carrying out enormous biological activities. Seaweeds are commercially significant and are harvested in large amounts (32,000 tonnes wet weight) to meet the demand globally (Ponnuchamy & Jacob, 2016). Marine macroalgae can be helpful in removing pollutants because of their complex cell wall, which is composed of gelatinous polysaccharides and carboxyl groups. Similarly, marine macroalgae can survive in extreme environments with high temperatures, salinity, acidity, and so on. Their survival in such extreme conditions is mainly due to their ability to produce biologically significant metabolites. The use of algal biomass directly is not very efficient due to its smaller size, lower density, nature of material and other properties. To enhance the use of algae for treating wastewater, it is recommended to modify it (Buhani et al., 2021; Guler et al., 2016). Furthermore, the surface modification tends to activate the algal biomass by producing a porous microstructure, hence, increasing the surface area and accessibility to the chemical bonds of the algae (M’sakni & Alsufyani, 2021). In this study, seaweed Hormophysa triquetra (HT) and its Ag-modified form (AgHT) will be used as a biosorbent for the removal of CV from synthetic and real wastewater considering different experimental conditions including pH, temperature, and concentration of CV. To the best of our knowledge, this is the first study in Qatar where macroalgae are collected from the Qatari coast and are used in wastewater treatment. In this study, adsorbents from the collected macroalgae are made and used for the removal of CV from synthetic and real waste water. This study investigates the use of naturally abundant and available macroalgae as an eco-friendly and successful green technology for the removal of crystal violet from real wastewater.
2 Materials and methodology
2.1 Materials
Potassium hydroxide (KOH) (99.9 %) and sodium hydroxide (NaOH) (99.9 %) were purchased from Research-Lab Fine Chem Industries, India. Silver nitrate (AgNO3) (99.9 %) and 37% hydrochloric acid (HCl) (99.9 %) were purchased from Pharmpur, Scharlau, Spain. CV (99.9 %) was purchased from Merck, Germany.
2.2 Methodology
2.2.1 Sample collection and drying
The macroalgae were collected from Al-Thakira 25° 44′ 3.12″ N, 51° 32′ 35.52″ E and washed with seawater. After washing, it was packed in a thermocol box with ice and was transferred to the lab. In the lab, the samples were washed with distilled water and then with Milli-Q water thrice to remove any debris or unwanted material. After washing, the samples were dried in an oven (Nabertherm, Germany) at 22 ○C. After successful drying, the samples were ground with a blender and then ground to nano-size using Planetary Ball-Mill (Nanbei Instrument Limited, China) at 870 rpm for 24 h as shown in Fig. 1(A).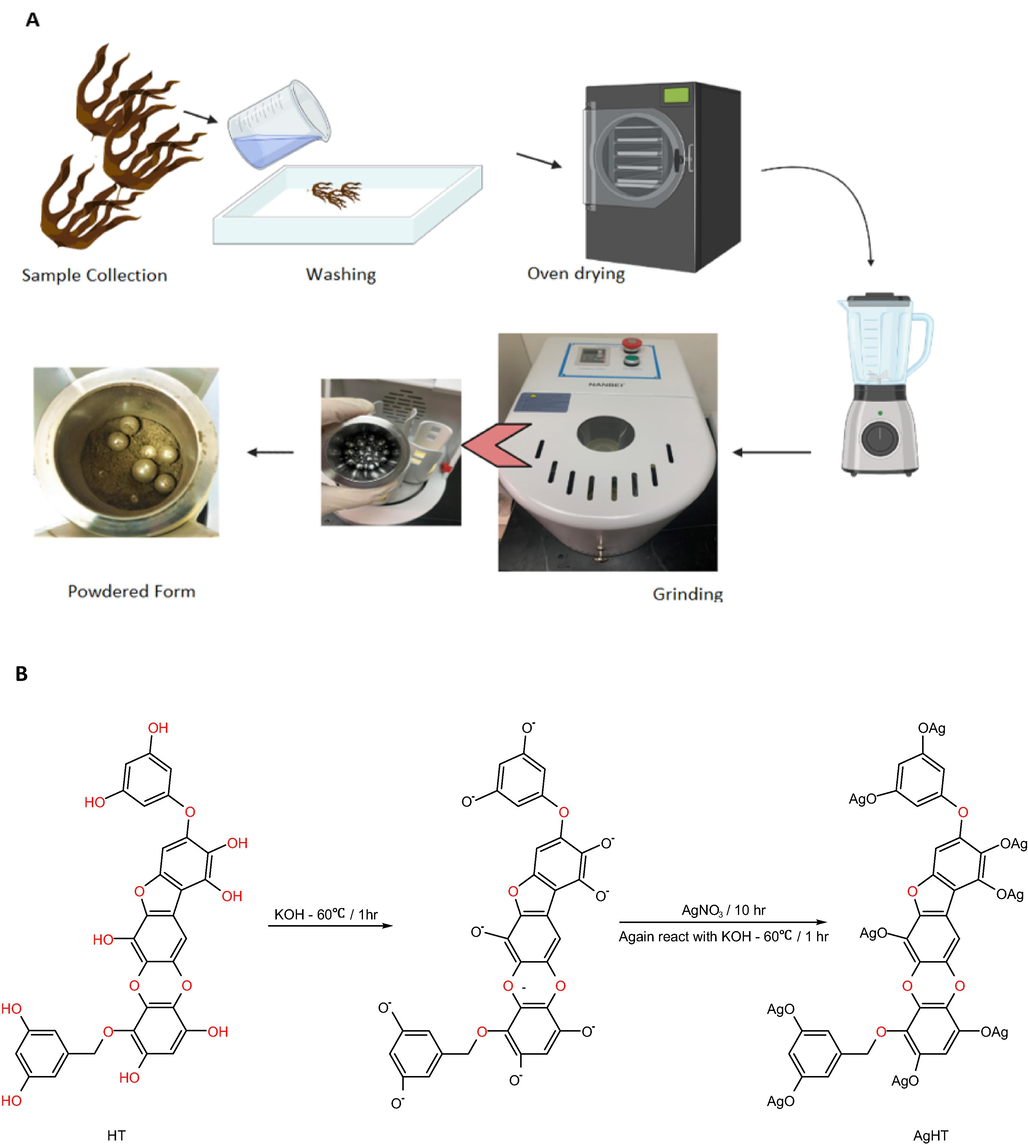
(A) Post-sampling washing and grinding of HT, and (B) Reaction of AgNO3 with HT to synthesize AgHT.
2.2.2 Modification of dried H. triquetra (HT) using AgNO3 (AgHT)
Dried 10 g of H. triquetra was reacted with 1 g of KOH dissolved in 100 mL of distilled water. The mixture was incubated at 60 ○C for 1 h. After 1 h, the resulting solid was reacted with 1.698 g of AgNO3 and was incubated at 60 ○C for 10 h. Further, the pellet was mixed with 1 g of KOH dissolved in 100 mL of distilled water at 60 ○C for 10 h. After completion of incubation, the pellet was washed with distilled water until the pH was neutral. Finally, the pellets were dried at 105 ○C in the oven (Alhaddad et al., 2021). The process is summarized in Fig. 1(B).
2.2.3 Preparation of synthetic CV stock preparation
A stock solution of CV was prepared with a concentration of 100 ppm by dissolving 0.1 g of CV in 1000 mL of distilled water. Furthermore, a standard calibration curve was made with different sample concentrations that were prepared by diluting stock solution (Blank, 1, 2, 3, 4, 5, 6, 7, 8, 9, 10) mg/L. Ultraviolet–visible (UV–Vis) spectrophotometer (JENWAY, Illinois, USA) was used to measure the concentration of the samples at the wavelength of 591 nm (Al-Ajji & Al-Ghouti, 2021).
2.2.4 Batch experiments
Batch experiments were performed in duplicates in 100 mL bottles. The effect of both HT and AgHT was tested on different parameters. To every 20 mL of CV, 0.02 g of adsorbents were added. First, the effect of pH (2, 4, 6, 8, and 10) was studied. The pH of the solution was set using 0.1 M HCl and 0.1 M NaOH respectively. The bottles were kept on a shaker (Brunswick Innova® 2100/2150, New Jersey, USA) for 24 h at 160 rpm. After 24 h, the mixture was filtered using a syringe filter (ISOLAB PES 0.45 µm), and the absorbance was measured at 591 nm using UV–Vis spectroscopy. Further, after obtaining the desired pH, different concentrations of CV (10, 20, 30, 40, 50, 60, 70, 80, 90, and 100 mg/L) and temperatures (25 ○C, 35 ○C, and 45 ○C) were also tested. The data analysis was done by using the mean value of the two replicates. The following Eqs. (1) and (2) were used for data analysis.
2.2.5 Characterization of HT and AgHT
Characterization of HT and AgHT adsorbents was done using different techniques. Transmission electron microscopy (TEM) (Tecnai G2 TEM, TF20, FEI, Oregon, USA) and scanning electron microscopy with energy dispersive X-ray spectroscopy (SEM-EDX) (Nova™ Nano SEM 50 series, Oregon, USA) were used to study morphology, elemental composition, and other features of the adsorbents. Fourier transform infrared spectroscopy (FTIR) (SHIMADZU-IRSpirit, Germany) between the range 400 cm−1 to 4000 cm−1 was used to analyze the functional groups present on the surface of HT and AgHT. Brunauer-Emmett-Teller (BET) (Quantachrome Corporation, Nova 3000, Oregon, US) was used to determine the surface area of the samples. Carbon, hydrogen, and nitrogen (CHN) analyses were done using an elemental analyzer (Flash 2000, ThermoFisher, Massachusetts, USA) to obtain their percentages in each adsorbent. Zeta potential (ζ-potential) measurements were done using Zetasizer Nano ZSP, Malvern, UK) to analyze the charges on the adsorbents at different pH ranges (2, 4, 6, 8, and 10) in water.
2.2.6 Adsorption isotherms
The relationship between the concentration of adsorbents adsorbed on the adsorbent and the concentration of the adsorbate in the liquid/dissolved at equilibrium (Panahi et al., 2020) is obtained by using adsorption isotherms. The isotherm curves provide information about the retention capacity of the target adsorbent. These models are used to study the adsorbate movement from liquid to solid medium at a particular temperature and pH. The details of adsorption isotherms used in this experiment are shown in Table 1.
Model
Linear and Non-linear equations
Details
Reference
Freundlich
and
= Amount of adsorbate adsorbed per gram of adsorbent at equilibrium (mg/g),
= Freundlich constant for adsorption capacity ((mg/g)(L/g)n),
= Freundlich constant for intensity,
= Concentration of adsorbate at equilibrium (mg/L),
adsorption intensity(Dabhade et al., 2009)
Langmuir
=
+
and
=
= Concentration of adsorbate at equilibrium (mg/L),
= Amount of adsorbate adsorbed per gram of adsorbent at equilibrium (mg/g),
= Langmuir constant for the rate of adsorption (L/mg).
= maximum adsorption capacity (mg/g)(Nwabanne & Mordi, 2009)
Dubinin-Radushkevich (D-R)
=
-
and
=
= D-R constant for adsorption capacity (mg/g),
= constant for the mean of adsorption free energy (mol2/kJ2),
= Amount of adsorbate adsorbed per gram of adsorbent at equilibrium (mg/g),
KD = adsorption energy constant,
ε = D-R isotherm constant
ε=
,(Chen & Yao, 2015)
Temkin
+
R = gas constant (8.314 J/mol.k),
T = absolute temperature
= Temkin constant for the heat of adsorption (J/mol),
= Temkin binding constant at equilibrium (L/g),
= Concentration of adsorbate at equilibrium (mg/L)(Dada et al., 2021)
2.2.7 Adsorption thermodynamics of CV
Thermodynamic parameters that include enthalpy change (ΔΗ◦), entropy change (ΔS◦), and Gibbs free energy (ΔG◦) along with the temperature (K) effect were determined to understand the spontaneity of the processes. The reaction tends to be spontaneous if the process has a negative value for ΔG◦ at a given temperature. The parameters were calculated based on the following Eqs. (3)–(5):
2.2.8 Desorption studies
Desorption of saturated adsorbents HT and AgHT were done using three desorption agents: 0.1 M NaOH, 0.1 M HCl, and 70 % Ethanol. Spent adsorbents weighing 0.02 g in 20 mL of each of the desorption agents were kept in a shaker for 24 h at 160 rpm. The recovery of CV was then calculated in percentage (%).
3 Results and discussion
3.1 Characterization of HT and AgHT
Fig. 2 shows TEM analysis of the HT and AgHT showed distinct differences at different magnifications: 100 nm, 50 nm, 10 nm, and 5 nm respectively. The Ag-modified TEM pictures show spherical Ag-NPs (circled red). On the other hand, there is no specific shape seen in the non-modified H. triquetra, which confirms the success of the modification and synthesis of NPs. The spherical shape is an indicator of the capping and stabilization phenomenon during the synthesis of nanoparticles. Most stable macroalgae-derived NPs are reported to have a spherical shape (76%), followed by an oval shape (14%), then hexagonal (6%), or triangular (4%) correspondingly (Sahayaraj et al., 2019; Trivedi et al., 2021). The SEM analysis of HT and AgHT is shown in Fig. 3(A) with evident differences at two magnifications (25,000× and 10,000×). The major difference between them is the irregular and rough surface of HT as compared with AgHT, which appears to be smooth, rod-like, prominent trapezoid and rhomboid-shaped structures concentrated at one region as indicated with red arrows.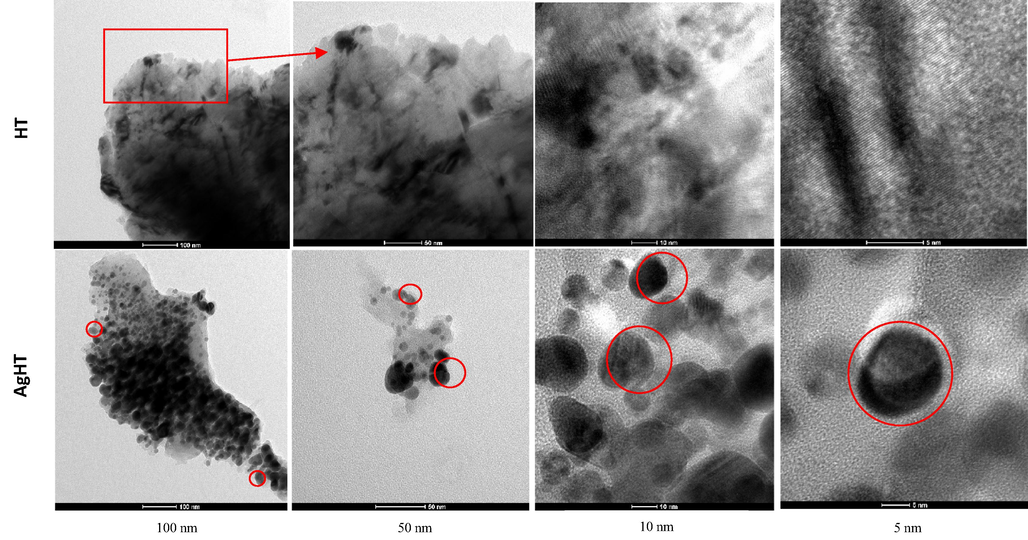
TEM analysis of HT (top) and AgHT (bottom). Magnification (left to right): 100 nm, 50 nm, 10 nm, and 5 nm.
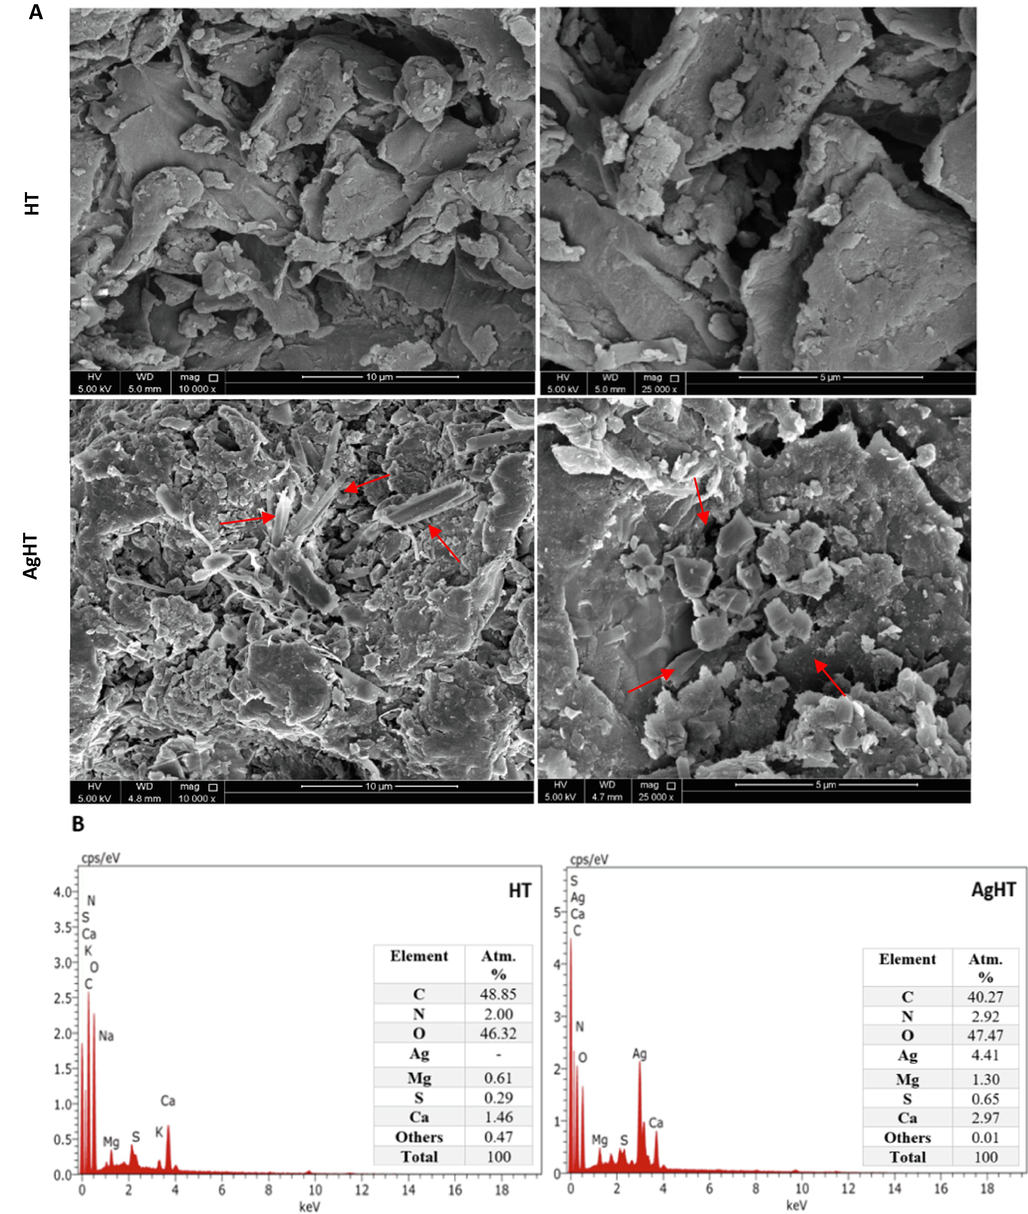
(A) SEM images of HT (top) and AgHT (Bottom), and (B) EDX of HT (left) and AgHT (right).
EDX analysis and the atomic percentages (%) of the elements found are shown in Fig. 3(B) shows a strong peak at 3 keV which confirms the presence of Ag elements in the modified adsorbent. Our results are further confirmed by comparing with other studies where a similar strong peak indicating the presence of Ag elements in the modified adsorbent is found (Hashemi & Hadi Givianrad, 2018; Kaidi et al., 2021; Kannan et al., 2013; Vijayan et al., 2014).
BET analysis showed that the surface area of HT is 3.977 m2/g and a single point total pore volume of 0.009864 cm3/g. For AgHT, the surface area was reduced to 2.751 m2/g with a single point total pore volume of 0.005922 cm3/g. It is evident from the results that the surface area and pore volume reduced which could be attributed to an effect of the modification. The nitrogen adsorption isotherms and the pore size distribution curves are shown in Fig. 4. These characteristics play a vital role in determining the adsorption phenomenon (Al-Ajji & Al-Ghouti, 2021). Similarly, as reported in another study, a sharp dip in the surface area of silica-based adsorbents is due to functionalization processes post-surface modification (Manyangadze et al., 2020).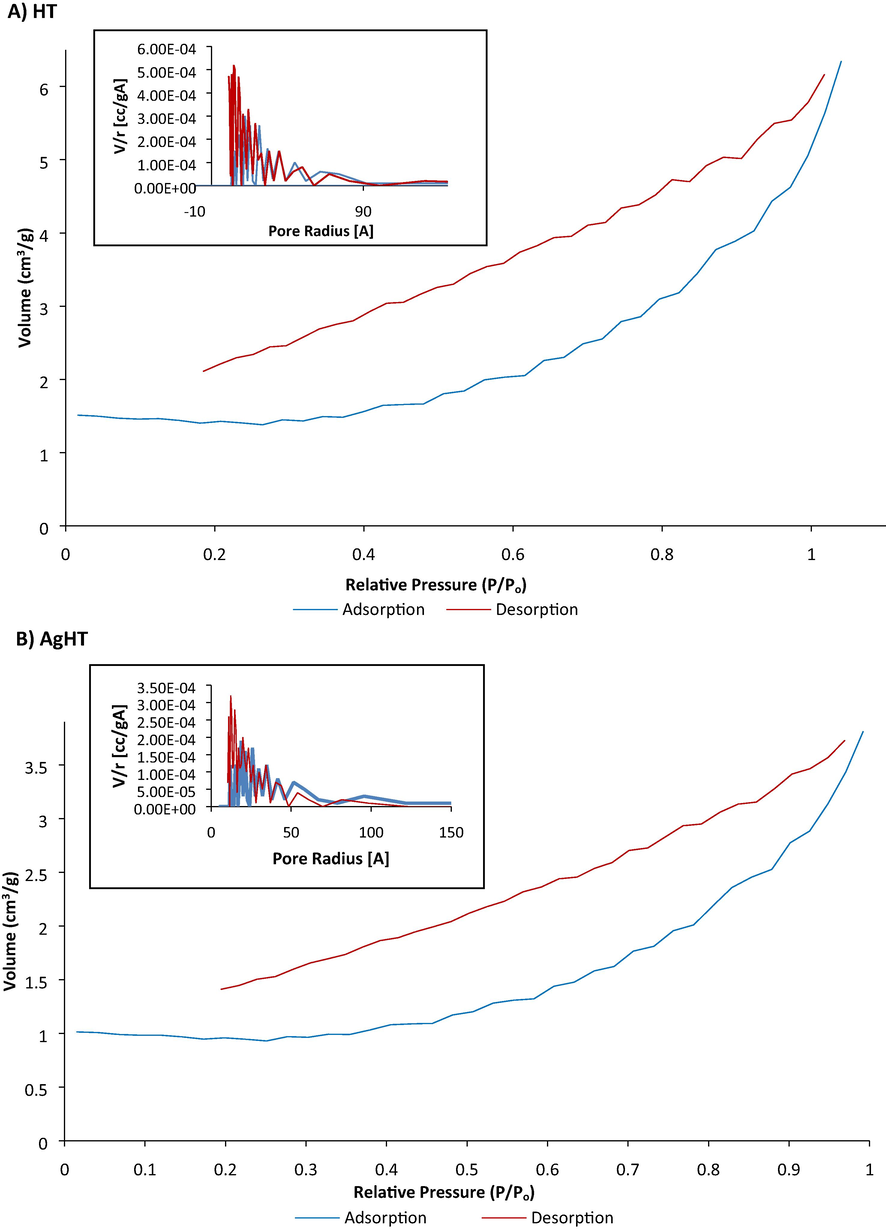
BET analysis of nitrogen adsorption and desorption isotherms and pore-size distribution curves (inserted graphs top left). (A) HT (top) and (B) AgHT (bottom).
Fig. 5 shows FTIR analysis with peaks at 666 cm−1, 816 cm−1, 1020 cm−1, 1030 cm−1, 1160 cm−1, 1419 cm−1, 1600 cm−1, 2366 cm−1, 2911 cm−1, 3187 cm−1, 3338 cm−1, and 3642 cm−1. The peaks observed in the FTIR analysis of the HT and AgHT adsorbent showed the presence of different functional groups. The peaks at different wavelengths are due to C—C ring deformation, C—C ring stretching, C—N stretching, C—H bond deformation, C⚌O stretching, CONH stretching, C≡C stretching, and O—H stretching. Moreover, peaks for spent HT and spent AgHT are also shown in the graph along with pure CV peaks. It is evident that both HT and AgHT were successful in adsorbing CV from the solution based on the comparison of the peaks of spent HT, spent AgHT, and CV. The peaks and the related functional groups as well as their presence and absence in HT, AgHT, spent HT, and spent AgHT are mentioned in Table 2.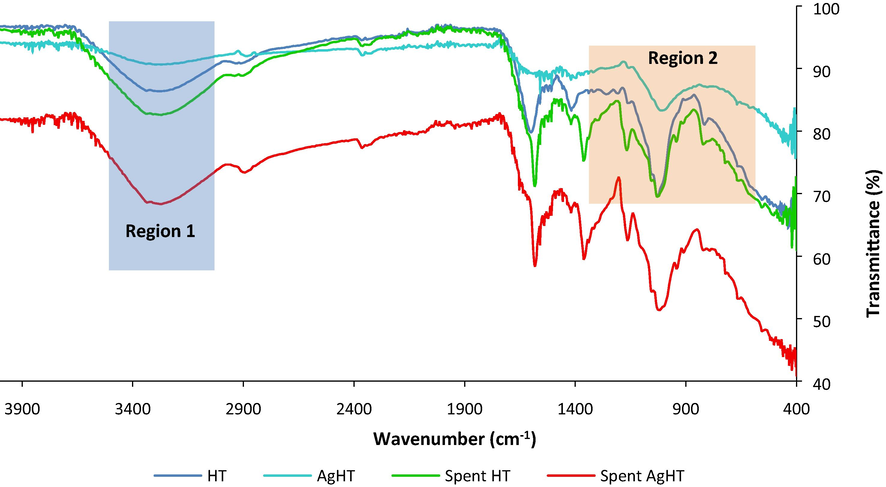
FTIR spectra of HT, AgHT, spent HT and spent AgHT.
Frequency
(cm−1)
Functional
Groups
HT
AgHT
Spent HT
Spent AgHT
666
C—C ring deformation/⚌C—H
Small peak
Small peak
Absent
Absent
816
C—C ring stretching
Sharp peak
Absent
Sharp peak
Small peak
1020
C—H deformation/-C—O—C
Moderate broadband
Weak broadband
Absent
Absent
1030
C—N stretching
Sharp peak
Absent
Sharp peak
Sharp peak
1160
C—O stretching
Small sharp peaks
Small sharp peak
Deep small peak
Deep small peak
1419
C—H deformation, C—N stretching
Single sharp peak
Absent
Very small peak
Very small peak
1600
C—C stretching/C⚌O/CONH, N—H
Single sharp peak
Small peak
Absent
Absent
2366
C≡C stretching
Small peak
Small peak
Small peak
Small peak
2911
C—H stretching
Small broadband
Small peak
Small broadband
Small broadband
3187
O—H stretching
Strong broadband
Weak broadband
Strong broadband
Strong broadband
3338
O—H stretching
3500
N—H stretching
Strong slope
Weak
Strong slope
Strong slope
3642
O—H stretching
Small peak
Small peak
Small peak
Small peak
Region 1 in Fig. 5 shows the O—H stretching which is very deep and broad in spent AgHT as compared to others thereby proving its involvement in the adsorption of CV. Region 2 shows the differences between the peaks of HT and AgHT, which corresponds to different functional groups with the C—C ring. C—H stretching, COO group, CN bond, and CONH group. The absence of peaks for C—C, C—N stretching, and C—H deformation indicates that these functional groups are involved in reactions leading to modification. Similarly, the decrease in intensity of peaks of some functional groups in AgHT is also indicative of the involvement of those functional groups in the functionalization process. For instance, the reduction of peak size at 1600.42 cm−1 in AgHT as compared to HT affirms the role of secondary amines in the process of functionalization. Almost similar functional groups and stretching vibrations of bonds such as O—H, C≡C, C—N, and C—O are reported to be present and involved in the synthesis and stabilization of AgNPs from macroalgae (Shao et al., 2018). On the other hand, the spent HT and spent AgHT FTIR spectrums showed slight differences when compared with the adsorbents before using them for CV treatment. In both the spent adsorbents, peaks at 666.13 cm−1, 1019.87 cm−1, and 1600.42 cm−1 were absent from their original position indicating a shift of peaks. It is highly likely that the functional groups associated with those peaks were involved in the removal of CV from the solution. Other peaks also showed differences in intensity and depth such as peaks at 815.90 cm−1, 1159.66 cm−1, and 3337.77 cm−1 respectively. A closer look at the peaks of spent HT and spent AgHT showed a similarity in peaks specifically at 1146.82 cm−1, 1346.52 cm−1, and 1566.18 cm−1, thereby confirming the adsorption of CV on the adsorbents. It is reported in the literature that the C, N, and ring structures of CV have peaks at 1170 cm−1, 1350 cm−1, and 1590 cm−1 correspondingly (Rytwo et al., 2015; Sulthana et al., 2022). The ζ-potential analysis of HT and AgHT is shown in Fig. 6.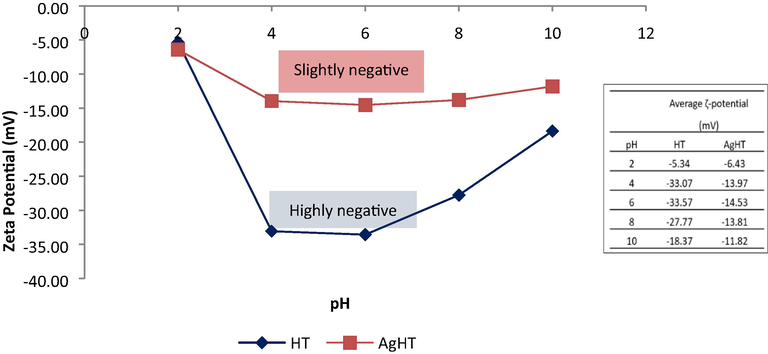
Zeta potential (ζ-potential) (mV) of HT and AgHT at pH 2, 4, 6, 8, and 10.
The ζ-potential analysis shows that both HT and AgHT at all pH (2, 4, 6, 8, 10) have negative values indicating net negative surface charge due to which the isoelectric point could not be determined, and thus the pHpzc was not determined too (Bakatula et al., 2018). The surface charges on the adsorbent can be affected by the pH of the solution. A negative surface charge can be suppressed by introducing H+ ions, which occurs with a decrease in pH. Similarly, a positive surface charge can be suppressed by introducing OH− ions, which happens when the pH is increased. ζ -potential indicates the stability of the system, if the values are greater than −30 mV, the system behaves as strongly cationic. On the other hand, if the values are less than +30 mV, the system tends to be strongly anionic (Clogston & Patri, 2011). Smaller values of ζ-potential between +5 mV to −5 mV signify an unstable system (Ostolska & Wis̈niewska, 2014). Considering the ζ-potential values of HT and AgHT, it can be seen in Fig. 6, the system appears to be stable throughout the pH range with values ranging between −5.34 to −18.37 for HT and −6.43 to −11.82 for AgHT. Moreover, the charge density of HT is more as compared to AgHT, which indicates that there is less interaction through electrostatic bonds, and most of the interaction is by other bond types such as n → π, π-to-π, hydrophobic, and hydrogen bonds.
The elemental CHN percentages help in determining the composition of the macroalgae in terms of the presence of carbohydrates, proteins, and lipids, however, the values vary in each type of macroalgae. The percentage differences are not very high and fall in a range between 22 % and 36 % for C, 3.5 % to 6 % for H, and 0.5 % to 2.8 % for N as reported in Table 3. There are many factors, which affect the elemental percentages and the overall composition of the seaweeds. Some of the factors are the environmental parameters (habitat, temperature, and seawater salinity), the productivity rate of the seaweeds, and the genetic diversity (Biris-Dorhoi et al., 2020). In our study, we compared the elemental CHN of HT (CHN (%): 35.64, 5.77, 1.07) and AgHT (CHN (%): 26.97, 4.17, 0.79). There is a decrease in percentages of all three elements, which could be due to the reaction of macroalgae with Ag. There is a possibility that the Ag is bonded with functional groups containing N, C, and H, thereby decreasing their percentages.
Sample
C %
H %
N %
References
Caulerpa lentifilla
35.76
3.63
2.71
(Ong et al., 2019)
Gracillaria coronopifolia
23.08
4.01
1.76
Chaetomorpha linum
27.81
5.69
3.19
Ulva rigida
22.74
4.61
0.63
(Shomron et al., 2022)
Sargassum sp.
34.1
3.90
1.30
(Maciej et al., 2012)
Sargassum thunbergi
32.38
5.4
4.9
(Yang et al., 2021)
Mastocarpus stellatus
33.5
6
5.49
HT
35.64
5.77
1.07
This study
AgHT
26.97
4.17
0.79
3.2 Effect of pH
The pH of the system did not affect the adsorption process significantly as shown in Fig. 7(A). For HT, the maximum removal of CV was 99.90 % at pH 4 while the maximum removal of CV for AgHT was 98.97 % at pH 2. For both the adsorbents, the adsorption of CV at other pH values was also not significantly different with all the removal percentages higher than 99% and 97% for HT and AgHT respectively. Considering the cost related to the experimental analysis and minimum pH modification of the solutions, pH 6 was selected as the optimum pH for the experiments.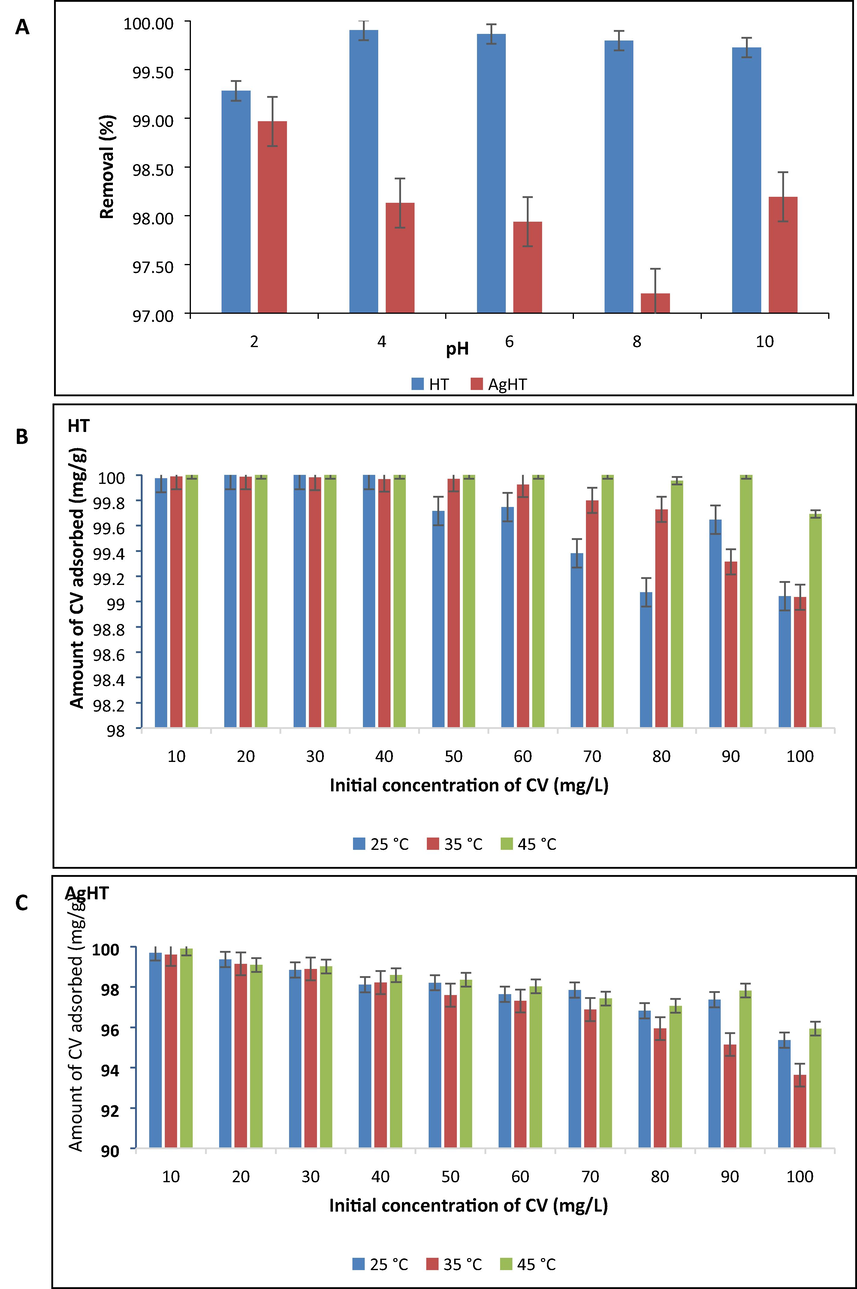
(A) Effect of different pH on adsorption capacities of HT and AgHT. Exp. Conditions: CV initial concentration: 100 mg/L; Mass of adsorbents: 0.02 g, Volume of adsorbate CV: 20 mL, Incubation time: 24 h, and Temperature: 25 ○C. Duplicates ± SE. (B-C) Effect of different temperatures on adsorption of CV on HT and AgHT. Exp. Conditions: CV concentration range from 0 mg/L to 100 mg/L. Mass of adsorbent: 0.02 g, Volume of adsorbate CV: 20 mL, Contact time: 24 h, pH: 6.
CV is a cationic dye and is readily adsorbed on surfaces that have negative charges. Hence, an increase in pH would create a basic environment, thus, promoting the adsorption of CV over the adsorbent (Sharbaf Moghadas et al., 2020). When the pH is low, the environment is acidic in nature, meaning that the number of H+ ions is more as compared to the negative charges; hence, the surface of the seaweed gets protonated, thereby reducing the available negative sites for binding of cationic CV. On the other hand, with an increase in pH, the H+ ions tend to decrease, and the surface charge of the seaweed becomes negative, allowing the CV to bind (Jegan et al., 2016). The point of zero charges (pHpzc) plays a critical role in determining the interaction between adsorbent and adsorbate. It is reported that if the pH of the solution is less than the pHpzc (pH < pHpzc), the net charge on the biomass would be positive, which eventually decreases negative binding sites hence, low interaction and electrostatic binding between the pollutant and the biosorbent (El Haddad et al., 2012). In cases where pH > pHpzc, the net charge on biomass is negative, making an excess of negative binding sites available for the cationic pollutant to bind, consequently, higher interaction and electrostatic bonds will be formed. Theoretically, in our case, it can be assumed that the pH of the solution exceeds the pHpzc, thereby allowing maximum interaction between adsorbate and adsorbent. However, validation was done through a ζ-potential analysis where the isoelectric point will help in determining pHpzc.
It can be seen in the Table. 4 that each of the studies has different experimental conditions including the modification of biomass, temperature, pH, and adsorbate concentration. All these factors play a role in determining the adsorption capacity, some being favored by low temperature while some by high temperature.
Macroalgae
Modification
Adsorption capacity
(mg/g)
Experimental Conditions
(Temp (○C), pH)
Adsorbate, Adsorbate Concentration (mg/L)
Adsorption Isotherm Model
References
Sargassum muticum
Ag
ND
26.5, ND
MB, 20
ND
(Trivedi et al., 2021)
Fucus vesiculosus
None
166.66
45, 4
RB, 100
Langmuir
(Yadav et al., 2022)
200
45, 8
MB, 100
Codium decorticatum
None
278.46
ND, 11.8
CV, 20
Langmuir
(Oualid et al., 2020)
191.01
ND, 2.1
CR, 20
Ulva lactuca L
None
0.294
29.85–44.85, 7
Basic dye/ND
Langmuir
(Tahir et al., 2010)
Gracilaria edulis
None
181.0
ND, 8
CR, 100
SIPS (Langmuir-Freundlich)
(Jegan et al., 2016)
Kappaphycus alvarezii
None
171.9
HT
None
181.8
35, 6
CV, 100
Langmuir
This study
AgHT
Ag
312.5
3.3 Effect of temperature on initial concentrations of CV
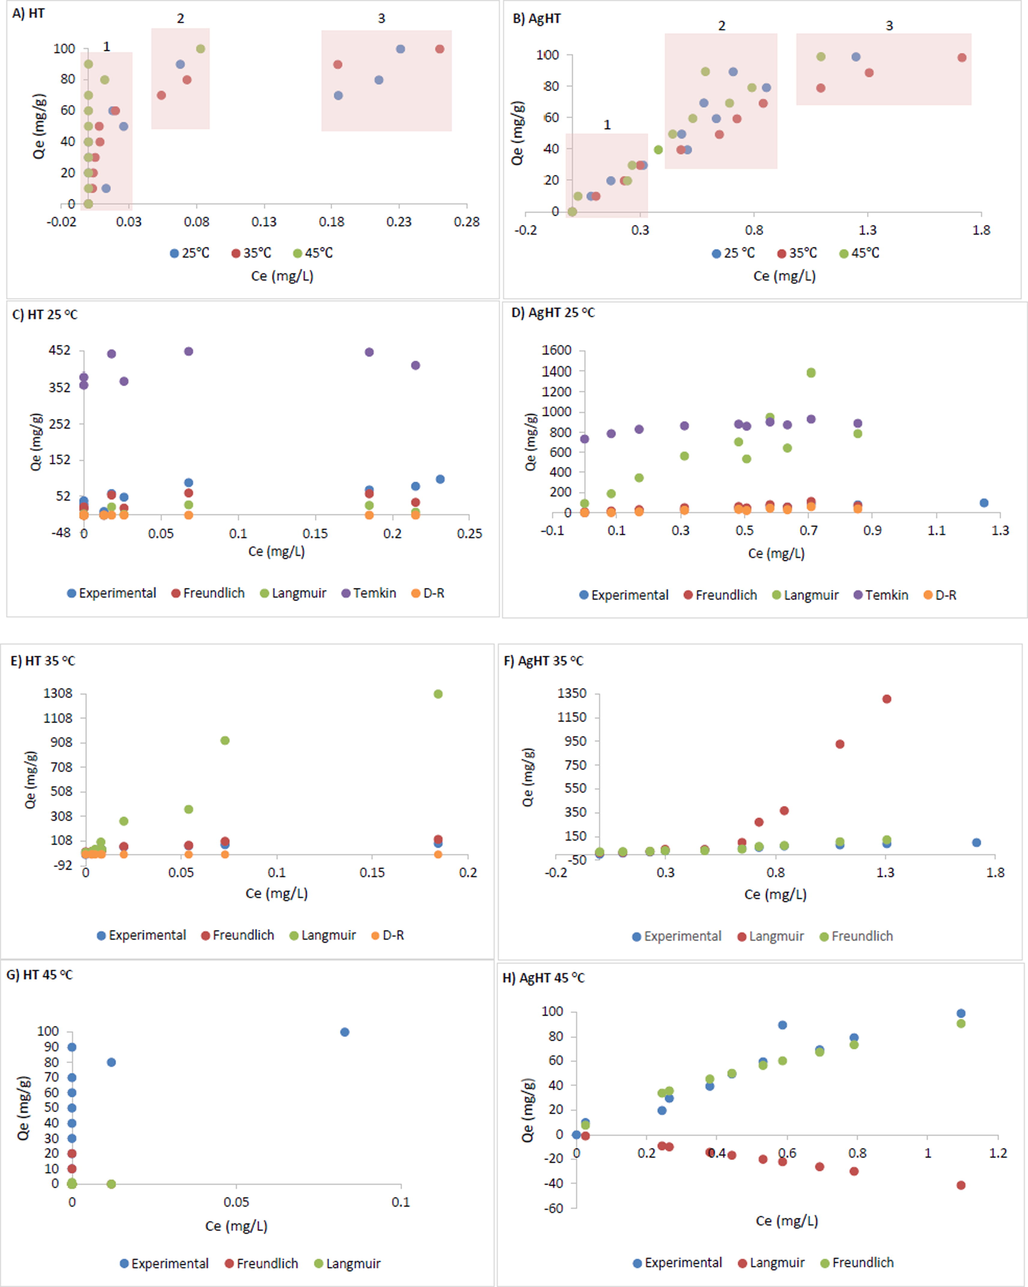
The highest percentage removal of the dye was obtained at a temperature of 45 ○C for both HT and AgHT adsorbents. All the concentrations of the dye were efficiently removed at this temperature except 100 ppm. However, at 25 ○C and 35 ○C, the differences between adsorbed CV are not significant except for concentrations of 70 mg/L, 80 mg/L, and 90 mg/L with the removal of 99.38 %, 99.07 %, and 99.65 % for HT and 99.8 %, 99.7 %, and 99.31 % for AgHT adsorbent. These removal percentages are not low but make a significant difference when compared to each other. Similarly, the removal percentages are not significant between 25 ○C 35 ○C, and 45 ○C till 60 mg/L whereas the higher concentrations showed a significant difference between the 3 tested temperatures as shown in Fig. 7(B-C). The same trend was observed for the AgHT adsorbent. The adsorption capacities increased with an increasing temperature from 25 ○C to 35 ○C and then to 45 ○C. Almost all the concentrations were removed with removal starting from 90%. For concentration of 90 mg/L and 100 mg/L, the removal is almost the same at 25 ○C (97.37%, 97.82%) and 45 ○C (95.36 %, 95.93 %) but are significantly greater than removal at 35 ○C (95.14%, 93.63%).
When the adsorption capacities increase with temperature, the adsorption reaction is considered as endothermic (Al-Ghouti & Al-Absi, 2020). A similar reaction was observed in a study where the dye CV was removed using a brown algae Laminaria japonica (Wang et al., 2008). Moreover, another study also showed similar results where green algae Codium decorticatum adsorbed CV in an endothermic process (Oualid et al., 2020).
3.4 Adsorption mechanisms
The mechanism governing the reaction between the pollutant and the adsorbents is controlled by different factors including but not limited to the functional and structural characteristics, pH, particle size, and surface charges. CV being a cationic dye will be adsorbed onto negatively charged sites on the surface of the adsorbate. Macroalgae are rich in compounds such as polysaccharides, phenols, terpenoids, fatty acids, carotenoid, polyols, and many more which plays a major role in adsorption processes by providing a variety of binding sites (Anwar et al., 2021; Mahmood Ansari et al., 2021; Ruiz et al., 2017).
The adsorption mechanism of CV onto HT and AgHT is composed of specific interaction types that include electrostatic interactions, hydrogen bonding, hydrophobic, n → π interactions, and π to π stacking (Fig. 8(A)). The presence of conjugated electrons in CV is significant because of which the CV is successfully adsorbed on the surface of macroalgae. The main functional groups contributing to the adsorption of CV on the adsorbents involve carboxyl, hydroxyl, carbonyl groups, and aromatic rings. Hydrogen bonds, also known as dipole–dipole hydrogen interactions are formed between the hydrogen from the hydroxyl groups donating hydrogen, with the nitrogen atoms of CV accepting the hydrogen (Dinh et al., 2019). Furthermore, n → π interactions are mainly developed between the electron-donating groups such as oxygen, and the electron-accepting groups such as aromatic rings (Newberry & Raines, 2017). Similarly, Ag present on the surface of the AgHT would bind with the benzene ring through Ag → π interaction (Maier et al., 2015). Hydrophobic interactions occur between the non-polar entities, in our case, between the rings of CV and macroalgae (Watrelot & Norton, 2020). Another interaction that involves the bonding of rings of adsorbent and adsorbate is through π to π stacking which is a type of non-covalent binding between the pi bonds of rings also known as orbital overlap (Chen et al., 2018). Lastly, electrostatic interactions happen between a negatively charged and a positively charged particle (Lim et al., 2021). Nitrogen being positively charged in CV results in bonding with different negatively charged groups like carboxyl, hydroxyl, and carbonyl.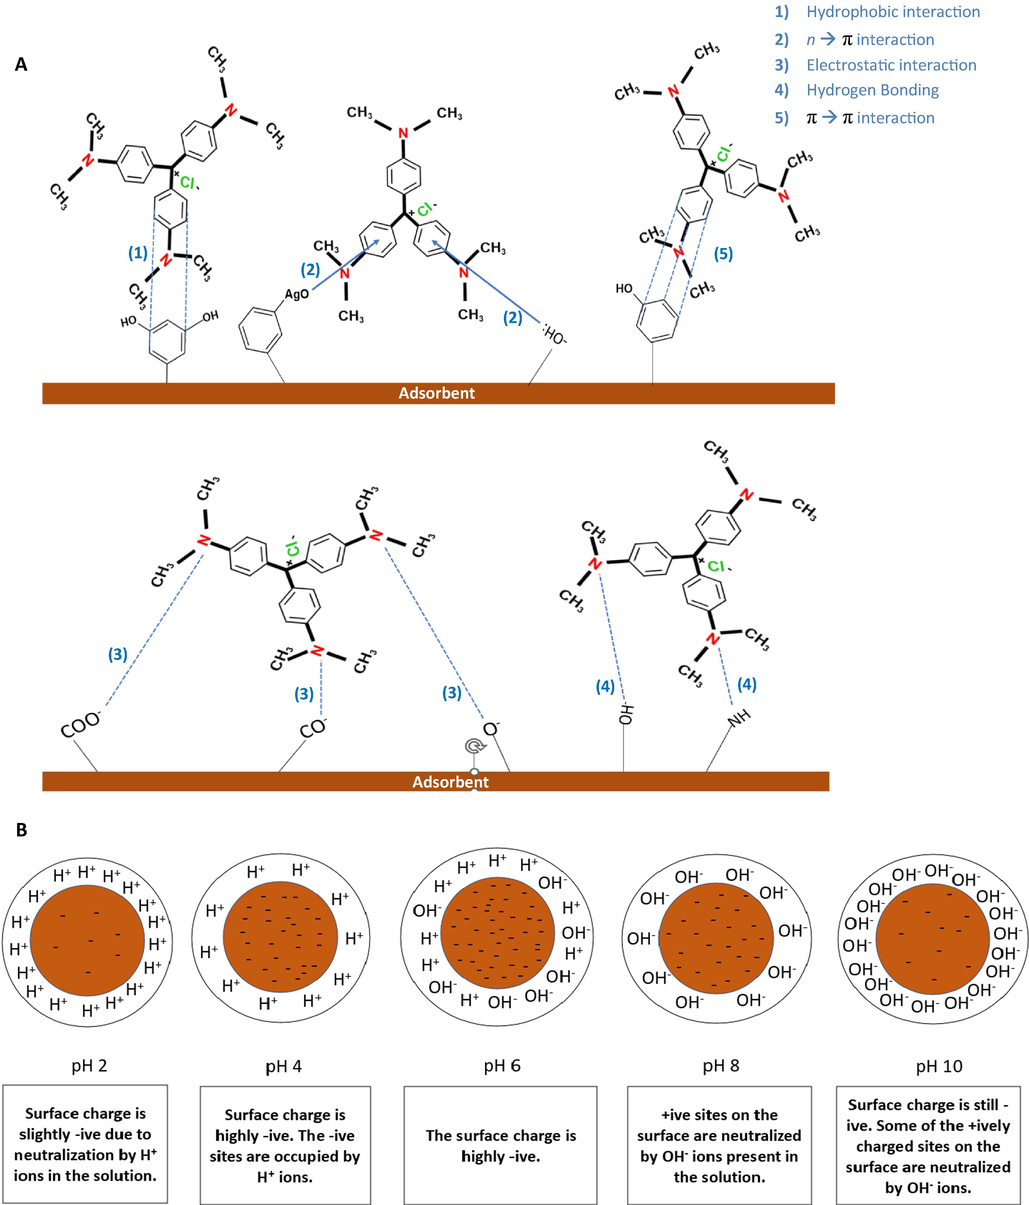
(A) Predicted interactions between macroalgae (HT and AgHT) and CV, and (B) Surface charge of macroalgae at pH range 2–10.
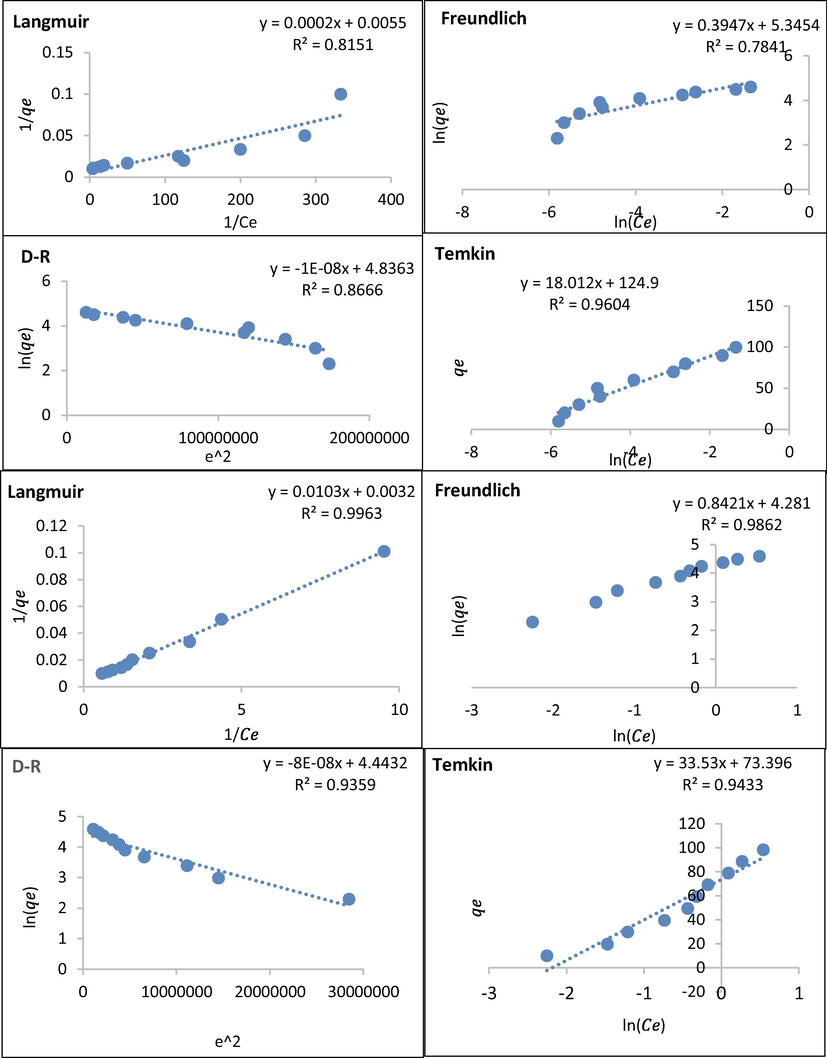
3.5 Adsorption isotherms and chi-square analysis (χ2)
Langmuir, Freundlich, Temkin, and Dubinin-Radushkevich (D-R) were all applied to find out, which is the best-fit model for the modified and non-modified adsorbents. Similarly, they were used to study the interaction between the adsorbent and the adsorbate. From Table 5(A) and Fig. 9, it is evident that the best-fit model for HT is Langmuir while AgHT fitted both Langmuir and Freundlich models. The R2 values of HT and AgHT for the Langmuir models are 0.75 and 0.98, respectively while the R2 value of AgHT for the Freundlich model is 0.95 correspondingly. Langmuir model indicates that the adsorption has occurred in monolayers (Liu et al., 2019) and the distribution of CV is homogenous on the available active sites of the adsorbent (Mohammadzadeh Kakhki et al., 2019). Moreover, the Langmuir model also provides a quantitative interpretation of the distribution of the solute phase between the solution and the adsorbent (Atugoda et al., 2021). The Freundlich isotherm model is indicative of the processes of adsorption that occur heterogeneously on the surfaces. Furthermore, the active sites of the adsorbent are exponentially distributed in Freundlich models (Ayawei et al., 2017). The adsorption capacity of HT increased from 90.09 mg/g to 181.8 mg/g when the temperature was changed from 25 ℃ to 35 ℃, however, upon further increase of temperature to 45 ℃, the adsorption capacity decreased to 0.25 mg/g. A similar trend was observed for AgHT where the adsorption capacity increased from 263.16 mg/g (25 ○C) to 312.5 mg/g (35 ○C) and then dipped to 250 mg/g (45 ○C). In Freundlich isotherm model for HT,
observed a similar trend for HT while AgHT had the lowest adsorption capacity at a temperature of 35 ℃, unlike others. The exponent n in Freundlich isotherm is indicative of the adsorption favorability, Generally, values of n have different ranges of 2–10, 1–2, and less than 1; indicating good, moderately difficult, and poor adsorption characteristics (Bibi et al., 2022). With an increase in temperatures (25 ○C−45 ○C), the n values of HT remained in the range of 2–10 hence, there was good adsorption whereas for AgHT the n values were in the range of 1–2 indicating moderate difficult adsorption characteristic. Similarly, 1/n can also be used to determine the favorability of adsorption with values less than 1 as an indicator of a favorable adsorption process (Mukherjee et al., 2019). Temkin isotherm model considers the effects of indirect interactions of adsorbate in the adsorption process (Ringot et al., 2007), however, our study, was not able to explain the adsorption process well due to a smaller correlation coefficient. The D-R isotherm model is considered to study adsorbate concentrations with intermediate ranges. This model assumes a multilayer process with weak Van Der Waal’s forces and is temperature dependent (Günay et al., 2007; Israel & Eduok, 2012). Like the Temkin isotherm model, the D-R model also had smaller correlation coefficients meaning that it was not able to explain the adsorption process. Recently for the best-fit adsorption isotherm model, nonlinear chi-square analysis is preferred over R2 (Hadi et al., 2012). In our study, we also used χ2 to further develop the best-fit adsorption isotherm model. Smaller χ2 values indicate that the experimental adsorption capacity were similar to the predicted or calculated values (Alshuiael & Al-Ghouti, 2022). The smallest values for HT were for Freundlich isotherm model with 235.88, 33.47, and 807.59 for 25 ℃, 35 ℃, and 45 ℃, consecutively (Table 5A), which could also be confirmed by the plots with experimental data and all the four isotherm models fitting at all the studied temperatures (Fig. 10C–H). Temkin isotherm model in Fig. 10 E, and Temkin and D-R isotherm models in Fig. 10F-H are not shown as they were not favorable to compare with the experimental value due to huge differences.
A
Adsorption isotherm models, parameters, and chi-square analysis for adsorption of CV onto HT and AgHT
Langmuir
Freundlich
HT
Temp (℃)
(mg/g)
b (L/mg)
Chi-Squareχ2
(mg/g)(L/g)n
n
Chi-Squareχ2
25
90.09
1.37
0.757
3355.48
119.02
2.2
0.45
0.6768
235.88
35
181.8
27.5
0.8151
2268.02
209.64
2.53
0.395
0.7841
33.47
45
0.257
10.85
1*
47554.21
48.80
2.79
0.358
1*
807.59
Temkin
Dubinin-Radushkevich (D-R)
Temp (℃)
(L/mg)
(J/mol)
Chi-Squareχ2
(mg/g)
Chi-Squareχ2
25
1.616 × 1033
79.114
0.6595
2029.89
75.56
−2 × 10-08
0.7326
ND
35
9.7 × 1052
18.012
0.9604
163286.72
126
−1 × 10-08
0.8666
ND
45
1
0
1*
ND**
28.38
−1 × 10-08
1*
ND**
Langmuir
Freundlich
AgHT
Temp (℃)
(mg/g)
b (L/mg)
Chi-Squareχ2
(mg/g)(L/g)n
n
Chi-Squareχ2
25
263.16
4.22
0.9892
5165.38
92.55
1.119
0.894
0.9575
14.05
35
312.5
0.31
0.9963
2268.02
72.31
1.187
0.842
0.9862
33.47
45
250
−0.15
0.9572
−2943.99
85.52
1.53
0.653
0.8799
23.74
Temkin
Dubinin-Radushkevich (D-R)
Temp (℃)
(L/mg)
(J/mol)
Chi-Squareχ2
(mg/g)
Chi-Squareχ2
25
1.45 × 1034
34.216
0.8393
7513.69
87
−7 × 10-08
0.8945
1720.93
35
2.24 × 1030
33.53
0.9433
163286.72
85.05
−8 × 10-08
0.9359
ND**
45
2.54 × 1032
23.56
0.6839
31286.83
66.87
−3 × 10-08
0.696
ND**
B
Thermodynamic parameters of CV adsorption onto HT and AgHT
Temp (K)
ΔG◦
ΔG◦ (kJ/mol)
ΔH(kJ/mol)
ΔS
(J/mol.K)
HT
298
0.0034
0.3148
−779.97
−0.78
78.87
−0.28
308
0.0032
3.3142
−8486.68
−8.49
318
0.0031
2.3842
−6303.38
−6.30
AgHT
298
0.0034
1.4398
−3567.30
−3.57
−55.13
0.18
308
0.0032
−1.1712
2999.06
3.00
318
0.0031
-***
–
–
Adsorption isotherm models of HT (top) and AgHT (bottom).
Plot between calculated adsorption capacity and equilibrium concentration for HT (A) and AgHT (B). Experimental adsorption capacity with different isotherm models for HT (C, E, and) and AgHT (D, F, and H). The plots were shown under all three temperatures (25 ○C, 35 ○C, and 45 ○C).
3.6 Adsorption thermodynamics
The thermodynamic parameters of CV adsorption onto HT and AgHT are shown in Table 5(B). All the values of ΔG◦ are negative for HT while for AgHT, at 298 K, it is negative and at 308 K it is positive. The value at 318 K for AgHT could not be obtained due to an undefined natural logarithm. The results indicate that the adsorption reaction is spontaneous with HT while the spontaneity decreases with an increase in temperature with AgHT. On the other hand, ΔH◦ is positive for HT (78.87 kJ/mol) and negative for AgHT (-55.13 kJ/mol) indicating that the reactions are endothermic for HT and exothermic for AgHT respectively. Based on different studies, ΔG◦ and ΔH◦ could also be used to indicate the type of adsorption process as it could either be dominated by physisorption or chemisorption. Physisorption happens due to molecular interactions such as the van de Waals forces, π-to-π interaction, and hydrogen bonding; all of them are formed due to the physical changes on the surface of the adsorbent that include surface area, pore volume, and the functional groups present on the surface. Chemisorption, on the other hand, occurs due to the electrostatic interactions between the adsorbent and the adsorbate (Wathukarage et al., 2019). Certain studies report that if the value of ΔG◦ is less than 18 kJ/mol then the reaction is happening through physisorption (Cantu et al., 2014) while some report it to be in a range between −20 kJ/mol to 0 kJ/mol (Bibi et al., 2022). In our study, depending on the values of ΔG◦, it can be said that the process is mainly dominated by physisorption. Considering ΔH◦ to determine the mode of the adsorption process, studies suggest that between −20 kJ/mol to 40 kJ/mol is physisorption while values between −400 kJ/mol and − 80 kJ/mol are chemisorption (Khan et al., 2010). In terms of ΔS◦, a positive value means that there is randomness at the interface of the solid–liquid, however, a negative value means that the state of randomness is no longer there and there is an increase in orders during the process. In our results, the adsorption process of CV on HT is random while the adsorption on AgHT is ordered. Considering the values of ΔG◦ for AgHT, the value moves from a highly negative to highly positive with an increase in temperature from 25 to 35 ◦C, while at 45 ◦C, the value was not determined. To evaluate and justify this abrupt change in ΔG◦, a plot between experimental adsorption capacity ( (mg/g)) and concentration at equilibrium ( (mg/L)) were developed for both HT and AgHT. For HT, as shown in Fig. 10A, the adsorption process appears to be monolayer based on the typical plateau (Fig. 10A (1)) except after the saturation of adsorbent occurs (Fig. 10A (2)), after which the molecules tend to adsorb in multilayers (Fig. 10A (3)). Langmuir isotherm model assumes the adsorption to be monolayer with homogeneous sites with constant adsorption energy and no interaction of adsorbed molecules laterally with others. On the other hand, AgHT undergoes similar 3 stages of adsorption with a linear relationship between maximum adsorption capacity and equilibrium concentration, however, the process is very clear as shown in Fig. 10B (1, 2, and 3). There is a clear difference between the adsorption with HT and AgHT, despite having similarities in stages of adsorption; the stages are prolonged in AgHT with saturation and multilayer adsorption being the lengthiest. The process could also be explained based on the surface modification with Ag leading to heterogeneity. The plot for AgHT also indicates the adsorption and desorption process at the same time. In the Freundlich isotherm model, the adsorption occurs on heterogeneous sites with non-uniform heat distribution and affinities (Kalam et al., 2021).
3.7 Desorption
Regeneration or reusability of the biosorbent was assessed concluding that the desorption of CV was achieved by two of the three tested desorption agents. Desorption of CV from HT was 99.84% with NaOH and 99.87% with HCl while desorption of the dye from AgHT was 99.99% with NaOH and 99.71 % with HCl (Fig. 11(A)). Ethanol did not desorb the dye successfully with 74.39% from HT and 58.05 % from AgHT respectively. Our study confirmed that the use of acidic and basic desorption agents reduced the electrostatic interactions between the adsorbent and the adsorbate thereby, regenerating the adsorbent (Sultana et al., 2022). Other studies validated the desorption of CV by 82 % with HCl as a desorption agent (Mirza & Ahmad, 2020).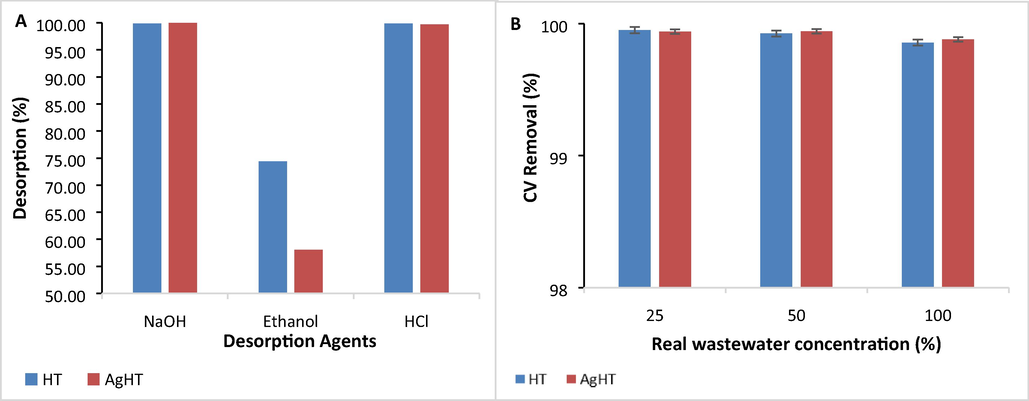
(A). Desorption of CV from HT and AgHT using NaOH, HCl, and Ethanol, and (B) Adsorption of CV from real wastewater onto HT and AgHT.
3.8 Effect on real wastewater
The capability of HT and AgHT was determined on real wastewater obtained from the laundry at three different concentrations (25%, 50%, and 100%). Both HT and AgHT successfully removed up to 99.85% and 99.88% of CV from wastewater consecutively Fig. 11(B). In other studies, cellulose was able to remove CV by 90.4 % while lignin removed up to 91.9 % of CV from real wastewater (Moawed et al., 2019).
4 Conclusion
In this study, the effect of surface modification of macroalgae was examined by the removal of CV from synthetic and real wastewater under different experimental conditions. Based on the analysis, it is concluded that both HT and AgHT are efficient in the removal of CV, however, after surface modification, AgHT removal capability improved. The optimum experimental conditions obtained were at pH 6 and a temperature of 35 ℃. The adsorption isotherm model based on R2 that best fitted in explaining the adsorption process and mechanisms was the Langmuir model, however, this conclusion was ruled out after doing χ2 analysis, which ensured that the best-fit model is the Freundlich isotherm model. Furthermore, thermodynamic studies revealed the spontaneous nature of HT while a non-spontaneous process for AgHT. Similarly, the process involving HT adsorbent was endothermic while AgHT was exothermic. Moreover, desorption studies showed that the adsorbent can be regenerated by using basic and acidic desorption agents indicating a cost-effective and low-waste adsorbent, which can highly be opted for the removal of CV from wastewater. This study proves the use of naturally abundant and available macroalgae as an eco-friendly and successful green technology for the removal of crystal violet from real wastewater.
Acknowledgment
This paper was made possible by Qatar University graduate assistantship program. This paper was also made possible by UREP grant # (29-147-1-034) from the Qatar national research fund (a member of Qatar Foundation). The statements made herein are solely the responsibility of the author(s). The FTIR, SEM, and TEM analyses were accomplished in the Central Laboratories unit, Qatar University.
Declaration of Competing Interest
The authors declare that they have no known competing financial interests or personal relationships that could have appeared to influence the work reported in this paper.
References
- Novel insights into the nanoadsorption mechanisms of crystal violet using nano-hazelnut shell from aqueous solution. J. Water Process Eng.. 2021;44:102354.
- [CrossRef] [Google Scholar]
- Mechanistic understanding of the adsorption and thermodynamic aspects of cationic methylene blue dye onto cellulosic olive stones biomass from wastewater. Sci. Rep.. 2020;10(1)
- [CrossRef] [Google Scholar]
- Occurrence and removal characteristics of phthalate esters from bottled drinking water using silver modified roasted date pits. J. Environ. Health Sci. Eng.. 2021;19(1):733-751.
- [CrossRef] [Google Scholar]
- Treatment and reuse of reactive dyeing effluents. J. Membr. Sci.. 2006;269(1–2):15-34.
- [CrossRef] [Google Scholar]
- Phenomena of removal of crystal violet from wastewater using Khulays natural bentonite. J. Chem.. 2020;2020
- [CrossRef] [Google Scholar]
- Development of a novel tailored ion-imprinted polymer for recovery of lithium and strontium from reverse osmosis concentrated brine. Sep. Purif. Technol.. 2022;121320
- [CrossRef] [Google Scholar]
- Brown algae-based preparation, characterization and application of Pd nanocatalyst for enhanced reductive azo dye degradation. Cleaner Eng. Technol.. 2021;4:100172.
- [CrossRef] [Google Scholar]
- Mechanistic interaction of ciprofloxacin on zeolite modified seaweed (Sargassum crassifolium) derived biochar: kinetics, isotherm and thermodynamics. Chemosphere. 2021;281:130676.
- [CrossRef] [Google Scholar]
- Modelling and interpretation of adsorption isotherms. J. Chem.. 2017;2017
- [CrossRef] [Google Scholar]
- Determination of point of zero charge of natural organic materials. Environ. Sci. Pollut. Res.. 2018;25(8):7823-7833.
- [CrossRef] [Google Scholar]
- Synthesis of silver nanoparticles using marine macroalgae Padina sp. and its antibacterial activity towards pathogenic bacteria. Beni-Suef Univ. J. Basic Appl. Sci.. 2020;9(1):1-15.
- [CrossRef] [Google Scholar]
- New material of polyacrylic acid-modified graphene oxide composite for phenol remediation from synthetic and real wastewater. Environ. Technol. Innov.. 2022;27:102795.
- [CrossRef] [Google Scholar]
- Macroalgae-A sustainable source of chemical compounds with biological activities. Nutrients. 2020;12(10):1-23.
- [CrossRef] [Google Scholar]
- Thermodynamics, kinetics, and activation energy studies of the sorption of chromium(III) and chromium(VI) to a Mn3O4 nanomaterial. Chem. Eng. J.. 2014;254:374.
- [CrossRef] [Google Scholar]
- π−π stacking interaction: a nondestructive and facile means in material engineering for bioapplications. Cryst. Growth Des.. 2018;18:2765-2783.
- [CrossRef] [Google Scholar]
- Modeling of experimental adsorption isotherm data. Mod Chem. Appl.. 2015;6:14-22.
- [CrossRef] [Google Scholar]
- Zeta potential measurement. Methods Mol. Biol. (Clifton N.J.). 2011;697:63-70.
- [CrossRef] [Google Scholar]
- Adsorption of phenol on granular activated carbon from nutrient medium: equilibrium and kinetic study. Int. J. Environ. Res.. 2009;3(4):557-568.
- [CrossRef] [Google Scholar]
- Two-three parameters isotherm modeling, kinetics with statistical validity, desorption and thermodynamic studies of adsorption of Cu(II) ions onto zerovalent iron nanoparticles. Sci. Rep.. 2021;11(1)
- [CrossRef] [Google Scholar]
- Insight into the adsorption mechanisms of methylene blue and chromium(III) from aqueous solution onto pomelo fruit peel. RSC Adv. 2019
- [CrossRef] [Google Scholar]
- Electrochemical degradation of crystal violet using Ti/Pt/SnO2 electrode. Appl. Sci. (Switzerland). 2021;11(18):8401.
- [CrossRef] [Google Scholar]
- Removal of a cationic dye - Basic Red 12 - from aqueous solution by adsorption onto animal bone meal. J. Assoc. Arab Univ. Basic Appl. Sci.. 2012;12(1):48-54.
- [CrossRef] [Google Scholar]
- Decolorization of crystal violet solution by electrocoagulation. J. Environ. Protection Sci.. 2008;2:25-35.
- [Google Scholar]
- Mono and simultaneous removal of crystal violet and safranin dyes from aqueous solutions by HDTMA-modified Spirulina sp. Process Saf. Environ. Prot.. 2016;99:194-206.
- [CrossRef] [Google Scholar]
- Lead removal from aqueous solution by natural and pretreated clinoptilolite: adsorption equilibrium and kinetics. J. Hazard. Mater.. 2007;146(1–2):362-371.
- [CrossRef] [Google Scholar]
- Prediction of optimum adsorption isotherm: comparison of chi-square and Log-likelihood statistics. Desalin. Water Treat.. 2012;49(1–3):81-94.
- [CrossRef] [Google Scholar]
- Biosynthesis and characterization of silver nanoparticles by using brown marine seaweed Nizimuddiniazanardinii. Indian J. Geo Marine Sci.. 2018;47(12):2497-2503.
- [Google Scholar]
- Biosorption of zinc from aqueous solution using coconut (Cocos nucifera L) coir dust. Arch. Appl. Sci. Res.. 2012;4(2):809-819.
- [Google Scholar]
- Removal of crystal violet by advanced oxidation and microfiltration. Appl. Clay Sci.. 2010;50(3):337-341.
- [CrossRef] [Google Scholar]
- Application of seaweeds for the removal of cationic dye from aqueous solution. New pub: Balaban. 2016;57(53):25812-25821.
- [CrossRef] [Google Scholar]
- Synthesis and characterization of silver nanoparticles using alginate from the brown seaweed Laminaria ochroleuca: structural features and antibacterial activity. Biointerface Res. Appl. Chem. 2021
- [CrossRef] [Google Scholar]
- Surfactant adsorption isotherms: a review. ACS Omega. 2021;6(48):32342-32348.
- [CrossRef] [Google Scholar]
- Synthesis of silver nanoparticles using the seaweed Codium capitatum P.C. Silva (Chlorophyceae) S. Afr. J. Bot.. 2013;86:1-4.
- [CrossRef] [Google Scholar]
- Adsorption studies of Dichloromethane on some commercially available GACs: effect of kinetics, thermodynamics and competitive ions. J. Hazard. Mater.. 2010;178(1–3):963-972.
- [CrossRef] [Google Scholar]
- Application of low-cost, eco-friendly adsorbents for the removal of dye contaminants from wastewater: current developments and adsorption technology. Environ. Qual. Manag. 2022
- [CrossRef] [Google Scholar]
- Effects of textile dyes on health and the environment and bioremediation potential of living organisms. Biotechnol. Res. Innovation. 2019;3(2):275-290.
- [CrossRef] [Google Scholar]
- Role of electrostatic interactions in the adsorption of dye molecules by Ti 3 C 2 -MXenes. RSC Adv.. 2021;11(11):6201-6211.
- [CrossRef] [Google Scholar]
- Application of nanotechnology in the removal of heavy metal from water. Nanomater. Removal Pollutants Resource Reutilization. 2019;83–147
- [CrossRef] [Google Scholar]
- Maciej, S., Becker, F. G., Cleary, M., Team, R. M., Holtermann, H., The, D., Agenda, N., Science, P., Sk, S. K., Hinnebusch, R., Hinnebusch A, R., Rabinovich, I., Olmert, Y., Uld, D. Q. G. L. Q., Ri, W. K. H. U., Lq, V., Frxqwu, W. K. H., Zklfk, E., Edvhg, L. V., فاطمی, ح, 2012. Investigation of co-pyrolysis between sargassum macroalgae and polystyrene. Uniwersytet śląski 7(1), 343-354. https://doi.org/10.2/JQUERY.MIN.JS.
- Marine macroalgae display bioreductant efficacy for fabricating metallic nanoparticles: intra/extracellular mechanism and potential biomedical applications. Bioinorg. Chem. Appl.. 2021;2021
- [CrossRef] [Google Scholar]
- Measurement of silver-π interactions in solution using molecular torsion balances. J. Am. Chem. Soc.. 2015;137(25):8014-8017.
- [CrossRef] [Google Scholar]
- Exposure to crystal violet, its toxic, genotoxic and carcinogenic effects on environment and its degradation and detoxification for environmental safety. Rev. Environ. Contam. Toxicol.. 2016;237:71-104.
- [CrossRef] [Google Scholar]
- Enhancing adsorption capacity of nano-adsorbents via surface modification: a review. S. Afr. J. Chem. Eng.. 2020;31:25-32.
- [CrossRef] [Google Scholar]
- An efficient sequestration of toxic crystal violet dye from aqueous solution by Alginate/Pectin nanocomposite: a novel and ecofriendly adsorbent. Groundw. Sustain. Dev.. 2020;11:100373.
- [CrossRef] [Google Scholar]
- Adsorption of hazardous dye crystal violet from wastewater by waste materials. J. Colloid Interface Sci.. 2010;343(2):463-473.
- [CrossRef] [Google Scholar]
- Synthesis and characterization of novel friendly biosorbents and it uses for removal of crystal violet dye from wastewater. Int. J. Sci. Eng. Res.. 2019;10(4)
- [Google Scholar]
- Novel, green and low cost synthesis of Ag nanoparticles with superior adsorption and solar based photocatalytic activity. J. Mater. Sci. Mater. Electron.. 2019;30(9):8788-8795.
- [CrossRef] [Google Scholar]
- Removal of cationic organic dye from aqueous solution by chemical and pyrolysis activated Ulva lactuca. Water. 2021;13(9):1154.
- [CrossRef] [Google Scholar]
- Ultrasonic assisted graphene oxide nanosheet for the removal of phenol containing solution. Environ. Technol. Innov.. 2019;13:398-407.
- [CrossRef] [Google Scholar]
- The possible mechanism of eco-friendly synthesized nanoparticles on hazardous dyes degradation. Biocatal. Agric. Biotechnol.. 2019;19:101138.
- [CrossRef] [Google Scholar]
- Equilibrium uptake and sorption dynamics for the removal of a basic dye using bamboo. Afr. J. Biotechnol.. 2009;8(8):1555-1559.
- [Google Scholar]
- Characterization and analysis of Malaysian macroalgae biomass as potential feedstock for bio-oil production. Energies. 2019;12(18):3509.
- [CrossRef] [Google Scholar]
- Application of the zeta potential measurements to explanation of colloidal Cr2O3 stability mechanism in the presence of the ionic polyamino acids. Colloid Polym. Sci.. 2014;292(10):2453.
- [CrossRef] [Google Scholar]
- Eco-Efficient green seaweed Codium decorticatum biosorbent for textile dyes: characterization mechanism, recyclability, and RSM optimization. ACS Omega 2020
- [CrossRef] [Google Scholar]
- J. Phys 2020:12011.
- [CrossRef]
- Metal nanoparticles from marine seaweeds - A review. Nanotechnol. Rev.. 2016;5(6):589-600.
- [CrossRef] [Google Scholar]
- Technologies for treating wastewater from textile industry: a review. Mater. Today: Proc. 2022
- [CrossRef] [Google Scholar]
- In vitro biosorption of ochratoxin A on the yeast industry by-products: Comparison of isotherm models. Bioresour. Technol.. 2007;98(9):1812-1821.
- [CrossRef] [Google Scholar]
- Biodegradation of Crystal Violet dye by bacteria isolated from textile industry effluents. PeerJ. 2018;2018(6):e5015-e.
- [CrossRef] [Google Scholar]
- Ruiz, H.A., Cervantes-Cisneros, D.E., Arguello-Esparza, D., Cabello-Galindo, A., Picazo, B., Aguilar, C.N., Rodriguez-Jasso, R.M., 2017. Hydrothermal processes for extraction of macroalgae high value-added compounds. In: Hydrothermal Processing in Biorefineries: Production of Bioethanol and High Added-Value Compounds of Second and Third Generation Biomass, pp. 461-481. https://doi.org/10.1007/978-3-319-56457-9_20/TABLES/2.
- The use of ATR-FTIR spectroscopy for quantification of adsorbed compounds. J. Spectrosc.. 2015;2015
- [CrossRef] [Google Scholar]
- Green preparation of seaweed-based silver nano-liquid for cotton pathogenic fungi management. IET Nanobiotechnol.. 2019;13(2):219-225.
- [CrossRef] [Google Scholar]
- Green synthesis of sodium alginate-silver nanoparticles and their antibacterial activity. Int. J. Biol. Macromol.. 2018;111:1281-1292.
- [CrossRef] [Google Scholar]
- Proficient dye removal from water using biogenic silver nanoparticles prepared through solid-state synthetic route. Heliyon. 2020;6(8):e04730
- [CrossRef] [Google Scholar]
- Recent advances in conventional and contemporary methods for remediation of heavy metal-contaminated soils. 3 Biotech. 2018;8(4):216.
- [CrossRef] [Google Scholar]
- Extract from the Macroalgae Ulva rigida Induces Table Grapes Resistance to Botrytis cinerea. Foods. 2022;11(5)
- [CrossRef] [Google Scholar]
- Adsorption of crystal violet dye by coconut husk powder: isotherm, kinetics and thermodynamics perspectives. Environ. Nanotechnol. Monit. Manage.. 2022;17:100651.
- [CrossRef] [Google Scholar]
- Adsorption of crystal violet dye from aqueous solution using industrial pepper seed spent: equilibrium, thermodynamic, and kinetic studies. Adsorpt. Sci. Technol.. 2022;2022:1-20.
- [CrossRef] [Google Scholar]
- Removal of basic dye methylene blue by using bioabsorbents Ulva lactuca and Sargassum. Afr. J. Biotechnol.. 2010;7(15):2649-2655.
- [CrossRef] [Google Scholar]
- Insecticidal, antibacterial and dye adsorbent properties of Sargassum muticum decorated nano-silver particles. S. Afr. J. Bot.. 2021;139:432-441.
- [CrossRef] [Google Scholar]
- Synthesis and characterization of silver and gold nanoparticles using aqueous extract of seaweed, Turbinaria conoides, and their antimicrofouling activity. Sci. World J. 2014
- [CrossRef] [Google Scholar]
- Comparison of basic dye crystal violet removal from aqueous solution by low-cost biosorbents. Sep. Sci. Technol.. 2008;43(14):3712-3731.
- [CrossRef] [Google Scholar]
- Removal of aqueous organic contaminants using submerged ceramic hollow fiber membrane coupled with peroxymonosulfate oxidation: Comparison of CuO catalyst dispersed in the feed water and immobilized on the membrane. J. Membr. Sci.. 2021;618:118707.
- [CrossRef] [Google Scholar]
- Mechanistic understanding of crystal violet dye sorption by woody biochar: implications for wastewater treatment. Environ. Geochem. Health. 2019;41(4):1647-1661.
- [CrossRef] [Google Scholar]
- Chemistry and reactivity of tannins in vitis spp.: a review. Molecules. 2020;25(9)
- [CrossRef] [Google Scholar]
- Application of modified green algae Nannochloropsis sp. as adsorbent in the simultaneous adsorption of Methylene Blue and Cu(II) cations in solution. Sustain. Environ. Res.. 2021;31(1):1-12.
- [CrossRef] [Google Scholar]
- Removal of anionic pollutants from liquids by biomass materials: a review. J. Mol. Liq.. 2016;215:565-595.
- [CrossRef] [Google Scholar]
- Removal of organic dyes using Fucus vesiculosus seaweed bioadsorbent an ecofriendly approach: equilibrium, kinetics and thermodynamic studies. Environ. Chem. Ecotoxicol.. 2022;4:67-77.
- [CrossRef] [Google Scholar]
- Identification and characterization of marine seaweeds for biocompounds production. Environ. Technol. Innov.. 2021;24:101848.
- [CrossRef] [Google Scholar]


