

Translate this page into:
Magnesium-zinc-graphene oxide nanocomposite scaffolds for bone tissue engineering
⁎Corresponding author at: Department of Biomedical Engineering, Faculty of Engineering, University of Isfahan, Isfahan 81746-73441, Iran. m.ebrahimian@eng.ui.ac.ir (Mehdi Ebrahimian-Hosseinabadi)
-
Received: ,
Accepted: ,
This article was originally published by Elsevier and was migrated to Scientific Scholar after the change of Publisher.
Peer review under responsibility of King Saud University.
Abstract
Abstract
The Mg-Zn-GO nano-composite scaffolds was fabricated successfully by using powder metallurgy method. Mechanical strength of the Mg-Zn-GO nano-composite scaffolds was higher than the Mg-Zn scaffolds. Corrosion resistance of the Mg-Zn-GO scaffolds was improved because of nano-graphene oxide existence in the Mg-Zn-GO scaffolds, and Mg(OH)2 deposition on the scaffold surfaces. MTT tests showed that the Mg-Zn-GO scaffolds are biocompatible.
Abstract
The aim of this study was to fabricate and evaluate magnesium-zinc-graphene oxide nanocomposite scaffolds for bone tissue engineering. For this reason, Mg-6Zn, Mg-6Zn-1GO, and Mg-6Zn-2GO scaffolds were fabricated by the powder metallurgy method. The porosity level and also the pore size of the scaffolds were evaluated by SEM which varied from 40 to 46% and 200 to 500 μm, respectively. The chemical composition and microstructure of the scaffolds were characterized by XRD and SEM equipped with EDS; the presence of Mg, Zn, C, and O elements in the structure of the scaffolds was shown. Also, the elemental map confirmed the existence of magnesium, zinc, carbon, and oxygen in the structure of the scaffold. The mechanical properties of the scaffolds were investigated by the compression test; the results showed that by the addition of graphene oxide to the structure, the compressive strength of the samples increased from 5 to 8 MPa. Electrochemical corrosion polarization tests were conducted to evaluate the corrosion resistance of the samples immersed in simulated body fluid (SBF). Furthermore, the biodegradability of the scaffolds was determined by immersion of the samples in phosphate-buffered saline (PBS). The results demonstrated that the polarization resistance value and the corrosion rate for different formulations including Mg-6Zn, Mg-6Zn-1GO, and Mg-6Zn-2GO were 41.58, 35.48, and 55.40 Ω.cm2 followed by 10.60, 14.83, and 9.06 mm.year−1, respectively. Based on the results, the Mg-6Zn-2GO formulation presented the best corrosion resistance among the samples were investigated, which confirmed the results of the immersion test. Moreover, the MTT assay proved that the extract of Mg-6Zn-2GO scaffolds was not cytotoxic in contact with L-929 cells which validated the studied scaffolds for bone tissue applications.
Keywords
Bone tissue engineering
Magnesium
Zinc
Graphene oxide
Composite scaffold
Powder metallurgy

1 Introduction
Nearly, one million cases of skeletal injuries are annually reported that require bone grafts for treatment (Salgado et al., 2004). Treatment of large bone defects is one of the major challenges in orthopedic surgery; therefore, the effort to find an appropriate material to replace the bone continues in earnest (Li et al., 2018). Bone tissue engineering, as an important subset of tissue engineering, seems to be a suitable solution to this purpose (Kingsley et al., 2013). Nowadays, the materials used to fabricate bone tissue engineering scaffolds and orthopedic devices are mainly bioactive ceramics (Qin et al., 2021), natural and synthetic polymers, and also composites of polymers and ceramics as bulk or coatings (Li et al., 2021; Angili et al., 2023). Despite the advantages of mentioned materials, some of their features can be assumed as a limitation in bone tissue applications. As an example, polymers have demonstrated very low elastic modulus and compressive strength, while ceramics are very brittle. Besides, metals display good mechanical properties for load-bearing applications such as hard bone tissue (Seyedraoufi and Mirdamadi, 2015). Among all, magnesium (Mg) scaffolds have been introduced as an appropriate option for bone tissue regeneration in many studies (Toghyani and Khodaei, 2018). Suitable biodegradability, acceptable mechanical properties, and desired biocompatibility are considered advantages of magnesium implants (Seyedraoufi and Mirdamadi, 2015). They are also lightweight, have a high strength-to-weight ratio (specific strength), and have other appropriate properties such as the low elastic modulus that minimizes the stress-shielding phenomenon. Magnesium ion (Mg2+), the fourth most abundant cation in the human body, is mostly stored in the bones. This ion is vital for metabolic processes and acts as a cofactor. Importantly, the products caused by magnesium degradation are not only harmful to the human body but have positive effects on it as well (Toghyani and Khodaei, 2018).
Despite all the mentioned advantages, magnesium is highly reactive and rapidly degraded in contact with biological fluids and loses its mechanical integrity. In addition, when magnesium comes into contact with aqueous solutions, an oxidation reaction occurs on its surface, which leads to the formation of hydrogen gas. Inflammation caused by the release of hydrogen can link to problems and disorders. Over and above that, changes in the pH of the environment due to dissolution can also have adverse effects on cell viability (Dorozhkin, 2014; Li et al., 2014). One of the proposed solutions to overcome the disadvantages of magnesium is alloying (Seyedraoufi and Mirdamadi, 2013; Liu et al., 2020; Tan and Ramakrishna, 2021). The results of several studies have shown zinc (Zn) is one of the suitable elements that can be alloyed with magnesium (Wei et al., 2019; Saravanan et al., 2021; He et al., 2018); Alloying magnesium with Zn improves its corrosion resistance and mechanical properties. In addition, Zn is an essential element for the human body and its released products do not cause any serious problems (Seyedraoufi and Mirdamadi, 2013; Sezer et al., 2021). According to the presented reports, compared to magnesium and zinc alloys, Mg-6Zn alloy is more appropriate in terms of corrosion resistance, mechanical properties, cell compatibility, and in vivo studies (Seyedraoufi and Mirdamadi, 2013; Zhang et al., 2010). Graphene oxide (GO) is a graphene-based material with oxygenated functional groups. It is hydrophilic and can be easily dispersed in water and also polar solvents to form a stable suspension (Tong et al., 2016); In addition, a recent study has shown that graphene oxide has a positive effect on adhesion and differentiation of osteoblasts and improve bone regeneration by stimulating biomineralization (Wen et al., 2017). The addition of graphene oxide to the Mg-6Zn alloy is expected to improve the cellular compatibility of bone tissue.
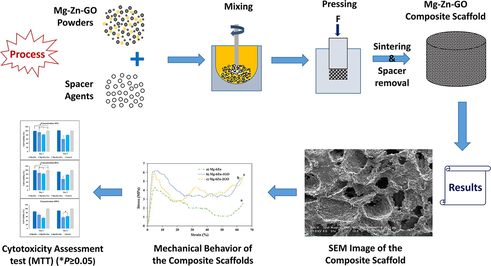
In this study, magnesium-based nanocomposite scaffolds were fabricated using different formulations of magnesium, zinc, and graphene oxide (Mg-6Zn, Mg-6Zn-1GO, and Mg-6Zn-2GO) by powder metallurgy method. Subsequently, they were examined physically, chemically, mechanically, and biologically which made the best formulation is suggested for bone tissue engineering.
2 Materials and methods
2.1 Materials
In this study, angular magnesium powder with a purity of 99.9% and approximate particle size of 50 μm (Merck, CAS 7439-95-4, Germany), spherical zinc powder with a purity of more than 95% and particle size of 1–8 μm (Merck, CAS 7732-18-5, Germany) and graphene oxide powder with a purity of more than 99% and particles size of ∼5 nm (Merck, CAS 7732-18-5, Germany) were used. Carbamide particles (CH4N2O) with 99% purity and an approximate particle size of 550 μm (Merck, CAS 57-13-6, Germany) were used as the spacer agent in the fabrication of the scaffolds. Methanol solution (Merck, CAS 67-56-1, Germany) was used for the porosity determination test. The degradation test was performed by using phosphate-buffered saline (PBS) solution (pH = 7.4) (Ide Bio Co., Iran) and electrochemical corrosion polarization tests were conducted by using simulated body fluid (SBF) (BIOMATERIALS.IR, AS0030, Iran). For biological tests, MTT [3-(4,5-di-methylthiazol-2-yl)-2,5-diphenyltetrazolium bromide] (Sigma-Aldrich, Germany), penicillin, and streptomycin (BIO-IDEA, Iran), fetal bovine serum (FBS) (Gibco, Germany), dimethyl sulfoxide (DMSO) (Merck, Germany) and Dulbecco’s modified eagle medium (DMEM) (Gibco, Germany) were utilized.
2.2 Fabrication of porous Mg-based scaffolds
In this study, three formulations of porous Mg-based scaffolds including Mg-6Zn, Mg-6Zn-1GO, and Mg-6Zn-2GO were fabricated. The preferred method to fabricate scaffolds was powder metallurgy in which the weight percentage of used powders including magnesium, zinc, graphene oxide, and carbamide powders were calculated as an initial step (Table 1). Next, powders were mixed with a small amount (∼2% w/w) of ethanol (as a binder) for 2 min. At the following stage, the samples were pressed to an optimum compression of 350 MPa in steel molds with diameters of about 6.5 mm and 10 mm (ISO13314 standards: 2011 and ASTM G31-72 (2004)). The volumetric fraction of carbamide was considered 50%, to achieve a porous scaffold (porosity percentage ∼50%) after removing the spacer agent particles. To leach the spacer agent particles out from compacted pellets, they were immersed in ethanol solution for 2 h. After that, when a large percentage of spacer agent particles (near 70%) dissolved in an ethanol solution, the residues of the spacer agent which were trapped at the center of the samples or in isolated pores were removed during the initial sintering stage under a vacuum atmosphere (10−4 Torr) and temperature of 450 °C. Last but not the least, the samples were sintered for 2 h at 580 °C.
Scaffold
Mg (g)
Zn (g)
GO (g)
Carbamide (g)
Mg-6Zn
1.23
0.078
0
0.997
Mg-6Zn-1GO
1.22
0.078
0.013
0.997
Mg-6Zn-2GO
1.20
0.078
0.026
0.997
2.3 Characterization of porous Mg-based scaffolds
The crystal structure of graphene oxide and scaffolds were analyzed by X-ray diffraction (XRD) technique. On a Bruker (D8ADVANCE, Germany), X-ray diffractometer, the variation, at room temperature, of the radial diffraction intensity dependence on the diffraction angle (2 theta) using a Cu-Kα X-ray lamp with a wavelength of 1.54 Å was recorded. The working conditions were: Scanning rate = 3 s/step, and diffraction range 10–80° (2 theta). The morphology and pore size in fabricated scaffolds and also each component itself including magnesium, zinc, and carbamide powders were studied by scanning electron microscopy (SEM) equipped with EDS analysis (Philips, XI-30, Netherlands). To prevent charge buildup on the specimen surface, it was coated with a thin layer of gold.
To determine the porosity level of the samples, the porosity test was performed and complied with the Archimedes method according to ASTM B962-08 standard. Due to the lower viscosity of methanol (0.6 cP) compared to ethanol (1.1 cP), methanol was used for this test (Seyedraoufi and Mirdamadi, 2015). To assess the mechanical properties of the samples, a universal testing machine (HOUNSFIELD, H30KS, England) was utilized and the test was performed under ambient temperature and with a crosshead speed of 0.5 mm/min. Cylindrical samples of composites were prepared according to ISO 13314: 2011 standard (diameter = 10 mm & height = 10 mm). It should be mentioned that four samples for each alloy and composite formula were examined. Engineering stress–strain curves were plotted and the necessary information was extracted and evaluated from them.
To investigate the in vitro biodegradability, immersion and electrochemical corrosion polarization tests were performed. To evaluate the biodegradability of Mg-6Zn, Mg-6Zn-1GO, and Mg-6Zn-2GO scaffolds, an immersion test was performed in PBS solution at 37 °C according to ASTM G31-72 (2004). First, the samples were weighed by using a digital analytical balance with 0.1 mg accuracy (METTLER TOLEDO, JB1603-C/FACT, Switzerland). In the following step, the samples were immersed in falcons containing 25 ml of PBS solution which were then placed in an incubator at 37 °C. The biodegradability of the samples was examined at 2 intervals including 24 h and 7 days. At first glance, the surface of the samples had been changed to a white color related to the degradation and they were heavier than their initial weight. To identify the biodegradation products formed on the samples, the products were examined by XRD. To remove suspended biodegradation products, the samples were rinsed with distilled water and a chromic acid solution with a concentration of 180 g/l (according to ASTM G1-90 (1999) and reported studies) (Zhang et al., 2010; Mutlu, 2018; Yazdimamaghani et al., 2014). The reason behind using chromic acid solution was that it reacted with degradation products and dissolved them which did not affect the magnesium (Yazdimamaghani et al., 2014). The samples turned dark after washing with the chromic acid solution. Then, the samples were dried for 24 h and weighed. Based on the equation below, the weight loss percentage of the samples was calculated (Kaur et al., 2017):
The pH of the solutions was measured at 1, 3, 5, and 7 days after immersion by a pH meter (ELMEIRON, CP-511, Poland). Electrochemical corrosion polarization tests were performed in SBF solution using a potentiostat/galvanostat device (Metrohm, Autolab PGSTAT 302N, Netherlands) connected to a PC and equipped with Nova 1.9 software according to ASTM G102-89 (2010) standard. Electrochemical evaluations were performed using a three-electrode electrochemical cell namely, the working electrode, the platinum counter electrode, and the saturated calomel electrode as the reference electrode. To stabilize the open circuit potential (OCP) of the tested specimens and reach a stable state, the surface of each specimen was in contact with the simulated body fluid (SBF) solution for 1 h at 37 °C before starting the test. It should be noted that the applied charges were<5 µV during the early 5 min of measuring the electrical potential.
To calculate the corresponding time to a stable state, the open circuit potential of the samples was plotted over time. The potentiodynamic polarization test was performed at a scanning speed of 1 (mV/s) and in a potential range of 0.3 to + 0.5 V related to the open circuit potential. The values of the corrosion current density and corrosion potential were calculated by TOEFL extrapolation using polarization corrosion diagrams. Impedance spectroscopy was performed under the condition of an alternating voltage with a small oscillation amplitude of about ± 10 around the OCP and in a wide frequency range (0.1 Hz to 100 kHz) on all samples. The results were also shown in the form of the logarithm of the absolute value (modulus) of the impedance (log |Z|) or the phase angle in terms of frequency (Bode diagram). In this study, the data was represented in the form of Bode and Nyquist diagrams. It should be mentioned that the data related to impedance was processed in Zview-2 software. To conduct the electrochemical corrosion test, the surface of the samples was confined to 0.154 cm2.
MTT test was performed by using the L-929 cell line (mouse adipose tissue cells, Royan Institute, IRAN) according to ISO 10993-5 standard. In the first step, the cells were cultured in a DMEM medium containing 10% fetal bovine serum (FBS), 100 units/ml (U/ml) penicillin, and 100 μg/ml streptomycin at 37 °C, with humidity of 90 percent, and concentration of 5% carbon dioxide. To investigate the toxicity of the samples and their effects on cell growth and proliferation, the indirect contact (extraction) method was used. To sterilize the samples, they were exposed to ultraviolet (UV) radiation. At the next stage, the extracts were prepared for each alloy including Mg-6Zn, Mg-6Zn-1GO, and Mg-6Zn-2GO, separately. According to ISO 10993-12 standard, the extraction of the samples was prepared by adding 0.2 g of each alloy to 1 ml of DMEM medium. This test was performed under a humid atmosphere containing 5% carbon dioxide at 37 °C for 72 h. the supernatant was then removed and centrifuged. To determine the amount of magnesium and zinc ions released in the extracts, some of them were isolated for the ICP test. The extracts were prepared at 10, 50, and 100% of initial concentration. The extracts were refrigerated at 4 °C for further use in the cytotoxicity test. The cells were placed in a 96-well culture plate so that approximately 50 cells per microliter of culture medium (cells/μl) were poured into each well and incubated for 24 h to reach their final adhesion to the surface. The culture medium was then removed and replaced with 100 μl of the extract, and the cells were incubated under a humid atmosphere containing 5% carbon dioxide at 37 °C. Three repetitions of each alloy were investigated after 24 and 72 h. After the passage of specified periods, 20 μl of MTT was added to each well. The plate was then placed in a CO2 incubator at 37 °C for 4 h. 100 μl of dimethyl sulfoxide (DMSO) was then added. The spectrophotometric absorption of the samples was measured with a microplate reader (Stat Fax, 2100 Microplate Reader, USA) at 570 nm. The relative growth rate (RGR) of cells was obtained by using the following formula (Zhang et al., 2010; Rekha and Anila, 2019):
In which ODSAMPLE is the optical density of the samples and ODCONTROL is the optical density of the negative control sample (culture medium).
2.4 Statistical analysis
The results were reported as average ± standard deviation (mean ± SD). The quantitative data were compared by SPSS package software, version 24. The significance level was considered<0.05 (p-value < 0.05) in all cases.
3 Results and discussion
3.1 Characterization of the composite scaffolds
The XRD patterns of GO nanoparticles, Mg-6Zn, Mg-6Zn-1GO, and Mg-6Zn-2GO scaffolds are shown in Fig. 1. In the early stage of our research, the XRD pattern of the purchased graphene oxide powder (Fig. 1a) was compared to the reported one which presented great compatibility (Zhang et al., 2018; Yuan et al., 2018). All the alloyed formulations namely Mg-6Zn, Mg-6Zn-1GO, and Mg-6Zn-2GO displayed the fundamental peaks including magnesium, zinc, and also magnesium oxide (MgO) in their XRD pattern (Fig. 1b). It should be noted that MgO was formed as a partial phase during the sintering process. In fact, all the oxygen functional groups of GO go through a reaction with the magnesium matrix during the sintering stage which leads to produce MgO nanoparticles as a side product. Since MgO is biologically non-toxic, it will not put the body in danger (Li et al., 2014; Wan et al., 2011). According to Fig. 1, no graphene oxide component was detected in Mg-6Zn-1GO and Mg-6Zn-2GO scaffolds. This observation can be correlated to the low percentage of graphene oxide in porous composite samples which was in line with other research using GO in nHA/GO (Zhang et al., 2018) and TiO2/GO (Yuan et al., 2018). Furthermore, the low content of GO can be attributed to its fine distribution throughout the composite as well as its interaction with other components (Haghshenas, 2017).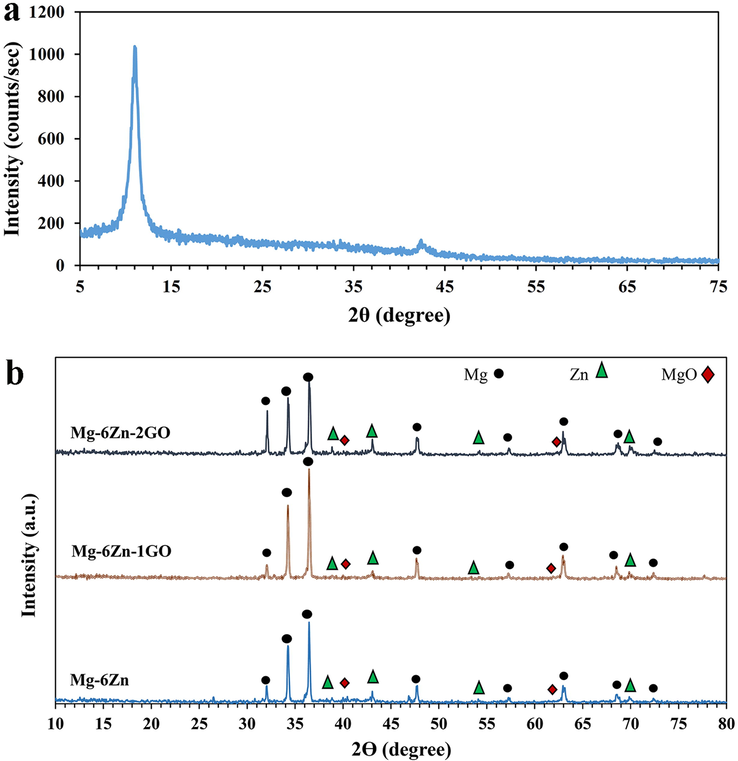
XRD patterns of (a) GO nanoparticles, (b) Mg-6Zn, Mg-6Zn-1GO, and Mg-6Zn-2GO scaffolds.
The morphology and particle size of carbamide, magnesium, and zinc powder were recorded by SEM which are shown in Fig. 2. As can be seen, carbamide and magnesium powders are both angular and the average particle size of carbamide powder is about 550 µm which is 11 times larger than magnesium particles. Moreover, zinc powder has spherical particles with an average size of 1–8 µm. The surface of the Mg-6Zn-2GO scaffold was also investigated by SEM in two different scales of 1 and 2 mm which are shown in Fig. 3. As can be seen, there is almost a uniform distribution of pores on the surface of this scaffold, and the porosity level is estimated at 50%. The porosity rate of each sample obtained from the Archimedes test is reported in Table 2. Initially, carbamide particles were added to the powders with a volume fraction of 50% but then during the manufacturing, heating, and compressing process, a number of porosities got closed which resulted in the reduction of the porosity rate of the samples. Ultimately, the porosity rate of the samples was estimated at 40 to 46% which was close to the related amount in spongy bone (50 to 90%) (Salgado et al., 2004).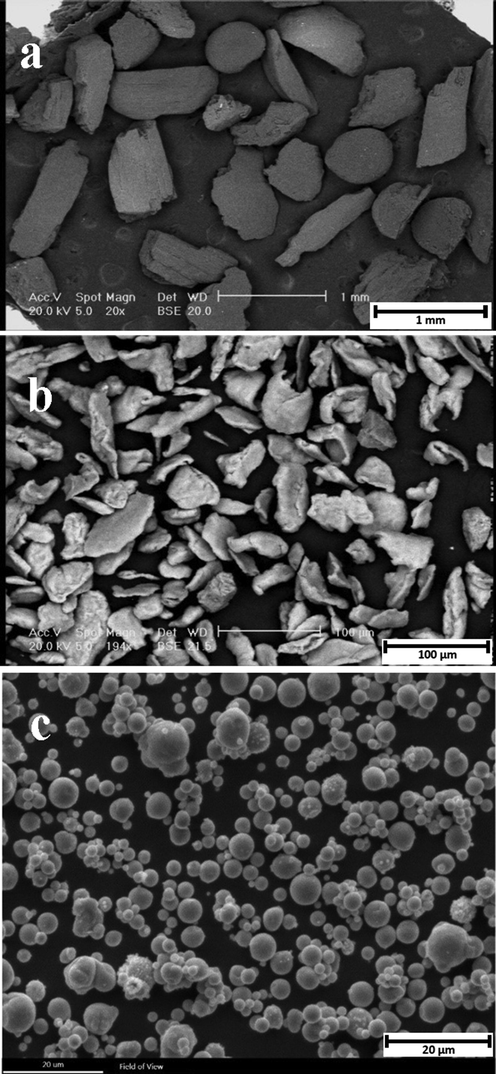
SEM images of (a) Carbamide powders, (b) Magnesium powders, and (c) Zinc powders.
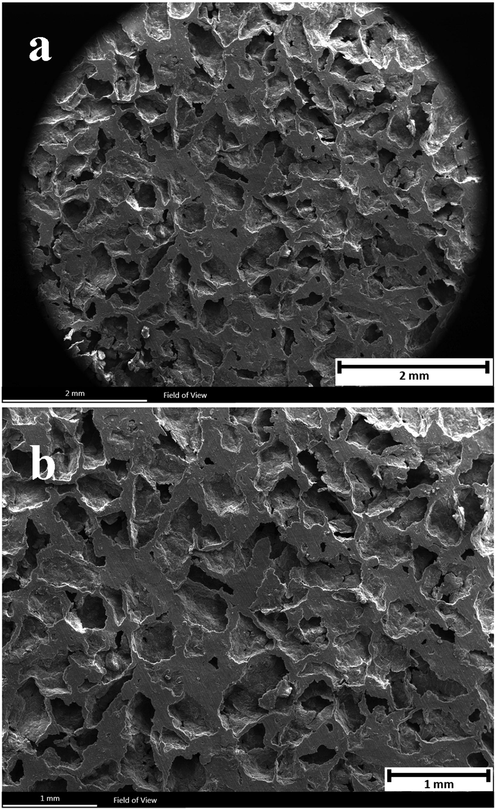
SEM images of the surface of the Mg-6Zn-2GO scaffold in two scales (a) 2 mm and (b) 1 mm.
Scaffold
Porosity (%)
Mg-6Zn
40 ± 1
Mg-6Zn-1GO
41 ± 3
Mg-6Zn-2GO
46 ± 1
Spongy bone (Salgado et al., 2004)
50–90
From the perspective of tissue engineering science, the mechanical properties of an ideal biodegradable scaffold should be compatible with its surrounding tissues as well as provide a temporary substrate for cell adhesion (Toghyani and Khodaei, 2018). In addition, there should be adequate interconnected pores to transport oxygen and nutrients, excrete metabolic wastes, and grow blood vessels (Salgado et al., 2004).
According to SEM images of the Mg-6Zn, Mg-6Zn-1GO, and Mg-6Zn-2GO scaffolds which were taken at different magnifications (Fig. 4), the pore size was estimated 200–500 µm. This parameter is highly important for bone tissue engineering as when the pores get smaller more cells get blocked which leads to poor cell infiltration, extracellular matrix production, and angiogenesis of the internal areas of the scaffolds. To meet bone tissue engineering purposes, the pore size should be in the range of 200–900 μm (Salgado et al., 2004). Therefore, the porosity size of Mg-6Zn, Mg-6Zn-1GO, and Mg-6Zn-2GO scaffolds is appropriate.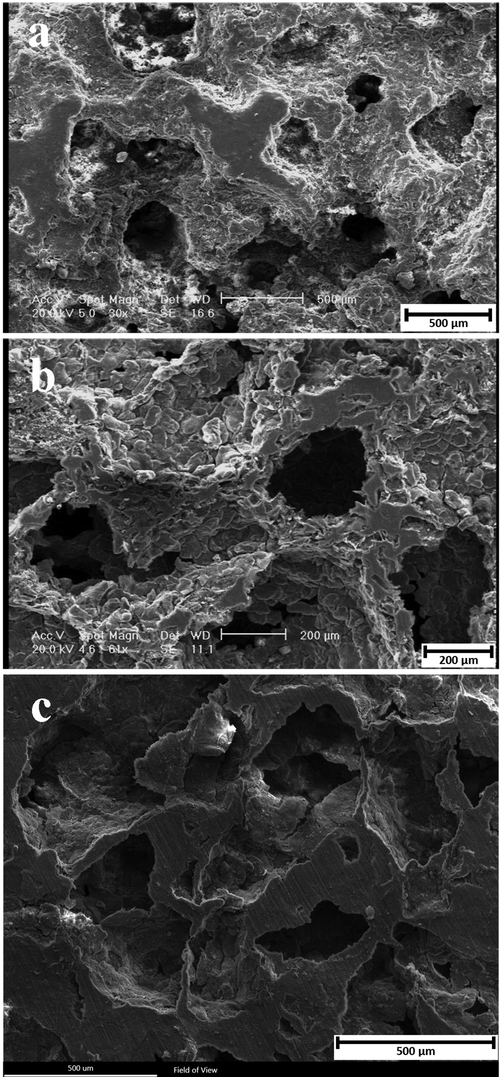
SEM images of the (a) Mg-6Zn scaffold, (b) Mg-6Zn-1GO scaffold, (c) Mg-6Zn-2GO scaffold.
To prove the presence of Zn and GO in the structure of scaffolds, EDS, and elemental mapping analyses were conducted. The results related to Mg-6Zn-1GO samples are shown in Figs. 5 and 6. The resulting spectrum proves the presence of Mg, Zn, C, and O elements in the structure of the mentioned scaffold. The weight and atomic percentage of each element are specified in the table (Fig. 5). The high percentage of carbon at this point indicates the presence of GO in the structure. Also, the elemental map confirmed the existence of magnesium, zinc, carbon, and oxygen in the structure of the scaffold (Fig. 6).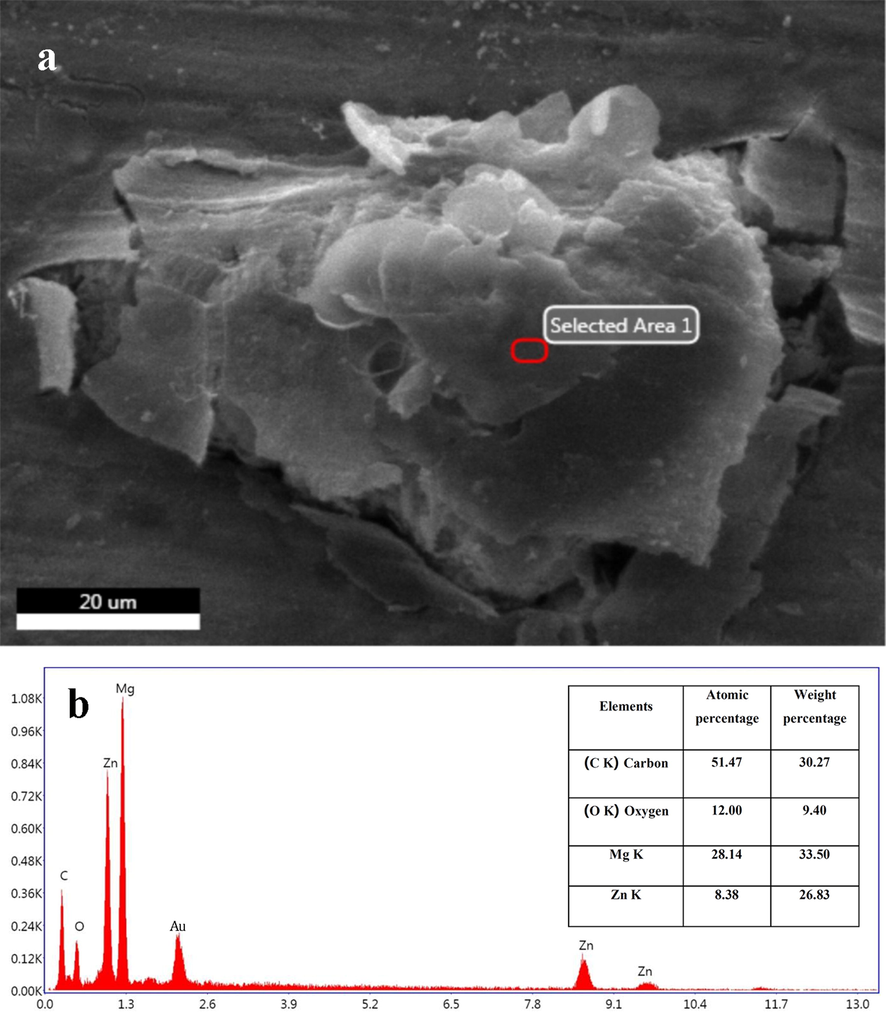
(a) SEM image, and (b) EDS spectrum of the selected region, the weight percentage, and atomic percentage of the elements related to the Mg-6Zn-1GO sample.
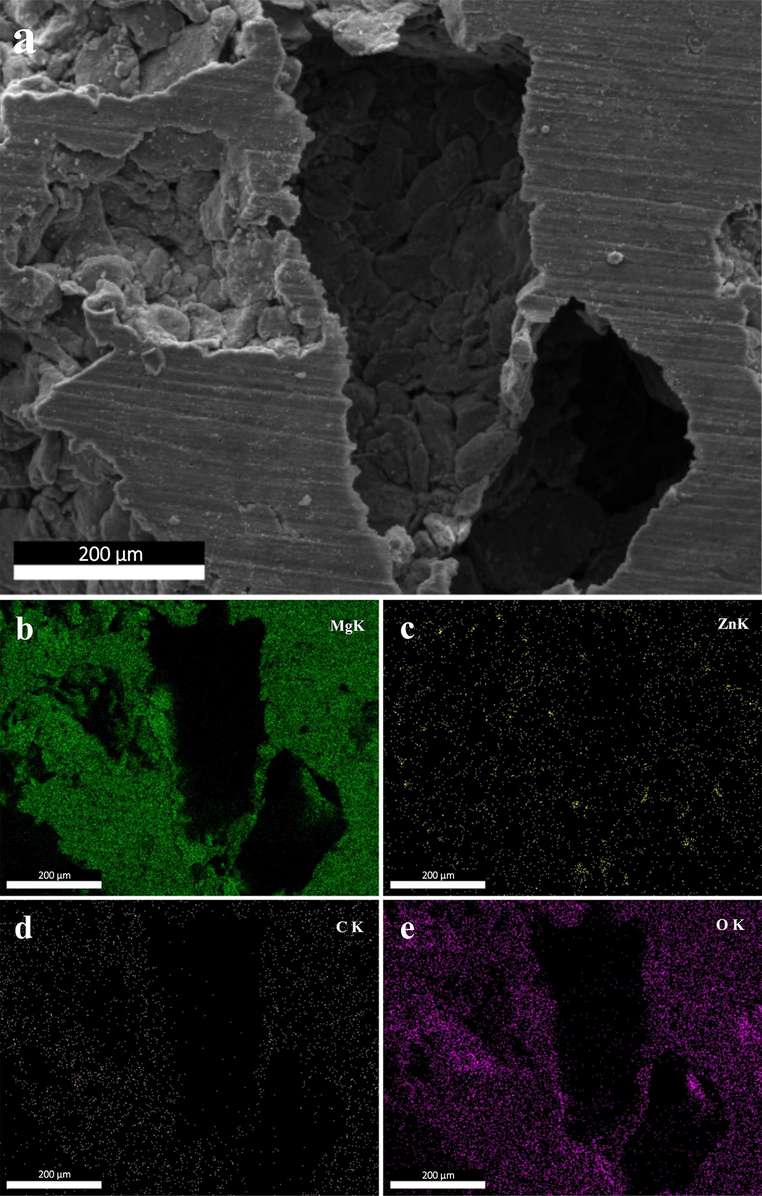
(a) SEM image of Mg-6Zn-1GO scaffold, and corresponding elemental mappings of elements (b) Mg, (c) Zn, (d) C, and (e) O.
3.2 Mechanical properties of the composite scaffolds
To evaluate the mechanical properties of the samples, the compression test was performed according to ISO13314: 2011 standard. The obtained stress and strain results from different alloys including Mg-6Zn, Mg-6Zn-1GO, and Mg-6Zn-2GO are illustrated in Fig. 7. Table 3 provides an appropriate substrate to compare results to each other and also spongy bone (Moradi et al., 2019; Gao et al., 2017). Based on the results, compressive strength and elastic modulus for all the specimens are in the range of related amounts in spongy bone. To improve tissue repair and regeneration, the aim was to approximate the mechanical properties of the Mg-6Zn matrix to its surrounding tissues by adding graphene oxide reinforcement. By doing so, the compressive strength and elastic modulus amplified which were slightly higher in Mg-6Zn-1GO than in Mg-6Zn-2GO samples (P ≥ 0.05).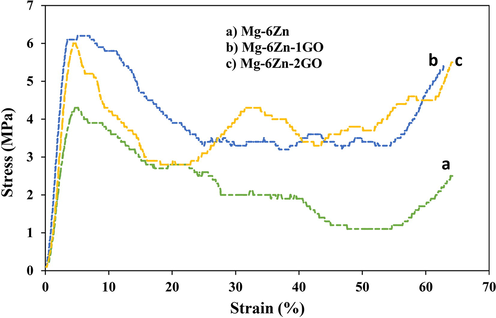
Compressive stress–strain curves for (a) Mg-6Zn, (b) Mg-6Zn-1GO, and (C) Mg-6Zn-2GO.
Scaffold
Elastic Modulus (MPa)
Compressive strength (MPa)
Plateau Stress (MPa)
Mg-6Zn
228 ± 40
5.1 ± 1.0
2.4 ± 0.9
Mg-6Zn-1GO
162 ± 93
8.9 ± 2.6
5.2 ± 2.6
Mg-6Zn-2GO
145 ± 63
8.1 ± 1.3
5.0 ± 1.4
Spongy bone (Moradi et al., 2019; Gao et al., 2017)
10–1570
1.5–38
1–20
The mechanical improvement can be correlated to the uniform dispersion of GO particles throughout the Mg-6Zn matrix. These particles create obstacles against the movement of dislocations and cause more density of dislocations between the Mg-6Zn matrix and GO particles, so the Mechanical strength increases. As previously detailed, the elastic modulus of composites was in the range of related amounts in the spongy bone so the studied scaffolds can cut down on the possibility of stress shielding (Yan et al., 2017; Dutta et al., 2017) and are also an appropriate choice to support bone tissue repair.
3.3 The corrosion resistance of the composite scaffolds
Fig. 8a presented the potentiodynamic polarization diagrams for the Mg-6Zn, Mg-6Zn-1GO, and Mg-6Zn-2GO scaffolds. The results of TOEFL extrapolation related to these diagrams are also demonstrated in Table 4. This table highlights that the current density decreased for Mg-6Zn-2GO, Mg-6Zn, and Mg-6Zn-1GO samples, respectively, which indicates an increase in corrosion resistance of the Mg-6Zn-2GO sample compared to other samples. Fig. 8b shows the equivalent circuit used to fit the Nyquist chart data. Fig. 8c shows the Nyquist diagrams and the fitted diagrams of the samples and in Table 5, the data related to Nyquist charts obtained by fitting are reported, where Rs, Rp, and Rct are the solution resistance, the polarization resistance, and the charge transfer resistance, respectively. It is necessary to mention that the higher value of Rct, the lower the corrosion rate. Therefore, the charge transfer resistance rate is used to evaluate the corrosion properties of a sample. Q2 and Q1 show the surface capacity of the alloy and the capacity of the electrical double layer formed at the interface between the sample surface and the electrolyte, respectively. In addition, n2 and n1 are exponential coefficients that are usually determined in the range of 0–1. Fig. 8d shows the Bode phase plot of the three samples. As can be seen in this plot, the phase angle in the intermediate frequency range was the lowest amount in the scaffolds with the Mg-6Zn-2GO formulation compared to the Mg-6Zn and Mg-6Zn-1GO samples so the highest corrosion resistance was observed for the Mg-6Zn-2GO samples. This resistance is in a lower level for the Mg-6Zn and Mg-6Zn-1GO samples, respectively. The Bode module diagram for the three samples is shown in Fig. 8e. According to the results, the highest impedance can be observed in the Mg-6Zn-2GO sample which resulted in the highest corrosion resistance.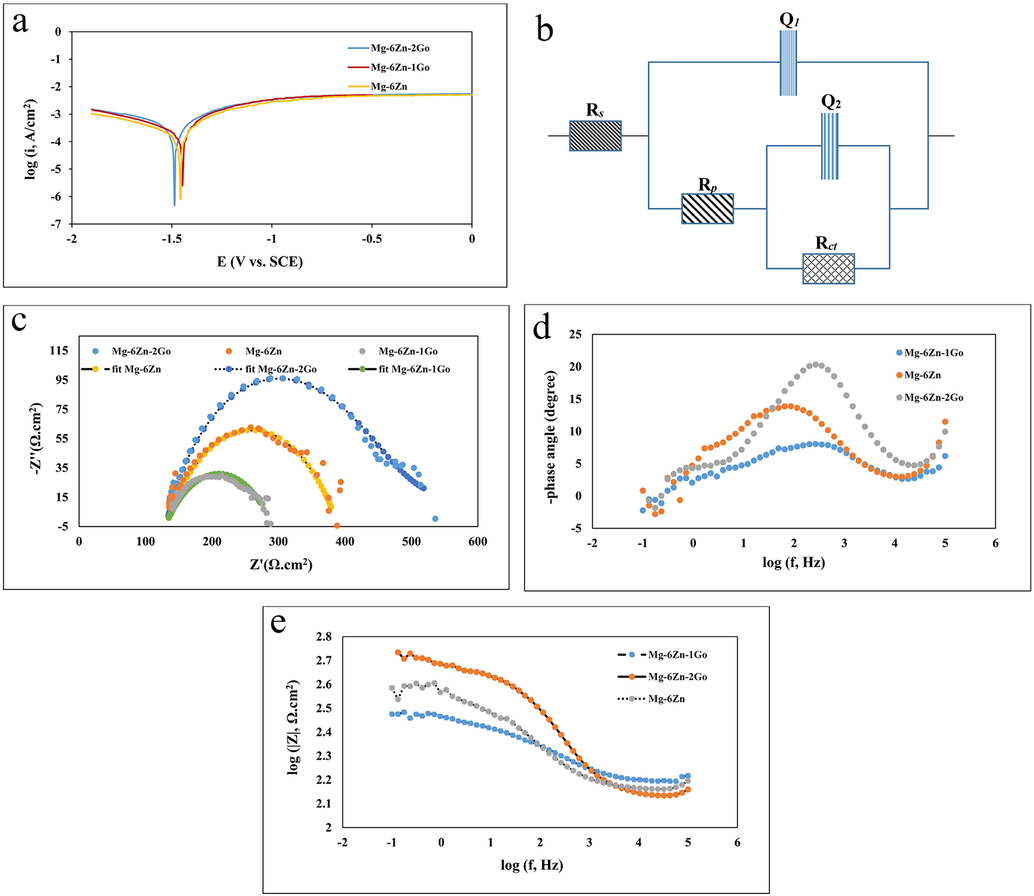
(a) Potentiodynamic polarization curves diagrams of the samples immersed in SBF, (b) Equivalent electric circuit employed to fit Nyquist diagram data, (c) Nyquist diagrams and fit diagrams for samples, (d) Bode phase diagrams for samples, (e) Bode module diagrams for samples.
Scaffold
Ecorr (V)
icorr (µA/cm2)
Rp (Ω.cm2)
Corrosion rate (mm/year)
Mg-6Zn
−1.453 ± 0.009
912 ± 4
41 ± 4
10.602 ± 0.002
Mg-6Zn-1GO
−1.485 ± 0.008
1276 ± 3
35 ± 3
14.832 ± 0.003
Mg-6Zn-2GO
−1.456 ± 0.006
779 ± 4
55 ± 2
9.055 ± 0.002
Scaffold
Rs (Ω.cm2)
Q1 (F.cm−2)
n1
Rp (Ω.cm2)
Q2 (F.cm−2)
n2
Rct (Ω.cm2)
Mg-6Zn
142.2
4.016E-7
0.570
108.9
1.000E-20
0.228
144
Mg-6Zn-1GO
150.0
8.588E-7
0.492
30
1.00E-20
0.344
122.3
Mg-6Zn-2GO
133.3
3.711E-7
0.706
129.9
1.120E-13
0.165
350
Fig. 9 shows the weight loss percentage of the samples after 24 h and 7 days of immersion in PBS solution. Based on the results, the lowest percentage of weight loss or in other words the highest corrosion resistance was seen in the Mg-6Zn-2GO sample. Regarding the corrosion resistance, the formulations including Mg-6Zn and Mg-6Zn-1GO were in a lower level compared to Mg-6Zn-2GO samples, respectively but there was no remarkable difference between the last two mentioned (P ≥ 0.05). The changes in pH of the samples compared to the initial pH of PBS solution (7.40) after 1, 3, 5, and 7 days have been shown in Fig. 10. It is evident that the pH of the samples increased rapidly after 24 hrs of immersion in PBS (compared to the initial pH of the PBS solution (pH = 7.4)). The rapid rise in pH is due to the low corrosion resistance of magnesium. Magnesium corrosion reactions in physiological environments are as follows (Cruz et al., 2018):
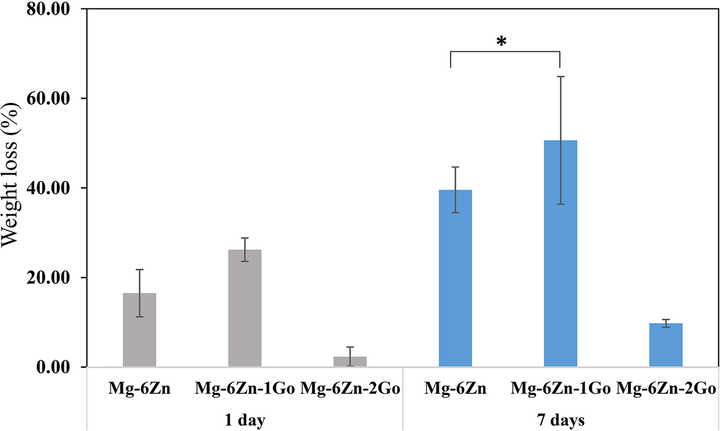
Weight loss percentage of the samples after 1, and 7 immersion days. (*P ≥ 0.05).
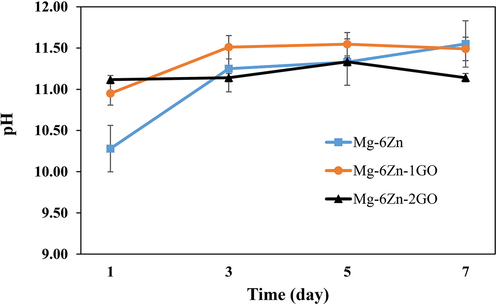
Ph changes after 1, 3, 5, and 7 immersion days (the initial ph of the solution was about 7.40).
Magnesium has a high tendency to dissolve in aqueous media due to its negative standard equilibrium potential (−2.4 V). Magnesium corrosion occurs due to the dissolution of anodic metal, decomposition of water (cathode), formation of hydrogen gas, and alkalinization of the environment. The porous scaffold reacts with the PBS solution at the beginning of immersion to produce magnesium hydroxide (Mg(OH)2) and hydrogen gas (reaction (5)). Mg(OH)2 precipitates on the surface of the scaffold, dissolves slightly in water, and acts as a protective layer against corrosion. But this protective layer can react with Cl− ions and be destroyed (Reaction (6)). In fact, Cl− ions penetrate to the protective layer and weaken it and change the scaffold from non-degradable to localize degradable caused by corrosion. When reaction (6) is completed, the concentration of OH− ions in PBS solution increases. The rapid rise in pH at the beginning of immersion can be attributed to the over-release of OH− ions. After three days, the process of increasing the pH for all samples is done with a smaller slope which can be attributed to the creation of more balance between all ions in the environment compared to the initial state (Cruz et al., 2018). The pH rose much slower in Mg-6Zn-2GO compared to other formulations and after 7 days, its final pH was by far the lowest (P < 0.05). This observation was related to the lower degradation rate of Mg-6Zn-2GO (Fig. 9) which then resulted in less release of magnesium ions.
To identify the corrosion product layer formed on the surface of the samples, the XRD technique was used. According to the XRD pattern (Fig. 11), the corrosion products formed on the surface of samples containing Mg(OH)2, MgO, and some metallic magnesium. In addition, the amount of sediments formed on the surface of Mg-6Zn-2GO samples was considerable which can be correlated to a higher level of superficial porosity and its contact surface with the solution.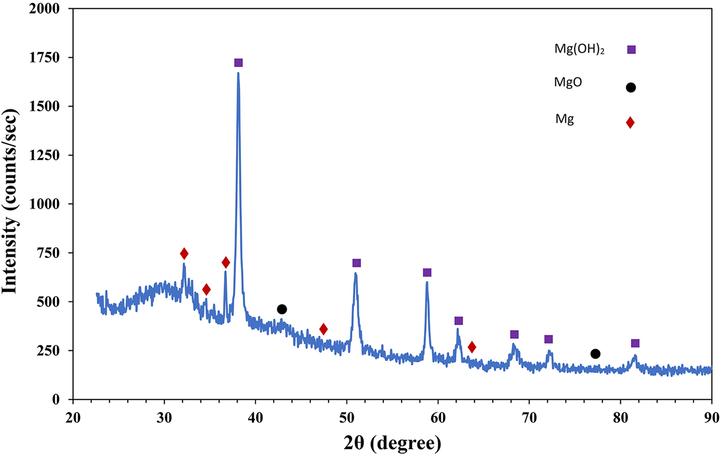
XRD pattern of the corrosion products formed on the Mg-6Zn-2GO sample after immersion in PBS for 7 days.
Based on the results of ECP and the immersion test, the data were in good correlation with each other which both tests supported the idea that Mg-6Zn-2GO samples were the best scaffolds regarding to corrosion resistance. Furthermore, the mentioned sample had the highest mechanical strength than Mg-6Zn. it should be noticed that the difference in mechanical strength was not significant compared to the Mg-6Zn-1GO sample. The porosity percentage of Mg-6Zn-2GO was also by far the highest compared to Mg-6Zn-1GO and Mg-6Zn, respectively.
3.4 Cell viability
Fig. 12 display the results of the cytotoxicity assessment test (MTT). Based on the results, the viability of the L-929 cells after 24 and 72 h at the concentration of 10% is more than other extract concentrations of 50% and 100%, respectively. It may be due to the enhancement of ions such as magnesium and zinc by increasing the extract concentration which leads to cytotoxicity. After 24 h, the cell viability in the extracts with 10% and 50% concentrations was almost the same in all three samples. It should be mentioned that this result for samples containing graphene oxide was not tangible (P ≥ 0.05). In addition, mean cell viability more than 80% presented non-cytotoxicity of extracts as their important feature. After 72 h, the cell viability percentage in contact with Mg-6Zn extracts with a concentration of 10 and 50% was upper than two samples containing graphene oxide and the results of samples containing graphene oxide were significantly different (P < 0.05). The Mg-6Zn-2GO sample showed an increase in cell viability while the rate was weaker in comparison to the Mg-6Zn samples.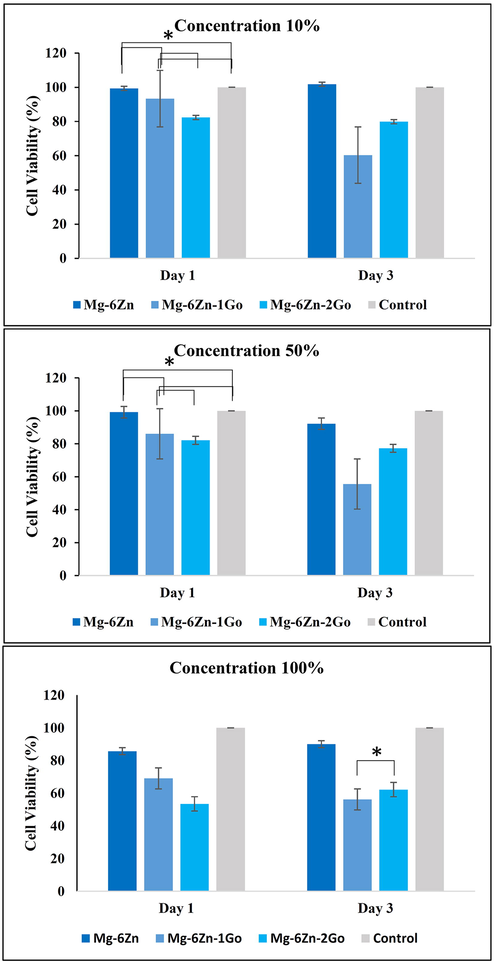
Results of cytotoxicity assessment test (MTT) after 1, and 3 days at 10, 50, and 100% concentrations (*P ≥ 0.05).
Table 6 provides the results of the ICP test related to the amount of magnesium ions and zinc ions released in the extracts and these results are regarding the initial extract (100%) prior to dilution into concentrations of 50 and 10%. According to the ICP results provided in Table 6, the amount of magnesium and zinc ions released in the extracts of samples containing graphene oxide was higher compared to the Mg-6Zn samples which then resulted in higher cytotoxicity. The reason for higher cell viability rate in Mg-6Zn-2GO compared to Mg-6Zn-1GO extracts can be correlated to the increase of zinc ions concentration from 1 to 2 ratio (Table 6). Zinc as a trace element has stimulatory effect on in vitro and in vivo bone formation and added into composite biomaterials to develop zinc-releasing composites to promote bone formation (Cruz et al., 2018).
Scaffold
Mg ion (μmol)
Zn ion (μmol)
Mg-6Zn
756
1.58
Mg-6Zn-1GO
838
2.11
Mg-6Zn-2GO
873
4.12
Following 24 and 72 h, the cell viability in all extracts with concentration of 100% decreased which was due to the containing of more magnesium and zinc ions. Furthermore, the cell viability rate of Mg-6Zn extract was higher which was completely vice versa in samples containing graphene oxide. Moreover, there was a significant difference (P < 0.05) between samples containing graphene oxide on first day (Mg-6Zn-1GO sample increased cell viability). Despite the higher cell viability rate in Mg-6Zn-2GO samples after 72hrs, there was no evidence of significant difference compared to Mg-6Zn-1GO sample (P ≥ 0.05). The reason for the increase in cell viability for the Mg-6Zn-2GO sample can be attributed to the higher amount of zinc ions which increased the L-929 cell viability. It should be noted that higher porosity and lower corrosion rate of Mg-6Zn-2GO scaffolds effect on cell behavior improvement.
4 Conclusion
In this study, porous biodegradable Mg-6Zn, Mg-6Zn-1GO, and Mg-6Zn-2GO scaffolds were fabricated by the powder metallurgy method using carbamide spacer agent and then investigated for bone tissue engineering applications. According to the Archimedes test and SEM images, the surface porosity percentage and the pore size of scaffolds were estimated to be 40-46% and 200–500 μm, respectively. By adding graphene oxide to the structure, the mechanical properties of the scaffolds were improved from 5 to 8 MPa. The results of the electrochemical corrosion and immersion test were in line with each other which presented better corrosion resistance of Mg-6Zn-2GO samples compared to other samples with different formulations. The results of the cytotoxicity test of the mentioned sample were also biocompatible; the MTT assay proved that the extract of Mg-6Zn-2GO scaffolds was not cytotoxic in contact with L-929 cells. Overall, the Mg-6Zn-2GO composite scaffold can be introduced as a suitable biomaterial for bone tissue engineering applications.
Acknowledgments
The authors acknowledge the support of University of Isfahan (UI) in IRAN.
Declaration of Competing Interest
The authors declare that they have no known competing financial interests or personal relationships that could have appeared to influence the work reported in this paper.
References
- Fabrication and finite element simulation of antibacterial 3D printed Poly L-lactic acid scaffolds coated with alginate/magnesium oxide for bone tissue regeneration. Int. J. Biol. Macromol.. 2023;224:1152-1165.
- [CrossRef] [Google Scholar]
- Does the incorporation of zinc into calcium phosphate improve bone repair? A systematic review. Ceram. Int.. 2018;44(2):1240-1249.
- [CrossRef] [Google Scholar]
- Calcium orthophosphate coatings on magnesium and its biodegradable alloys. Acta Biomater.. 2014;10(7):2919-2934.
- [CrossRef] [Google Scholar]
- Processing and degradation behavior of porous magnesium scaffold for biomedical applications. Adv. Powder Technol.. 2017;28(12):3204-3212.
- [CrossRef] [Google Scholar]
- Bone biomaterials and interactions with stem cells. Bone Res.. 2017;5(1):1-33.
- [CrossRef] [Google Scholar]
- Mechanical characteristics of biodegradable magnesium matrix composites: A review. J. Magnesium Alloys. 2017;5(2):189-201.
- [CrossRef] [Google Scholar]
- In vitro degradation behavior and cytocompatibility of Mg-6Zn-Mn alloy. Mater. Lett.. 2018;228:77-80.
- [CrossRef] [Google Scholar]
- Scaffolds of hydroxyl apatite nanoparticles disseminated in 1, 6-diisocyanatohexane-extended poly (1, 4-butylene succinate)/poly (methyl methacrylate) for bone tissue engineering. Mater. Sci. Eng. C. 2017;71:780-790.
- [CrossRef] [Google Scholar]
- Nanotechnology for tissue engineering: need, techniques and applications. J. Pharm. Res.. 2013;7(2):200-204.
- [CrossRef] [Google Scholar]
- The influence of biodegradable magnesium alloys on the osteogenic differentiation of human mesenchymal stem cells. J. Biomed. Mater. Res. A. 2014;102(12):4346-4357.
- [CrossRef] [Google Scholar]
- Experimental measurement and simulation of mechanical strength and biological behavior of porous bony scaffold coated with alginate-hydroxyapatite for femoral applications. Compos. Sci. Technol.. 2021;214:108973.
- [CrossRef] [Google Scholar]
- Additively manufactured biodegradable porous magnesium. Acta Biomater.. 2018;67:378-392.
- [CrossRef] [Google Scholar]
- Comparative in vitro study on binary Mg-RE (Sc, Y, La, Ce, Pr, Nd, Sm, Eu, Gd, Tb, Dy, Ho, Er, Tm, Yb and Lu) alloy systems. Acta Biomater.. 2020;102:508-528.
- [CrossRef] [Google Scholar]
- Magnesium/nano-hydroxyapatite porous biodegradable composite for biomedical applications. Mater. Res. Express. 2019;6(7):075408.
- [CrossRef] [Google Scholar]
- Production and fluoride treatment of Mg-Ca-Zn-Co alloy foam for tissue engineering applications. Trans. Nonferrous Met. Soc. Chin.. 2018;28(1):114-124.
- [CrossRef] [Google Scholar]
- Coating the magnesium implants with reinforced nanocomposite nanoparticles for use in orthopedic applications. Colloids Surf A Physicochem. Eng. Asp. 2021;621:126581
- [CrossRef] [Google Scholar]
- In vitro cytotoxicity studies of surface modified CaS nanoparticles on L929 cell lines using MTT assay. Mater. Lett.. 2019;236:637-639.
- [CrossRef] [Google Scholar]
- Bone tissue engineering: state of the art and future trends. Macromol. Biosci.. 2004;4(8):743-765.
- [CrossRef] [Google Scholar]
- Effect of Zr (rare earth) powder in the microstructure, tensile and compressive properties on Mg-6Zn alloy. Met. Powder Rep. 2021
- [CrossRef] [Google Scholar]
- Synthesis, microstructure and mechanical properties of porous Mg-Zn scaffolds. J. Mech. Behav. Biomed. Mater.. 2013;21:1-8.
- [CrossRef] [Google Scholar]
- In vitro biodegradability and biocompatibility of porous Mg-Zn scaffolds coated with nano hydroxyapatite via pulse electrodeposition. Trans. Nonferrous Met. Soc. Chin.. 2015;25(12):4018-4027.
- [CrossRef] [Google Scholar]
- Additive manufacturing of biodegradable magnesium implants and scaffolds: Review of the recent advances and research trends. J. Magnesium Alloys. 2021;9(2):392-415.
- [CrossRef] [Google Scholar]
- Tan, J., Ramakrishna, S., 2021. Applications of Magnesium and its Alloys: A Review. https://doi.org/10.3390/app11156861.
- Fabrication and characterization of magnesium scaffold using different processing parameters. Mater. Res. Express. 2018;5(3):035407
- [CrossRef] [Google Scholar]
- Enhanced corrosion and wear resistances by graphene oxide coating on the surface of Mg-Zn-Ca alloy. Carbon. 2016;109:340-351.
- [CrossRef] [Google Scholar]
- Strong and bioactive gelatin–graphene oxide nanocomposites. Soft Matter. 2011;7(13):6159-6166.
- [CrossRef] [Google Scholar]
- Selective laser melting of Mg-Zn binary alloys: effects of Zn content on densification behavior, microstructure, and mechanical property. Mater. Sci. Eng. A. 2019;756:226-236.
- [CrossRef] [Google Scholar]
- Characterization and corrosion properties of hydroxyapatite/graphene oxide bio-composite coating on magnesium alloy by one-step micro-arc oxidation method. Surf. Coat. Technol.. 2017;317:125-133.
- [CrossRef] [Google Scholar]
- Improvement of the mechanical properties and corrosion resistance of biodegradable β-Ca3 (PO4) 2/Mg-Zn composites prepared by powder metallurgy: the adding β-Ca3 (PO4) 2, hot extrusion and aging treatment. Mater. Sci. Eng. C. 2017;74:582-596.
- [CrossRef] [Google Scholar]
- Development and degradation behavior of magnesium scaffolds coated with polycaprolactone for bone tissue engineering. Mater. Lett.. 2014;132:106-110.
- [CrossRef] [Google Scholar]
- Interfacial design and strengthening mechanisms of AZ91 alloy reinforced with in-situ reduced graphene oxide. Mater Charact. 2018;138:215-228.
- [CrossRef] [Google Scholar]
- Synthesis and characterization of TiO2/graphene oxide nanocomposites for photoreduction of heavy metal ions in reverse osmosis concentrate. RSC Adv.. 2018;8(60):34241-34251.
- [CrossRef] [Google Scholar]
- Research on an Mg–Zn alloy as a degradable biomaterial. Acta Biomater.. 2010;6(2):626-640.
- [CrossRef] [Google Scholar]


