

Translate this page into:
Magnetic Fe3O4/ZIF-8 optimization by Box-Behnken design and its Cd(II)-adsorption properties and mechanism
⁎Corresponding authors at: State Key Laboratory of Simulation and Regulation of Water Cycle in River Basin, China Institute of Water Resources and Hydropower Research, Beijing 100038, China (Y. Jia). School of Civil Engineering, Nanjing Forestry University, Longpan Road 159#, Nanjing 210037, China(Z. Wang) jiayn@iwhr.com (Yannan Jia), wangzheng@njfu.edu.cn (Zheng Wang)
-
Received: ,
Accepted: ,
This article was originally published by Elsevier and was migrated to Scientific Scholar after the change of Publisher.
Peer review under responsibility of King Saud University.
Abstract
In this study, the preparation of magnetic Fe3O4/ZIF-8 (MFZ) and its adsorption properties for Cd(II) from water were investigated. Various characterizations demonstrate that the as-prepared MFZ has well magnetic-separation performance and thermal stability. In batch adsorption tests, the effects of pH, initial concentration, and adsorbent dosage were evaluated. According to the findings, when the pH is 7 and the dosage is 150 mg/L, the adsorption capacity for a 40 mg/L Cd(II) solution reaches 102.3 mg/g in 180 min. The Cd(II) adsorption processes was found to correspond to pseudo-first-order kinetics and Langmuir model according to the adsorption kinetics and isotherms. The Langmuir model predicted a maximal saturation adsorption capacity of 160.26 mg/g at 298 K. Thermodynamic analysis revealed that the Cd(II) adsorption is an endothermic, spontaneous process. Ion exchange, coordination reaction, and electrostatic interaction are all involved in Cd(II) adsorption by MFZ. The optimum conditions for Cd(II) adsorption were proposed and confirmed in accordance with the results of the response surface optimization experiments. Furthermore, regeneration tests demonstrate the great repeated regeneration ability of MFZ. According to the anticipated production cost, treating wastewater with a Cd(II) concentration of 40 mg/L would cost roughly US$ 8.35/m3. MFZ showed good potential for Cd(II) removal from water.
Keywords
Fe3O4/ZIF-8
Cd(II) adsorption
Mechanism
Optimization

1 Introduction
With ongoing industrialization, industrial wastewater containing high concentrations of heavy metal ions is discharged into the environment, polluting water bodies and soils (Gautam et al., 2014). This poses a threat to human health with the enrichment effect of the biological chain (Ye et al., 2021). Cadmium is a very toxic metal and is widely used in electroplating and pigments. Cadmium can slowly accumulate in the human body through the food chain, causing kidney damage, dysfunction of the stomach, enzyme-system dysfunction, and hypertension (Chowdhury and Yanful, 2013). Therefore, the treatment of cadmium-containing wastewater is critical.
Co-precipitation (Noronha et al., 2017), ion exchange (Wang et al., 2019a, 2019b), and membrane separation (Zhao et al., 2021) have been investigated for cadmium removal from water. However, adsorption has received particular attention owing to its low price, simple operation, and high efficiency (Alhumaimess, 2020). For example, Davis et al. applied a limestone-based material to remove cadmium from water, and found that it removed 99% of the cadmium and decreased the cadmium concentration to 0.0015 mg/L or lower (Davis et al., 2018). Wang et al. investigated the cadmium-removal performance of a magnetic graphene material prepared from a modified humic substance, showing that the maximum adsorption capacity of the material was 13.169 mg/g (Wang et al., 2020). Alhumaimess et al. examined the adsorption of cadmium in water by phosphorylated raw sawdust with a adsorption capacity of 244.3 mg/g (Alhumaimess et al., 2019).
Metal organic frameworks (MOFs) are porous materials with practical applications. MOFs have recently become an active research topic in electrochemistry owing to their regular shapes, numerous pores, large specific surface areas, and adaptability (Xu et al., 2018). MOFs have been investigated for drug delivery (Lawson et al., 2022), gas storage (Hu et al., 2020), and catalytic degradation (Latif et al., 2021). To date, hundreds of MOFs have been produced and tested for the adsorption of heavy metal ions. Yuan et al. were first to use amino-functionalized chromium-based MIL-101 materials for the removal of cobalt ions, and they reported a high adsorption capacity of 232.6 mg/g (Yuan et al., 2019). Yu et al. effectively prepared a Zn-based MOF-74 as an adsorbent to absorb As(V) and As(III) from aqueous solutions (Yu et al., 2019). Zhang et al. explored the adsorption performance of thiol-functionalized MOF-5, reporting an adsorption capacity of 90.66 mg/g for Cd(II) (Zhang et al., 2016). Yusuff et al. investigated the adsorption behavior of a Cu-MOF for Cd(II) from aqueous solutions with a monolayer adsorption capacity of 219.05 mg/g (Yusuff et al., 2019). These findings suggest that MOFs perform well in the removal of pollutants from water and are a promising adsorbent material, especially for Cd(II).
In this study, the adsorption performance of Fe3O4/ZIF-8 for Cd(Ⅱ) was investigated. Fe3O4 with magnetic characteristics was compounded with ZIF-8 to improve the adsorbent material's recyclability. The effects of different parameters (pH, temperature, contact time) on Cd(Ⅱ) adsorption were investigated. Moreover, response surface methodology (RSM) based on Box-Behnken design (BBD) was applied to evaluate the impact of independent components and their interactions to develop a meaningful mathematical model, which was optimized to identify the ideal adsorption conditions. Finally, the reusability of MFZ was investigated and its production cost was used to evaluate the material's practical application potential.
2 Materials and methods
2.1 Regents
Zinc nitrate hexahydrate (Zn(NO3)2·6H2O, 99%), hydrochloric acid (HCl, 37%), and nitric acid (HNO3, 65–68%) were purchased from Nanjing Chemical Reagent Co., Ltd. 2-Methylimidazole (C4H6N2, 98%) and ferric tetroxide (Fe3O4, 97%, 50–300 nm) were purchased from Shanghai Aladdin Biochemical Technology Co., Ltd.. Anhydrous methanol (CH3OH, 99.5%) and sodium hydroxide (NaOH, 96%) were purchased from Sinopharm Group Chemical Reagent Co., Ltd. Cadmium nitrate tetrahydrate (Cd(NO3)2·4H2O, 99%) and poly(sodium 4-styrenesulfonate), (C8H9NaO3S)n, Mw ∼ 70,000, powder) were purchased from Shanghai McLean Biochemical Technology Co., Ltd.. All remaining reagents were purchased from Nanjing Chemical Reagent Co., Ltd. All reagents were used directly without further purification.
2.2 Preparation of adsorbents
2.2.1 Synthesis of ZIF-8
ZIF-8 was made via a straightforward precipitation technique (Venna et al., 2010). Solution A was obtained by dissolving 1.5 g of Zn(NO3)2·H2O in 40 mL of anhydrous methanol, and solution B was produced by dissolving 3.3 g of 2-methylimidazole in 40 mL of anhydrous methanol. After stirring the solutions for 30 min, solution B was slowly added to solution A, and the mixture was rapidly stirred at room temperature for 3 h. After that, the mixture was left to mature at room temperature. After standing for 24 h, the turbid solution was centrifuged at 8,000 rpm and the solid was washed three times with anhydrous methanol. After drying the solid for 12 h at 60 °C in a vacuum oven, a white ZIF-8 powder sample was obtained.
2.2.2 Synthesis of MFZ
MFZ was prepared according to methods described in the literature, with some adjustments (Wu et al., 2019). First, 1.0 g of poly(sodium 4-styrenesulfonate) (PSS) was dissolved in 100 mL ultrapure water and sonicated for 30 min, resulting in a homogeneous translucent solution. Then, 500 mg of Fe3O4 nanoparticles were added to the PSS solution and sonicated for 30 min before being separated with a magnet and cleaned three times with ultrapure water. The Fe3O4 nanoparticles were added to 100 mL of a methanol solution containing 1.1 g 2-methylimidazole and 0.5 g Zn(NO3)2·H2O. After 3 h mechanical stirring at room temperature, the obtained MFZ particles were separated from the solution with a magnet, washed three times with ultrapure water, and dried overnight in a vacuum drying oven at 60 °C to acquire MFZ as a black solid powder. Similarly, MFZ materials were prepared using 250 and 750 mg Fe3O4, and the three resultant magnetic materials were labeled MFZ-250, MFZ-500, and MFZ-750. The synthesis path of MFZ is shown in Fig. 1.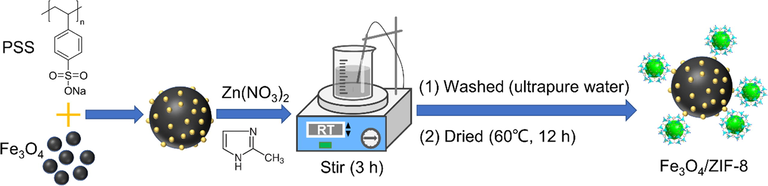
Synthesis path of MFZ.
2.3 Sample characterization
The crystal structures of the samples were determined by X-ray diffraction (XRD; Ultima IV, Rigaku, Japan). The Cu-k X-ray generator had a power of 3 kW, a scanning speed of 0.02°/s, and a test range of 5–50°.
High-resolution images of gold-plated samples were acquired using scanning electron microscopy (SEM; JSM-7600f, Jeol, Japan; accelerating voltage 20 kV) to investigate the materials' morphologies.
Fourier-transform infrared spectroscopy (FT-IR, Nicolet IS5, Thermo Scientific, USA) in the wavenumber range 400–4000 cm−1 was used to examine the chemical compositions of the samples.
An automatic specific surface area and pore size analyzer was used to determine the Brunauer-Emmett-Teller (BET, ASAP2020, and HD88, Micromeritics, USA) specific surface areas, pore-size distributions, and pore volumes of the materials.
After degassing at 150 °C for 24 h, N2 adsorption–desorption isotherms were obtained at 196 °C (heating rate 10 °C/min, N2 flow rate 30 mL/min, test range ambient temperature to 800 °C).
Thermogravimetric analysis (TGA) was used to assess the samples' thermal stability (Q500, Ta, USA).
For the sample surface elements, X-ray photoelectron spectroscopy (XPS; ESCALAB 250Xi, Thermo Scientific, USA) was used to determine species, valence, and composition.
Vibrating sample magnetometry (VSM; PPMS-9 T, Quantum Design, USA, −20 to 20 kOe) was used to investigate the magnetic properties of the samples.
2.4 Batch adsorption
A specified amount of adsorbent was introduced to a centrifuge tube containing 40 mL of 40 mg/L Cd(II), and the tube was placed at 160 rpm and 298 K in a constant-temperature shaker. To investigate the effect of pH, the solution was pH-adjusted in the range 1–7 using 0.1 mol/L HNO3 and 0.1 mol/L NaOH. Furthermore, the effects of NaCl, Na2SO4, Na2CO3, MgCl2, BaCl2, Hg(NO3)2, Pb(NO3)2, and CaCl2 at different concentrations (50 and 100 mg/L) on Cd(II) adsorption by MFZ were studied. In regeneration experiments, the adsorbent was washed three times with 0.1 mol/L NaOH and ultrapure water alternately, then dried at 60 °C for 12 h. After the adsorption reaction, the sample was filtered with a 0.22-μm filter and then analyzed using flame atomic absorption spectroscopy at a wavelength of 228.8 nm. The adsorption capacity (Qe, mg/g) and removal rate (R, %) were estimated using formulae (2.1) and (2.2).
2.5 Adsorption kinetics
Pseudo-first-order (PFO), pseudo-second-order (PSO), and intra-particle diffusion (ID) kinetic models were utilized to interpret the Cd(II)-adsorption data, identify the potential rate-limiting steps, and understand the adsorption mechanism more deeply. The formulas for the PFO, PSO, and ID kinetic models are shown in Eqs. (2.3), (2.4), and (2.5) (Deng et al., 2013; Ghaedi et al., 2016; Zhuang et al., 2009).
2.6 Adsorption isotherms
The Langmuir, Freundlich, and Temkin isotherm models were chosen to fit the data and explain the correlations. They are described by the linear Eqs. (2.6), (2.7), and (2.8), respectively (Kundu et al., 2018; Nimibofa et al., 2017).
2.7 Adsorption thermodynamics
The thermodynamic parameters of Cd(II) adsorption by MFZ, such as ΔG0 (free energy change), ΔH0 (enthalpy change), and ΔS0 (entropy change) were calculated using Eqs. (2.9), (2.10), and (2.11) (Kumar et al., 2011).
2.8 RSM optimization
The BBD model was applied to optimize the Cd(II) adsorption experiments. Adsorbent dosage (A), pH (B), and temperature (C) were chosen as independent variables, with Cd(II) adsorption capacity being the response variable. Seventeen MFZ samples were prepared for the adsorption of a 40 mg/L Cd(II) solution based on the BBD results. Table 1 shows the value range and design levels of the independent variables.
Factor
Unit
Code
Level
Low (−1)
Central (0)
High (+1)
Dosage
mg/L
A
50
150
250
pH
—
B
5
6
7
Temperature
K
C
298
308
318
Various statistical studies, including analysis of variance (ANOVA), three-dimensional surface plots, and fitting statistics, were used in the optimization experiments to forecast the ideal preparation conditions and their interactions using Design-Expert 12 software. A binary regression equation, as given below, describes the relationship between the response variable (Y) and the independent variable (X) (Eq. (2.12)).
Run
Dosage (mg/L)
pH
Temperature (K)
Actual Qe (mg/g)
Predicted Qe (mg/g)
1
150
5
318
105.48
107.18
2
150
7
318
125.77
122.85
3
250
6
318
91.76
92.25
4
50
5
308
153.28
150.85
5
250
6
298
69.44
68.71
6
150
6
308
97.65
97.65
7
50
6
298
155.32
154.83
8
150
6
308
97.65
97.65
9
150
7
298
104.3
102.6
10
150
6
308
97.65
97.65
11
50
7
308
178.39
180.58
12
50
6
318
184.82
185.55
13
150
6
308
97.65
97.65
14
250
5
308
70.51
68.32
15
250
7
308
81.26
83.69
16
150
6
308
97.65
97.65
17
150
5
298
70.25
73.17
3 Results and discussion
3.1 Characterization
3.1.1 XRD analysis
Fig. 2 shows the XRD patterns of Fe3O4, ZIF-8, and MFZ. The presence of crystallographic feature peaks (0 1 1), (0 0 2), (1 1 2), (0 2 2), (0 1 3), and (2 2 2) corresponding to ZIF-8 at 2θ = 7.5°, 10.5°, 12.5°, 14.7°, 16.2°, and 18.0° for the synthesized MFZ confirms that the structure of ZIF-8 did not change during the synthesis of MFZ (Sanati et al., 2019). Furthermore, distinctive diffraction peaks corresponding to the (2 2 0), (3 1 1), (4 0 0), (4 2 2), (5 1 1), (4 4 0), and (5 3 3) crystal faces of Fe3O4 are evident at 2θ = 30.3°, 35.5°, 43.3°, 53.4°, 56.9°, 62.7°, and 74.0° (Jiang et al., 2021). These findings show that Fe3O4 was successfully compounded with ZIF-8, and that MFZ was successfully prepared. Generally, the generated MFZ exhibits Fe3O4′s magnetism while also possessing ZIF-8′s excellent absorption properties.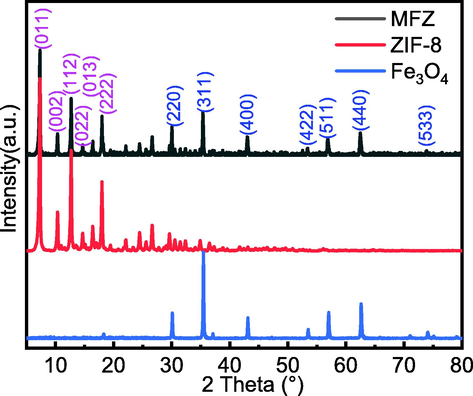
XRD patterns of ZIF-8, Fe3O4, and MFZ.
3.1.2 SEM analysis
Fig. 3 shows the SEM images of ZIF-8, Fe3O4, and MFZ. The ZIF-8 crystals have a polyhedral structure with a uniform particle distribution and a particle size of ∼150 nm, which is in agreement with prior results (Fu et al., 2022). ZIF-8 is dispersed across the surface of Fe3O4, and its XRD pattern reveals that ZIF-8 and Fe3O4 have been successfully compounded. Furthermore, because Fe3O4 has significant magnetic properties and magnetic-separation ability, the composite material has magnetic-separation ability as well.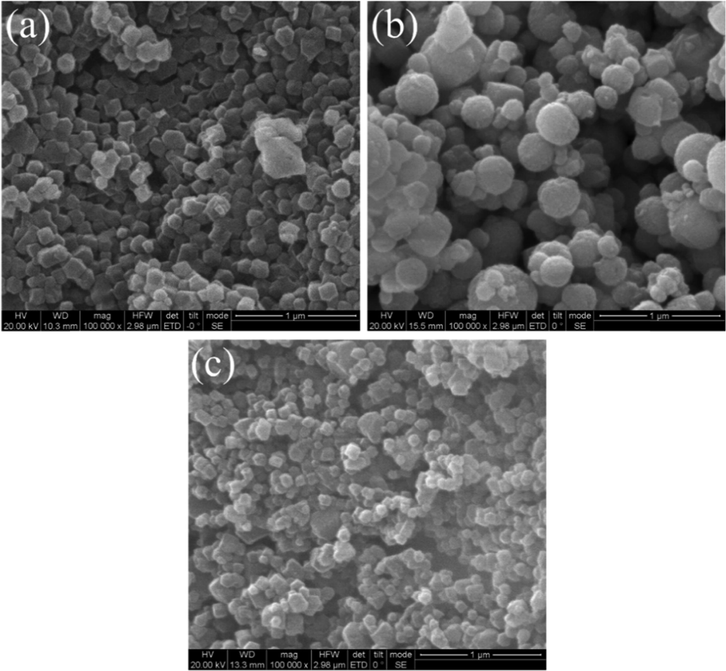
SEM images of (a) ZIF-8, (b) Fe3O4, and (c) MFZ.
3.1.3 BET analysis
Fig. 4 shows the N2 adsorption/desorption isotherms and pore size distributions of ZIF-8 and MFZ. ZIF-8 and MFZ present type-I and -IV isotherms, respectively, indicating that the structure of ZIF-8 has a substantial number of micropores. Furthermore, MFZ presents an H4-type hysteresis loop with a range of 0.45 < P/P0 < 1.0, revealing that it has a hierarchical porous structure with micropores and mesopores (Bagheri et al., 2019). The specific surface area of MFZ is 371.09 m2/g after Fe3O4 is introduced, which is significantly lower than that of the original ZIF-8 (983.44 m2/g) owing to the heavier and non-porous Fe3O4 particles. However, the addition of Fe3O4 does not affect the adsorption properties of ZIF-8. MFZ also exhibits a reduced pore capacity of 0.319 cm3/g compared to that of ZIF-8 (0.443 cm3/g), which is attributed to the Fe3O4 nanoparticles encapsulated in ZIF-8. Furthermore, adding Fe3O4 increases particle pore size, allowing the adsorbate to penetrate the material and the adsorption reaction to occur on its surface and inside the pores.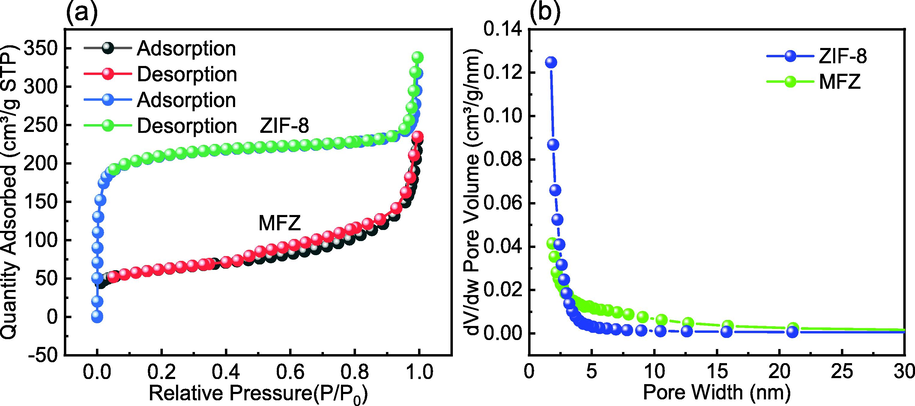
N2 adsorption–desorption curves for ZIF-8 and MFZ.
3.1.4 FTIR analysis
Fig. 5 shows the FT-IR spectra of ZIF-8 and MFZ. The characteristic peaks induced by the stretching vibration absorption of C—H appear at 2930 and 3135 cm−1, respectively, which correspond to the saturated hydrocarbon C—H (CH3) and the unsaturated hydrocarbon C—H of 2-methylimidazole. Furthermore, the lack of broad peaks at wavenumbers between 3300 and 3500 cm−1 is attributable to Zn binding to N—H on the 2-methylimidazole ligand (Tsai et al., 2019). The stretching vibration of Zn—N is responsible for the sharp peak at 423 cm−1, which also indicates that Zn is linked to N successfully (Nagarjun and Dhakshinamoorthy, 2019). Moreover, a new characteristic peak in MFZ is observed at 583 cm−1, which is caused by the stretching vibration of Fe—O, confirming that Fe3O4 and ZIF-8 were successfully combined (Pelalak et al., 2021). Additionally, the characteristic peak in the range of 700–1600 cm−1 is the peak for the 2-methylimidazole ligand, and the stretching vibration peak of the C⚌N bond in the imidazole ring appears at 1584 cm−1, revealing that Fe3O4 does not cause the disappearance of 2-methylimidazole organic ligand (Sun et al., 2020). It may be deduced that the functional groups on the composite, such as Fe—O, C⚌N, and Zn—N, will provide ample active sites for Cd(II) adsorption.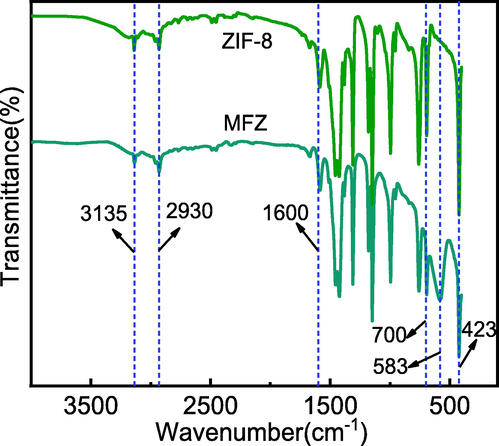
FTIR spectra of ZIF-8 and MFZ.
3.1.5 XPS analysis
XPS was utilized to analyze the chemical properties of the composite MFZ surface. The full-scan spectrum of MFZ is shown in Fig. 6(a), confirming the presence of C, N, O, Fe, and Zn, and their proportions are 63.82%, 16.77%, 7.46%, 3.78%, and 8.17% respectively. The fine C 1s spectra are depicted in Fig. 6(b), which was deconvoluted into two peaks: C⚌C/C—C at 284.73 eV and C—N/C—H at 285.79 eV (Wang et al., 2019a, 2019b). Peaks at 398.95 and 400.05 eV are observed in the N 1s XPS spectrum of in Fig. 6(c), corresponding to pyridine N and N—Zn, respectively. The O 1s spectrum in Fig. 6(d) can be divided into two peaks centered at 531.10 and 532.15 eV, corresponding to complexed Fe3O4 and Zn—O, respectively, confirming that Fe3O4 was successfully complexed with ZIF-8 and that PSS reacts with the Zn element. Fig. 5(e) displays the revised Zn 2p spectrum with peaks at 1045.02 and 1022.02 eV, matching the conventional Zn 2p1/2 and Zn 2p3/2 peaks, respectively, demonstrating the existence of divalent Zn in the as-synthesized magnetic MFZ.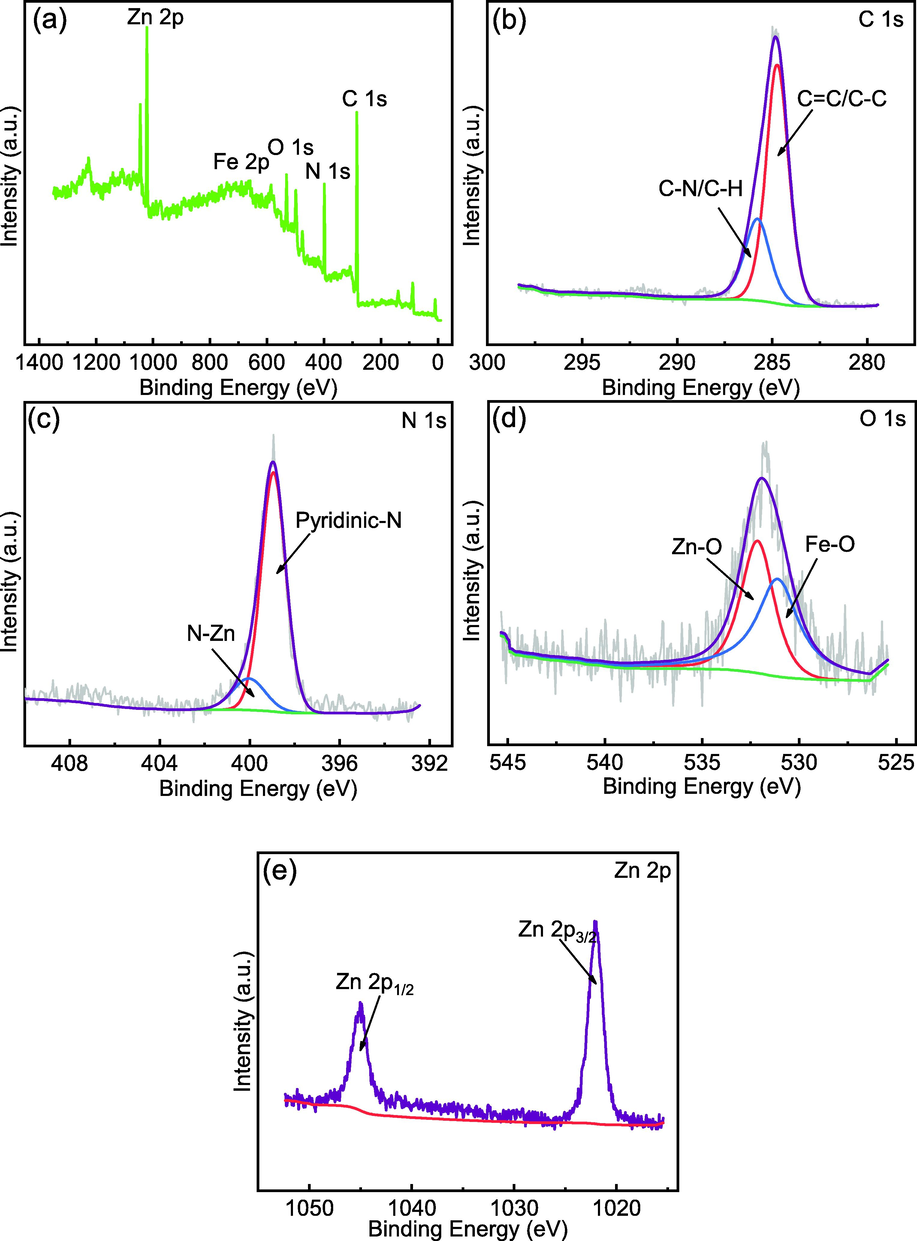
XPS spectra of MFZ: (a) survey scan; (b) C 1s; (c) N 1s; (d) O 1s; (e) Zn 2p.
3.1.6 VSM analysis
A vibrating sample magnetometer was used to evaluate the magnetic characteristics of Fe3O4 and MFZ. The VSM curves of the prepared materials are shown in Fig. 7. The curves show that neither sample exhibits a hysteresis effect or coercivity at ambient temperature, showing that both samples are superparamagnetic (Feng et al., 2020). The magnetization strengths of Fe3O4 and MFZ are 66.28 and 12.59 emu/g, respectively, and even though MFZ's magnetization strength is much lower than that of Fe3O4, the insert pictures show that, under the action of an external magnet, MFZ can be separated from water in 20 s. The lowered magnetic strength of the composite may be attributed to its lower content of Fe3O4 and the non-magnetic properties of ZIF-8, which result in weaker magnetization. In general, introducing Fe3O4 particles to a composite makes the resultant material magnetic, allowing it to be recovered from water using magnetic separation and regenerated, lowering process costs.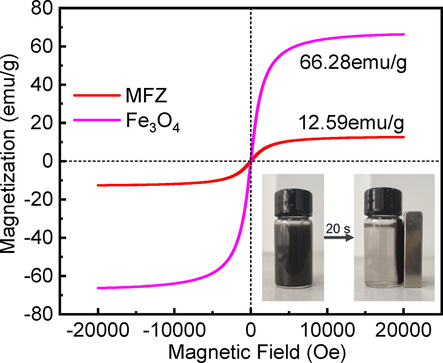
Hysteresis curves of ZIF-8 and MFZ.
3.1.7 TG analysis
Fig. 8 shows the TGA curves for ZIF-8 and MFZ at 1073 K and under N2 atmosphere. Both adsorbents have excellent thermal stability. Both adsorbents lose weight at 823 K, with ZIF-8 losing 7.62% and MFZ losing 6.35%, respectively, which can be attributed to residual water and organic solvent as well as unreacted 2-methyl imidazole. Because MFZ has a lower porosity and contains fewer leftover water molecules and chemical solvents, it loses less weight than ZIF-8 (Zhang et al., 2013). The weights of the two adsorbents decrease quickly with rising temperature when the temperature reaches 873 K, which is caused by the fracture of Zn–N bonds and the collapse of the organic framework. At 823 K, the thermal stability of MFZ is slightly better than that of ZIF-8 owing to the addition of Fe3O4, which improves the composite's stability. Nevertheless, both adsorbents exhibit strong thermal stabilities that are comparable with that previously reported for ZIF-8 (Wu et al., 2015).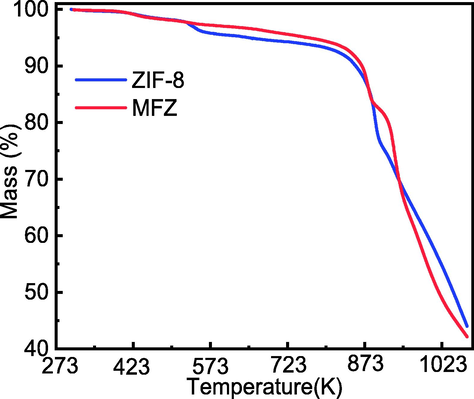
TGA curves for ZIF-8 and MFZ.
3.2 Adsorption performance
3.2.1 Effect of Fe3O4 loading
To explore the effect of Fe3O4 loading on Cd(Ⅱ) adsorption, the differences in Cd(II) adsorption capacity when the complex was prepared using 0, 250, 500, and 750 mg Fe3O4 were investigated. The other conditions were a temperature of 298 K, solution pH of 7, and Cd(II) concentration of 40 mg/L. The results are shown in Fig. 9.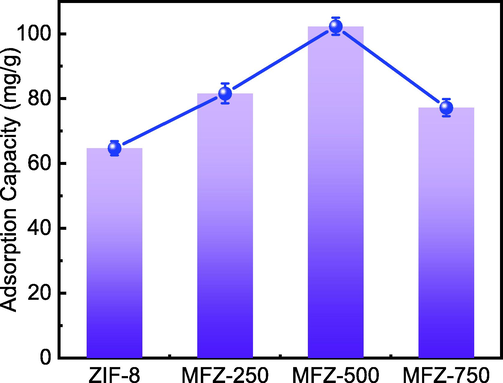
Effect of Fe3O4 loading on Cd(II) adsorption.
Fig. 9 shows that all the MFZ samples have a higher adsorption capacity than that of the original ZIF-8. According to the BET study, the pore size of the composite increases after Fe3O4 is added, which is advantageous to Cd(II) adsorption. However, as the Fe3O4 loading increases, the uptake capacity first increases then decreases, which could be due to excessive Fe3O4 causing particle aggregation and hampering surface contact of Cd(II). As a result, the adsorbent prepared with 500 mg Fe3O4 was chosen for all further study.
3.2.2 Effect of adsorbent dosage
The effect of adsorbent dose was evaluated under the following conditions: a temperature of 298 K, solution pH of 7, and 40 mg/L Cd(II). The changes in Cd(II) adsorption capacity when the adsorbent dosage increases from 50 to 450 mg/L are shown in Fig. 10. The removal rate of Cd(II) shows a rising trend as the dosage of MFZ increases from 50 to 450 mg/L owing to an increase in the amount of adsorbent and thus effective adsorption sites. However, as the dosage increases, the Cd(II) adsorption capacity decreases. Accordingly, an adsorbent dosage of 150 mg/L was set as optimal.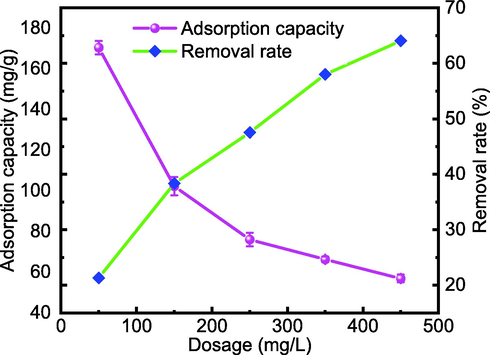
Effect of adsorbent dosage on Cd(II) adsorption capacity and removal rate.
3.2.3 Effect of solution pH
One of the most critical parameters impacting adsorption is a solution's initial pH value. Under the conditions of a Cd(II) concentration of 40 mg/L, adsorbent dose of 150 mg/L, and a temperature of 298 K, the effect of pH variation was studied. Because Cd(II) reacts with OH− to produce a Cd(OH)2 precipitate under alkaline conditions, the influence of pH over 7 on Cd(II) adsorption was not taken into account in this investigation. The results are shown in Fig. 11.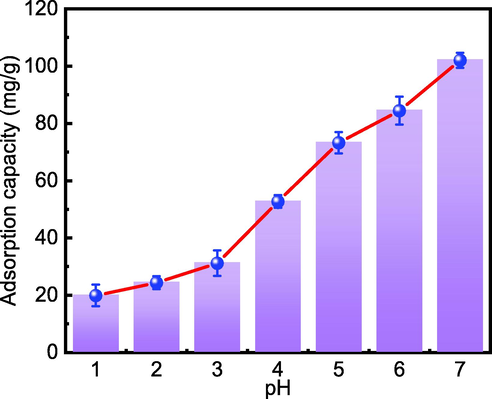
Effect of pH on the adsorption capacity of Cd(Ⅱ) on MFZ.
Initial pH clearly has a substantial effect on Cd(II) adsorption. The adsorption capacity increases with increasing pH in the range of 1–7, where Cd(II) is in the form of free Cd ions (Comte et al., 2008). As a result of the free H+ in the solution adhering to the adsorbent surface under acidic conditions, the adsorption capacity of Cd(II) decreases, reducing the number of effective adsorption sites and limiting Cd(II) contact with the adsorbent surface. The amount of H+ decreases as pH rises, exposing effective adsorption sites on the surface of MFZ and enhancing the contact opportunity between Cd(II) and MFZ, as evidenced by an increase in adsorption capacity. It is also demonstrated that electrostatic interactions influence Cd(II) adsorption.
3.2.4 Effect of ionic strength
Different ions frequently coexist with Cd(II) in the environment, and these ions can either promote or prevent Cd(II) adsorption. Thus, it is vital to investigate the influence of coexisting ions. The effects of NaCl, Na2SO4, Na2CO3, MgCl2, BaCl2, CaCl2, Hg(NO3)2, and Pb(NO3)2 on Cd(II) adsorption were studied. Under the conditions of a pH of 7 and a temperature of 298 K, the difference in adsorption capacity with 50 and 100 mg/L coexisting ionic precursors added to a solution containing Cd(II) was determined and compared after 180 min.
In the presence of NaCl, Na2SO4, MgCl2, BaCl2, Hg(NO3)2, and Pb(NO3)2, the adsorption effect of MFZ on Cd(II) is hindered to varying degrees, as shown in Fig. 12. The inhibition increases with ion concentration, indicating that these ions compete with Cd(II) for adsorption sites, resulting in a decrease in Cd(II) adsorption capacity. In addition, Mg2+, Ba2+, Ca2+, Hg2+, and Pb2+ are adsorbed on the adsorbent surface, which is positively charged, causing electrostatic repulsion of Cd(II) and obstructing interactions between Cd(II) and adsorption sites, resulting in a reduction in adsorption capacity.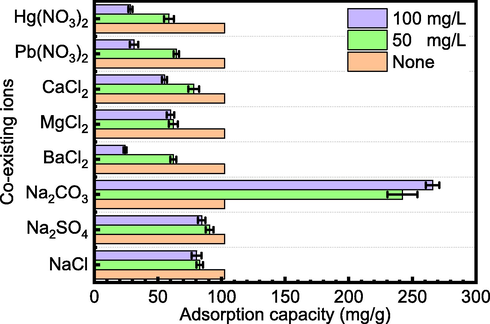
Effect of coexisting ions on Cd(II) adsorption.
In the presence of CO32−, the Cd(II) adsorption capacity appears to be much higher. However, this most likely due to the reaction of CO32− and Cd(II) to produce cadmium carbonate precipitation, which lowers the concentration of Cd(II) by means unrelated to the adsorption performance of MFZ.
3.3 Adsorption modeling
3.3.1 Adsorption kinetics
The effects of contact time on Cd(II) adsorption were studied. A 40 mL Cd(II) solution with a concentration of 40 mg/L was placed in a 50 mL centrifuge tube and mixed with the adsorbent at a dosage of 150 mg/L, a temperature of 298 K, and a solution pH of 7. Then, the tube was placed in a constant temperature oscillator at 160 rpm to observe the effects of contact time in the range 5–480 min.
Fig. 13(a) shows the effect on adsorption capacity. Within the first 180 min, the adsorption capacity steadily increases; however, the adsorption rate gradually decreases. The adsorption capacity remains constant after 180 min, indicating that adsorption equilibrium has been attained. This could be because the concentration differential at the start of the reaction forces Cd(II) to move quickly to the adsorbent surface. Meanwhile, the adsorbent surface has a significant number of adsorption sites, increasing the chances of contact and collision between Cd(II) and MFZ. The adsorption sites become saturated as the reaction progresses, and the adsorbent surface becomes positively charged as more Cd(II) attaches, causing electrostatic repulsion of the free Cd(II) and hindering contact between the two, resulting in sluggish adsorption. After 180 min, the adsorption reaction reaches equilibrium.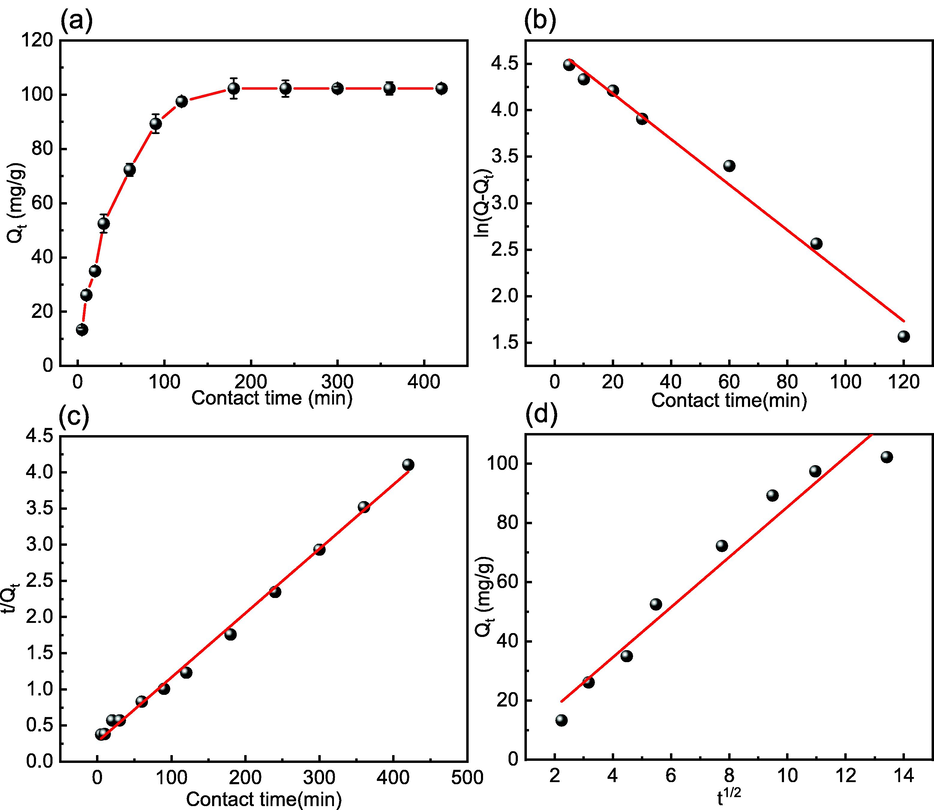
Effect of contact time on (a) Cd(II) adsorption and (b) the PFO, (c) PSO, and (d) ID kinetics of Cd(II) adsorption by MFZ.
Fig. 13(b)–(d) show the fitting results for the PFO, PSO, and ID models of Cd(II) adsorption on MFZ, respectively, while Table 3 summarizes the fitting parameters for the three kinetic models. The PSO model (R2 = 0.997) is superior to the PFO model (R2 = 0.987) and the ID model (R2 = 0.958) for fitting the Cd(II) adsorption data. The PSO model is based on the assumption that the adsorption-rate-limiting factor is completely dependent on chemisorption, and thus it can be demonstrated that chemisorption plays a dominant role in the adsorption of Cd(II), which can be adsorbed on MFZ composites via surface complexation, electrostatic interactions, and ion exchange (Fu et al., 2021).
Models
Parameters
MFZ
Qe,exp (mg/g)
102.30
PFO
Qe,cal (mg/g)
106.31
k1 (min−1)
0.025
R2
0.987
PSO
Qe,cal (mg/g)
112.49
k2 (min−1)
2.86 × 10⁻⁴
R2
0.997
ID
k3 (mg·g−1·h−0.5)
8.467
C
0.77
R2
0.958
3.3.2 Adsorption isotherms
At an adsorbent dosage of 150 mg/L, a temperature of 298 K, and an initial solution pH of 7, the effect of Cd(II) concentrations ranging from 5 to 100 mg/L on Cd(II) adsorption by MFZ was explored. Fig. 14(a) shows that when the Cd(II) concentration increases from 5 to 100 mg/L, the adsorption capacity continuously increases, showing that pollutant concentration has a beneficial effect on adsorption capacity. Conversely, the removal rate decreases as the concentration increases, most likely because the adsorbent supplies fewer effective sites, making it insufficient for Cd(II) adsorption, and therefore the adsorption capacity decreases. Taking into consideration cost and adsorption impact, the initial concentration of Cd(II) was set at 40 mg/L for this study.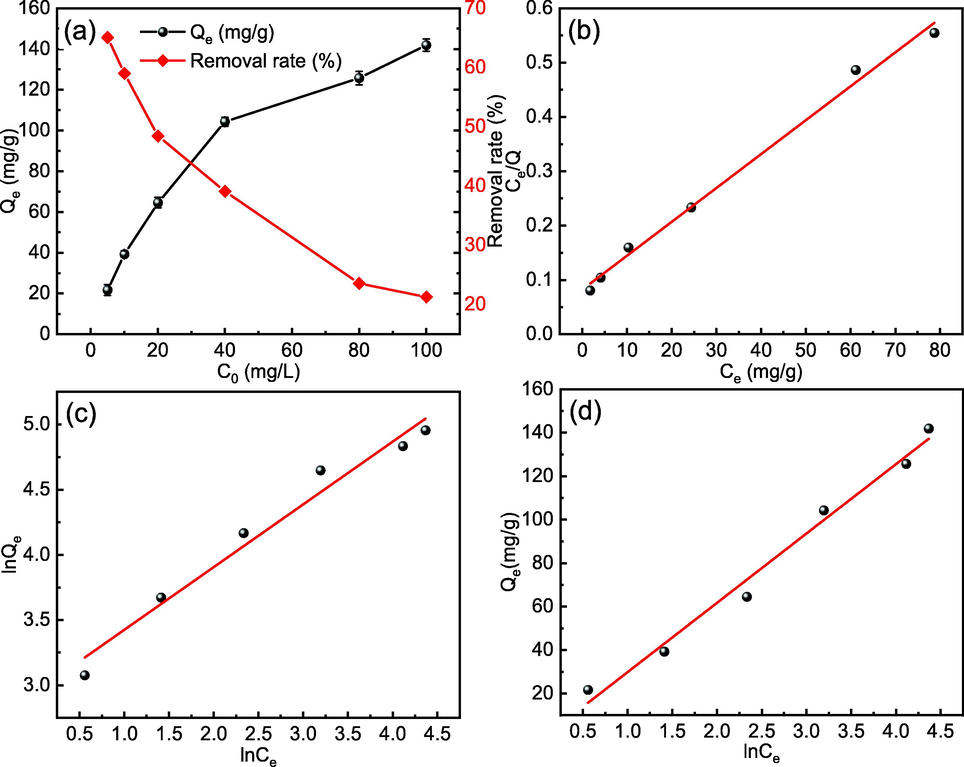
Effect of initial concentration on (a) Cd(II) adsorption and (b) Langmuir, (c) Freundlich, and (d) Temkin isotherms for Cd(II) adsorption by MFZ.
Several commonly used adsorption isotherm models, including the Langmuir, Freundlich, and Temkin isotherm models, were used to fit the data between the adsorption capacity and the initial concentration of Cd(II) to gain a better understanding of the adsorption mechanism of Cd(II) on MFZ. Fig. 14(b)–(d) show the results of fitting the three adsorption isotherms to the data, and Table 4 lists the parameters for the adsorption isotherms. The Langmuir adsorption isotherm model (R2 = 0.994) fits the results of Cd(II) adsorption by MFZ better than the Freundlich (R2 = 0.972) and Temkin (R2 = 0.986) models, which could be attributed to the uniform distribution of adsorption sites. Moreover, according to the assumptions of the Langmuir adsorption isotherm model, Cd(II) adsorption occurs mostly in monomolecular layers or through a fixed number of identical and energetically equivalent sites on the surface (Li et al., 2017). Using the Langmuir isotherm, the maximal saturation adsorption capacity of Cd(II) on MFZ was calculated as 160.26 mg/g. Compared with other adsorbent materials (Table 5), MFZ exhibits a better adsorption of Cd(II) and can be regarded as a promising Cd(II) adsorption material.
Model
Parameters
MFZ
Langmuir
Qm (mg/g)
160.26
KL(L/mg)
0.076
R2
0.994
Freundlich
KF (mg(1−1/n)·L1/n·g−1)
19.019
n (min−1)
2.086
R2
0.972
Temkin
KT (J/mol)
31.893
f
0.062
R2
0.986
Adsorbent
Temperature (K)
Initial concentration (mg/L)
Time (min)
pH
Qmax (mg/g)
References
Magnetic Fe3O4@ polydopamine
298
3–30
120
4.0–8.8
21.58
(Lei et al., 2019)
KOH-modified biochar
298
0–20
1440
5.0
41.90
(Bashir et al., 2018)
Carbon nano-onion embedded MOF-199
298
10–150
40
5.0
113.30
(Hassan, 2019)
Calcium-modified and starch-stabilized ferromanganese binary oxide
298
0–70
1440
6
107.53
(Chen et al., 2020)
Chitosan@mesoporous carbon nanohybrid
298
0.01–150
9
8.0
251.90
(Yadaei et al., 2018)
Magnetic Fe3O4/ZIF-8
298
5–100
180
7.0
160.26
This paper
3.3.3 Adsorption thermodynamics
Temperature is also a consideration that should not be overlooked in adsorption processes. Centrifuge tubes containing 40 mL of 40 mg/L Cd(II) with a pH value of 7 and an adsorbent dosage of 150 mg/L were placed in a constant temperature oscillator at one of three temperatures (298, 308, and 318 K). The results are given in Fig. 15(a) and demonstrate that increasing the temperature promotes adsorption and increases the Cd(II)-adsorption capability.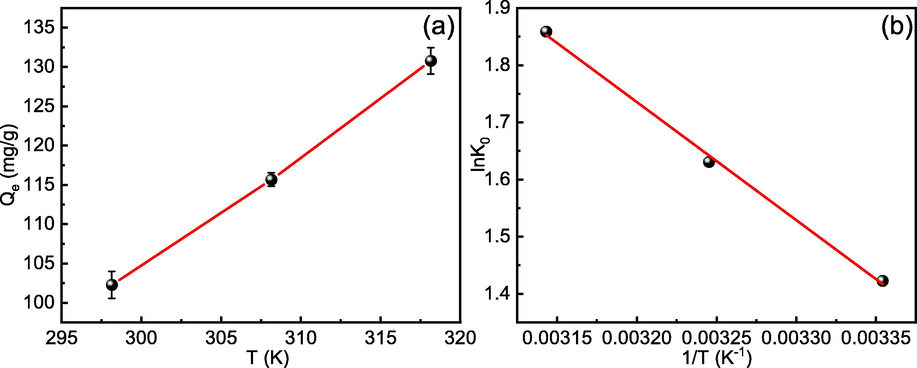
(a) Effect of temperature on Cd(II) adsorption. (b) Thermodynamic Van't Hoff diagram of Cd(II) adsorption.
As can be seen in Fig. 15(b) and Table 6, the values of ΔG0 obtained at all three temperatures are negative, indicating that the adsorption of Cd(II) on MFZ occurs spontaneously and that increasing the temperature favors an increase in Cd(II)-adsorption capacity, indicating that the adsorption process is primarily chemical (Huo et al., 2018). Furthermore, the value of ΔH0 for the adsorption reaction process becomes positive, suggesting that this adsorption reaction process is heat-absorbing, Cd(II)-adsorption capacity improves with increasing temperature, and higher temperatures accelerate Cd(II) removal. Moreover, a positive value of ΔS0 implies that Cd(II) adsorption at the solid–liquid interface is accompanied by an increase in the system's entropy, and the adsorbent has a high affinity for Cd(II).
Adsorbent
Temperature (K)
ΔG0 (kJ/mol)
ΔH0 (kJ/mol)
ΔS0 (J/mol/K)
MFZ
298.15
−3.514
17.169
69.371
308.15
−4.207
318.15
−4.901
3.4 Adsorption mechanism
To explore the mechanism of Cd(II) adsorption on MFZ, FTIR and XPS were employed to characterize the original MFZ and the MFZ after adsorption, and the findings are given in Fig. 16. The characteristic FTIR peaks of MFZ before and after Cd(II) adsorption are the same, indicating that the adsorption procedure does not disrupt the skeletal structure of MFZ. However, after Cd(II) adsorption, a large shift is observed for the MFZ peak at 1584.03 cm−1 and its intensity is significantly diminished, indicating that C⚌N is engaged in the Cd(II) adsorption process (Lei et al., 2019).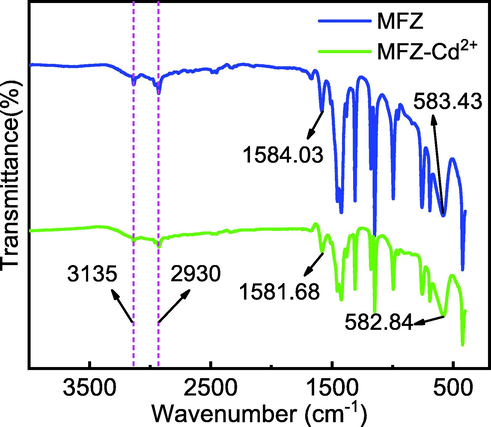
FTIR spectra of MFZ before and after adsorption of Cd(II).
Fig. 17 depicts the results of the material's XPS characterization. The binding energy deconvolution peaks at 1022.04, 532.22, and 399.02 eV are consistent with Zn 2p, O 1s, and N 1s, respectively, before adsorption. The chemisorption process was validated by the changes in Zn 2p (1022.06 eV), O 1s (531.35 eV), and N 1s (399.09 eV) following adsorption. The O 1s spectra show a new peak at 529.8 eV after adsorption, which could be related to the Zn—O—Cd interaction. In the N 1s spectra, a new peak develops at 405.15 eV, and the electron binding energy of Zn—N changes from 400.12 to 400.60 eV, which could be due to the creation of coordination bonds between unbonded nitrogen atoms and Cd(II) or the ion exchange of Zn—N to a higher binding energy. Furthermore, after adsorption, the signals at binding energies of 405.25 and 412.2 eV attributed to Cd 3d5/2 and Cd 3d3/2 are observed, showing that Cd(II) has been adsorbed on the MFZ.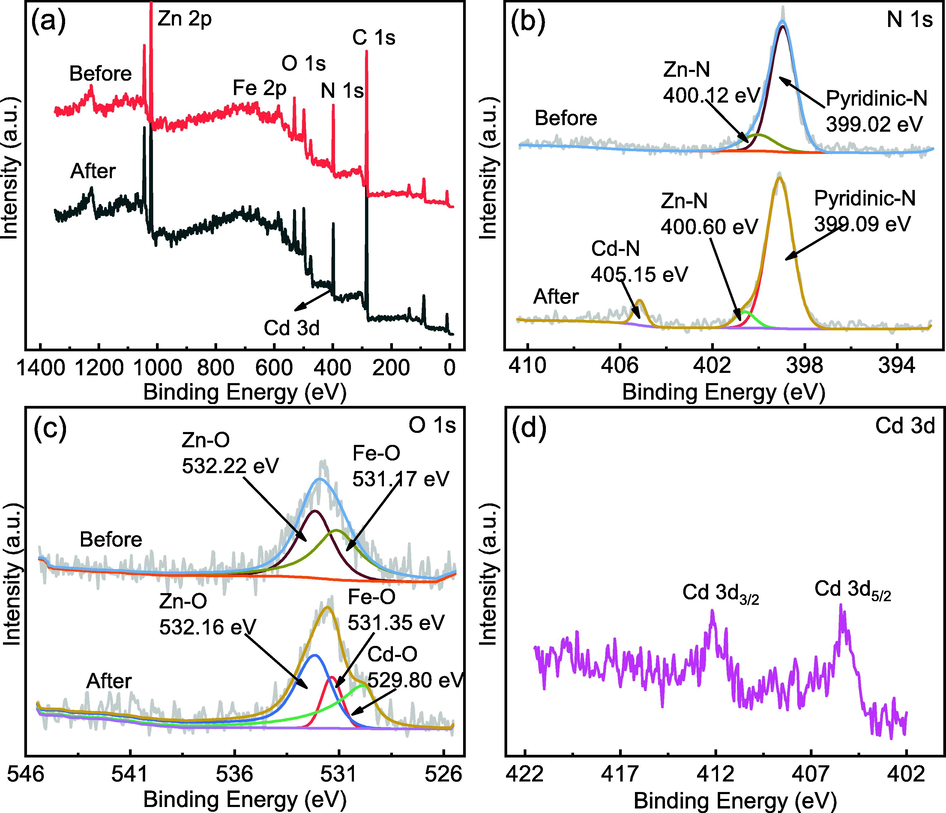
XPS spectra of MFZ before and after adsorption. (a) Measurement scan; (b) N 1s; (c) O 1s; (d) Cd 3d.
Taken together, these results indicate that the adsorption of Cd(II) from water by MFZ occurs mainly by ion exchange and ligand reactions, and that the ligand reactions are mediated by nitrogen- and oxygen-containing groups. In addition, there may be unreacted sulfonate ions present on the MFZ surface, suggesting that electrostatic interactions may also be responsible for the adsorption. In summary, the adsorption mechanism for Cd(II) on MFZ mainly involves ion exchange and coordination reactions, and there may also be some electrostatic interactions. The mechanism diagram is shown in Fig. 18.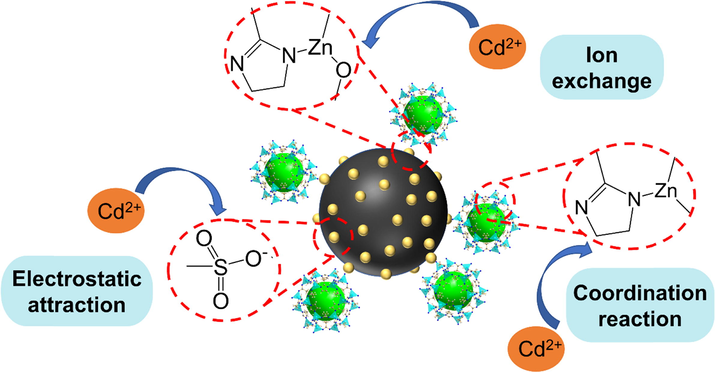
Possible adsorption mechanism of Cd(II) by MFZ.
3.5 RSM optimization
The BBD model fits the data between Cd(II) adsorption capacity and adsorbent dosage, pH, and temperature using three models. The quadratic polynomial model was utilized to determine the relationships between the adsorption capacity of Cd(II) and the dosage of adsorbent, pH, and temperature. Based on the results, the quadratic polynomial model equation for the adsorption capacity of Cd(II) is shown in Eq. (3.1).
From the equation, we can see that increasing the MFZ dosage inhibits the increase of Cd(II) adsorption capacity, whereas increasing pH and temperature promotes the increase of adsorption capacity. In comparison to the other two independent variables, the coefficient of the adsorbent dose is the highest, showing that dosage has the greatest influence on Cd(II)-adsorption capacity. Thus, the independent variables affecting Cd(II) adsorption capacity are in the following order: adsorbent dosage > temperature > pH.
The significance of the BBD model design was judged by variance analysis. Table 7 shows the ANOVA results for the quadratic polynomial model for Cd(II) adsorption.
Source
Sum of squares
df
Mean square
F-value
P-value
Model
21159.47
9
2351.05
359.48
< 0.0001
A-Dosage
16095.77
1
16095.77
2461.08
< 0.0001
B-pH
1017
1
1017
155.5
< 0.0001
C-Temperature
1472.07
1
1472.07
225.08
< 0.0001
AB
51.55
1
51.55
7.88
0.0262
AC
12.89
1
12.89
1.97
0.2032
BC
47.33
1
47.33
7.24
0.0311
A2
2334.67
1
2334.67
356.98
< 0.0001
B2
0.4796
1
0.4796
0.0733
0.7944
C2
72.08
1
72.08
11.02
0.0128
Residual
45.78
7
6.54
Lack of Fit
45.78
3
15.26
Pure Error
0
4
0
Cor Total
21205.25
16
Std. Dev.
2.56
R2
0.9978
Mean
110.52
Adjusted R2
0.9951
C.V. %
2.31
Predicted R2
0.9655
Adeq precision (AP)
59.7593
The significance of the BBD model design is judged by variance analysis. Table 7 shows the ANOVA of the quadratic polynomial model for Cd(II) adsorption. According to the results of ANOVA, the high F-value (359.48) and P-value <0.0001 ensures that the quadratic model is highly significant. A non-significant lack-of-fit test (low F value and P < 0.05) likewise indicates that the model is well validated for Cd(Ⅱ) adsorption studies.
Adequate precision (AP), coefficient of variance (C.V.%), standard deviation, and regression coefficient (R2) were all used to assess the credibility and accuracy of the experimental findings. The value of AP is 59.7593, which is higher than 4.0, and the value of C.V. % is 2.31, implying that the experimental data is reliable. The “Adjusted R2” and “Predicted R2”, respectively, are 0.9951 and 0.9655, with a difference of <0.2, showing that the experimental data are very suited for the quadratic model. Meanwhile, the R2 value for the model of Cd(II) adsorption by MFZ is 0.9978, indicating that there is a linear correlation between the actual experimental response and the projected response, demonstrating that the experimental model is reliable and applicable. Therefore, these results reconfirmed that the proposed optimization model for Cd(II) adsorption on MFZ is statistically significant and can be utilized to predict optimal conditions.
Within the defined variable range, the effects of dosage-pH, dosage-temperature, and pH-temperature on the adsorption of Cd(II) by MFZ were determined, and the results are represented by three-dimensional surface plots and contour lines. The effects of dosage-pH, dosage-temperature, and pH-temperature on Cd(II) are shown in Fig. 19(a) and (b), (c) and (d), and (e) and (f), respectively. In terms of the effect of adsorption capacity on MFZ, it can be concluded that the adsorption capacity of Cd(II) increases as the solution pH and system temperature rises, whereas the adsorption capacity decreases as the adsorbent dose rises.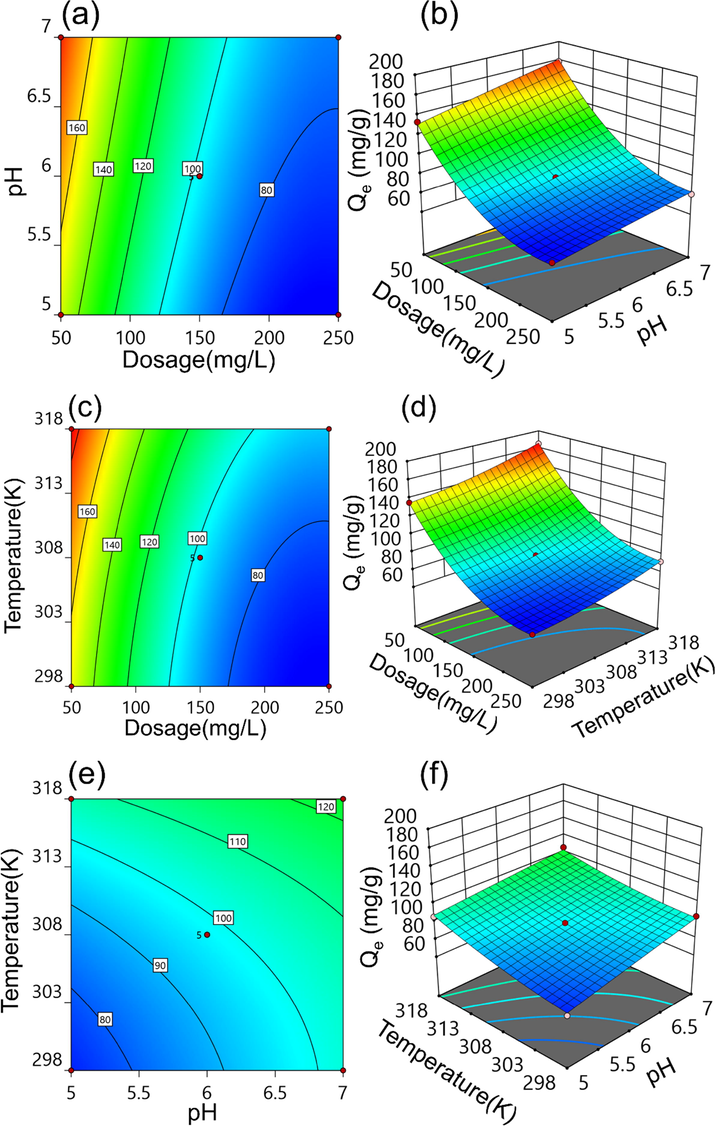
Contour plots and three-dimensional response plots of Cd(II) adsorption by MFZ. (a, b) Dosage-pH, (c, d) dosage-temperature, and (e, f) pH-temperature.
The optimum conditions for Cd(II) adsorption on MFZ were determined using this model, and are a dose of 141.39 mg/L, a pH of 6.7, and a temperature of 301.4 K. The adsorption capacity anticipated is 103.97 mg/g. Experiments were conducted utilizing the optimal conditions predicted by the model to evaluate the model's accuracy and reliability. The results revealed that the adsorption capacity of MFZ for Cd(II) under these conditions is 101.46 mg/g, which represents a deviation from the predicted value of only 2.41%. This demonstrates that the RSM optimization model analysis of Cd(II) adsorption by MFZ is effective and that the ideal experimental conditions for the adsorption process may be determined using RSM.
3.6 Reusability of MFZ
The adsorbent's reusability is a significant consideration when evaluating the material's economics and practical application. 150 mg/L MFZ was added to a centrifuge tube holding 40 mL of a 40-mg/L Cd(II) solution at a pH of 7 and the tube was placed in a thermostatic shaker for 180 min at 298 K and 160 rpm. The remaining Cd(II) concentration was evaluated by flame atomic absorption spectroscopy after the supernatant was filtered through a 0.22 μm filter. The regeneration of MFZ was carried out for four cycles to investigate its reuse performance, and the results are presented in Fig. 20. Over four regenerations, the adsorption capacity of MFZ for Cd(II) decreases dramatically, but remains above 75 mg/g, indicating that MFZ retains acceptable adsorption performance for Cd(II) after four regenerations.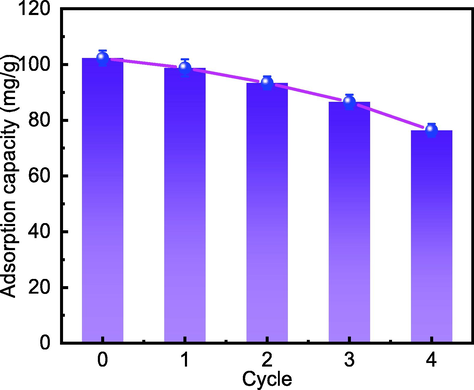
Effect of the number of MFZ regeneration cycles of on its Cd(II) adsorption capacity.
3.7 Production-cost estimation
MOFs are limited in terms of large-scale manufacture and practical application due to their low yields and high cost. As a result, we must assess each component's production cost and make appropriate cost-cutting recommendations. The raw material cost (Part I); cleaning solvent cost (Part II); and electricity, tap water, and ultrapure water cost, are all included in the MFZ preparation cost (Part III). According to raw material pricing and equipment energy usage, it is estimated that Part I costs US$ 43.45/kg, Part II costs US$ 150.46/kg, and Part III costs about US$ 0.60/kg, for a total cost of US$ 194.51 to produce 1 kg of MFZ. According to the response surface optimization results, the ideal adsorption capacity is 101.46 mg/g, implying a cost of US$ 1.86/g of Cd(II) adsorbed.
Furthermore, cleaning solvents account for 77% of the total cost. Cleaning solvents are frequently recovered at a rate of up to 90% in factory output (Luo et al., 2021). At this stage, the total cost will be US$ 59.09/kg. As a result, treating 40 mg/L of Cd(II)-containing wastewater at a dosage of 141.39 mg/L costs around US$ 8.35/m3. Furthermore, the material created in this study exhibits magnetic separation capability and reusability, allowing it to be used for solid–liquid separation using external magnets, hence increasing recycling rate and lowering costs.
4 Conclusion
In this experiment, the adsorption of Cd(II) by MFZ was studied. The effects of pH, coexisting ions, and other factors on the adsorption process were investigated, and the adsorption mechanism of Cd(II) on MFZ was discussed. The conclusions drawn are as follows:
Fe3O4 was successfully composited with ZIF-8, and the material has a hierarchical porous structure with good thermal stability and magnetic separation ability.
The results of static adsorption experiments showed that the adsorption of Cd(II) reaches equilibrium in 180 min. The Cd(II) adsorption process on MFZ follows pseudo-second-order kinetics and the Langmuir isotherm model, with a maximum saturated adsorption capacity of 160.26 mg/g. The adsorption of Cd(II) on MFZ is a spontaneous and endothermic reaction.
Ion exchange and coordination reactions between functional groups such as Zn—O, C⚌N, and Zn—N present on the MFZ composites and Cd(II), as well as electrostatic contact, appear to be the major mechanisms for Cd(II) adsorption by MFZ.
The predicted adsorption capacity of Cd(II) under optimal conditions is 103.97 mg/g, which is a 2.41% deviation from the actual value, according to the results of RSM. Furthermore, the adsorption capacity of MFZ for Cd(II) still exceeds 75 mg/g after four reuse cycles. Preparing 1 kg of this material is expected to cost US$ 194.51 while treating 40 mg/L of Cd(II)-containing wastewater is estimated to cost US$ 8.35/m3. To summarize, MFZ has strong reusability and exhibits potential for the removal of Cd(II).
Acknowledgements
The authors express their sincere gratitude to the National Key Research and Development Program of China (No.2018YFC0408000, 2018YFC0408004).
Declaration of competing interest
The authors declare that they have no known competing financial interests or personal relationships that could have appeared to influence the work reported in this paper.
References
- Sulfhydryl functionalized activated carbon for Pb(II) ions removal: Kinetics, isotherms, and mechanism. Sep. Sci. Technol.. 2020;55(7):1303-1316.
- [CrossRef] [Google Scholar]
- Synthesis of phosphorylated raw sawdust for the removal of toxic metal ions from aqueous medium: Adsorption mechanism for clean approach. J. Sol-Gel Sci. Techn.. 2019;89(2):602-615.
- [CrossRef] [Google Scholar]
- Sensitive biosensing of organophosphate pesticides using enzyme mimics of magnetic ZIF-8. Spectrochim. Acta, Part A. 2019;209:118-125.
- [CrossRef] [Google Scholar]
- Comparing the adsorption mechanism of Cd by rice straw pristine and KOH-modified biochar. Environ. Sci. Pollut. R.. 2018;25(12):11875-11883.
- [CrossRef] [Google Scholar]
- Arsenic and cadmium removal from water by a calcium-modified and starch-stabilized ferromanganese binary oxide. J. Environ. Sci.-China. 2020;96:186-193.
- [CrossRef] [Google Scholar]
- Kinetics of cadmium(II) uptake by mixed maghemite-magnetite nanoparticles. J. Environ. Manage.. 2013;129:642-651.
- [CrossRef] [Google Scholar]
- Biosorption properties of extracellular polymeric substances (EPS) towards Cd, Cu and Pb for different pH values. J. Hazard. Mater.. 2008;151(1):185-193.
- [CrossRef] [Google Scholar]
- Geochemical thermodynamics of cadmium removal from water with limestone. Environ. Earth Sci.. 2018;77(2):1-5.
- [CrossRef] [Google Scholar]
- Simultaneous removal of Cd(II) and ionic dyes from aqueous solution using magnetic graphene oxide nanocomposite as an adsorbent. Chem. Eng. J.. 2013;226:189-200.
- [CrossRef] [Google Scholar]
- An environmental-friendly magnetic bio-adsorbent for high-efficiency Pb(Ⅱ) removal: Preparation, characterization and its adsorption performance. Ecotox. Environ. Safe.. 2020;203:111002
- [CrossRef] [Google Scholar]
- Regenerable zeolitic imidazolate frameworks@agarose (ZIF-8@AG) composite for highly efficient adsorption of Pb(II) from water. J. Solid State Chem.. 2022;307:122823
- [CrossRef] [Google Scholar]
- Study of adsorption property and mechanism of lead(II) and cadmium(II) onto sulfhydryl modified attapulgite. Arab. J. Chem.. 2021;14(2):102960
- [CrossRef] [Google Scholar]
- Biomass-derived biosorbents for metal ions sequestration: Adsorbent modification and activation methods and adsorbent regeneration. J. Environ. Chem. Eng.. 2014;2(1):239-259.
- [CrossRef] [Google Scholar]
- Adsorption of Triamterene on multi-walled and single-walled carbon nanotubes: Artificial neural network modeling and genetic algorithm optimization. J. Mol. Liq.. 2016;216:654-665.
- [CrossRef] [Google Scholar]
- Synthesis of carbon nano-onion embedded metal-organic frameworks as an efficient adsorbent for cadmium ions: Kinetic and thermodynamic studies. Environ. Sci. Pollut. R.. 2019;26(23):24099-24111.
- [CrossRef] [Google Scholar]
- Modulated hydrothermal synthesis of highly stable MOF-808(Hf) for methane storage. ACS Sustain. Chem. Eng.. 2020;8(46):17042-17053.
- [CrossRef] [Google Scholar]
- Magnetic responsive Fe3O4-ZIF-8 core-shell composites for efficient removal of As(III) from water. Colloids Surf. A. 2018;539:59-68.
- [CrossRef] [Google Scholar]
- Magnetic metal-organic framework (Fe3O4@ZIF-8) core-shell composite for the efficient removal of Pb(II) and Cu(II) from water. J. Environ. Chem. Eng.. 2021;9(5):105959
- [CrossRef] [Google Scholar]
- Adsorption behavior of nickel(II) onto cashew nut shell: Equilibrium, thermodynamics, kinetics, mechanism and process design. Chem. Eng. J.. 2011;167(1):122-131.
- [CrossRef] [Google Scholar]
- Hierarchical porous carbon nanospheres for efficient removal of toxic organic water contaminants of phenol and methylene blue. J. Chem. Eng. Data. 2018;63(3):559-573.
- [CrossRef] [Google Scholar]
- Sorptive capture and photo-catalytic degradation of methylene blue from aqueous solution using lead-organic frameworks. Water, Air, Soil Pollut.. 2021;232(6):237.
- [CrossRef] [Google Scholar]
- Combined ibuprofen and curcumin delivery using Mg-MOF-74 as a single nanocarrier. ACS Appl. Bio Mater.. 2022;5(1):265-271.
- [CrossRef] [Google Scholar]
- Adsorption of cadmium ions from an aqueous solution on a highly stable dopamine-modified magnetic nano-adsorbent. Nanoscale Res. Lett.. 2019;14(1):352.
- [CrossRef] [Google Scholar]
- Adsorption of Cd(II) from aqueous solutions by rape straw biochar derived from different modification processes. Chemosphere. 2017;175:332-340.
- [CrossRef] [Google Scholar]
- Comparison between conventional solvothermal and aqueous solution-based production of UiO-66-NH2: Life cycle assessment, techno-economic assessment, and implications for CO2 capture and storage. J. Environ. Chem. Eng.. 2021;9(2):105159
- [CrossRef] [Google Scholar]
- A Cu-Doped ZIF-8 metal organic framework as a heterogeneous solid catalyst for aerobic oxidation of benzylic hydrocarbons. New J. Chem.. 2019;43(47):18702-18712.
- [CrossRef] [Google Scholar]
- Modelling and interpretation of adsorption isotherms. J. Chem. NY. 2017;2017:1-11.
- [CrossRef] [Google Scholar]
- Co-precipitation of plutonium(IV) and americium(III) from nitric acid–oxalic acid solutions with bismuth oxalate. J. Radioanal. Nucl. Ch.. 2017;313(3):523-529.
- [CrossRef] [Google Scholar]
- Oak wood ash/GO/Fe3O4 adsorption efficiencies for cadmium and lead removal from aqueous solution: Kinetics, equilibrium and thermodynamic evaluation. Arab. J. Chem.. 2021;14(3):102991
- [CrossRef] [Google Scholar]
- Application of response surface methodology for optimization of cadmium adsorption from aqueous solutions by Fe3O4@SiO2@APTMS core–shell magnetic nanohybrid. Surf. Interfaces. 2019;17:100374
- [CrossRef] [Google Scholar]
- Copper-doped ZIF-8 with high adsorption performance for removal of tetracycline from aqueous solution. J. Solid State Chem.. 2020;285:121219
- [CrossRef] [Google Scholar]
- Photoluminescence of metal-imidazolate complexes with Cd(II), Zn(II), Co(II) and Ni(II) cation nodes and 2-methylimidazole organic linker. J. Lumin.. 2019;207:454-459.
- [CrossRef] [Google Scholar]
- Structural evolution of zeolitic imidazolate framework-8. J. Am. Chem. Soc.. 2010;132(51):18030-18033.
- [CrossRef] [Google Scholar]
- Reduction of metal ion content in jatropha biodiesel by ion exchange. ChemistrySelect. 2019;4(33):9748-9753.
- [CrossRef] [Google Scholar]
- In situ growth of ZIF-8 nanoparticles on chitosan to form the hybrid nanocomposites for high-efficiency removal of Congo Red. Int. J. Biol. Macromol.. 2019;137:77-86.
- [CrossRef] [Google Scholar]
- Optimization of cadmium adsorption by magnetic graphene oxide using a fractional factorial design. Int. J. Env. Res. Pub. He.. 2020;17(18):6648.
- [CrossRef] [Google Scholar]
- Magnetic metal-organic frameworks (Fe3O4@ZIF-8) composites for U(VI) and Eu(III) elimination: Simultaneously achieve favorable stability and functionality. Chem. Eng. J.. 2019;378:122105
- [CrossRef] [Google Scholar]
- Zeolitic imidazolate metal organic framework ZIF-8 with ultra-high adsorption capacity bound tetracycline in aqueous solution. RSC Adv.. 2015;5(100):82127-82137.
- [CrossRef] [Google Scholar]
- Metal-organic frameworks for direct electrochemical applications. Coordin. Chem. Rev.. 2018;376:292-318.
- [CrossRef] [Google Scholar]
- Ferrofluid mediated chitosan@mesoporous carbon nanohybrid for green adsorption/preconcentration of toxic Cd(II): Modeling, kinetic and isotherm study. React. Funct. Polym.. 2018;122:85-97.
- [CrossRef] [Google Scholar]
- The efficient biomineralization and adsorption of cadmium (Cd2+) using secretory organo-biominerals (SOBs) produced by screened Alcaligenes faecalis K2. Environ. Res.. 2021;199:111330
- [CrossRef] [Google Scholar]
- Metal-organic framework (MOF) showing both ultrahigh As(V) and As(III) removal from aqueous solution. J. Solid State Chem.. 2019;269:264-270.
- [CrossRef] [Google Scholar]
- Glycine derivative-functionalized metal-organic framework (MOF) materials for Co(II) removal from aqueous solution. Appl. Surf. Sci.. 2019;466:903-910.
- [CrossRef] [Google Scholar]
- Adsorption of cadmium ion from aqueous solutions by copper-based metal organic framework: Equilibrium modeling and kinetic studies. Appl. Water Sci.. 2019;9(4):106.
- [CrossRef] [Google Scholar]
- Exploring a thiol-functionalized MOF for elimination of lead and cadmium from aqueous solution. J. Mol. Liq.. 2016;221:43-50.
- [CrossRef] [Google Scholar]
- Synthesis of Fe3O4@ZIF-8 magnetic core–shell microspheres and their potential application in a capillary microreactor. Chem. Eng. J.. 2013;228:398-404.
- [CrossRef] [Google Scholar]
- Metal-organic framework based membranes for selective separation of target ions. J. Membrane Sci.. 2021;634:119407
- [CrossRef] [Google Scholar]
- Highly efficient adsorption of bulky dye molecules in wastewater on ordered mesoporous carbons. Chem. Mater.. 2009;21(4):706-716.
- [CrossRef] [Google Scholar]


