

Translate this page into:
Mechanical investigations on piezo-/ferrolectric maleic acid-doped triglycine sulphate single crystal using nanoindentation technique
⁎Corresponding authors. nidhisinha5@yahoo.co.in (Nidhi Sinha), nidhis@sgtbkhalsa.du.ac.in (Nidhi Sinha), bksingh@ua.pt (Budhendra Singh)
-
Received: ,
Accepted: ,
This article was originally published by Elsevier and was migrated to Scientific Scholar after the change of Publisher.
Peer review under responsibility of King Saud University.
Abstract
The present work reports the growth and characterization of single crystals of pure triglycine sulphate (TGS) and maleic acid doped triglycine sulfate (MA-TGS). Both the crystals were grown by conventional slow evaporation solution technique. The crystal structure, composition and morphology of both pure TGS and MA-TGS crystals were studied using single crystal and powder X-ray diffraction, scanning electron microscope, and CHNS analysis. The results revealed monoclinic crystal system for both the crystals with space group P21. Thermal stability and melting point of the grown crystals were determined by employing thermogravimetric and differential thermal analysis (TG-DTA) technique. The dielectric study showed an increase in Curie temperature along with a decrease in maximum permittivity due to MA doping. Enhanced piezoelectric, ferroelectric and mechanical properties were obtained for the doped crystal. The value of piezoelectric charge coefficient, d22 was estimated from ‘Displacement-Voltage (D-V)’ butterfly curves and was observed to increase from 56.23 pm/V for pure TGS single crystal to 72.02 pm/V for MA-TGS single crystal. An increase in the ferroelectric parameters (spontaneous and remanent polarizations) was observed for doped TGS crystal. Also, the value of true-remanent polarization was determined using remanent hysteresis task for MA-TGS crystal. Mechanical stability of grown crystals was examined using the nanoindentation technique and various parameters such as the hardness, stiffness and Young’s modulus were evaluated. Nanoindentation results revealed that both the crystals have a greater capability to withstand deformation caused by applying various loads. However, the mechanical strength of MA-TGS crystal was observed to be better than that of pure TGS crystal. Comparative structural, ferroelectric, piezoelectric and mechanical studies provide useful scientific information of an important class of TGS crystals.
Keywords
X-ray diffraction
Dielectric property
Piezoelectric property
Ferroelectric property
Nanoindentation

1 Introduction
The extensive research of piezoelectric and ferroelectric materials has played a crucial role in technology developments in various areas such as piezoelectric nanogenerators (PNGs) for energy harvesters, sensors, actuators, non-volatile ferroelectric random access memory (Fe-RAM), and other electronic and micro-electronic devices (Long et al., 2016; Wu et al., 2016, 2015; Xu et al., 2016; Chang et al., 2017; Ren et al., 2016). Among all ferroelectric materials, organic/semi-organic materials are flexible, nontoxic and easy to process as compared to transition metal oxides and thus, they find many new applications in the emerging field of organic electronics (Horiuchi and Tokura, 2008).
Triglycine sulphate (TGS) crystal with the chemical formula (NH2CH2COOH)3·H2SO4 is one of the extensively studied ferroelectric material. Due to its low cost, low power requirement and wide operating range of frequency and temperature it is useful for various applications like pyroelectric detection and thermal imaging devices, room temperature infrared (IR) detectors, transducers and sensors, etc. (Alexandru et al., 2006; Sinha et al., 2012) Also, TGS crystals with different additives, because of their high value of figure of merit, have been widely used for the fabrication of sensitive detectors (Deepthi and Shanthi, 2016; Chang et al., 2002). The crystal structure of TGS single crystal was studied for the first time by Hoshino et al. who reported its Curie temperature to be 47 °C (Hoshino et al., 1959). They reported monoclinic crystal symmetry with the space group P21, which exists in ferroelectric phase below the Curie point. Above the Curie temperature Tc, in the paraelectric phase, the structure gains an additional set of two mirror planes m at y = 1/4 and 3/4 and the space group becomes P21/m. Later, many studies were carried out on TGS crystals in which its Curie temperature was reported to be around 49–50 °C (Jiann-Min Chang et al., 2002; Sachio Horiuchi and Yoshinori Tokura, 2008). TGS consists of two kinds of glycine group (glycinium ions and zwitter ions) and an SO42− tetrahedron which are linked together by hydrogen bonds (Balakumar and Zeng, 2000). Such configuration of glycine ions is responsible for the ferroelectric behavior in TGS crystal (Li et al., 2004). However, low Curie temperature, depolarization by thermal, electrical or mechanical means and high mobility of ferroelectric domains at the room temperature limit the use of TGS in various applications (Sinha et al., 2015; Krishnakumar et al., 2011). These limitations of TGS leads to a low efficiency which can be improved by adding suitable impurities into the TGS crystal lattice. Therefore, studies dealing with the effect of dopants on various properties of TGS crystals have recently been of particular interest. There are many reports in which various organic and inorganic dopants were used to improve the optical, pyroelectric, ferroelectric and various other properties of the TGS crystals. Meera et al. (2001) studied L-cystine doped TGS crystal and found an increase in the coercive field value with doping. Various additives such as amino acids (e.g. L- and D-alanine) and metallic ions (e.g. Cu2+, Ni2+, Mn2+, Co2+, Fe3+, Cr3+, etc.) have been used by many researchers to improve the ferroelectric properties of TGS crystal and their effects on various other properties such as mechanical, dielectric, piezoelectric and pyroelectric of TGS crystals have been investigated (Abu El-Fadl, 1999; Alexandru et al., 2004; Prokopova et al., 2001; Deepthi and Shanthi, 2016; Muralidharan et al., 2003).
Maleic acid (MA) is an organic compound with two carboxyl groups with chemical formula C4H4O4. Because of the presence of the intramolecular hydrogen bonding in MA, it is less stable and soluble in water (Priakumari et al., 2015). The molecules of MA are polar and possess a strong net dipole moment. There are possibilities of getting better piezoelectric and ferroelectric properties by doping MA in TGS crystal. Therefore, in the present work, MA was introduced into TGS in order to alter its mechanical, dielectric, piezoelectric and ferroelectric properties. To the best of our knowledge, no literature on MA doping in TGS exists and also there is no report on mechanical stability analysis using nanoindentation technique for TGS family crystals which is an important factor in deciding the suitability of crystals for making electro-mechanical devices. Hence, in this report, the effect of MA on the structural, dielectric, piezoelectric, ferroelectric and mechanical properties of TGS crystals was investigated and reported.
2 Experimental
2.1 Crystal growth and morphology
The single crystals of pure and MA-doped TGS were grown by slow evaporation technique in aqueous solution. Pure TGS was synthesized by dissolving high purity glycine (from Sigma Aldrich) and concentrated sulphuric acid in the molar ratio of 3:1 in distilled water. Then the solution was stirred at 40 °C for 4 h, using a magnetic stirrer to obtain a homogeneous mixture. The reaction between glycine and sulphuric acid is depicted in Scheme 1.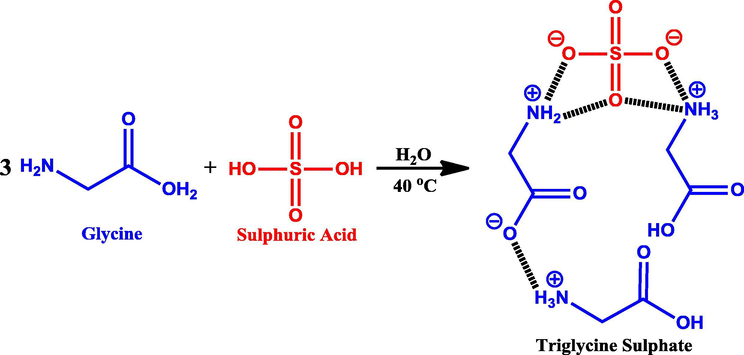
Synthesis of triglycine sulphate.
The resultant solution was filtered using filter paper and transferred to a petri dish for crystallization. Highly transparent crystals were obtained in around 20 days. The purity of the synthesized salt was improved by performing successive re-crystallization. To obtain maleic acid doped TGS crystals (MA-TGS), 1 mol% of MA was added to the above prepared solution for pure TGS. All the growth parameters for MA-TGS were kept same as that for pure TGS. Transparent and good quality crystals of MA-TGS were achieved in a lesser time of about 15 days. Fig. 1(a) and 1(b) depict the photographs of as-grown pure and MA doped TGS single crystals. It can clearly be seen that MA doping has no effect on the external shape of TGS crystal. Fig. 2 depicts the indexed morphology of as grown TGS crystal. In order to gain a better understanding of the growth mechanism, both pure and doped TGS crystals were characterized using scanning electron microscope (SEM, Model: EVO MA10, Zeiss). High resolution SEM images of (1 0 0) plane of pure TGS and MA-TGS are shown in Fig. 1(c) and (d), respectively. Three clearly separated steps can be seen in Fig. 1(c) and (d), which confirms step growth mechanism for TGS crystal (Sinha et al., 2009). The morphology of the (1 0 0) surface of both the crystals is highly smooth between these steps.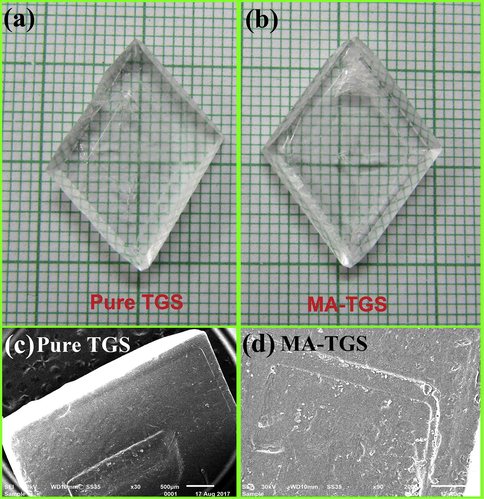
Photograph of as grown (a) pure TGS and (b) MA-TGS single crystals by slow evaporation technique. SEM micrographs of (1 0 0) plane of (c) pure TGS and (d) MA-TGS single crystals showing the step growth mechanism.
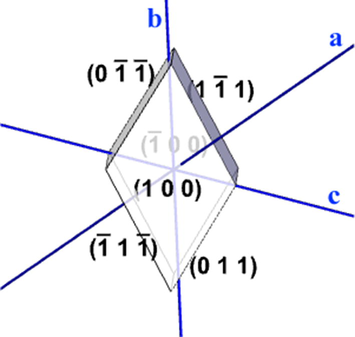
Indexed morphology of TGS single crystal.
2.2 Characterization techniques
Single-crystal XRD of the as-grown crystals was carried out using an Oxford Diffractometer model X-CALIBURS (Mo Kα X-ray source, λ = 0.71073 Å). Also, the single crystals were ground to form powder and then subjected to powder X-ray diffraction (XRD) using a Rigaku Ultima IV X-ray diffractometer with Cu Kα radiation (λ = 1.54056 Å). The elemental composition of the grown crystals was analyzed by varioELcube CHNS analyzer. Thermal analysis of the crystals was carried out by recording TG-DTA data using a Perkin Elmer Diamond system. The dielectric study was carried out along ‘b’ crystallographic axis (AgilentE4890A) in the frequency range 20 Hz–2 MHz and temperature range RT to 70 °C using LCR meter (Agilent E4890A) and the sample holder (Agilent 16048A). The piezoelectric property of both the crystals was studied along ‘b’ crystallographic axis by measuring piezoelectric charge coefficient, d22 using an MTI-2100 Fotonic Sensor. Room temperature ferroelectric hysteresis loops for both pure TGS and MA-TGS crystals along ‘b’ crystallographic axis were traced using Radiant Precision LCII Ferroelectric tester (Model No. P-HVi210KSC). Mechanical behavior of grown pure TGS and MA-TGS single crystals along (1 0 0) plane was analyzed using nanoindentation technique with three-sided pyramidal Berkovich diamond indenter with a nominal edge radius of 20 nm (faces 65.3° from vertical axis) attached to a fully calibrated nano indenter (TTX-NHT, CSM Instruments). The tests were performed under load control to various peak loads ranging from 5 to 125 mN with an approach speed of 2000 nm/min. The loading and unloading speeds throughout the measurement were kept constant (20 mN/min) with a dwell time of 10 s. Total 8 indentations (with varying load) were made at different places (separation between two indentations is 50 μm) on an optically smooth (1 0 0) plane of pure and MA-doped TGS single crystals. An inbuilt AFM attached with Nanoindenter was used for taking a topographic image of the surface. The standard Oliver and Pharr method was used to analyze and interpret the obtained results (Oliver and Pharr, 1992). Before indentation, the surfaces of TGS and MA-TGS crystals were polished to achieve an optically smooth surface. Fig. 3(a) and (b) presents the optical images along with corresponding Atomic Force Microscopy (AFM) images of roughness distribution profile for polished (1 0 0) plane. Very smooth surfaces with several scratch lines due to mechanical polishing can be seen with typical depths of the order of a few 100 nm. The calculated RMS roughness parameters for pure TGS and MA-TGS were found to be 15.1 nm and 40.02 nm, respectively (Fig. 4) which is a reliable result with minimum error to perform nanoindentation on the surfaces.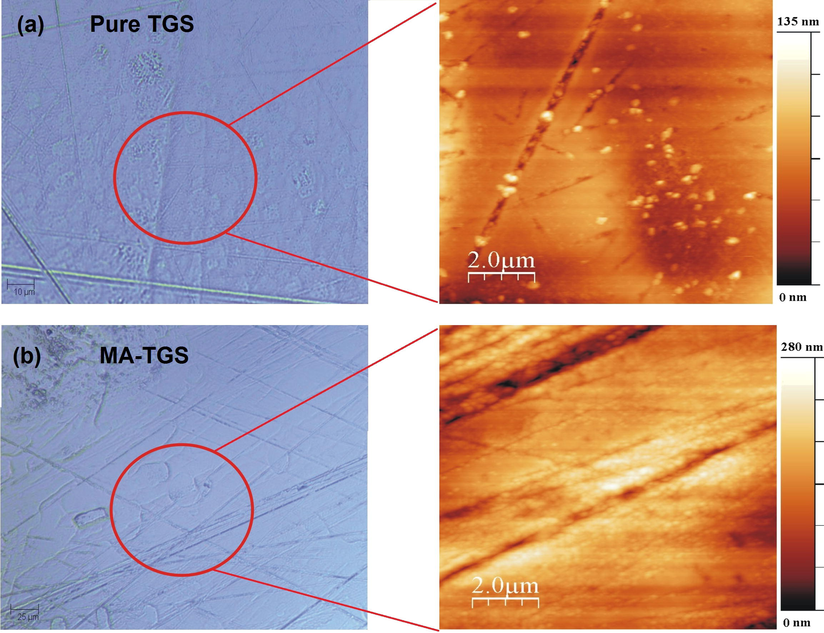
The optical and corresponding AFM image of polished (1 0 0) surface for (a) Pure TGS, and (b) MA-TGS crystal.
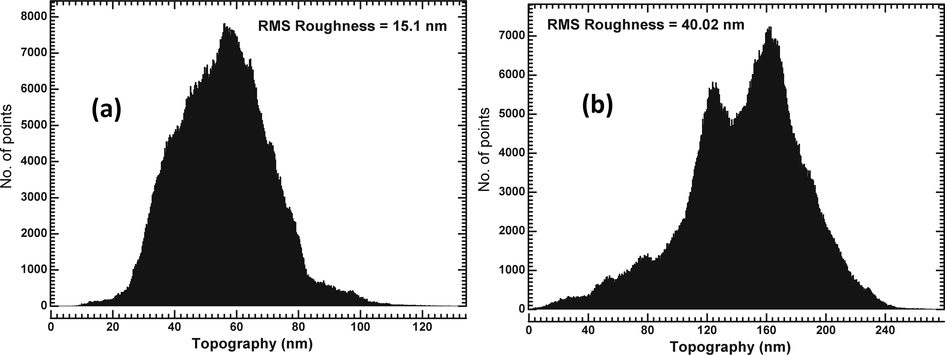
The roughness profile of (a) pure TGS crystal, and (b) MA-TGS crystal.
3 Results and discussions
3.1 Powder and single crystal XRD
Pure TGS and MA-TGS crystals were subjected to the powder X-ray diffraction (XRD) with a step size of 0.02° and scan speed of 3 °/min in the 2 theta range between 10° and 50° at room temperature as shown in Fig. 5. It was observed that doping of MA in TGS crystal had no significant effect on XRD peaks position (i.e. 2θ value) but the relative intensity of the peaks varied due to MA doping which may be due to the change in the electronic density in the crystallographic position of TGS crystal. In order to determine the lattice parameters of pure and MA-TGS crystals, single-crystal X-ray diffraction was performed. Further, the Rietveld refinement of powder XRD patterns of both the crystals was carried out using Topas software. The lattice parameters of pure TGS and MA-TGS crystals obtained from both single crystal XRD and Rietveld refinement are listed in Table 1. The obtained lattice parameters of pure TGS crystal agreed well with the earlier reported values (Parameswari et al., 2017; Sinha et al., 2012; Theresita Shanthi et al., 2009). The X-ray diffraction analysis showed no change in the crystal structure but a slight change in the unit cell parameters of TGS due to MA doping was observed. The changes observed in relative intensity of the peaks in powder XRD and unit cell parameters confirmed the presence of MA within the crystal lattice. According to reported structural analysis, maleic acid possesses two carboxyl groups (—COOH) and TGS contains two kinds of glycine group, NH3+CH2COOH and NH3+CH2COO−. Therefore, it is expected that MA may attach to glycine molecules in TGS lattice through O—H—O hydrogen bond between the carboxyl groups of the glycine and maleic acid.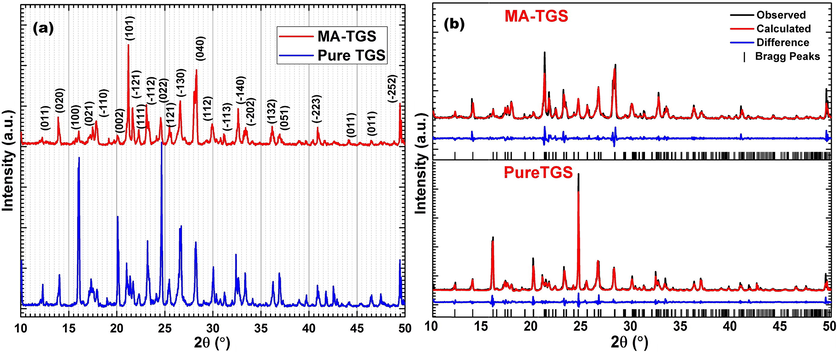
(a) Powder XRD patterns and (b) Rietveld refinement (profile fitting) of pure TGS and MA-TGS crystals.
Parameters
Pure TGS
MA-TGS
Single crystal XRD
a (Å)
5.7663
5.6846
b (Å)
12.7311
12.6048
c (Å)
9.2217
9.1580
90.0000
90.0000
105.5023
105.3209
90.0000
90.0000
Space group
P21
P21
Crystal structure
Monoclinic
Monoclinic
Rietveld refinement
a (Å)
5.7435
5.7296
b (Å)
12.6523
12.6367
c (Å)
9.1557
9.1724
90.0000
90.0000
105.7261
105.7211
90.0000
90.0000
Space group
P21
P21
Crystal structure
Monoclinic
Monoclinic
Rwp, Rp and GOF
0.172, 0.134 and 2.13
0.151, 0.115 and 1.95
3.2 CHNS analysis
The CHNS elemental analysis was carried out to confirm the presence of the desired chemical composition of the crystals. The experimental and theoretical values of the contents of C, H, N and S elements for pure TGS and MA-TGS crystals are given in Table 2. The oxygen content was determined by considering 100% composition of the crystal. The experimental values of pure TGS crystal were found to be in good agreement with the theoretical computed results that confirms the formation of TGS crystal with the desired stoichiometric ratio. The carbon percentage of MA-TGS crystal was found to be higher than that of pure TGS crystal that confirms the occurrence of MA into the TGS crystal.
Elements
Pure TGS
MA-TGS
Theoretical content (%)
Experimental content (%)
Theoretical content (%)
Experimental content (%)
Carbon
22.29
22.35
22.36
22.80
Hydrogen
5.30
5.14
5.29
5.16
Nitrogen
13.00
12.74
12.95
12.27
Sulfur
9.92
10.24
9.88
10.19
Oxygen
49.49
49.53
49.51
49.58
3.3 Thermal analysis
Thermal analysis of pure TGS and MA-TGS crystals was carried out by performing thermogravimetric and differential thermal analysis (TG-DTA) in the temperature range between 30 and 600 °C at a heating rate of 10 °C/min in a nitrogen atmosphere. The TG-DTA curves of pure TGS and MA-TGS crystals are illustrated in Fig. 6(a) and (b), respectively. The TGA curves show no significant weight loss up to 185 °C signifying the promising and stable nature of both the crystals at high temperatures. It can be seen that both crystals undergo rapid loss of weight (∼65% for pure TGS and ∼70% for MA-TGS) within the temperature range of 185–260 °C. This may be attributed to the decomposition of glycine into CO2 and NH3. A further rise in temperature beyond 260 °C reveals the gradual weight loss of the samples. In the DTA curves, sharp endothermic peaks at 244 °C and 233 °C were observed for pure TGS and MA-TGS crystal, respectively. These endothermic peaks are due to decomposition of the samples and may be assigned to their melting points. Das and Podder (2012) also observed endothermic peak for pure TGS crystal at a similar temperature. The doping of MA resulted in a decrease in the melting point by ∼11 °C for MA-TGS crystal. This is because the melting point of MA is very low (135 °C). This confirms the presence of MA in TGS crystal lattice. The sharp endothermic peaks in pure and doped crystals establish their good crystalline quality.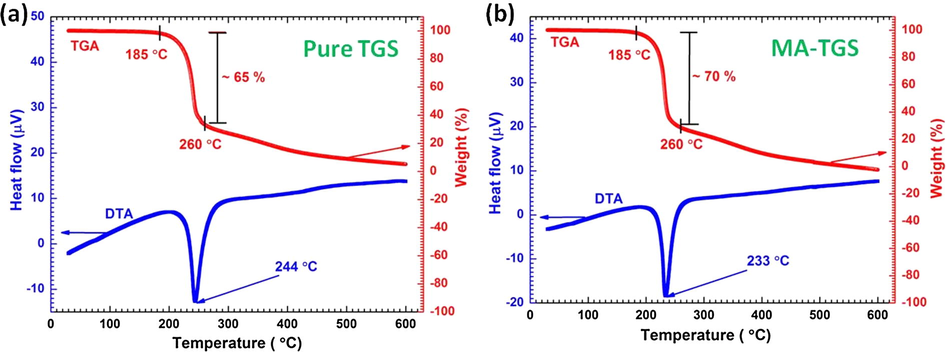
TG-DTA curves for (a) pure TGS and (b) MA-TGS crystal.
3.4 Dielectric study
The variation dielectric constant along (0 1 0) plane with frequency in the range 20 Hz–2 MHz was depicted in Fig. 7(a). For the whole range of frequency, the value of dielectric constant was found to be greater for MA-TGS crystal than pure TGS. The dielectric constant for both the crystals decreased with increase in frequency and attained saturation at higher frequencies. This is because, at low frequencies, all four types of polarizations namely space charge, orientation, ionic and electronic are active but at the higher frequencies, the contributions of these polarizations gradually diminish. The variation of dielectric constant with temperature was also studied at 1 kHz for both the crystals and is shown in Fig. 7(b). Room temperature dielectric constant values were found to be 143 and 103 for pure TGS and MA-TGS, respectively at 1 kHz. For both the crystals, the dielectric constant was observed to increase smoothly with the rise in temperature and attained a maximum value at transition temperature (Curie temperature, Tc) and decreased thereafter. The value of Tc for pure TGS and MA-TGS crystals was found to be 49 and 51 °C, respectively and their respective εmax values were 863 and 593. The reduction in εmax and increase in Tc may be due to the incorporation of larger doped molecules (Maleic acid) into the TGS lattice which may prevent displacements of glycine group. Further, lowering in εpeak may also be attributed to the domain clamping effects (Rai et al. (2010a, 2010b); Sinha et al., 2012). Arunmozhi et al. (2003) and Saxena et al. (2001) also observed lowering of the value of εpeak with other dopants. Similar values of Tc were also obtained by other researchers (Alexandru et al., 2006; Rai et al., 2010a, 2010b). The increase in Tc by 2 °C for MA-TGS crystal is quite significant as most of the researchers have reported enhancement in Tc for doped TGS crystals of the same order. Rai et al. (2010a, 2010b) observed an increase in Tc by 1.4 °C for iminodiacetic acid doped TGS crystal and Saxena et al. (2001) obtained a maximum shift of 2.5 K in Tc for crystals grown with 50 mol% of H3PO4. A graph between dielectric loss (tan δ) and frequency is shown in the inset of Fig. 7(a). Dielectric loss was found to be high at low frequencies and decreased with increase in frequency. The high value of dielectric loss at low frequencies is attributed to the presence of space charge polarization due to charged lattice defects. At higher frequencies, the value of loss was found to be very small (<0.1) for both the crystals. As a result of MA doping, dielectric loss decreased. At 2 MHz, the values of dielectric loss were 0.09 and 0.01 for pure TGS and MA-TGS, respectively. This may be due to the vacancies those were present in the pure TGS crystal are now filled with the MA dopants which lead to improvement in the crystalline perfection with lesser defects. The decrease in dielectric constant and loss leads to an increased figure of merit of MA-TGS crystal (Alexandru et al., 2006; Sinha et al., 2012).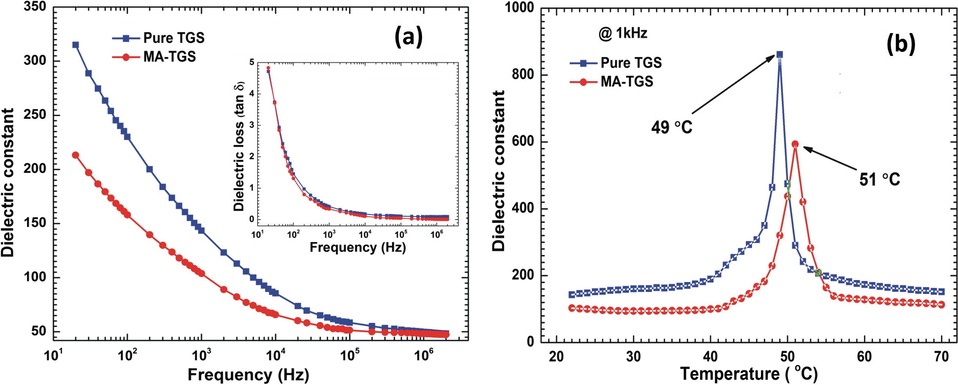
Variation of dielectric constant with (a) frequency, and (b) temperature. (Inset: Variation of dielectric loss with frequency).
3.5 Piezoelectric study
Piezoelectricity refers to the generation of an electric voltage across the surface of the crystal on the application of mechanical stress. Piezoelectricity has the relationship with the polarity of the material (Deepthi and Shanthi, 2016). A piezoelectric material gets polarized on the application of a mechanical force. Piezoelectric property of the materials is studied by measuring piezoelectric charge coefficient, d22 which may be defined as the amount of charge appearing at the opposite faces of the material when a unit force is applied across it (Abid Hussain et al., 2016). For d22 measurement, both crystals were poled along ‘b’ crystallographic axis for an easy alignment of the domains by applying an electric field of 1.5 kV/mm for 30 min. The piezoelectric charge coefficient value d22 was found to increase with doping.
Fig. 8 depicts the piezoelectric ‘displacement-voltage (D-V)’ butterfly loops and ‘d22-V’ hysteresis loops for the pure TGS and MA-TGS single crystals. According to the law of converse piezoelectric effect, each point on the D-V curve is related to the piezoelectric deformation under a corresponding applied voltage and one can plot piezoelectric coefficient vs. applied voltage (d22-V) curves using Eq. (1) (Abid Hussain et al., 2017):
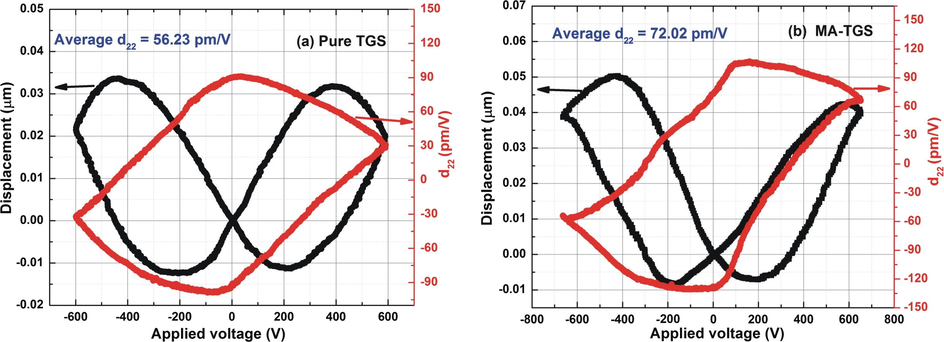
Displacement-Voltage (D-V) butterfly curve and the corresponding d22-V loop for (a) Pure TGS crystal, and (b) MA-TGS crystal.
The unit cell of TGS is constructed from the coupling of hydrogen bonds between three glycine molecules which plays an important role in the piezoelectric and ferroelectric behavior of the TGS crystal along the crystallographic b axis. Application of the external electric field on TGS crystal causes elongation in hydrogen bonds which is responsible for the piezoelectric behavior of the TGS. As already explained above, doping of MA in TGS may lead to the formation of H-O-H hydrogen bonds between the glycine and MA molecules which may result in more number of hydrogen bonds in MA-TGS crystal as compared to pure TGS. Thus, there may be more effective elongation in H-bonds and thus, more deformation in MA-TGS crystal when an external electric field is applied along b-axis. Therefore, the value of the piezoelectric coefficient, d22 of MA-TGS crystal is higher than that of the pure TGS crystal. This suggests that MA-TGS crystals may be useful for piezoelectric device applications.
3.6 Ferroelectric study
Ferroelectricity is the most important and useful property of a material and it is of great technological interest because of switching of electric polarization between different states on the application of an external electric field (Horiuchi and Tokura, 2008). The property that ferroelectric materials retain polarization, called remanent polarization (Pr), even after the removal of the electric field is used for information storage purposes in ferroelectric memory devices (Naber et al., 2010; Bhandari et al., 2014). These devices store information in the form of logic 0 and 1 where Boolean 0 is associated with polarization states −Pr and Boolean 1 with +Pr. Apart from this, ferroelectric materials may also find applications in switchable NLO devices, electric-optical devices and light modulators (Li et al., 2004). In order to study the effect of MA doping on ferroelectric properties of TGS crystal, polarization vs. electric field (P-E) hysteresis loops were plotted at room temperature. Fig. 9 depicts the ferroelectric P-E hysteresis loops for both pure TGS and MA-TGS single crystals along (0 1 0) plane at room temperature. Well-shaped and saturated hysteresis loops were observed. The values of ferroelectric parameters i.e. spontaneous polarization (Ps), remanent polarization (Pr) and coercive electric field (Ec) for both the crystals are given as; for pure TGS: Ps = 1.10 μC/cm2, Pr =1.01 μC/cm2, Ec = 1.61 kV/cm, and for MA-TGS: Ps =1.34 μC/cm2, Pr =1.27 μC/cm2, Ec =1.24 kV/cm. These values were found to be in good agreement with the earlier reported results for pure TGS. The value of Pr equal to 1.19 μC/cm2 was obtained by Pandian et al. (2012) in the SR grown TGS crystal. Rai et al. (2011) reported the values of maximum polarization (Ps) for pure TGS and 1, 5, 10 and 20 mol% n-bromo succinimide doped TGS crystals to be 2.7, 2.11, 2.29, 2.0 and 2.27 μC/cm2, respectively. They observed decrement in Ps by ∼26% for 10 mol% n-bromo succinimide doped TGS crystal and ∼15% for 5 mol% n-bromo succinimide doped TGS crystal. In our case, we observed an increase in Ps by ∼22% for maleic acid doped TGS crystal which showed the influence of maleic acid on the ferroelectric property of TGS crystal. The presence of maleic acid increased the spontaneous and the remanent polarization but decreased the coercive field. The molecules in MA are polar and held by H-bonds. Doping of MA in TGS crystal may lead to the increase in molecular dipole moments per unit volume. The application of the electric field along b-direction favors more molecular dipole moments to align in the same direction which adds more components of electric polarization along ‘b’ direction. Thus, the polarization of MA-TGS crystal is more as compared to the polarization value of pure TGS on the application of the same value of external electric field on both the crystals.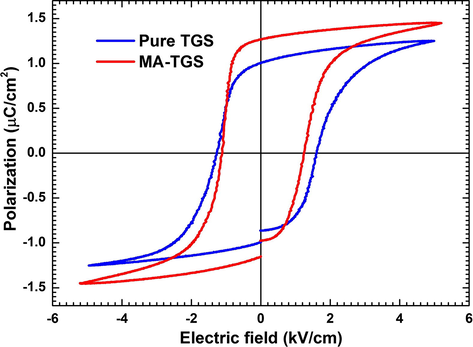
P-E hysteresis loops for both pure TGS and MA-TGS crystals.
The squareness factor of the ferroelectric P-E loops can be calculated using empirical expression given as (Kumar et al., 2011),
Further, the frequency dependent P-E hysteresis loops for both pure TGS and MA-TGS crystal were measured at various frequencies of applied field as shown in Fig. 10. It was observed in both the crystals that the spontaneous polarization decreased while the coercive field increased with frequency. Physically, as frequency increases, some of the domains are unable to reverse their orientation in the direction of the applied electric field, so degradation in polarization was observed. Switching of the ferroelectric domains occurs through the domain walls motion. Domain walls face difficulties like resistance or viscosity during movement. As frequency increases, this resistance in ferroelectric materials becomes more pronounced due to increase in the speed of the domain wall movement. Thus, high energy is required to overcome the resistance in order to orient the domains and consequently, the coercive field increases as the frequency of applied field increases.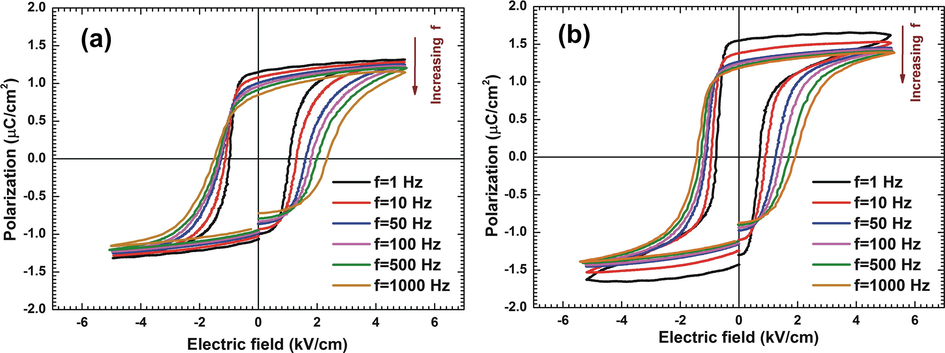
P-E hysteresis loops at various frequencies of applied field for (a) pure TGS crystal and (b) MA-TGS crystal.
The value of true-remanent (switchable) polarization is important in memory devices as it is the actual ‘usable polarization’ which switches with the applied field. However, the value Pr which is reported commonly is not the true (switchable) remanent polarization value as it contains a contribution from polarization components which are not switchable (non-remanent) (Chowdhury et al., 2016). Therefore, the value reported, more often than not, is higher than the actual usable polarization value. In order to find the usable (remanent) component, it is necessary to eliminate the non usable (non-remanent) component, which was done using the ‘Remanent hysteresis’ task. This task utilizes the fact that the non-remanent component of polarization randomizes when the applied field is removed. Hence, in this task two logics (both containing two hysteresis) namely Logic 1 and Logic 0 were performed using a bipolar triangular pulse (TP). Logic 1 contains contributions from remanent and non-remanent polarization while Logic 0 contains only non-remanent polarization component. Subtracting Logic 0 from Logic 1 we get ‘remanent’ polarization only. The value of true-remanent (usable) polarization for MA-TGS crystal was found to be 1.05 μC/cm2 (Fig. 11) which is close to the remanent polarization value (1.27 μC/cm2) obtained from hysteresis task (Fig. 9). This shows the high ferroelectric quality of MA-TGS crystal since the contributions from non-remanent components is very small. Thus, MA-TGS crystal is a useful material for memory storage devices where the usable component of polarization (±Pr) serves as the switchable memory component (Boolean 0 and 1).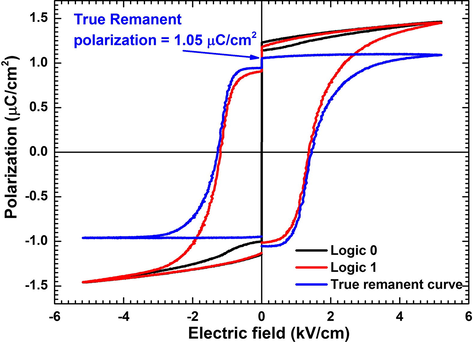
True-remanent polarization determination using remanent hysteresis task for MA-TGS crystal.
3.7 Theoretical calculations for spontaneous polarization (Ps)
TGS crystal displays its ferroelectric characteristics along ‘b’ crystallographic axis (Lal and Batra, 1993). Spontaneous polarization (Ps) for TGS crystal along the ferroelectric b-axis can be evaluated using the formula:
where, Qi is the charge and yi is the co-ordinate along 'b' axis of ith ion in the unit cell of TGS crystal and V represents the volume of the unit cell. The unit cell of TGS consists of two sulphate anions (SO42−), four glycinium cations (NH3+CH2COOH) and two neutral glycine molecules (NH3+CH2COO−) (see Fig. 12). The −2e charge is delocalized on sulphate anion, while +e charge is localized on nitrogen atom of glycinium cation. Thus, the co-ordinates of the center of mass of sulpahte anion and co-ordinates of nitrogen atoms were used for the calculations of Ps. Table 3 summarizes the details of y coordinates of several N atoms and center of mass of sulphate anions. The volume of TGS unit cell is equal to 632.88 Å3. The value of Ps is calculated to be equal to 2.43 μC/cm2, which is consistent with that of experimentally observed value (1.10 μC/cm2 for pure TGS and 1.34 μC/cm2 for MA-TGS).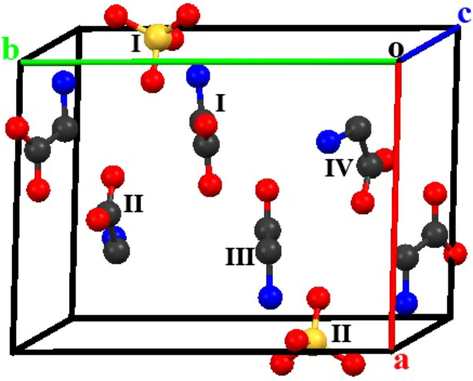
Unit cell diagram of TGS crystal. Color code: Yellow: Sulphur, Black: Carbon, Red: Oxygen, Blue: Nitrogen. Hydrogen atoms are removed for the reason of clarity.
Ions
y-coordinate (Å)
Charge (e)
SO42− (I)
9.46
−2e
SO42− (II)
3.16
−2e
NH3+CH2COOH (I)
7.24
e
NH3+CH2COOH (II)
9.92
e
NH3+CH2COOH (III)
5.42
e
NH3+CH2COOH (IV)
3.62
e
3.8 Nanoindentation study
From the indexed morphology of as grown TGS single crystals (Fig. 2), it can clearly be concluded that (1 0 0) plane is of largest morphological importance. Thus, it becomes necessary to investigate the mechanical strength of TGS crystal along (1 0 0) plane for deciding its suitability in electro-mechanical devices. Hence, the mechanical behavior of both the pure and doped TGS crystals was analyzed using nanoindentation technique.
Nanoindentation measurements have become an important tool to explore and understand the mechanical behavior at small scale by correlating molecular level property like crystal packing, bond strengths and lattice defects with mechanical strength (Thukral et al., 2019, 2014). Moreover, lattice defects play an important role in the plastic deformation of the materials. Especially, impurity inclusion in any compound induces enough stress to initiate a domain reorientation and changes the mechanical performance of the materials (Kitaigorodskii, 1973). The force and displacement are recorded in the nanoindentation measurement where the indenter tip is pressed into the sample surface with a predefined loading and unloading profile. A general description of all the calculations related to nanoindentation measurements is explained below.
A loading and unloading curve can be plotted using the relation:
Furthermore, the contact depth (hc) of the crystal can be evaluated from the value of stiffness using the relation:
Optical images of the pure TGS and MA-TGS single crystals after the indentations are shown in Fig. 13, which depicts the formation of cracks in the single crystal. Here, AFM images for pure TGS and MA-TGS single crystals are also shown at the loads 20 mN and 50 mN, respectively.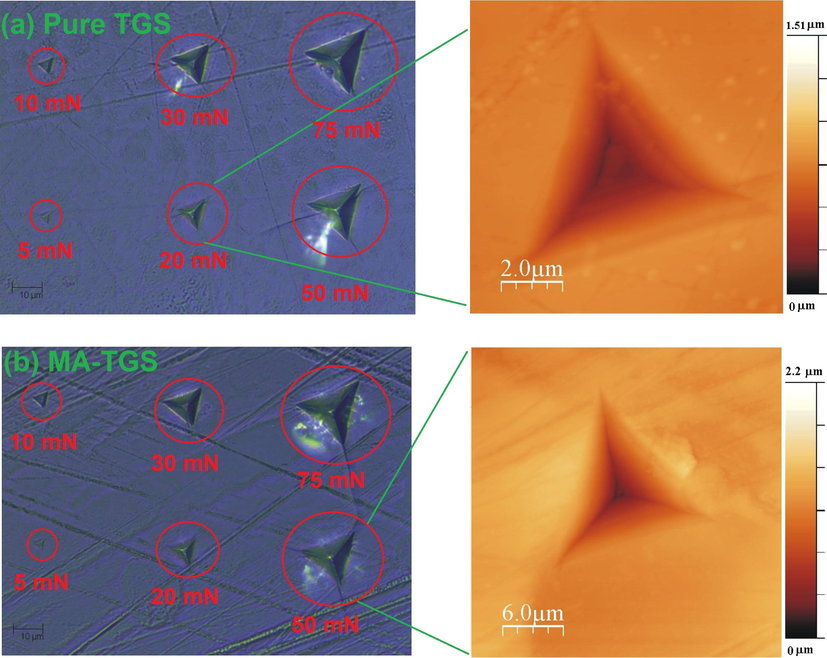
Optical images of indents made on (1 0 0) plane of (a) pure TGS and (b) MA-TGS crystals at various applied loads. Also, the AFM images of 20 mN and 50 mN indents are shown for pure TGS and MA-TGS, respectively.
Fig. 14(a) and (b) presents the plots between applied load versus displacement (P-h curves) obtained on the (1 0 0) facets of pure TGS and MA-TGS single crystals with different peak loads ranging 5–125 mN using a Berkovich tip. In both cases, large residual depths were observed upon unloading indicating the plastic deformation during indentation. In addition, smooth loading can be seen in both the cases with no traces of any ‘pop-in’ features (i.e. discrete displacement bursts) in loading curves for both the crystals were observed which implied that a smooth elastic–plastic transition occurred at the nano contact. However, some ‘pop-out’ features can be seen in unloading portion of P-h curve at higher loads. This is because a higher indentation load gives rise to a sudden deformation underneath the indenter, which raises the random nucleation of high stress phases during unloading and thus promotes pop-out (Ramamurty and Jang, 2014). The difference in hardness of the crystals is evident from the difference in the depth attained a maximum load. The P-h curves for a load of 125 mN are plotted together for both the crystals on the same axes (Fig. 14(c)) so that hardness of the crystals can be compared. It can be observed from Fig. 14(c) that for MA-TGS crystal, the maximum load of 125 mN produced a smaller displacement of the indenter tip (∼2715 nm) than for the pure TGS crystal (∼2888 nm). This suggests that MA-TGS crystal is significantly harder than pure TGS. The hardness of a crystalline material depends on the degree of lattice order, and it is highly affected by intermolecular forces and defects (Caceres et al., 2002; Yadav et al., 2015). Hardness was found to increase on doping because MA molecules may have entered the TGS lattice filling the void space and hence hindering the movement of dislocation. Moreover, the presence of the intra molecular hydrogen bonding in MA may help to make the packing more compact by hydrogen bonds formation in the crystal.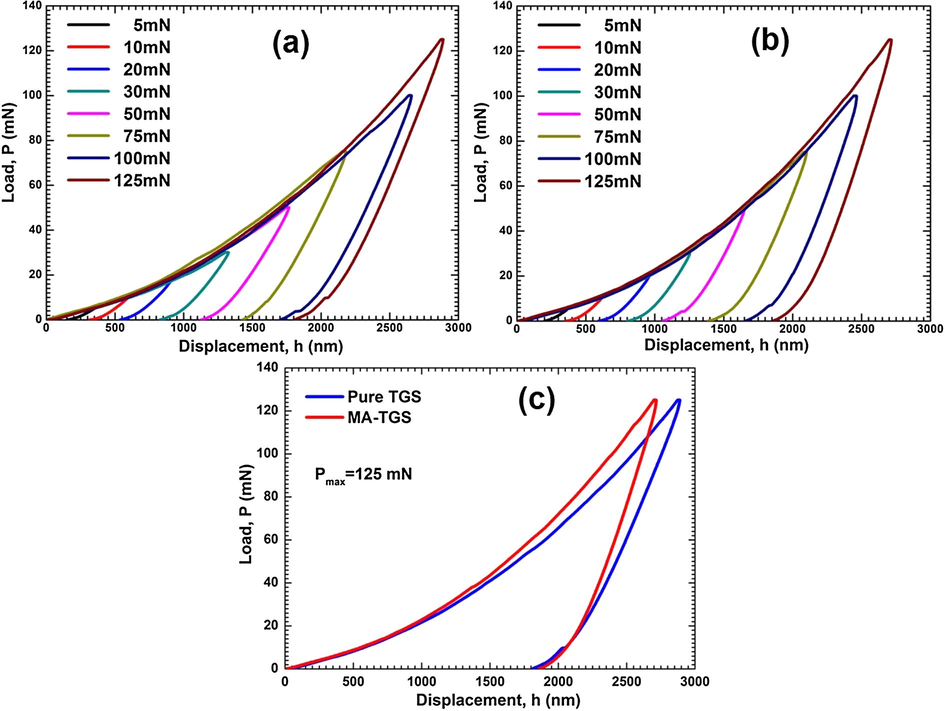
Load-displacement curves at different peak loads for (a) Pure TGS, and (b) MA-TGS. (c) Load-displacement curves for both pure and MA-TGS single crystals at peak load of 125 mN.
Further, the P-h curves were analyzed using Eq. (3)–(7) to calculate various parameters which are tabulated in Table 4. The value of hardness was found to decrease with increase in load for both the crystals, indicating a load dependent hardness parameter. This is referred to as the indentation size effect (ISE) (Goel et al., 2020). The variation of the contact depth with peak load is shown in Fig. 15. The contact depth was seen to increment with the peak load. This is because of the dependence of the hardness on the load. This suggests that the hardness of the material can be influenced by indentation size (Sonia et al., 2017). The peak load and contact depth of the material are related through the polynomial function as follows:
Pmax: peak load, HIT: indentation hardness, EIT: indentation modulus, Hv: Vickers hardness, S: stiffness, hmax: maximum indentation depth, hc: contact depth of indenter, hr: tangent depth, hf: permanent indentation depth after removal of the force, m: empirical parameter.
Sample name
Pmax
(mN)HIT
(MPa)EIT
(GPa)HV
(Vickers)S
(mN/nm)hmax
(nm)hc
(nm)hr
(nm)hf
(nm)m
Pure TGS
5.05
3245.3
25.899
300.55
0.0404
154.88
255.08
348.88
223.91
1.49
10.03
2894.0
25.244
268.02
0.0588
326.53
467.00
594.52
424.01
1.53
20.05
2505.9
23.327
232.08
0.0827
550.34
762.03
942.60
700.31
1.57
30.05
1782.6
19.335
165.09
0.0999
842.59
1102.42
1326.23
1025.54
1.58
50.06
1637.9
17.247
151.69
0.1203
1154.10
1451.74
1765.70
1349.44
1.45
75.07
1536.9
16.686
142.33
0.1472
1449.21
1793.66
2179.46
1669.34
1.43
100.06
1274.5
15.109
118.03
0.1692
1736.59
2217.92
2659.63
2068.25
1.54
125.06
1360.9
15.196
126.03
0.1841
1849.09
2379.52
2888.39
2209.04
1.51
MA-TGS
5.04
2879.4
28.771
266.66
0.0475
361.27
281.12
255.13
203.72
1.44
10.04
2585.5
27.930
239.45
0.0687
611.11
502.83
465.00
366.90
1.64
20.04
2274.2
25.369
210.61
0.0943
959.07
801.28
746.49
609.34
1.61
30.04
1935.5
23.280
179.24
0.1150
1253.96
1060.12
992.79
825.45
1.62
50.06
1761.9
22.406
163.17
0.1499
1650.71
1404.34
1316.76
1076.90
1.71
75.08
1533.0
20.747
141.97
0.1825
2101.03
1795.75
1689.70
1432.45
1.62
100.05
1412.9
20.238
130.85
0.2142
2463.48
2117.93
1996.39
1689.58
1.66
125.06
1436.5
20.274
133.04
0.2379
2715.40
2322.69
2189.73
1901.57
1.54
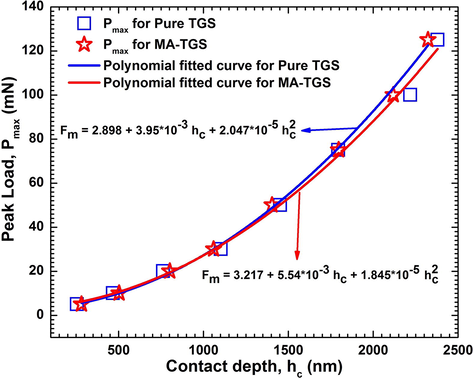
The plots between Peak load and Contact depth for both Pure TGS and MA-TGS single crystal.
The Young’s modulus values were extracted from the P-h curves and the graphs between Young’s modulus and the peak load for both the crystals were plotted (shown in Fig. 16). Young’s modulus was found to decrease with increase in load. This is because the increased load offered by the Berkovich tip causes an increase in strain in the crystals. It should be noted that the tip imperfection of the indenter does not influence the hardness results (Sakharova et al., 2009). Recently, Antunes et al. (2007) reported that a correction of the geometry of the Vickers indenters with offset is enough to obtain accurate values of the mechanical properties, viz. the hardness and Young's modulus. However, to understand the degree of indenter tip rounding, the graph between initial loading stiffness, S and the contact depth at peak load, hc for both the crystal was plotted and a linear relationship between S and hc was observed (Fig. 17). The relation between the initial unloading stiffness S and the contact depth at various peak loads, hc is given by the equation:
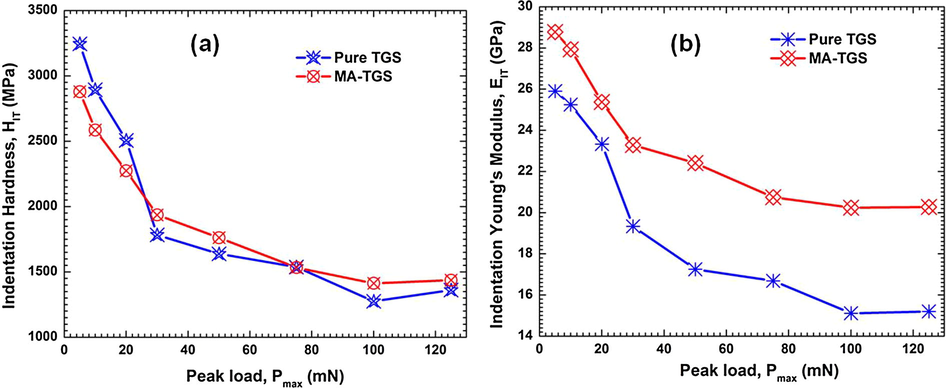
The variation of (a) indentation hardness and (b) Young’s modulus, with peak load for both Pure TGS and MA-TGS single crystal.
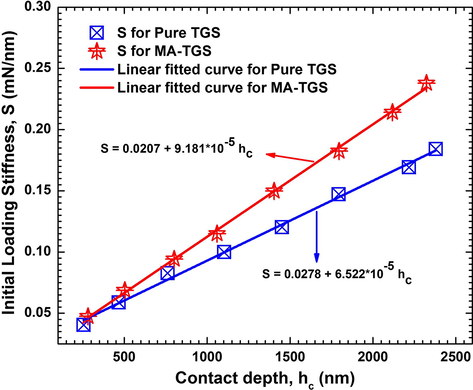
The graph Stiffness vs. Contact depth for both Pure TGS and MA-TGS single crystal.
4 Conclusions
Good quality transparent single crystals of pure TGS and MA-TGS were successfully grown by slow evaporation method at room temperature. The lattice parameters were determined by single crystal XRD and powder XRD analysis. Both crystals were observed to have monoclinic symmetry with the space group P21. The changes observed in the unit cell parameters due to MA doping confirmed the incorporation of MA in TGS lattice. CHNS analysis confirmed the desired elemental composition of the crystals. DTA curve showed a lower decomposition temperature for MA-TGS crystal than that of pure TGS crystal confirming the presence of MA in TGS lattice. MA doping resulted in an increase in Curie temperature from 49 to 51 °C, and decrease in the value of dielectric constant and loss making MA-TGS crystal useful for optoelectronic applications. Also, an enhancement in the value of piezoelectric charge coefficient (d22) from 56.23 to 72.02 pm/V was observed for MA-TGS crystal making it a potential candidate for piezoelectric applications. Excellent saturated P-E hysteresis loops were obtained for both the crystals with higher values of spontaneous and remanent polarizations for MA-TGS crystals. Squareness factor, Rsq was determined to be 1.99 for pure TGS and 1.98 for MA-TGS that indicates applications of both crystals in switching devices. Moreover, the value of true remanent polarization for MA-TGS crystal was found to be 1.05 μC/cm2, which makes MA-TGS crystal a futuristic memory component material for switching devices. The investigation of mechanical behavior of as-grown pure TGS and MA-TGS crystals was carried out thoroughly using nanoindentation technique. The study revealed that both the crystals have good capability to withstand deformation caused by applying various loads. The various mechanical parameters like hardness, stiffness and Young’s modulus were determined. Both hardness and Young’s modulus were observed to be greater for MA-TGS crystal than pure TGS crystal. In summary, enhanced piezoelectric, ferroelectric and mechanical properties of MA-TGS single crystal suggests its use as an efficient and cheap alternative to pure TGS based electro-mechanical devices. Table 5 compares the various results obtained for pure TGS and MA-TGS crystals.
Crystals
εmax
(at 1 kHz)Tc
(oC)d22 (pm/V)
Pr (μC/cm2)
Ec (kV/cm)
Ho (Mpa)
Er
(GPa)
Pure TGS
863
49
56.23
1.01
1.61
753.2
65.22
MA-TGS
593
51
72.02
1.27
1.24
835.5
91.81
Acknowledgements
We are thankful for the financial support received through the DRDO Project (ARMREB/MAA/2015/163) and DST project (EMR/2015/000385). Abid Hussain, Sahil Goel and Abhilash Joseph would like to thank CSIR and DRDO for providing the Junior Research Fellowship (JRF). Dr. Nidhi Sinha expresses her gratitude to the Principal, SGTB Khalsa College for encouragement and support for research work. Budhendra Singh would like to express his personal thanks to Fundaçâo para a Ciência e a Tecnologia (FCT) for post-doctoral research grant SFRH/BPD/76184/2011. Igor Bdikin also wish to acknowledge FCT for its financial support (grant IF/00582/2015).
References
- Effect of divalent-ions-doping on the absorption spectra and optical parameters of triglycine sulphate crystals. J. Phys. Chem. Solids. 1999;60(11):1881-1893.
- [CrossRef] [Google Scholar]
- Pyroelectric coefficient manipulation in doped TGS crystals. Appl. Surf. Sci.. 2006;253:358-362.
- [CrossRef] [Google Scholar]
- Doped TGS crystals for IR detection and sensors. Sens. Actuators, A. 2004;113(3):387-392.
- [CrossRef] [Google Scholar]
- Influence of Vickers tip imperfection on depth sensing indentation tests. Int. J. Solids Struct.. 2007;44(9):2732-2747.
- [CrossRef] [Google Scholar]
- Dielectric properties of L-asparagine doped TGS (Asp-TGS) crystals. Ferroelectrics. 2003;295(1):87-95.
- [CrossRef] [Google Scholar]
- Balakumar, S., Zeng, H.C., 2000. Subramanian Balakumar and Hua C. Zeng* Department of Chemical and Environmental Engineering, Faculty of Engineering, National University of Singapore, 10 Kent Ridge Crescent, Singapore 119260 Received 4th October 1999, Accepted 8th December 1999, 1–6.
- Piezoelectric coefficients of L-alanine doped TGS crystals. Sens. Actuators, A. 2004;110(1–3):350-353.
- [CrossRef] [Google Scholar]
- Nanoindentation induced piezoelectricity in SrTiO3 single crystals. Scr. Mater.. 2014;74(April):76-79.
- [CrossRef] [Google Scholar]
- Flux growth of lead free (Na0.5Bi0.5)TiO3–(K0.5Bi0.5)TiO3 ferroelectric single crystals and their characterization. CrystEngComm. 2014;16(21):4459.
- [CrossRef] [Google Scholar]
- Hardness and elastic modulus from nanoindentations in nominally pure and doped MgO single crystals. Philos. Mag. A. 2002;82(6):1159-1171.
- [CrossRef] [Google Scholar]
- Growth and characterization of doped TGS crystals for infrared devices. Cryst. Growth Des.. 2002;2(5):431-435.
- [CrossRef] [Google Scholar]
- Effect of isovalent lanthanide cations compensation for volatilized A-site bismuth in Aurivillius ferroelectric bismuth titanate. J. Mater. Sci. Mater. Electron.. 2017;28:4637-4646.
- [CrossRef] [Google Scholar]
- Determination of intrinsic ferroelectric polarization in lossy improper ferroelectric systems. Appl. Phys. Lett.. 2016;109:92902.
- [CrossRef] [Google Scholar]
- Investigations on growth, thermal, electrical, and etching studies of KCl-doped triglycine sulfate single crystals. J. Therm. Anal. Calorim.. 2012;110:1107-1112.
- [CrossRef] [Google Scholar]
- Optical, dielectric & ferroelectric studies on amino acids doped TGS single crystals. RSC Adv.. 2016;6(40):33686-33694.
- [CrossRef] [Google Scholar]
- Optical, piezoelectric and mechanical properties of xylenol orange doped ADP single crystals for NLO applications. Arabian J. Chem.. 2020;13:146-159.
- [CrossRef] [Google Scholar]
- Crystal structure of the ferroelectric phase of (Glycine)3·H2SO4. Phys. Rev.. 1959;115(2):323-330.
- [CrossRef] [Google Scholar]
- Journal of Asian Ceramic Societies morphotropic phase boundary for high performance piezoelectric, ferroelectric and pyroelectric applications. Integrat. Med. Res.. 2016;4(3):337-343.
- [CrossRef] [Google Scholar]
- Improvement in dielectric, piezoelectric and ferroelectric properties of 0.64PMN?0.36PT ceramics by Sb modification. J. Mater. Sci.: Mater. Electron. 2017
- [CrossRef] [Google Scholar]
- Nucleation kinetics, growth, mechanical, thermal and optical characterization of sulphamic acid single crystal. CrystEngComm. 2013;15(46):10034.
- [CrossRef] [Google Scholar]
- Molecular Crystals and Molecules. London: Academic Press; 1973.
- MgCl2 added triglycine sulphate crystals. Adv. Mater. Lett.. 2011;2(2):163-169.
- [CrossRef] [Google Scholar]
- Enhancement in dielectric and ferroelectric properties of lead free Bi0.5(Na0.5K0.5)0.5TiO3 ceramics by Sb-doping. Ceram. Int.. 2011;37:2997-3004.
- [CrossRef] [Google Scholar]
- Ferroelectrics growth and properties of triglycine sulfate (TGS) crystals: review. Ferroelectrics. 1993;142:51-82.
- [CrossRef] [Google Scholar]
- Communication A novel TGS-like inorganic − organic hybrid and a preliminary investigation of its possible ferroelectric behavior a novel TGS-like inorganic − organic hybrid and a preliminary investigation of its possible ferroelectric behavior. Society. 2004;43(13):3768-3770.
- [CrossRef] [Google Scholar]
- Li-substituted K0.5Na0.5NbO3-based piezoelectric ceramics: crystal structures and the effect of atmosphere on electrical properties. J. Alloy. Compd.. 2016;658:839-847.
- [CrossRef] [Google Scholar]
- Growth and characterisation of L-cystine doped TGS crystals. J. Cryst. Growth. 2001;226(2–3):303-312.
- [CrossRef] [Google Scholar]
- Investigations on the electrical and mechanical properties of triglycine sulphate single crystals modified with some rare earth metal ions. Mater. Lett.. 2003;57(21):3291-3295.
- [CrossRef] [Google Scholar]
- Organic nonvolatile memory devices based on ferroelectricity. Adv. Mater.. 2010;22(9):933-945.
- [CrossRef] [Google Scholar]
- An improved technique for determining hardness and elastic modulus using load and displacement sensing indentation experiments. J. Mat. Res.. 1992;7(6):1564-1583.
- [CrossRef] [Google Scholar]
- Surface enhanced raman spectroscopy studies on triglycine sulphate single crystals. J. Mol. Struct.. 2017;1128:428-438.
- [CrossRef] [Google Scholar]
- Synthesis and characterization of semiorganic sodium hydrogen maleate trihydrate (SHMT) single crystal: a third-order nonlinear optical material. J. Mol. Struct.. 2015;1102:63-70.
- [CrossRef] [Google Scholar]
- Growth of triglycine sulphate single crystals doped by cobalt (II) phosphate. Cryst. Res. Technol.. 2001;36(11):1189-1195.
- [CrossRef] [Google Scholar]
- Crystal growth and dielectric, mechanical, electrical and ferroelectric characterization of n-bromo succinimide doped triglycine sulphate crystals. Physica B. 2011;406(17):3308-3312.
- [CrossRef] [Google Scholar]
- 8 MeV electron irradiation effect on the dielectric and optical properties of iminodiacetic acid doped ferroelectric triglycine sulphate crystals. Nucl. Instrum. Methods Phys. Res., Sect. B. 2010;268(16):2510-2514.
- [CrossRef] [Google Scholar]
- Improved ferroelectric and pyroelectric parameters in iminodiacetic acid doped TGS crystal. J. Cryst. Growth.. 2010;312:273-275.
- [CrossRef] [Google Scholar]
- Effect of Rochelle salt on growth, optical, photoluminescence, photoconductive and piezoelectric properties of the triglycine sulphate single crystal. J. Cryst. Growth. 2017;468:340-344.
- [CrossRef] [Google Scholar]
- Nanoindentation for probing the mechanical behavior of molecular crystals–a review of the technique and how to use it. CrystEngComm. 2014;16(1):12-23.
- [CrossRef] [Google Scholar]
- Flexible lead-free BiFeO3/PDMS-based nanogenerator as piezoelectric energy harvester. ACS Appl. Mater. Interfaces. 2016;8:26190-26197.
- [CrossRef] [Google Scholar]
- Comparison between Berkovich, Vickers and conical indentation tests: a three-dimensional numerical simulation study. Int. J. Solids Struct.. 2009;46(5):1095-1104.
- [CrossRef] [Google Scholar]
- Dielectric and ferroelectric properties of phosphoric acid doped triglycine sulfate single crystals. Mater. Sci. Eng. B: Solid-State Mater. Adv. Technol.. 2001;79(2):91-97.
- [CrossRef] [Google Scholar]
- A comparative study of ferroelectric triglycine sulfate (TGS) crystals grown by conventional slow evaporation and unidirectional method. Mater. Res. Bull.. 2012;47(6):1587-1597.
- [CrossRef] [Google Scholar]
- Performance of crystal violet doped triglycine sulfate single crystals for optical and communication applications. CrystEngComm. 2015;17(30):5757-5767.
- [CrossRef] [Google Scholar]
- Enhancement in ferroelectric, pyroelectric and photoluminescence properties in dye doped TGS crystals. J. Solid State Chem.. 2012;190:180-185.
- [CrossRef] [Google Scholar]
- Solution growth and comparative characterization of L-HFB single crystals. Cryst. Res. Technol.. 2009;44:167-172.
- [CrossRef] [Google Scholar]
- Sonia, S., Vijayan, N., Vij, M., Kumar, P., Singh, B., Das, S., ... H., S. (2017). Assessment of the imperative features of an L-arginine 4-nitrophenolate 4-nitrophenol dihydrate single crystal for non linear optical applications. Mater. Chem. Front. 1(6), 1107–1117. http://doi.org/10.1039/C6QM00217J.
- Growth, structural, mechanical, spectral and dielectric characterization of NaCl-added Triglycine sulfate single crystals. Curr. Appl Phys.. 2009;9(5):1155-1159.
- [CrossRef] [Google Scholar]
- In-depth behavioral study of l-Prolinium Trichloroacetate single crystal: an efficient candidate for NLO applications. Arabian J. Chem.. 2019;12(8):4887-4896.
- [CrossRef] [Google Scholar]
- Growth, structural and mechanical analysis of a single crystal of L-prolinium tartrate: a promising material for nonlinear optical applications. CrystEngComm. 2014;16(39):9245-9254.
- [CrossRef] [Google Scholar]
- Multiferroic bismuth ferrite-based materials for multifunctional applications: ceramic bulks, thin films and nanostructures. Prog. Mater Sci.. 2016;84:335-402.
- [CrossRef] [Google Scholar]
- Potassium-sodium niobate lead-Free piezoelectric materials: past, present, and future of phase boundaries. Chem. Rev.. 2015;115:2559-2595.
- [CrossRef] [Google Scholar]
- Superior piezoelectric properties in potassium-sodium niobate lead-free ceramics. Adv. Mater.. 2016;28:8519-8523.
- [CrossRef] [Google Scholar]
- Growth and characterization of new semiorganic nonlinear optical and piezoelectric lithium sulfate monohydrate oxalate single crystals. Mater. Res. Bull.. 2015;64:194-199.
- [CrossRef] [Google Scholar]


