

Translate this page into:
Metabolomics reveals differences in metabolite profiles between wild and cultivated Tetrastigmae Radix
⁎Corresponding authors. caizhichen2008@126.com (Zhichen Cai), 300100@njucm.edu.cn (Xunhong Liu)
-
Received: ,
Accepted: ,
This article was originally published by Elsevier and was migrated to Scientific Scholar after the change of Publisher.
Peer review under responsibility of King Saud University. Production and hosting by Elsevier.
Abstract
Tetrastigmae Radix (TR) is the tuber of Tetrastigma hemsleyanum Diels et Gilg, which is frequently used in Chinese folklore medicine as a therapeutic food. TR is becoming more popular because of its superior pharmacological properties, including anticancer and antioxidant properties. However, wild-TR (WTR) resources are few in the market, and cultivated-TR (CTR) is progressively replacing WTR as the primary source of commercial herbs. Furthermore, because of its diverse growing environment, CTR may differ from WTR in terms of characteristics, metabolites, and pharmacological actions. There are currently fewer investigations on the two ecotypes, and their distinctions are unclear. As a result, this study used UFLC-Triple TOF-MS/MS to undertake untargeted metabolomics analysis of CTR and WTR, and then used statistical analysis to screen for differential accumulate metabolites (DAMs). KEGG enrichment analysis was performed on the DAMs, and the active pharmaceutical DAMs in the enrichment pathway were measured using UFLC-QTRAP-MS/MS. The results reveal that 152 metabolites of 14 different categories were discovered, with flavonoids and lipids accounting for the majority of the 35 DAMs tested by OPLS-DA. Some lipids were up-regulated in the CTR, whereas flavonoids were up-regulated in the WTR; and 777 pairs of DAM metabolites exhibited significant connection based on Pearson correlation analysis. The mainly enriched pathways were flavone and flavonol biosynthesis, TCA cycle, galactose metabolism, and others. KEGG enrichment analysis revealed four active pharmaceutical metabolites in the enriched pathways, and demonstrated that their concentrations were greater in WTR than in CTR. Overall, this work used a comprehensive metabolomic analysis to provide a theoretical foundation for resource identification, diet formulation, and pharmacological studies of CTR and WTR.
Keywords
Tetrastigmae Radix
Metabolomics
Wild
Cultivated
UFLC-Triple TOF-MS/MS
UFLC-QTRAP-MS/MS

1 Introduction
Tetrastigma hemsleyanum Diels et Gilg is a vine of hemsleyanum in the Vitaceae family (Li, 1998). Its tuberous roots are dried and processed to be used as a traditional Chinese medicine (TCM) called Tetrastigmae Radix (TR), also known as “Sanyeqing” in Chinese. TR has demonstrated positive pharmacological activities such as anticancer (Xiong et al., 2015), antioxidant (Sun et al., 2021), anti-inflammatory (Zhan et al., 2022), and immunomodulatory (Wu et al., 2023), which can treat diseases such as pneumonia, asthma, hepatitis, and nephritis (Peng, 2018). TR was utilized as one of the constituents of the preparation named “Huashixuanfeiheji” in the treatment of COVID-19 outbreaks, and it had a high heat-clearing and detoxifying effect. TR has a high concentration of starch, polysaccharides, and other nutrients. In southern China, it is consumed for both medicinal and dietary reasons. In recent years, the effective development of health products such as TR's powder and nutritious tablets has shown their enormous nutritional benefits (Peng, 2018). TR was classified as a new “Zhebawei” by Zhejiang Province in 2018 owing to its regional efficacy, industrial size, and potential to enhance farmer income.
Tetrastigma hemsleyanum is primarily found in southern China, particularly in Zhejiang Province (Zhang et al., 2022). It is widely distributed and thrives in chilly, high-humidity woodlands. Due to its long growth period, high market price, and excessive excavation, the wild Tetrastigmae Radix (WTR) is becoming increasingly scarce. With advancements in TR cultivation technology and increased production, cultivated Tetrastigmae Radix (CTR) has become the main circulation type in the market. There are currently few researches on diverse ecotypes of TR, with the majority of them focusing on resource concerns such as origins (Chen et al., 2022; Dong et al., 2022; Xia et al., 2023), harvesting periods (Xiang et al., 2021), ages (Hang et al., 2023), and different parts of the medicinal plant (Bai et al., 2022). Furthermore, research on the metabolites in various TR ecotypes is insufficiently thorough since they are limited to metabolites such as total flavonoids (Wang et al., 2017). In nature, plants of different ecotypes exhibit significant differences in organ appearance and metabolites (Hyeon et al., 2020; Wang et al., 2023). These differences between cultivated and wild-type plants are related to changes in growing circumstances, which affect the physiological ecology of the plants. As a result, a different study of the whole metabolite profile of CTR and WTR is required. This analysis will provide a theoretical basis for resource identification, food development, and pharmacological studies of TR.
Modern phytochemistry has shown that TR contains a variety of metabolites, including flavonoids, organic acids, amino acids, nucleosides, alkaloids, saccharides, triterpenes, steroids, and lipids (Zhu et al., 2020). Among them, flavonoids (Han et al., 2023), saccharides (Wu et al., 2023), and lipids (Xia et al., 2023) are extensively researched as the primary nutritional metabolites and active pharmaceutical metabolites of TR. Metabolomics has been increasingly applied to analyze metabolites and identify differential accumulate metabolites (DAMs) to compare the chemical differences between samples. In recent years, various metabolomic analytical techniques, including LC-MS (Sun et al., 2013), GC–MS (Xiong et al., 2015), and NMR (Wang et al., 2018), have been utilized for metabolite identification. UFLC-Triple TOF-MS/MS is a technique that offers a wide analytical range, high resolution, low detection limits, high separation capacity, fast analysis, and reliable qualitative results (Mei et al., 2021). It has grown in prominence in recent years for metabolite analysis and has become a cornerstone technique in the field of metabolomics research (Wang et al., 2019).
In this study, 34 samples of CTR and WTR from Zhejiang Province were chosen to evaluate the differential metabolites. Firstly, the metabolites in CTR and WTR were qualitatively identified by UFLC-Triple TOF-MS/MS; then the obtained data were then used for multivariate statistical analysis to screen DAMs. KEGG enrichment analysis of DAMs was performed to analyze the metabolic pathways with differences. Ultimately, the pharmacologically active metabolites (procyanidin B2, catechin, astragalin, and kaempferin) involved in these pathways were targeted for quantitative analysis by UFLC-QTRAP-MS/MS. This study may provide a theoretical basis for resource identification, food development, and pharmacological studies of TR.
2 Materials and methods
2.1 Plant materials
Both CTR and WTR were collected in June 2022 in Zhejiang Province, China. CTR was collected from Ningbo (E121°44′28.36″, N29°49′0.17″), Taizhou (E120°55′51.13″, N28°35′42.58″), while WTR was collected from Ningbo (E121°44′28.36″, N29°49′0.17″), Lishui (E120°25′16.11″, N28°14′21.09″), and Zhoushan (E122°06′24.44″, N30°01′21.09″). Their botanical origins were identified as Tetrastigma hemsleyanum by the corresponding author. All fresh samples were subjected to a drying process using hot air at a temperature of 60 ℃, followed by slicing for subsequent preparation. The sample details are presented in Table S1. Both CTR and WTR exhibit a gourd-shaped morphology, but they can be distinguished by variations in diameter, length, epidermis, section color, and density (Fig. 1).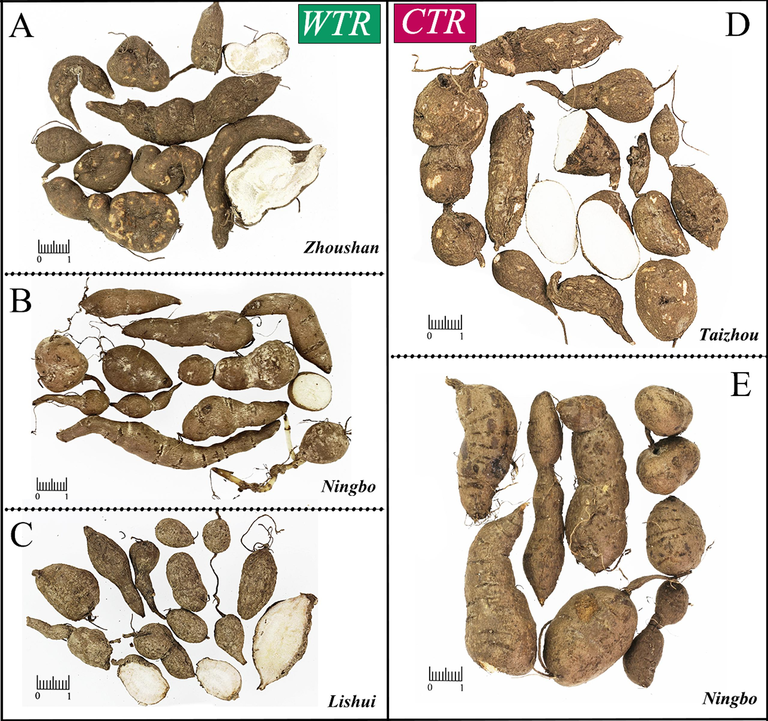
The samples of WTR and CTR were utilized in this experiment. WTR was collected in Zhoushan (A), Ningbo (B), and Lishui (C); CTR was collected in Taizhou (D) and Ningbo (E).
2.2 UFLC-triple TOF-MS/MS analysis
2.2.1 Chemicals and sample preparation
The experiment utilized a set of standards, as follows: lysine, histidine, serine, aspartic acid, threonine, glutamic acid, proline, valine, tyrosine, isoleucine, leucine, phenylalanine, epigallocatechin, catechin, epicatechin, orientin, isoorientin, vitexin-2″-O-rhamnoside, aromadendrin, hyperoside, isoquercitrin, quercitrin, astragalin, nicotiflorin, narcissin, quercetin, kaempferin, luteolin, kaempferol, isorhamnetin, apigenin, cytidine, uracil, hypoxanthine, adenosine, uridine, 2′-deoxyadenosine, guanosine, inosine, 2′-deoxyguanosine, 2′-deoxyinosine, gallic acid, protocatechuic acid, 3,4-dihydroxybenzaldehyde, neochlorogenic acid, chlorogenic acid, cryptochlorogenic acid, caffeic acid, polydatin, piceatannol, resveratrol, procyanidin B2, procyanidin B1. Information regarding the standards can be found in Table S2.
The dried TR was pulverized and subsequently sifted through a 65-mesh sieve, resulting in the production of a dried TR powder. A precise amount of 5 mL of ethanol with a concentration of 60 % was added, the container was sealed, and its weight was measured. Ultrasonic treatment was conducted at a power of 500 W and a frequency of 40 kHz for 50 min, followed by a cooling period. To compensate for the weight loss, a solution containing 60 % ethanol should be prepared, thoroughly mixed, and subsequently filtered. The filtrate underwent centrifugation at a speed of 12,000 revolutions per minute for 10 min, and subsequently, the supernatant was collected. The solution was passed through a microporous filter membrane with a pore size of 0.22 μm and collected in a vial containing the liquid phase. Subsequently, the samples were injected into a UFLC-Triple TOF-MS/MS instrument for analysis. Equal quantities of extracts from each sample were combined and employed as quality control (QC) samples.
2.2.2 Chromatography and mass spectrometry conditions
Samples were subjected to analysis using an Ultra-Fast Liquid Chromatography (UFLC) system manufactured by Shimadzu, located in Kyoto, Japan. Chromatographic column: Agilent ZORBAX SB-C18 column (4.6 mm × 250 mm, 5 μm); mobile phase: methanol (A) - water (containing 0.4 % formic acid, B); gradient elution: 0 min, 5 % A; 6 min, 21 % A; 20 min, 35 % A; 26 min. 45 % A; 30 min, 60 % A; 34 min, 82 % A; 36 min, 90 % A; 40 min, 90 % A; 43 min, 5 % A; 46 min, 5 % A; column temperature of 30 ℃, flow rate of 0.9 mL/min, and injection volume of 10 μL.
Mass spectrometry data were obtained using an AB Sciex Triple TOF TM 5600 system-MS/MS (AB SCIEX, Framingham, MA, USA) equipped with an electrospray ionization (ESI) source. ESI data were acquired using both positive and negative ion modes. The mass scan range was set to m/z 50–1500. The temperature of the ion source (TEM) was maintained at 550 ℃. In negative ion mode, the spray voltage (IS) was set to −4500 V, while in positive ion mode, it was set to 4500 V. The declustering potential (DP) was set to −100 V in negative ion mode and 100 V in positive ion mode. The mass sweep range was set to 50 to 1500 m/z. The curtain gas pressure (CUR) was maintained at 40 psi, while the atomizing gas pressure (GS1) and auxiliary gas pressure (GS2) were both set to 60 psi.
2.2.3 Identification of metabolite profiling and data analysis
A metabolite database of TR was built by conducting a comprehensive search across various databases, including China National Knowledge Infrastructure (CNKI), HMDB, ZINC, ChemSpider, and PubMed. SciFinder was utilized to validate the chemical name, molecular formula, and structure of the metabolites. The identification of metabolites in the samples was achieved through a combination of methods. These methods involve matching retention times, precise measurement of masses against established standards and databases, cross-referencing metabolites and databases, and the guidelines outlined in relevant literature about structural modifications in metabolites. UFLC-Triple TOF-MS/MS data were analyzed using PeakView 1.2 (AB Sciex) and MarkerView 1.2.1 software (AB Sciex).
2.3 Statistical analysis
The total ion chromatogram (TIC) plots of the samples were generated using Peakview 1.2 software (AB Sciex) in both positive and negative ion modes. The same metabolites of CTR and WTR were obtained through analysis using MarkerView 1.2.1 software (AB Sciex). Principal component analysis (PCA), orthogonal partial least squares discriminant analysis (OPLS-DA), and clustering heat map were generated using Wekemo Bioincloud (https://bioincloud.tech/). DAMs were identified using the following criteria: variable importance in projection (VIP) > 1, P < 0.05, fold change (FC) > 1.2, and FC < 0.83. VIP values were obtained using SIMCA-P 13.0 software (Umetrics AB, Umea, Sweden). P values and FC values were provided by MarkerView 1.2.1 software (AB Sciex). Volcano maps were created by the online platform Bioinformatics (https://www.bioinformatics.com.cn/). Correlation analysis was conducted using Origin 2021 software (OriginLab, Northampton, MA, USA). A significance level of P < 0.05 was employed to determine the presence of a statistically significant correlation between the two metabolites.
2.4 KEGG annotation and metabolic pathway analysis of differential metabolites
The information of the DAMs was imported into the KEGG system and matched with the corresponding KEGG IDs. The relevant enriched pathways were then screened by inputting the KEGG IDs into the link (https://www.metaboanalyst.ca/). The screening was performed based on a significance level of P < 0.05. The KEGG enrichment bubble map was made by “Bioinformatics”. The KEGG pathway map was generated by querying each pertinent enrichment pathway using the website (https://www.kegg.jp/kegg/pathway.html).
2.5 UFLC-QTRAP-MS/MS analysis
2.5.1 Chemicals and sample preparation
Since catechin, procyanidin B2, astragalin, and kaempferin were located in the pathway that was enriched according to KEGG enrichment analyses, and these metabolites in TR have been found to possess significant pharmacological activity (Ding et al., 2019; Fu et al., 2015; Lee et al., 2017; Sun et al., 2015). Therefore, in order to further explore the differences between the two ecotypes, a quantitative analysis was conducted on four metabolites. Detailed information regarding the four standards can be found in Table S2.
The TR was subjected to hot air drying at a temperature of 60 °C, followed by pulverization using a powdering machine. Then 0.5 g of TR powder was weighed, screened with a 65-mesh sieve and transferred into a 50 mL centrifuge tube. Next, add 12.5 mL of 60 % ethanol to the tube. After subjecting the sample to 50 min of ultrasonication at a power of 500 W and a frequency of 40 kHz, the weight loss was compensated for using a 60 % ethanol solution. The filtrate was subsequently subjected to filtration and centrifugation at a speed of 12,000 revolutions per minute for 10 min. The supernatant underwent filtration using a microporous membrane with a pore size of 0.22 μm. Subsequently, the filtered solution was injected into a liquid phase vial to serve as the sample solution.
2.5.2 Chromatography and mass spectrometry conditions
The chromatographic analysis of TR was conducted using a SIL-20A XR system manufactured by Shimadzu in Kyoto, Japan. The separation was performed using the XBridge®C18 column (4.6 mm × 100 mm, 3.5 µm) at a temperature of 30 ℃, with an injection volume of 2 µL. The mobile phase consisted of a 0.4 % formic acid water solution (A) and a methanol solution (B) with a flow rate of 0.8 mL/min. The gradient elution was performed as follows: 0 min, 7 % B; 4 min, 9 % B; 6 min, 21 % B; 10 min, 35 % B; 12 min, 38 % B; 16 min, 46 % B; 20 min, 64 % B; 21 min, 7 % B.
The AB SCIEX API5500 triple quadrupole linear ion trap tandem mass spectrometer, equipped with an electrospray ionization (ESI) source, was utilized for detection (Framingham, MA, USA). The ion source temperature was set at 550 ℃. The nebulizer gas flow, auxiliary gas flow, and curtain gas flow were 55 psi, 55 psi, and 40 psi respectively. In the negative mode, the spray voltage (IS) was set to −4500 V. Analytes were detected using the multiple-reaction mode (MRM). The method validation for the quantitative analysis of the four targeted metabolites is presented in Table S3.
3 Results and discussion
3.1 Identification of unique metabolite profilings
Metabolites extracted from CTR and WTR were identified by UFLC-Triple TOF-MS/MS in positive and negative ion modes. The TIC chromatograms of the samples were presented in Fig. 2. A total of 152 metabolites were identified in this study, and they were classified into 14 categories including 44 flavonoids, 28 lipids, 15 amino acids, 12 organic acids, 11 nucleosides, 8 phenolic glycosides, 8 phenylpropanoids, 5 terpenoids, 4 stilbenes, 4 tannins, 4 alkaloids, 2 glycans, 2 steroids, and 5 metabolites of undefined type (Fig. 3A). Among the 152 metabolites identified, 132 metabolites were shared between CTR and WTR. In addition, 17 metabolites were exclusively identified in CTR, whereas three metabolites were found to be unique to WTR (Fig. 3B). Fifty-three of these metabolites were identified by comparison of retention times with standards. Additional details regarding the metabolites can be found in Table S4.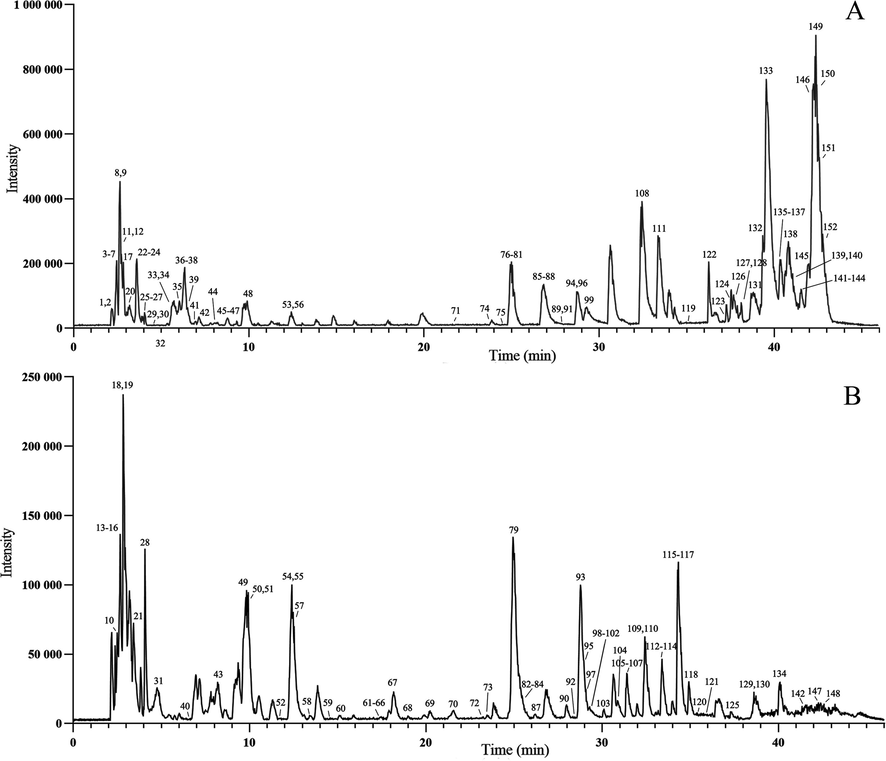
TIC diagrams corresponding to the positive and negative ion modes of samples, with the numbers corresponding to the metabolites listed in Table S4. A. TIC diagram in positive ion mode. B. TIC diagram in negative ion mode.
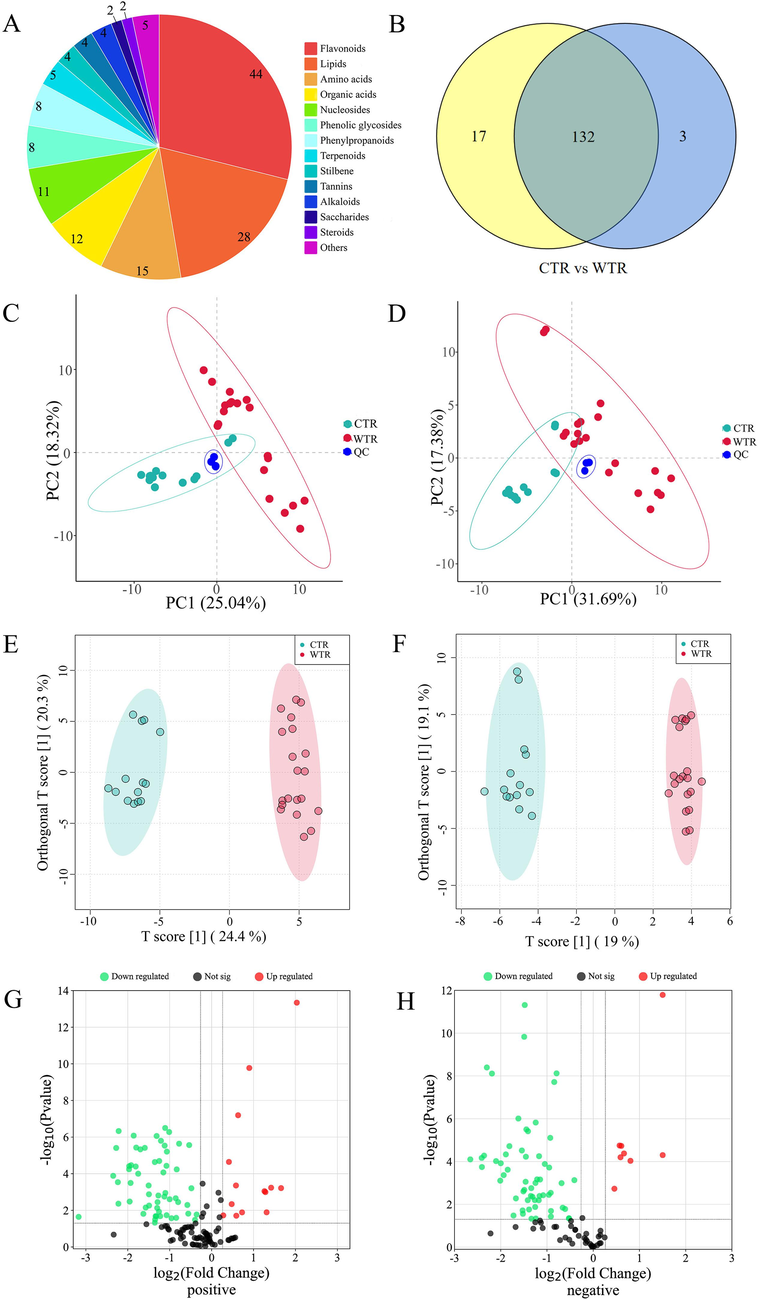
Multivariate statistical analysis. A. The type and amount of metabolite identified. B. Venn diagram of the number of common metabolites between CTR and WTR. Details are given in Table S4. C − D. PCA plot of CTR and WTR in positive (C) and negative (D) ion mode. Green represents CTR, red represents WTR, and blue represents QC samples. E − F. OPLS-DA plot of CTR and WTR in positive (E) and negative (F) ion mode. The green dots are CTR, red dots are WTR. G − H. Volcano plot of CTR and WTR in positive (G) and negative (H) ion mode. Blue represents the down tone, and red represents the up tone. (For interpretation of the references to color in this figure legend, the reader is referred to the web version of this article.)
3.1.1 Identification of flavonoids
Flavonoids are secondary metabolites produced in natural plants in response to environmental stress. Flavonoids possess potent antioxidant, anti-tumor, and other pharmacological activities that are advantageous for human health. Most of the flavonoids are derivatives of chromone, whose basic nucleus is 2-phenylchromone (C6 − C3 − C6). This nucleus consists of three rings, namely A, B, and C. The classification of flavonoids is based on the attachment of the benzene ring to the middle C3 portion, the position of the B ring attachment, and the oxidation degree of the C3 portion. Flavonoids are the major active pharmaceutical metabolites found in TR. The flavonoids those were identified in this study predominantly consisted of flavonols, flavones, flavanols, flavanonols, flavanones, dihydrochalcones, isoflavones, and their respective glycosides.
Flavones and flavonols: The C ring of flavones and flavonols is not easy to open due to the stable presence of double bonds. In the negative ion mode, the C ring tends to lose neutral fragments such as CO, CO2, and H2O, or experiences RDA cleavage. For instance, compound 114 produced a fragment of m/z 273.0399 [M − H − CO]− after the initial loss of a CO fragment (Pascale et al., 2020). Simultaneously, the C ring had RDA cleavage generating m/z 151.0032 [1,3A]− and m/z 149.0242 [1,3B]−, with similar cleavage patterns including 115, 117, 120, and others (Śliwka-Kaszyńska et al., 2022; Soubeyrand et al., 2018). Furthermore, it has been observed that glycosides of flavones and flavonols undergo significant RDA cleavage following the removal of saccharides. This cleavage was characterized by a notable response of fragment m/z 151.0032 [1,3A]−, such as compounds 93, 97, 104, 105, and etc (Tsimogiannis et al., 2007).
Flavanols: The C ring of flavanols is unstable and undergoes multiple cleavages in negative ion mode. For instance, the C rings of compounds 55, 63 were firstly broken between the 1-bond and the 2-bond, 3-bond, and the 4-bond, producing fragments such as m/z 167.0345 [1,2A]−, 165.0193 [1,4B]−, 151.0394 [1,3B]−, and 137.0241 [1,3A]− (Fig. S1A); secondly, they lost B rings and produced m/z 179.0345 [M − H − B ring]−; in addition, they lost CO2 and produced 245.0808 [M − H − CO2]− (Tsimogiannis et al., 2007). Due to these similar fragments of the two compounds, they were finally identified as 55 (catechin) and 63 (epicatechin) based on the retention times of the standards.
3.1.2 Identification of lipids
Lipids play a crucial role as metabolites in the growth, development, and response to environmental changes in plants. Moreover, it is imperative to note that this particular nutrient holds significant importance in fulfilling the nutritional requirements of the human body from external sources. There is a limited body of research on lipids in TR. Zeng (Zeng et al., 2017) conducted a study and successfully identified a total of 20 lipids in TR. In this study, 28 lipids were identified in CTR and WTR. These components primarily consisted of phospholipids, glycolipids, sphingolipids, fatty acids, and other miscellaneous lipid types.
Phospholipids: Phospholipids are organic substances consisting of glycerol, phosphoric acid, fatty acids, and choline. In the positive ion mode, phospholipids exhibited a significant response in the primary mass spectrometry, producing the quasi-molecular ion peak [M + H]+; in the secondary mass spectrometry, they were found to lose fragments such as H2O, glycerol, fatty acid chains, phosphoric acid or choline. For instance, compound 150 lost H2O to generate m/z 502.3288 [M + H − H2O]+, and then lost glycerol with fatty acids to produce the featured fragments m/z 184.0735 (Fig. S1B). Finally, it was identified as linoleoyllysolecithin by database and literature search (Zeng et al., 2017).
Glycolipids: Glycolipids have pharmacological activities, including antibacterial, antiviral, and antihemolytic properties. All the glycolipids identified in this study were glyceroglycolipids. Primary mass spectrometry in positive ion mode showed a better response of the quasi-molecular ion peak [M + H]+ for compound 149. The mass spectrometry software calculated the molecular formula, which was presumed to be a lipid. In the secondary mass spectrometry (Fig. S1C), fragments such as m/z 515.3165 [M + H − Gal]+ and 319.1963 were found. It was identified as gingerglycolipid A based on a database and literature search (Zeng et al., 2017). In contrast, compound 142 was cleaved differently. In the negative ion mode, the quasi-molecular ion peaks of the compound were hardly observed in the primary mass spectrometry; the molecular formula of the compound was calculated by the mass spectrometry software and database, and it was presumed to be a combination of the compound and a molecule of formic acid; in the secondary mass spectrometry, fragments such as m/z 397.1356 [M − H − C18H31O2]− was observed. It was identified as gingerglycolipid B based on a database and literature (Zeng et al., 2017).
3.1.3 Identification of amino acids
Amino acids are organic substances that contain amino and carboxy. Many of them are the units of protein molecules, and some of them are called essential amino acids that the human body must have but cannot synthesize on its own. In this study, 15 amino acids were identified in CTR and WTR, including six essential amino acids (lysine, threonine, leucine, isoleucine, and valine). In the positive ion mode, amino acids generally lose carboxy and amino. For instance, compound 45 produced the quasi-molecular ion peak [M + H]+ in the primary mass spectra; in the secondary mass spectrometry, it lost carboxy first to produce 120.0817 [M + H − FA]+, and then lost amino to produce 103.0561 [M + H − FA − NH3]+. It was finally identified as phenylalanine based on standards. Similar cleavage patterns were found for compounds 23, 35, and 36.
3.1.4 Identification of nucleosides
Nucleosides are a part of nucleotides, and they have a positive impact on the body's immune system, nervous system, and cardiovascular system. Nucleoside is a glycoside formed by the condensation of a nucleobase with a saccharide. Eleven nucleosides were identified in this study. In the positive ion mode, the primary mass spectrometry of nucleoside produced the quasi-molecular ion peak [M + H]+ or [2 M + H]+; in the secondary mass spectrometry, the nucleoside lost its nucleobase, ribose, or deoxyribose. For instance, compound 32 firstly lost ribose to produce m/z 113.0361 [M + H − Rib]+, and then lost amino to produce m/z 96.0112 [M + H − Rib − NH3]+, which was finally identified as uridine by the standard. In the same case, compound 33 firstly lost deoxyribose to produce m/z 136.0622 [M + H − Deoxyrib]+, and then lost amino to produce m/z 119.0365 [M + H − Deoxyrib − NH3]+ (Chen et al., 2021). The compound 33 was identified as 2′-deoxyadenosine by the standard.
3.1.5 Identification of stilbenes
Stilbene is a general term for monomers and their polymers with a 1,2-stilbene backbone. Stilbenes are found in edible or medicinal plants, such as grapes, and possess antibacterial, antioxidant, antitumor, and antidiabetic properties. In this study, four stilbenes were identified in CTR and WTR, including polydatin, piceatannol, oxyresveratrol, and resveratrol (Bai et al., 2019). In the negative ion mode, it was found that the primary mass spectrometry of stilbenes generated the quasi-molecular ion peak [M − H]−, and C2H2O was lost in the secondary mass spectrometry. For instance, compound 102 initially lost one molecule of C2H2O in the negative ion mode, generating the m/z 185.0607 [M − H − C2H2O]−; then it lost another molecule of C2H2O to produce m/z 143.0503 [M − H − 2C2H2O]−. Finally, it was identified as resveratrol by the standard.
3.2 PCA and OPLS-DA of the metabolites in TR ecotypes
PCA analysis can downscale variables into uncorrelated variables, allowing more reasonable judgments to be made for data analysis where more factors are present. The data from TR were analyzed using PCA (Fig. 3C − D). QC samples were located in the middle of the 34 samples and clustered closely together, indicating that the experiment showed good stability and repeatability.
Since the two groups of samples in PCA analysis were not evenly distributed on both sides of the PC1 axis, we further performed OPLS-DA to more fully evaluate the relationship between metabolites and sample classification. This is a supervised multivariate data analysis method to predict the class of samples as this method may improve separation between species. The results showed that there were significant differences in metabolite phenotypes (Fig. 3E − F), and OPLS-DA was superior to PCA in the classification of different ecotypes of TR.
3.3 Screening of differential metabolites between CTR and WTR
To screen the DAMs between CTR and WTR samples, the metabolites with VIP > 1 were screened on the premise of OPLS-DA analysis. Next, t-tests were performed for the two groups of metabolites in positive and negative ion mode, respectively, and the DAMs were screened based on the criteria of P < 0.05, FC > 1.2, and FC < 0.83. VIP values, p-values, and log2FC values for the DAMs were presented in Table S5. The up and down-regulation of the DAMs can be observed in the volcano plots (Fig. 3G − H).
The results showed that a total of 35 DAMs were screened, including 11 flavonoids, 11 lipids, 3 organic acids, 2 saccharides, 2 phenylpropanoids, 1 terpenoid, 1 steroid, 1 alkaloid, 1 tannin, 1 phenolic glycoside, and 1 other type of metabolite. The details of these metabolites are shown in Table S6.
3.4 Cluster heat map and correlation analysis of differential metabolites
To visualize the differences in the abundance of the DAMs between the two groups of samples, a clustering heat map analysis was done on the relative peak areas of the 35 metabolites (Fig. 4). The results showed that approximately 3/4 of the metabolites were at higher levels in the WTR, while about 1/4 of the metabolites were at higher levels in the CTR. The DAMs abundance interval between CTR and WTR was calculated based on the Squared Euclidean Distance. The relative content of various metabolites, including flavonoids such as catechin, kaempferoside, astragaloside, kaempferol 3-O rhamnoside 7-O glucoside, chlorophyllin, and genistein (Fig. 4A), as well as organic acids such as malic citric, and isocitric acid (Fig. 4C), was found to be higher in the WTR group compared to the CTR group. In addition, saccharides, phospholipids, and glycolipids such as sucrose, raffinose, linoleoyllysolecithin, 1-palmitoyllecithin, gingerglycolipid A, and gingerglycolipid B were relatively high in WTR. However, the levels of lipids such as lecithin, 1-linolenoylglycerol, and geranyl acetoacetate were significantly higher in the CTR than in the WTR (Fig. 4B). The presented data illustrates variations in metabolites between CTR and WTR.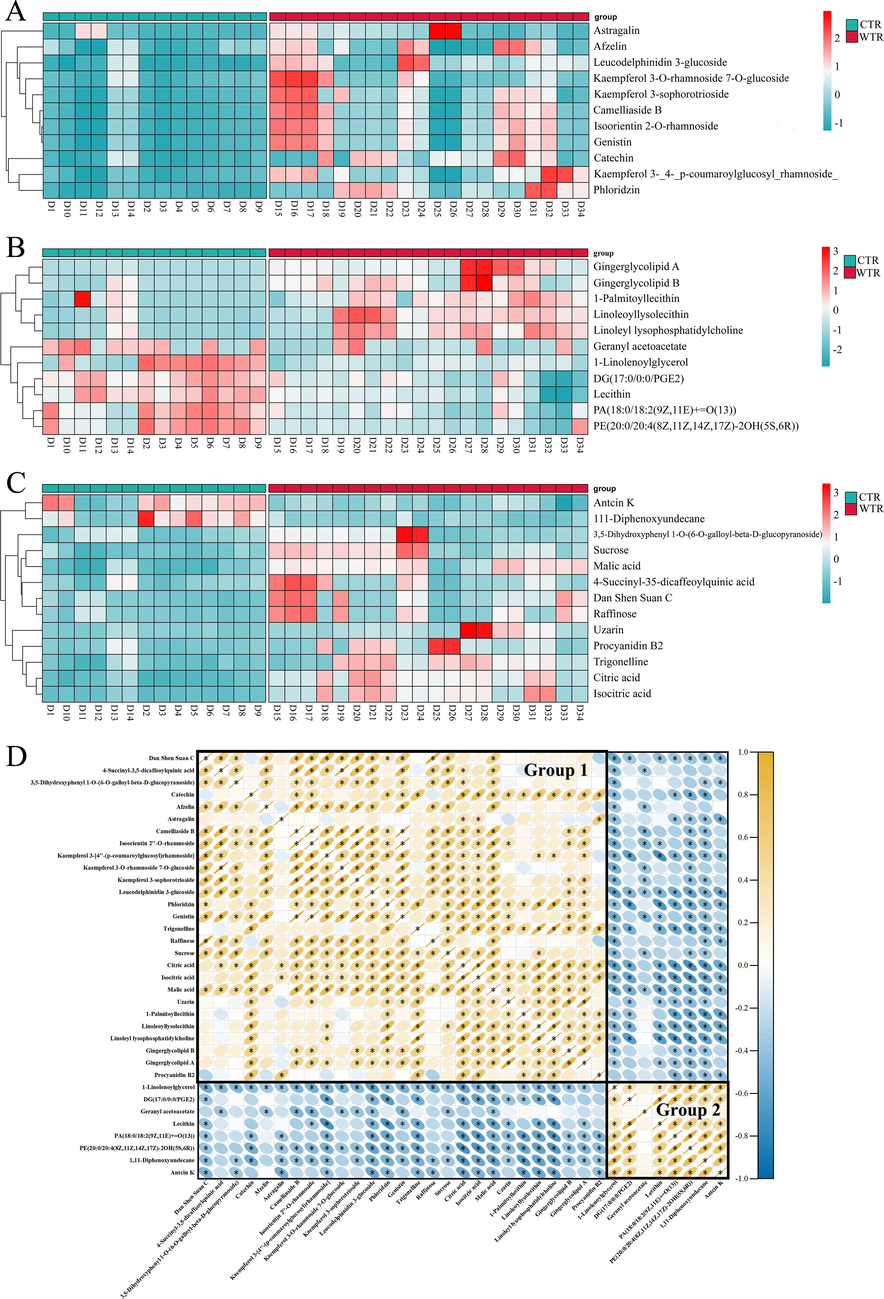
Analysis of DAMs. A − C. Clustering heat map of flavonoids (A), lipids (B), and other types (C) in CTR and WTR. Green represents lower levels of content and red represents higher levels of relative content (Table S6). D. Correlation analysis of DAMs. Yellow represents a positive correlation; blue represents a negative correlation. P < 0.05 is represented by “*”, indicating a significant correlation between the two metabolites. (For interpretation of the references to color in this figure legend, the reader is referred to the web version of this article.)
Correlation analysis involves examining the relationship between two or more variables to determine the extent to which they are correlated (Wang et al., 2023). This analysis aims to measure the degree of association between the variables. Pearson correlation analysis was conducted on the content data of the DAMs to examine the association between CTR and WTR (Fig. 4D). A total of 1225 paired correlations were observed, out of which 777 metabolite-metabolite pairs exhibited statistically significant correlations (P < 0.05). Out of the total, 497 variables exhibited a positive correlation, whereas 280 variables showed a negative correlation. Most of them demonstrated positive correlations between flavonoids, organic acids, and saccharides, whereas negative correlations were observed with certain lipids, such as lecithin. Depending on their associations with each other, these DAMs form two ecotypes, represented by two separate color intensities. Specifically, group 1 contains 27 metabolites, consisting mainly of metabolites such as flavonoids (41 %), organic acids (11 %), and phospholipids (11 %). Group 2 contains 8 metabolites, the majority of which are lipids (75 %). It is worth noting that all flavonoids were observed in Group 1, which may also prove that substances with similar properties belong to the same cluster (Wang et al., 2023). Metabolites of clear relevance may be metabolites with similar chemical structures or metabolites with complementary functions.
3.5 Differential metabolite functional pathway analysis
KEGG pathway information explains the biochemical functions of metabolites that can be activated by DAMs. Therefore, this study performed KEGG enrichment analysis to explore which pathways involved in DAMs are affected by different ecotypes. Firstly, the KEGG IDs of the DAMs were entered into the website (https://www.metaboanalyst.ca/) and Arabidopsis thaliana (L.) Heynh. was the model plant. The enriched pathways with the most significant differences between CTR and WTR were finally screened according to P < 0.05 (Fig. 5A), which included “TCA cycle”, “glyoxylate and dicarboxylate metabolism”, “galactose metabolism”, “linoleic acid metabolism”, “flavone and flavonol biosynthesis”, and etc. Specific information on the pathways involved in the KEGG enrichment analysis is shown in Table S7.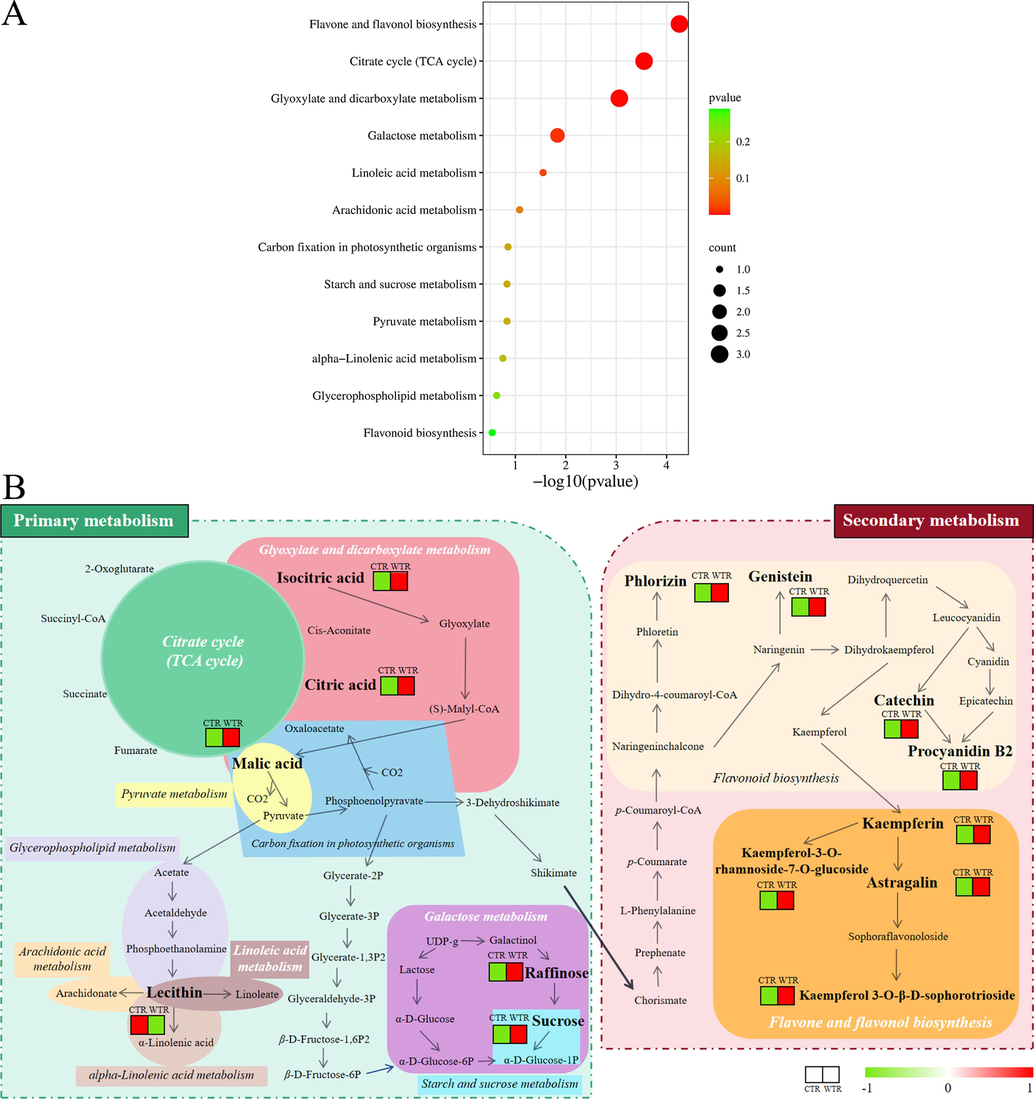
KEGG analysis. A. KEGG pathway enrichment analysis. The bubble size and x-axis position represent its degree of influence. Bubble size is related to the number of DAMs involved in the pathway, with higher numbers being greater. The x-axis coordinates are -log10 (P value) values, with larger values representing more significant pathways. B. Schematic diagram of the metabolic pathways involved in the DAMs of CTR and WTR. White italics are the five more important metabolic pathways. Metabolites in bold black font are DAMs. In the heat map red represents up-regulation and green represents down-regulation. (For interpretation of the references to color in this figure legend, the reader is referred to the web version of this article.)
To gain a comprehensive understanding of metabolite changes, a total of 12 pathways were integrated between primary and secondary metabolic pathways. The possible pathways for the synthesis of flavonoids, organic acids, saccharides, and lipids were postulated, starting from the TCA cycle, as shown in Fig. 5B. Firstly, to understand the biosynthesis of flavonoids, we focused on flavone and flavonol biosynthesis (map00944) as well as flavonoid biosynthesis (map00941). A total of eight differential flavonoids were shown in both pathways, and their distribution in CTR and WTR can be inferred based on the heat map color differences in relative content. The relative content of these eight flavonoids was higher in WTR than in CTR, and flavonoids have potential medical applications in the treatment of cancer and immune disorders (Feng et al., 2014). Among them, procyanidin B2, catechin, astragalin, and kaempferin were the main pharmacological metabolites of TR. Zhang (Zhang et al., 2023) reported that the root diameter difference between cultivated ginseng and wild ginseng was due to the alteration of enzymes and genes in the pathway of starch and sucrose metabolism (map00500). The results of enrichment analyses in this study also revealed that map00500 and map00052 might have influenced the differences between the two ecotypes with the significant differences in sucrose and raffinose contents between WTR and CTR.
In addition, the TCA cycle is a hub for the metabolic linkage of saccharides, lipids, and amino acids, and is an important primary metabolic pathway for plants to synthesize substances essential for their growth and reproduction (Cervela-Cardona et al., 2021). In contrast, the relative contents of citric acid, malic acid, and isocitric acid were significantly higher in WTR than in CTR. They are important parts of this pathway and were significantly higher in WTR than in CTR. In addition, only lecithin was significantly up-regulated among the 14 DAMs, which may indicate that the linoleic acid pathway is more active in CTR. In summary, comparing the relative contents of the 14 DAMs, it can be shown that the primary and secondary metabolic pathways were more active in WTR relative to CTR; among the secondary metabolic pathways, “flavone and flavonol biosynthesis” was extremely significant (P < 0.001).
3.6 Quantitative analysis of four metabolites
Since flavonoids are the major pharmacological metabolites of TR and the synthesis pathway of flavonoids was also significantly enriched in the above KEGG enrichment analysis. Meanwhile, previous studies (Ding et al., 2019; Fu et al., 2015; Lee et al., 2017; Sun et al., 2015) have reported and confirmed the significant pharmacological activities of four metabolites in pathways (procyanidin B2, catechin, astragalin, and kaempferin). Furthermore, the present study observed a significant difference between the CTR and the WTR. Therefore, our study was conducted to quantitatively analyze their distribution in CTR and WTR. The extraction conditions of the samples were referred to previous studies (Chen et al., 2022), the results of the methodological investigations are shown in Table S3, and the content information is shown in Fig. 6. Significant differences were observed in the content determination results of four metabolites between CTR and WTR (P < 0.01). The contents of all four metabolites in WTR were higher than those in CTR, indicating that WTR may be superior in terms of pharmacological activity.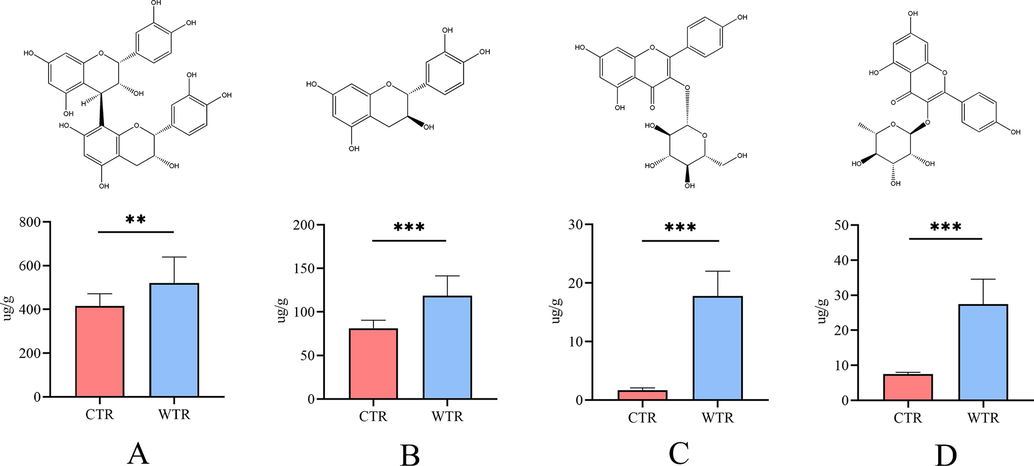
Results for the contents of 4 metabolites (mean ± SD; **P < 0.01, ***P < 0.001). Histograms of procyanidin B2 (A), catechin (B), astragalin (C), and kaempferin (D) in CTR and WTR.
4 Conclusions
This work provided a complete metabolomics investigation of two TR ecotypes and investigated the differences in metabolites between CTR and WTR. An untargeted metabolomic approach based on UFLC-Triple TOF-MS/MS revealed 152 metabolites in CTR and WTR. The metabolites were then differentiated using OPLS-DA and 35 DAMs were examined. Pearson correlation analysis indicated that 777 pairs of metabolites in the DAMs were strongly connected. DAMs were also subjected to KEGG enrichment analysis. The mainly enriched pathways were flavone and flavonol biosynthesis, TCA cycle, linoleic acid pathway, galactose metabolism, and so on. Meanwhile, the active pharmacological DAMs implicated in the enriched pathway (procyanidin B2, catechin, astragalin, and kaempferin) were measured using UFLC-QTRAP-MS/MS, and variations in their levels were discovered. Overall, this work performed a thorough metabolomic investigation of CTR and WTR in order to give a theoretical foundation for resource identification, food formulation, and TR pharmacological trials.
CRediT authorship contribution statement
Haijie Chen: Conceptualization, Investigation, Data curation, Writing – original draft. Wei Yang: Investigation. Yongyi Zhou: Investigation. Jia Xue: Writing – original draft. Zhichen Cai: Conceptualization, Writing – review & editing. Jiahuan Yuan: Data curation. Nan Wu: Investigation. Xunhong Liu: Conceptualization, Resources, Writing – review & editing. Cuihua Chen: Writing – review & editing. Jianming Cheng: Supervision. Guangxuan Zhang: Investigation, Data curation.
Acknowledgements
This research was supported by Basic Science (Natural Science) Research Project of Higher Education of Jiangsu Province, grant number 22KJB360007.
Declaration of competing interest
The authors declare that they have no known competing financial interests or personal relationships that could have appeared to influence the work reported in this paper.
References
- Mechanical insights into the oxidative cleavage of resveratrol catalyzed by dioxygenase NOV1 from Novosphingobium aromaticivorans: confirmation of dioxygenase mechanism by QM/MM calculations. Catal. Sci. Technol.. 2019;9(1):444-455.
- [CrossRef] [Google Scholar]
- Flavonoid metabolism in tetrastigma hemsleyanum diels et gilg based on metabolome analysis and transcriptome sequencing. Molecules. 2022;28(1):83.
- [CrossRef] [Google Scholar]
- The arabidopsis circadian clock and metabolic energy: a question of time. Front. Plant Sci.. 2021;12(1):804468
- [CrossRef] [Google Scholar]
- Qualitative and quantitative analysis of nucleosides and nucleobases in Phylloporia ribis by UPLC-Q-TOF-MS and HPLC. China J. Chin. Mater. Med.. 2021;46(12):2912-2922.
- [Google Scholar]
- Quality evaluation of tetrastigmae radix from two different habitats based on simultaneous determination of multiple bioactive constituents combined with multivariate statistical analysis. Molecules.. 2022;27(15):4813.
- [CrossRef] [Google Scholar]
- Qualitative and quantitative analysis for the chemical constituents of tetrastigma hemsleyanum diels et gilg using ultra-high performance liquid chromatography/hybrid quadrupole-orbitrap mass spectrometry and preliminary screening for anti-influenza virus components. Evidence-Based Complementary Altern. Med.. 2019;2019(1):9414926.
- [CrossRef] [Google Scholar]
- The complete chloroplast genomes of Tetrastigma hemsleyanum (Vitaceae) from different regions of China: molecular structure, comparative analysis and development of DNA barcodes for its geographical origin discrimination. BMC Genomics.. 2022;23(1):620.
- [CrossRef] [Google Scholar]
- Antitumor activity of total flavonoids from Tetrastigma hemsleyanum Diels et gilg is associated with the inhibition of regulatory T cells in mice. OncoTargets Ther.. 2014;7(1):947-956.
- [CrossRef] [Google Scholar]
- Chemical constituents in root tuber of Tetrastigma hemsleyanum and their anti-oxidative activities. Chin. Tradit. Herb. Drugs.. 2015;46(11):1583-1588.
- [CrossRef] [Google Scholar]
- Total flavonoids of Tetrastigma hemsleyanum Diels et Gilg inhibits colorectal tumor growth by modulating gut microbiota and metabolites. Food Chem.. 2023;410(1):135361
- [CrossRef] [Google Scholar]
- Integrative analysis of the transcriptome and metabolome reveals the developmental mechanisms and metabolite biosynthesis of the tuberous roots of Tetrastigma hemsleyanum. Molecules.. 2023;28(6):2603.
- [CrossRef] [Google Scholar]
- Comparative metabolic profiling of cultivated and wild black soybeans reveals distinct metabolic alterations associated with their domestication. Food Res. Int.. 2020;134(1):109290
- [CrossRef] [Google Scholar]
- Afzelin ameliorates D-galactosamine and lipopolysaccharide-induced fulminant hepatic failure by modulating mitochondrial quality control and dynamics. Br. J. Pharmacol.. 2017;174(2):195-209.
- [CrossRef] [Google Scholar]
- Flora of China. Beijing: Science Press; 1998. p. :122. Part 48
- Qualitative and quantitative analysis of the major constituents in Spatholobi Caulis by UFLC-Triple TOF-MS/MS and UFLC-QTRAP-MS/MS. J. Pharm. Biomed. Anal.. 2021;194(1):113803
- [CrossRef] [Google Scholar]
- Profiling of quercetin glycosides and acyl glycosides in sun-dried peperoni di Senise peppers (Capsicum annuum L.) by a combination of LC-ESI(-)-MS/MS and polarity prediction in reversed-phase separations. Anal. Bioanal. Chem.. 2020;412:3005-3015.
- [CrossRef] [Google Scholar]
- Germplasm Research and Utilization of Tetrastigma hemsleyanum, A Chinese-specific Medicinal Plant. Beijing: China Light Industry Press; 2018. p. :113-127. Part 1
- The mechanism of a retro-diels–alder fragmentation of luteolin: theoretical studies supported by electrospray ionization tandem mass spectrometry results. Molecules. 2022;27(3):1032.
- [CrossRef] [Google Scholar]
- Peroxidative cleavage of kaempferol contributes to the biosynthesis of the benzenoid moiety of ubiquinone in plants. Plant Cell.. 2018;30(12):2910-2921.
- [CrossRef] [Google Scholar]
- Qualitative and quantitative analysis of phenolics in Tetrastigma hemsleyanum and their antioxidant and antiproliferative activities. J. Agric. Food Chem.. 2013;61(44):10507-10515.
- [CrossRef] [Google Scholar]
- Rapid characterization of chemical constituents in Radix Tetrastigma, a functional herbal mixture, before and after metabolism and their antioxidant/antiproliferative activities. J. Funct. Foods.. 2015;18(1):300-318.
- [CrossRef] [Google Scholar]
- Metabolism of phenolics of Tetrastigma hemsleyanum roots under in vitro digestion and colonic fermentation as well as their in vivo antioxidant activity in rats. Foods.. 2021;10(9):2123.
- [CrossRef] [Google Scholar]
- Characterization of flavonoid subgroups and hydroxy substitution by HPLC-MS/MS. Molecules. 2007;12(3):593-606.
- [CrossRef] [Google Scholar]
- Alkaloids from Tetrastigma hemsleyanum and their anti-inflammatory effects on LPS-induced RAW264.7 cells. Molecules. 2018;23(6):1445.
- [CrossRef] [Google Scholar]
- Application of UHPLC-Q/TOF-MS-based metabolomics in the evaluation of metabolites and taste quality of Chinese fish sauce (Yu-lu) during fermentation. Food Chem.. 2019;296(1):132-141.
- [CrossRef] [Google Scholar]
- Effect of different cultivation habitats on the growth and trace elements and total flavonoid content of Tetrastigmae Radix. J. Zhejiang Agric. Sci.. 2017;58(12):2177-2178.
- [Google Scholar]
- Characterization of metabolite landscape distinguishes wild from cultivated Polygonati Rhizomes by UHPLC-Q-TOF-MS untargeted metabolomics. Food Biosci.. 2023;53(1):102574
- [CrossRef] [Google Scholar]
- Immunoregulatory effects of Tetrastigma hemsleyanum polysaccharide via TLR4-mediated NF-kappaB and MAPK signaling pathways in Raw264.7 macrophages. Biomed. Pharmacother.. 2023;161(1):114471
- [CrossRef] [Google Scholar]
- Screening out Biomarkers of Tetrastigma hemsleyanum for anti-cancer and anti-inflammatory based on spectrum-effect relationship coupled with UPLC-Q-TOF-MS. Molecules.. 2023;28(7):3021.
- [CrossRef] [Google Scholar]
- Seasonal variation in transcriptomic profiling of Tetrastigma hemsleyanum fully developed tuberous roots enriches candidate genes in essential metabolic pathways and phytohormone signaling. Front. Plant Sci.. 2021;12(1):659645
- [CrossRef] [Google Scholar]
- Tetrastigma hemsleyanum (Sanyeqing) root tuber extracts induces apoptosis in human cervical carcinoma HeLa cells. J. Ethnopharmacol.. 2015;165(1):46-53.
- [CrossRef] [Google Scholar]
- Analysis on chemical constituents in Tetrastigma hemsleyanum by UPLC-triple-TOF/MS. Chin. Tradit. Herb. Drugs.. 2017;48(5):874-883.
- [CrossRef] [Google Scholar]
- Tetrastigma hemsleyanum Diels et Gilg ameliorates lipopolysaccharide induced sepsis via repairing the intestinal mucosal barrier. Biomed. & Pharmacother.. 2022;148(1):112741
- [CrossRef] [Google Scholar]
- Genus Tetrastigma: a review of its folk uses, phytochemistry and pharmacology. Chin. Herb. Med.. 2022;14(2):210-233.
- [CrossRef] [Google Scholar]
- Combining metabolomics and transcriptomics to reveal the regulatory mechanism of taproot enlargement in Panax ginseng. Int. J. Mol. Sci.. 2023;24(6):5590.
- [CrossRef] [Google Scholar]
- The phytochemistry, pharmacology, and quality control of Tetrastigma hemsleyanum Diels & Gilg in China: A review. Front. Pharmacol.. 2020;11(1):550497
- [CrossRef] [Google Scholar]
Appendix A
Supplementary data
Supplementary data to this article can be found online at https://doi.org/10.1016/j.arabjc.2023.105430.
Appendix A
Supplementary data
The following are the Supplementary data to this article:Supplementary data 1
Supplementary data 1


