

Translate this page into:
Metal framework as a novel approach for the fabrication of electric double layer capacitor device with high energy density using plasticized Poly(vinyl alcohol): Ammonium thiocyanate based polymer electrolyte
⁎Corresponding author at: Advanced Polymeric Materials Research Lab., Department of Physics, College of Science, University of Sulaimani, Qlyasan Street, Sulaimani 46001, Iraq. shujahadeenaziz@gmail.com (Shujahadeen B. Aziz)
-
Received: ,
Accepted: ,
This article was originally published by Elsevier and was migrated to Scientific Scholar after the change of Publisher.
Peer review under responsibility of King Saud University.
Abstract
High performance electric double-layer capacitors (EDLCs) based on poly (vinyl alcohol) (PVA): ammonium thiocyanate (NH4SCN):Cu(II)-complex plasticized with glycerol (GLY) have been fabricated. The maximum DC ionic conductivity (σDC) of 2.25 × 10⁻³ S cm−1 is achieved at ambient temperature. The X-ray diffraction (XRD) patterns confirmed that the addition of both Cu(II)–complex and GLY enhanced the amorphous region within the samples. Through the Fourier transform infrared (FTIR) the interactions between the host polymer and other components of the prepared electrolyte are observed. The FESEM images reveal that the surface morphology of the samples showed a uniform smooth surface at high GLY concentration. This is in good agreement with the XRD and FTIR results. Transference numbers of ion (tion) and electron (tel) for the highest conducting composite polymer electrolyte (CPE) are recognized to be 0.971 and 0.029, respectively. The linear sweep voltammetry (LSV) revealed that the electrochemical stability window for the CPE is 2.15 V. These high values of tion and potential stability established the suitability of the synthesized systems for EDLC application. Cyclic voltammetry (CV) offered nearly rectangular shape with the lack of Faradaic peak. The specific capacitance and energy density of the EDLC are nearly constant within 1000 cycles at a current density of 0.5 mA/cm2 with average of 155.322F/g and 17.473 Wh/Kg, respectively. The energy density of the EDLC in the current work is in the range of battery specific energy. The EDLC performance was found to be stable over 1000 cycles. The low value of equivalent series resistance reveals that the EDLC has good electrolyte-electrode contact. The EDLC exhibited the initial high power density of 4.960 × 10³ W/Kg.
Keywords
PVA polymer electrolyte
Glycerol plasticizer
Cu(II)-complex
Electrochemical and EDLC

1 Introduction
Supercapacitors (SCs) can be categorized into three kinds of electrochemical capacitor (EC) which are known as electric double-layer capacitor (EDLC), pseudocapacitor, and hybrid SCs. In the EDLC the electric energy is stored based on electrosorption process (charge–discharge) when the Helmholtz double layers are formed on porous electrodes through movement of ions inside the electrolyte (Lim et al., 2014). Pseudocapacitor stores energy faradaically by chemical interaction between the electrolyte and electrode for example redox reaction. The process of charge storage used in hybrid capacitors is a mix of the both faradaic reaction and non-faradaic reaction. EDLC is the typical non-faradaic SC. The charge–discharge cycles just involve ions adsorption on the surface of the electrodes. It is promising to attain high energy density (Ed) and power density (Pd) using EDLC. (Mohd Abdah et al., 2020; Hadjipaschalis et al., 2009; Winter and Brodd, 2004). ECs are devices which can occupy the spaces between battery and electrostatic capacitor with regard to Ed and Pd as shown in Ragone plot (see Fig. 1). The Ragone plot is a chart employed for comparing the performance of several energy storage devices for example SCs, fuel cells, conventional capacitors, and batteries (Jayalakshmi and Balasubramanian, 2008). The achieved Ed in the current work is 17.473 Wh/Kg throughout 1000 cycles which is in the range of Ed of batteries (see Fig. 1).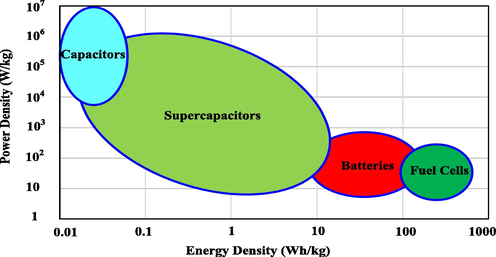
Ragone plot of Ed versus Pd for numerous electrochemical energy storage devices (Winter and Brodd, 2004).
An electrolyte film and two porous electrodes are included in the EDLC device. Mostly carbon-based electrodes are used for creating these SCs (Jayalakshmi and Balasubramanian, 2008). The different carbon-based electrode materials used in EDLCs are carbon aerogels, activated carbon (AC), carbon nanotubes, carbon nanosize, graphites, and carbon nanofibers (Zhang et al., 2009). AC is used in this study as an electrode because of its high conductivity, chemical stability, large surface area (>1000 m2g−1), cost effective, and high porosity (>2 nm pore width) (Syahidah and Majid, 2013; Zhao et al., 2018). At the same time, the electrolyte can be liquid electrolyte (LE), solid polymer electrolyte (SPE), gel polymer electrolyte (GPE) (Asnawi et al., 2020). The SPE outweigh LE in many substantial characteristics such as electrolyte leakage, better safety, high flexibility, light weight, and excellent thermal stability (Lim et al., 2014; Shen et al., 2017). These features can essentially enhance the EDLC electrochemical performances. Additionally, the increased demand for flexible electronic devices resulted in an increasing trend of employing polymer hydrogels as the separators and electrolytes for flexible electrochemical energy storage devices (Wang et al., 2018). Compared to SPE, hydrogel electrolyte consists of elastic crosslinked hydrated polymer chains that trap water in the interstitial spaces of the polymer matrices mainly by surface tension (Gong, 2014). This makes the hydrogel electrolyte appear usually wet, which gives a tough and soft property to the electrolyte (Gong, 2014).
In recent decades, biodegradable polymers have been widely studied to be employed in the renewable energy sources and electrochemical energy storage devices to solve the environmental issues (Saidi et al., 2019). However, the electrical and mechanical properties of these polymers need enhancement in order to be used in the energy devices (Saidi et al., 2019). Various host polymers have been widely investigated in this field, such as chitosan (Aziz et al., 2020), hydroxylethyl cellulose (HEC) (Chong et al., 2018), Polyethylene oxide (PEO) (Hadi et al., 2020), poly(vinyl alcohol) (PVA) (Farah et al., 2019), methylcellulose (MC) (Aziz et al., 2020), N, N-dimethyl acrylamide (DMA) (Bashir et al., 2020), and polyacrylamide-co-acrylic acid (PAAC) (Saminatha Kumaran et al., 2018). Previous studies are shown that both mechanical and electrical properties of PVA can be considerable enhanced when doped with glycerol (GLY) and different salts such as calcium chloride (CaCl2) and sodium chloride (NaCl) (Jiang et al., 2015; Peng et al., 2019).
In this research, poly (vinyl alcohol) (PVA) was preferred as a host polymer due to its biodegradable capability, low cost, and easy processability. Ammonium thiocyanate (NH4SCN) was used in the current study as a low lattice energy salt to deliver H+ to the CPE system (Abd El-Kader et al., 2002). Srivastava et al. (Srivastava et al., 1995) have stated that the charge carrier in PEO combined with NH4SCN is the H+. NH4SCN has low lattice energy of 605 kJ.mol−1 compared to other ammonium salts, such as NH4Br (667 kJ mol−1), NH4Cl (694.7 kJ mol−1), NH4NO3 (648.9 kJ mol−1), NH4F (834.5 kJ mol−1), NH4I (626 kJ mol−1), etc. (Jenkins and Morris, 1976; Kadir, 2010). Therefore, it is possible to dissociate it easily into cations and anions when inserted in water as a solvent. This means, larger number ammonium ions are offered by NH4SCN to the polymer. The addition of Cu(II)–complex to the polymer electrolyte (PE) was attempted to improve the performance of the electrolyte films via establishing an amorphous nature which is crucial for ion transport process. In this study, glycerol (GLY) was also chosen as an appropriate plasticizer since it enhances DC conductivity (σDC) because of the existence of three groups of hydroxyl (OH). It is believed that the high dielectric constant value (ɛr) of 42.5 for GLY can reduce the attraction force amongst the cations and anions of the salt, and also weaken the force between chains of the polymers (Shukur and Kadir, 2014, 2015).
In our previous study it was revealed that the amorphous structure of PVA polymer enhanced through the inclusion of Cu(II)–complex (Brza et al., 2019). To the best of our knowledge, no study has been reported in literature regarding the role of metal complex (e.g. Cu(II)-complex) or metal framework on EDLC performance. Mohamad & Arof, (Mohamad and Arof, 2007) have fabricated the plasticized system of PVA–KOH–Propylene carbonate (PC)–Al2O3. The results showed that the samples conductivity could be significantly increased with raising the PC plasticizer content (Mohamad and Arof, 2007). Lim et al., (Lim et al., 2014) fabricated EDLC device based on AC electrodes and PVA:LiClO4:TiO2. They are noted that the insertion of TiO2 into the PVA–LiClO4 system resulted in the σDC of 1.3 × 10⁻⁴ S cm−1 and specific capacitance (Cd) value of 12.5F g−1. Nonetheless, the Cd of the CPE is still low and the addition of TiO2 was not significantly enhanced the electrochemical performances of the EDLC. Thus, this work aims to improve the ionic conductivity and electrochemical properties of PVA based polymer electrolyte, doped with ammonium thiocyanate (NH4SCN):Cu(II)-complex and plasticized with various amount of glycerol (GLY). Then, the highest conducting sample will be used as polymer electrolyte in the fabrication of EDLC, and the performance of the device will be explored.
2 Materials and methods
2.1 Materials
Sigma-Aldrich (Kuala Lumpur, Malaysia) provided poly(vinyl alcohol) (PVA) powder (average molecular weight = 85000–124000), copper(II) chloride (molecular weight = 134.45 g/mol) and GLY (molecular weight = 92.09382 g/mol). HmbG chemicals, EMPLURA, and Timcal provided ammonium thiocyanate (NH4SCN) (molecular weight = 76.12 g/mol), N-Methyl-2-pyrrolidone (NMP) (molecular weight = 99.13 g/mol), and carbon black (molecular weight = 12.01 g/mol), respectively. Magna value delivered both of the polyvinylidene fluoride (PVdF) (average molecular weight = ∼534,000 by GPC) and activated carbon (AC) (RP20) (molecular weight = 12.01 g/mol).
2.2 Electrolyte preparation
One gram of PVA was dissolved in 40 mL of distilled water. The solution was stirred using magnetic stirrer at the temperature of 80 °C for around 60 min to prepare the PVA solution. The PVA solution was then left to cool down to room temperature. Then, fixed amount of 50 wt% of NH4SCN were added to the PVA solutions and stirred constantly with magnetic stirrer at ambient temperature until the salt was fully dissolved in the PVA polymer solutions. Later, PVA:NH4SCN was included with 10 mL of Cu(II)-complex (synthesis of Cu(II)-complex was described in our previous work in materials and methods section in ref. (Brza et al., 2019). Subsequently, the solutions were mixed and stirred to obtain a good dispersion of Cu(II)-complex in the solution. After that, the PVA:NH4SCN:Cu(II)-complex were plasticized with 10, 20, 30, and 40 wt% GLY and then the prepared samples were coded as PGNC-1, PGNC-2, PGNC-3, and PGNC-4, respectively. Finally, the plasticized solutions were stirred and mixed until a homogeneous solution was reached and then preserved in the plastic Petri dishes and left for drying at room temperature. For drying better, the fabricated CPE films were preserved in a dessicator comprising silica gel before characterisations.
2.3 Characterization techniques
X-Ray Diffraction (XRD) spectra were achieved through the use of Empyrean X-ray diffractometer, (PANalytical, Netherland) with operating voltage of 40 × 103 V and operating current of 40 × 10-3 A. The CPE films were scanned with a CuKα X-ray monochromatic radiation at 0.15406 nm wavelength and the 2θ glancing angle was ranged from 10° to 80° with 0.1° step size.
To study the PVA film as well as CPE films, Fourier Transform Infrared (FTIR) spectrophotometer (Thermo Scientific, Nicolet iS10) was used in the wavenumber range from 4000 to 450 cm−1 and with having 2 cm−1 resolutions.
A Hitachi SU8220 was used to conduct the field emission scanning electron microscopy (FESEM) at 500× magnification. FESEM images were taken to consider the CPE films morphology.
The pure PVA and CPE impedance spectra were accomplished using electrochemical impedance spectroscopy (EIS) [3532–50 LCR HiTESTER (HIOKI)] in the frequencies between 50 Hz and 5 × 10⁶ Hz. The synthesized CPE films were cut for circles with 20 mm in diameter as well as located between stainless steel (SS) electrodes under pressure of a spring. The CPE samples were linked to a computer program to consider real (Z') and imaginary (Z“) parts of the complex impedance (Z*) spectra.
2.4 Electrolyte characterization
2.4.1 Ionic transference number analysis
Two types transference number (TNM) were analyzed, which are ionic (tion) and electronic (tel) TNM. The cell preparation arrangement was SS| highest CPE (PGNC-4)| SS. The cell was connected to a V&A Instrument DP3003 digital DC power supply and a UNI-T UT803 multimeter. The circuit diagram for the TNM measurement is shown in Fig. 2. The cell polarized versus time at the working voltage of 0.2 V and ambient temperature. tion and tel can be calculated from Eqs. (1) and (2) (Ramesh et al., 2011):
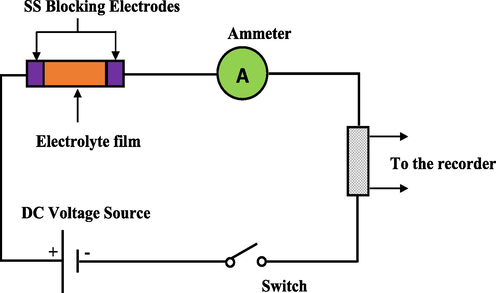
Illustration of TNM experimental system.
Here initial current and steady-state current are designated as Ii and Iss, correspondingly.
2.4.2 Linear sweep voltammetry (LSV)
In order to check the electrochemical stability of the prepared CPEs before the EDLC fabrication, the linear sweep voltammetry (LSV) investigation was accomplished. The cell arrangement for the LSV is similar to the TNM examination in Fig. 2. Scan rate of 10 mV s−1 was given from 0 to 2.5 V at ambient temperature. The cell was linked to the working electrode, reference electrode, and counter electrode by means of Digi-IVY DY2300 potentiostat. When potential was swept linearly between working electrode and counter electrode, the change in the current value at the working electrode was recorded. The cell setup for the LSV test is displayed in Fig. 2.
2.5 EDLC fabrication
Planetary ball miller (XQM-0.4) was employed to mix the 0.25 g of carbon black and 3.25 g of activated carbon (AC) at 500 rpm for around 20 min. Six metal balls were incorporated to a chamber together with the above powders. Then, 0.5 g of polyvinylidene fluoride (PVdF) was inserted in the solvent of 15 mL N-methyl pyrrolidone (NMP) and then stirred for around 60 min. The powders were transferred into the PVdF-NMP solution and then stirred for 2 h till the emergence of homogenous solution of dense black. An aluminum foil was cleaned using acetone and finally the synthesized homogenous solution was coated on it by using a doctor blade. Subsequently, the gained AC electrodes were dried-out in an oven at 60 °C with the mass loading of active material of 2.43 mg. Finally, the dried AC electrodes were kept in a dessicator with silica gel for drying better. The formed electrodes were cut into circles with area of 2.01 cm2. The mass of electrode minus with the mass of aluminum foil was 2.99 mg. From the mass mentioned earlier, AC was 81.25% from the total mass of each circle electrode. Hence, the mass of AC was 2.43 mg and was to calculate EDLC parameters because AC is the active mass.
2.6 EDLC characterization
The AC electrodes were cut into circles with area of 2.01 cm2. The utmost conducting PE (PGNC-4) was set in between two AC electrodes and laid in a CR2032 coin cell. Finally, the coin cell was located in a Teflon case as exhibited in Fig. 3.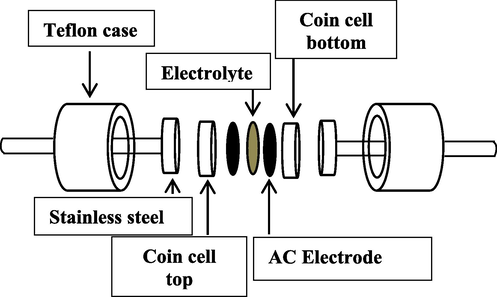
Design of the synthesized EDLC.
The cyclic voltammetry (CV) of the EDLC was taken with Digi-IVY DY2300 potentiostat. The applied potential was in the range between 0 V and 0.9 V with various scan rates. The EDLC displayed in Fig. 3 was exposed with several scan rates of 5, 10, 20, 50, and 100 mV s−1. The specific capacitance CCV of the EDLC at the several scan rates can be developed from the CV profile through the following relation (Asnawi et al., 2020):
The CV plot area (∫
) can be acquired using function of integration in Origin 9.0 software.
refers the scan rate, m refers the mass of activated carbon (2.43 mg), Vf and Vi are the final voltage of 0.9 V and the initial voltage of 0 V, respectively. The EDLC rechargeability is checked via NEWARE battery cycler for 1000 cycles at a current density of 0.5 mA cm−2 or 0.33 mAg−1. The surroundings for analysis the CV and EDLC charge–discharge was settled at ∼25 °C and relative humidity of ∼50%. The specific capacitance (Cd) using discharge curve can be found from Eq. (4) (Asnawi et al., 2020):
Here i and × denote applied current and gradient of discharge part, respectively. The CCV and Cd values of the EDLC were compared so as to check the confidence of the results. The situation of the contact between the electrode and CPE of the EDLC device was validated by means of the following equation (Asnawi et al., 2020):
3 Results and discussion
3.1 XRD examination
The XRD pattern of pure PVA and PVA:NH4SCN:Cu(II)-complex:GLY are displayed in Fig. 4. A couple of peaks at nearly 2θ = 20◦ and 40◦ in the XRD spectrum of pure PVA are noted, which have been related to the crystalline structure of PVA in previous investigations (Hema et al., 2008; Hemalatha et al., 2019). It is clear that these peaks still exist in the XRD spectra of PVA:NH4SCN:Cu(II)-complex:GLY even though their intensities were considerably decreased. More explicitly, the peak at 2θ = 40◦ almost disappeared, whereas the peak at 2θ = 20◦ widened. The extension of the amorphous nature is ascribed in the wideness increase and fall in the peak intensity at 2θ = 20◦ (Aziz et al., 2017; Aziz, 2016).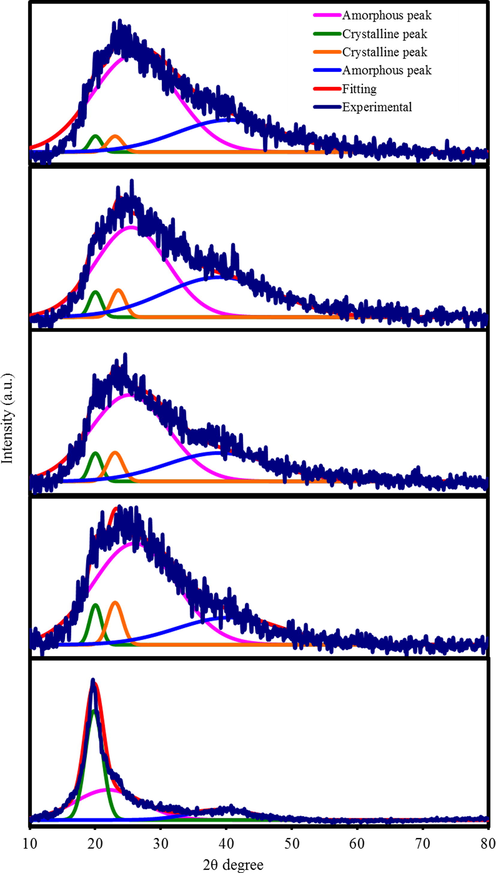
XRD spectra for (a) pure PVA, (b) PGNC-1, (c) PGNC-2, (d) PGNC-3, and (e) PGNC-4 films.
The doping of salt to the host polymer is probable to raise the structure of amorphous nature in PE. In an earlier research, the XRD pattern of starch-chitosan:NH4Cl SPE system showed a clear increase in the crystalline peaks with emerging additional crystalline peaks at maximum salt concentration (Shukur and Kadir, 2015). This outcome designated the salt recrystallization and ions recombination, which resulted in the decrement of free ions density, and therefore declined the σDC (Shukur and Kadir, 2015). Different approaches were specified to overcome these challenges. One of the approaches is the addition of Cu(II)–complex to the PE in order to develop the amorphous structure and increase the σDC. The addition of GLY to the electrolyte was also attempted to further improve the σDC. The amorphous structure in the electrolyte complexes can be enhanced with the inclusion of GLY (Amran et al., 2016). The existence of GLY in the complex systems helps salt dissociation, which in turn restricts salt recrystallization. Moreover, the plasticizer can produce different pathways for ions conduction; therefore, assisting the polymers to accommodate more salt. These processes raise the amorphous phase in the PEs, subsequently enhancing the electrolyte σDC (Shukur and Kadir, 2015). The ion conduction is desirable in the amorphous structure owing to segmental movement of polymer chains (Noor and Isa, 2015; Salleh et al., 2016). Moreover, the absence of any XRD peaks associated with pure PVA, approves the whole dissociation of NH4SCN salt in the PE (Noor and Isa, 2015). The elimination of hydrogen bonding among the polymer chains causes broadening and weakening in intensity, which signifies the dominance of the amorphous phase in the PE system (Hema et al., 2008).
The addition of GLY and Cu(II)–complex will result in the intensity reduction of crystalline peaks and vanishes the crystalline peak at 2θ = 20° (see Fig. 4). In our previous work, it was shown that when Cu(II)-complex was added to the PVA host polymer, the amorphous nature expanded, which was noted as a decrease in the intensity of the XRD spectra (Brza et al., 2019). The Cu(II)-complex XRD pattern in our earlier work indicated that the prepared Cu(II)-complex is nearly amorphous, thus the crystalline peaks cannot be perceived through the whole range of 2θ degrees. Obviously, just a hump can be seen from 2θ = 20◦ to 30◦ (Brza et al., 2019). The XRD analysis results approve that a good complexation took place between the PVA and the electrolyte components.
The deconvolution technique for the XRD spectra was used to determine the potential amorphous peaks and the crystalline peaks and it was also used to determine the degree of crystallinity (Xc) (Salleh et al., 2016), as shown in Fig. 4. The large and wide peaks signify the amorphous peaks, while the narrow, sharp and small peaks indicate the crystalline peaks. Pure PVA possesses Xc of 41.68, which is noticeably decreased when GLY is inserted. Thus, the amorphous structure of the systems is enhanced with the GLY insertion. It is seen in Fig. 4 that when GLY is added, crystalline peaks in PGNC-1 became smaller and less sharp (Fig. 4 (c-e)). The addition of GLY with 40 wt% gives rise to the smaller crystalline peaks, as seen in the XRD pattern of PGNC-4 (Fig. 4(e)). Eq. (6) was used to obtain Xc for pure PVA and doped PVA and the Xc values are tabulated in Table 1. PGNC-1 system has Xc value of 8.93 while PGNC-4 has the minimum Xc value of 3.54, meaning that the PGNC-4 is the highest amorphous system in this study (Salleh et al., 2016).
Electrolyte
Degree of crystallinity (%)
Pure PVA
41.68
PGNC-1
8.93
PGNC-2
7.54
PGNC-3
5.88
PGNC-4
3.54
Here, AT and AC refer the total area of the amorphous and crystalline peaks and total area of the crystalline peaks, respectively, which were accomplished by the deconvolution method using the OriginPro software. The Gaussian function mode was employed for the fitting of the XRD spectra.
3.2 FTIR analysis
The FTIR spectra for pure PVA and PVA:NH4SCN:Cu(II)-complex:GLY are shown in Fig. 5. The following modifications in the spectral features have been detected after comparing the spectra of pure and doped PVA. C–H rocking of pure PVA is considered the reason for absorption peak at 838 cm−1 (see Fig. 5a,) (Hema et al., 2008). In the case of PVA:NH4SCN:Cu(II)-complex:GLY, this peak shifted and its intensity decreased; whereas, upon the addition of 40 wt% of GLY it nearly vanished.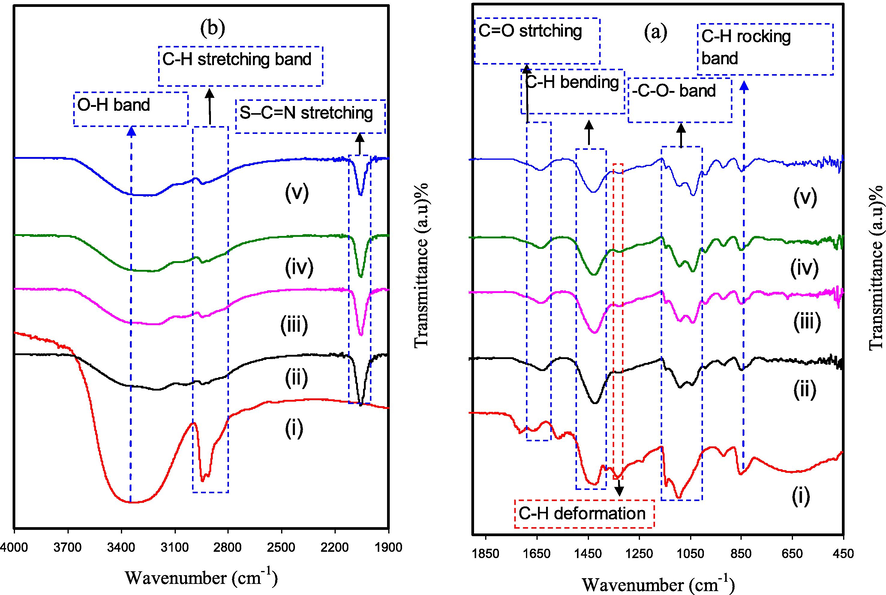
Spectra of FTIR for (i) pure PVA, (ii) PGNC-1, (iii) PGNC-2, (iv) PGNC-3, and (v) PGNC-4 in the range (a) 450 cm−1 to 1900 cm−1, and (b) 1900 cm−1 to 4000 cm−1.
It is well-known that in NH4SCN salt–polymer, the charge carrier species are hydrogen ions (H+) (Srivastava et al., 1995). The new strong and intense peak detected at 2045 cm−1 is endorsed to aromatic S–C = N stretching of anion of SCN- group of NH4SCN. This band shifts with considerable intensity reduction upon the addition of the higher GLY concentration is related to the complexation with PVA functional groups (see Fig. 5b) (Hemalatha et al., 2019; Noor and Isa, 2015). In the ammonium ion NH4+ tetrahedral, since just one of the four protons (H+) weakly linked to the nitrogen atom; thus, the H+ will transfer to every coordinating site of PVA. The change in peak place with the emergence of the new peak in the PVA:NH4SCN:Cu(II)-complex:GLY indicates the complex creation amongst the PVA and the NH4SCN (Hemalatha et al., 2019). The insertion of plasticizer helps further ions dissociation; therefore, additional ions are offered to create interactions with the functional groups of PVA (Liang et al., 2009). Furthermore, the interaction between PVA functional groups and Cu(II)–complex was indicated in our previous work (Brza et al., 2019). This interaction or the adsorption of Cu(II)–complex on the functional groups of the PVA is the two endorsed clarifications for the band intensity reduction (Brza et al., 2019). Consequently, since adsorption causes an increase in the molecular weight, there is a reduction in the functional groups vibrational intensity (Aziz et al., 2017).
In the meantime, O–H stretching vibration of hydroxyl (OH) groups can be related with the wide and robust absorption peak at 3340 cm−1 (Makled et al., 2013). This band possesses a high intensity, almost certainly owing to the robust intra and inters kinds of hydrogen bonding (Hema et al., 2008). Additionally, this band shifts and peak intensity drops in the PVA:NH4SCN:Cu(II)-complex:GLY owing to its complexation with NH4SCN salt and Cu(II)-complex. The peak at around 1643 cm−1 in the pure PVA is believed to be originated from the C = O stretching of acetate group (Kharazmi et al., 2015), in which for the doped PVA films it is shifted to a smaller wavenumber. C–H asymmetric stretching vibration is related with a band at 2913 cm−1 (Makled et al., 2013), which also shifted and reduced considerably in the case of doped PVA films. Furthermore, the characteristic of –C–O– stretching vibration in pure PVA is ascribed through the peak at 1076 cm−1 (Jiang et al., 2015), which is shifted with dropped intensity in the doped films with Cu(II)-complex and GLY, as shown in Fig. 5a.
The C–H bending vibration of CH2 wagging has been recognized as the cause for the pure PVA absorption peak at 1419 cm−1, while C–H deformation vibration has been related with the 1317 cm−1 absorption peak in pure PVA (see Fig. 5a,) (Kharazmi et al., 2015). It is therefore clear that the PVA:NH4SCN:Cu(II)-complex:GLY samples were related with shifting of these two peaks and a considerable reduction in the intensity of these peaks. These modifications in the FTIR spectra are strong evidences for the interaction of PVA functional groups with the electrolyte components (see Fig. 5a, b).
3.3 Morphological study
Fig. 6a(i-iv) illustrates surface morphology of all the studied films through FESEM images. It is recognized that the surface morphology of the PE films is the key properties to recognize their behavior (Aziz et al., 2019). The images were obtained at 500 × magnification. The small grey lumps can be seen on the surface of the CPE films (see Fig. 6a(i)). These lumps were attributed to the protrude salts. It is evident from the images that the grey lumps are disappeared as the GLY concentration was increased from 20 to 40 wt%. The CPE has a smooth and uniform surface morphology without existing a phase separation as shown in Fig. 6a(ii-iv). It is well documented that smooth morphology appearance is related to the amorphous phase of the PE system (Mobarak et al., 2013). The smooth surface electrolytes can assist conducting ionic species to pass more easily, and therefore increases the value of σDC (Mobarak et al., 2013). Likewise, the CPE samples with uniform surface in Fig. 6a(ii-iv) indicates the fine dispersion of Cu(II)-complex. The small white spots appearing on the CPE films surface are attributed to Cu(II)-complex.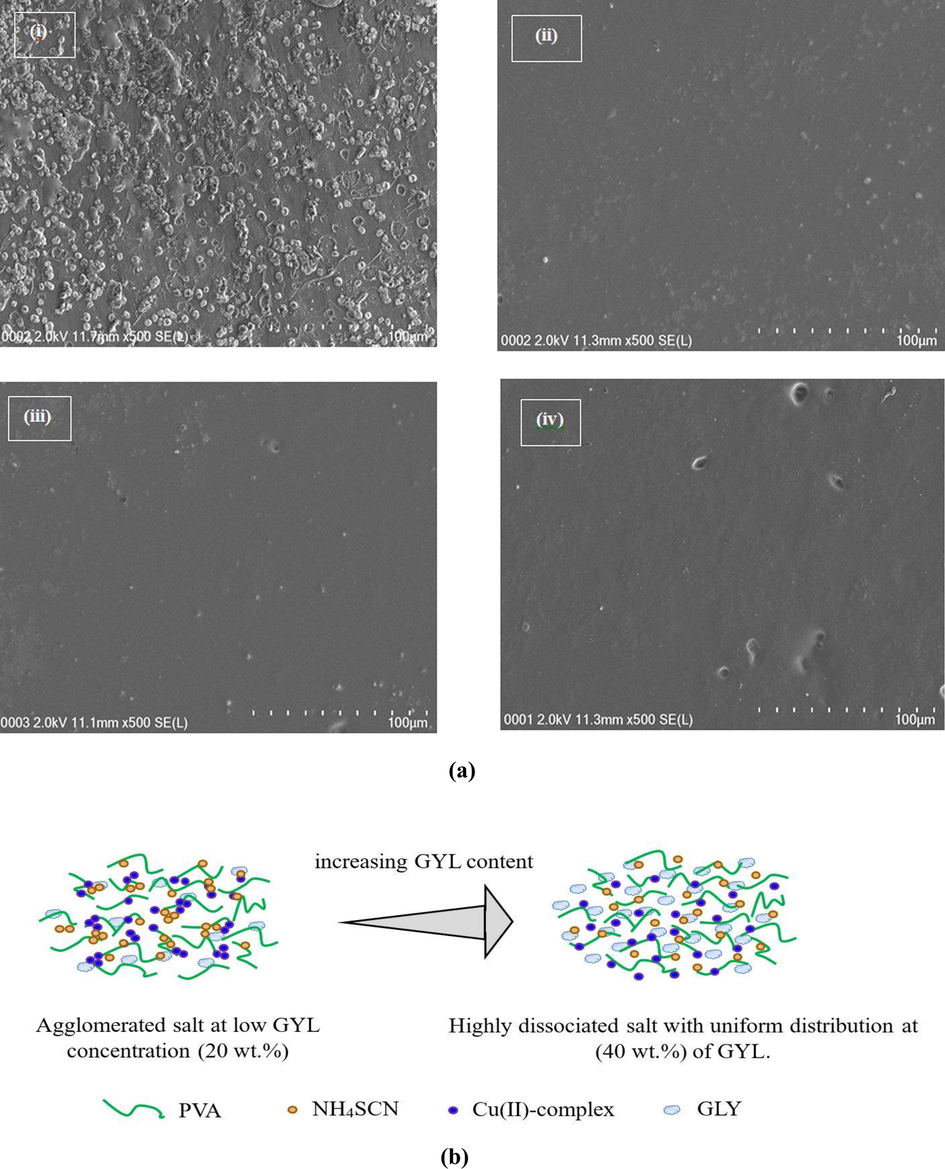
(a) Field emission scanning electron microscopy (FESEM) for (i) PGNC-1, (ii) PGNC-2, (iii) PGNC-3, and (iv) PGNC-4 electrolytes. (b) Schematic illustration of the role of GYL content on ion dissociation.
This was though, certified to be different in previous works, while extra agglomerated particles on the surface of the CPE films appeared as excessive fillers was included in the polymers. For examples, Hamsan et al. (Hamsan et al., 2017) determined the σDC decrement as more GLY was inserted. It has been explained that this is ascribed to the rearrangement of self-linkages of plasticizer producing recrystallization of salt which causes a decrease in σDC (Johan and Ting, 2011). Hence, polymer capability is restricted to accommodate extra salts, which in turn caused recrystallization of salt (Aziz, 2017). Lim et al. (Lim et al., 2014) have also connected the surface morphology of CPEs to the σDC. In their work, a fall in σDC upon addition of 10 wt% TiO2 has been shown for PVA:LiClO4:TiO2 electrolyte systems. They proposed that this observation is due to the agglomeration of TiO2. They related this to the fact that, the CPE surface morphology possesses great level of rigidity owing to the addition of 10 wt% TiO2. Thus, these agglomerations could block conducting pathways for ionic movements. Large rigidity in the back bone of polymer also decreases the ion mobility. Consequently, the σDC is reduced with the blocking impact and ion transportation is limited.
It is believed that so as to accomplish high σDC, the surface has to be smooth uniform. In other words, it is linked to the film amorphous structure (Kadir et al., 2018). The addition of Cu(II)-complex improved the amorphous phase further as shown in our previous work (Brza et al., 2019). In fact, the interaction between the PVA and electrolyte’s components is evinced by the smooth uniform surface morphology of the CPE samples (see Fig. 6a(i-iv)).
In this study, the outcomes display that there is an innovation of the PE preparation as a novel and simple technique to get a great σDC and high performing EDLC. The FESEM images are in good agreement with the XRD and FTIR results. From the XRD and FTIR routes, the interaction among the PVA and electrolyte’s components were validated. It is indicated that the CPE surface morphology is observed to be nearly smooth and uniform without having obvious protruded salts at high GLY concentration. From these outcomes, the fabricated CPE was well-defined with amorphous behavior even at the maximum GLY amount. The role of GYL content on increasing free ionic species in the prepared samples is schematically illustrated in Fig. 6b.
3.4 Impedance analysis
The electrochemical and ion transference behaviors of ionic materials, for example electrodes and PEs, can be efficiently examined by the use of electrochemical impedance spectroscopy (EIS) (Cho et al., 2015; Svensson et al., 2005). In this work, EIS was used to analyze the impedance plots for the CPE films (see Fig. 7(a-d)). For PGNC-1 system in Fig. 7a, a semicircle at high frequency region is resulted from the CPEs bulk effect, and a tail at low frequencies can be noted. The tail at the low frequencies happens because of the creation of the EDLC through the free charges buildup at the electrode and electrolyte interface (Aziz et al., 2010). The spike or tail was only displayed by the other samples (see Fig. 7(b-d)).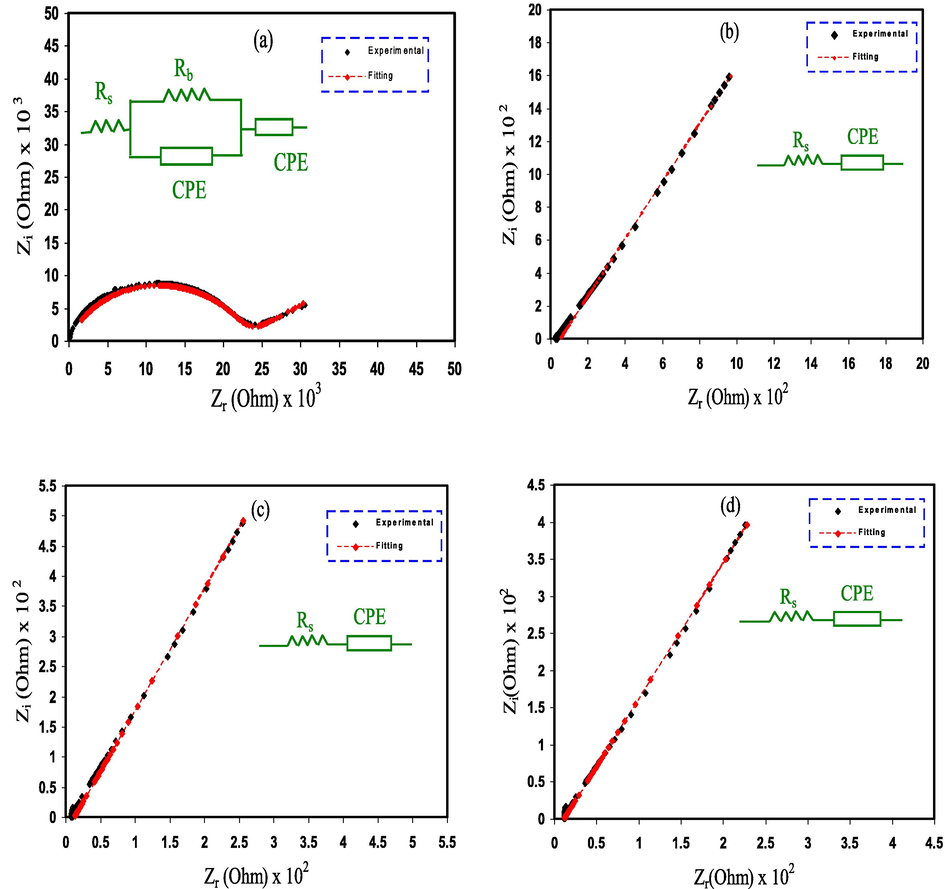
Experimental EIS for (a) PGNC-1, (b) PGNC-2, (c) PGNC-3, and (d) PGNC-4 electrolyte films.
The electrical equivalent circuit (EEC) method is used as a straightforward way for the EIS examination, which provides the entire image of electrolyte system (Pradhan et al., 2011). The Nyquist plot for the systems was deduced in terms of the EEC. It comprises bulk resistance (Rb) for the carriers in the electrolyte systems and two constant phase elements (CPE) as seen in the insert of Fig. 7. The region of high frequencies displays the connection of Rb and constant phase element in parallel, while the region of low frequencies indicates only constant phase element, meaning that the formed EDLC between electrode and electrolyte. The constant phase elements term is more usually employed in EEC rather than ideal capacitor in the real system.
The impedance of ZCPE can be written as (Hamsan et al., 2017; Aziz and Abdullah, 2018):
Here, the Zr and Zi parts of Z* associated with the EEC (inset of Fig. 7b-d) are expressed as (Aziz and Abdullah, 2018):
Table 2 outlines the fitting parameters of the EEC. The Rb is obtained by the interception between the real axis and the spike. It is obvious that upon the addition of the GLY, the semicircle at the region of high frequencies were absent (see Fig. 7b-d) due to the complete transport of ions toward the electrodes. The Rb is dropped as the GLY amount increases to 40 wt% because of the increase in mobility of charge species, ensuring the rise in the σDC of ions. The increase in σDC with the GLY amount is consistent with the FESEM results (see Fig. 6). The addition of Cu(II)–complex to the PE significantly promoted the amorphous nature that caused to increase the σDC and improve the EDLC performing. Rangasamy et al., (Rangasamy et al., 2019) thought that the increase in the amorphous phase of the PE increases the ions mobility by developing more free volume in the PE system. This leads to an increase in the polymer chains segmental motion, due to the rise in the polymer chains flexibility. Therefore, the σDC in the PE can be improved. Liew (Liew, 2017) had developed the CPE based on PAA:LiTFSI with the insertion of BaTiO3. The author obtained σDC of 5 × 10⁻⁴ S cm−1 and used the CPE in the EDLC cells. This indicates that CPE is a good candidate to be employed as a PE in the EDLC device. By considering the Rb value and the CPE dimensions, the σDC of the CPE films can be calculated using the relation below (Aziz et al., 2019);
Where; LiClO4 = Lithium perchlorate, TiO2 = Titanium dioxide, CMC = Carboxymethyl cellulose, KC = kappa carrageenan, NH4NO3 = Ammonium nitrate, Al2SiO5 = Aluminium silicate, PAA = Poly(acrylic acid), LiTFS = lithium bis(trifluoromethanesulfonyl)imide, BaTiO3 = barium titanate, PS = Potato starch, MC = methylcellulose, EC = ethylene carbonate, CH3COONH4 = Ammonium acetate, BmImBr = 1-butyl-3-methylimidazolium bromide, PEG = poly (ethylene glycol), EMI-TFSI = 1-ethyl-3-methylimidazolium bis(trifluoromethanesulfoly) amide, PVdF = poly(vinylidene fluoride), HFP = hexafluoropropylene, PDMA = poly (N, N-dimethylacrylamide), MgTf2 = Magnesium trifluoromethanesulfonate, Co3O4 = Cobalt oxide, Naft = sodium trifluoromethanesulfonate, BmImBr = 1-butyl-3-methylimidazolium bromide, NH4F = Ammonium fluoride.
Sample
P1 (rad)
P2 (rad)
K1 (F-1)
K2 (F-1)
C1 (F)
C2 (F)
PGNC-1
0.814768
0.383195
1.20 × 10⁹
9.20 × 10⁴
8.33 × 10⁻¹⁰
1.09 × 10⁻⁵
PGNC-2
–
0.668364
–
8.60 × 10⁴
–
1.16 × 10⁻⁵
PGNC-3
–
0.706885
–
3.20 × 10⁴
–
3.13 × 10⁻⁵
PGNC-3
–
0.681095
–
2.27 × 10⁴
–
4.41 × 10⁻⁵
Designation
Composition (PVA wt.%:NH4SCN wt.%:Cu(II)–complex mL:GLY wt.%:)
Rb (Ohm)
σDC (S cm−1)
PGNC-1
50:50:10:10
2.28 × 10⁴
5.23 × 10⁻⁷
PGNC-2
50:50:10:20
50
3.24 × 10⁻⁴
PGNC-3
50:50:10:30
12
1.46 × 10⁻³
PGNC-4
50:50:10:40
11
2.25 × 10⁻³
Electrolyte composition
σDC (S cm−1)
Cd (F g−1)
Ed (Wh kg−1)
Pd (W kg−1)
Cycle No.
Ref.
PVA:LiClO4:TiO2
1.3 × 10⁻⁴
12.5
1.56
198.7
1000
(Lim et al., 2014)
CMC:KC:NH4NO3
∼10-4
20
–
–
10,000
(Zainuddin et al., 2020)
Chitosan:H3PO4:NH4NO3:Al2SiO5
(1.82 ± 0.1) × 10-4
0.2
–
–
100
(Arof and Majid, 2008)
PAA:LiTFS:BaTiO3
5 × 10⁻⁴
34.22
3.32
71.47
20,000
(Liew, 2017)
PDMA: MgTf2: Co3O4
9.4 × 10⁻³
29.48
1.89–2.62
157.7–240.4
8000
(Bashir et al., 2020)
Dextran:NH4Br
(1.67 ± 0.36) × 10−6
2.05
–
–
100
(Hamsan et al., 2020)
PS:MC:NH4NO3:GLY
∼10−3
31
3.1
910–385
1000
(Hamsan et al., 2017)
PVA:chitosan:NH4NO3:EC
1.6 × 10⁻³
27.1
–
–
100
(Kadir and Arof, 2011)
MC:NH4Br:GLY
(1.89 ± 0.05) × 10−4
–
–
–
-
(Kadir et al., 2018)
Chitosan:MC:NH4I
6.65 × 10⁻⁴
9.97
1.1
578.55
100
(Aziz et al., 2020)
PVA:Naft:BmImBr
2.31 × 10⁻³
16.32
–
–
1000
(Farah et al., 2019)
Chitosan:MC:NH4F
2.96 × 10⁻³
58.3
7.3
964
100
(Aziz et al., 2020)
PVA:CH3COONH4:BmImBr
(9.29 ± 0.01) × 10−3
21.89
1.36
34.66
500
(Liew et al., 2015)
PVA:dextran:NH4I
2.08 × 10⁻⁵
4.2
0.55
64
100
(Aziz et al., 2020)
MC:NH4NO3:PEG
38
3.9
140
100
(Shuhaimi et al., 2012)
MC:dextran:NH4I
1.12 × 10⁻³
79
8.81
1111.1–170
100
(Aziz et al., 2020)
Cellulose acetate:LiClO4
4.9 × 10⁻³
90
–
–
600
(Selvakumar and Bhat, 2008)
EMIM-TFSI:PVDF-HFP
–
51.8
15.7
1048
3000
(Lee et al., 2014)
PVA:NH4SCN:Cu-complex:Gly
2.25 × 10⁻³
155.32
17.473
4960
1000
This work
Here qi stands for the charge of the species (1.6 × 10⁻¹⁹C). There was an increase in σDC when ni and µi inside the system of PE increases, as it is apparent from Eq. (13). The Table 3 data as well as EIS spectra in Fig. 7 obviously indicate that having more GLY concentration will give rise to the value of σDC. GLY decreases the attraction force between the cations and anions of the salt (Shukur and Kadir, 2014, 2015). Thus, a greater number of ammonium ions (ni) is offered by NH4SCN to the polymer.
3.5 EDLC characteristics
3.5.1 Transference number measurement (TNM)
TNM is employed to identify the highest carrier species inside the CPE. When 0.2 V is applied, the current commences to decrease until it gets saturation. The current polarization set against time for the maximum conducting CPE (PGNC-4) is portrayed in Fig. 8. The cause for the enormous of the early current value is in consequence of the part held by the ion and the electron carriers at the early stage. Fig. 8 illustrates that there is a substantial reduction in the current prior it reached an equilibrium state. Once the CPE was polarized, it is in the equilibrium; whereas, the maintained current movement is owing to electron species. The cause for that is the blocking of ions caused by the SS electrodes, which lets only the electron to transport through it (Rani et al., 2018). Eqs. (1) and (2) are employed to evaluate tion and tel values, which obtaining Ii and Iss values as 279.9 µA and 8.1µA, respectively. The tion and tel values are established to be 0.971 and 0.029, respectively. It is interesting to note that the tion is very close to the ideal value of one. Subsequently, it is concluded that ions have a significant role in the transportation mechanism in the PVA:NH4SCN:Cu(II)–complex:GLY system.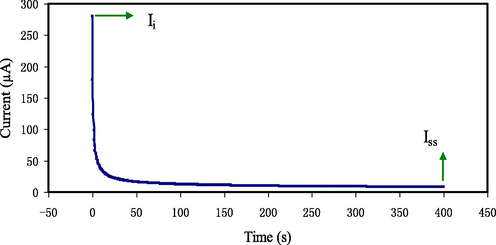
Polarization current versus time for the maximum conducting (PGNC-4) CPE film.
3.5.1.1 Electrochemical stability study
The electrochemical stability window (ESW) is an essential characteristic to be studied (Pandey et al., 2010). Hence, linear sweep voltammetry (LSV) measurement is led to find the PE decomposition voltage. The device performance is verified when one is alert of the ESW of the PE film prior the test of charge–discharge cycles. To avoid causing any harm to the PE, the decomposition voltage is vital. Fig. 9 depicts the LSV plot of PGNC-4 at 10 mV s−1 with a voltage range of 0 to 2.5 V. There is no obvious change in the current within the working electrode in the voltage varying from 0 to 2.15 V. ESW is observed at 2.15 V as the current starts to raise drastically, revealing CPE decomposition.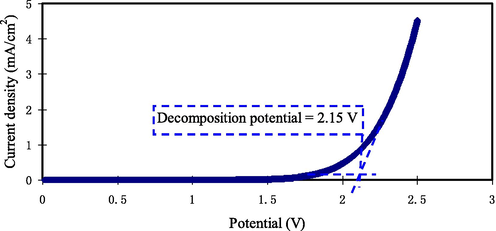
LSV plot for the maximum conducting (PGNC-4) CPE film.
This outcome is similar to the work by Liew (Liew, 2017) on PAA:LiTFSI:BaTiO3 CPE with ESW of 2.3 V. They employed the CPE in an EDLC. Kadir & Arof (Kadir and Arof, 2011) reported that the ESW for PVA-chitosan-NH4NO3-EC film is 1.70 V, which is lesser than the obtained result in our work. The usual ESW for protonic battery use is approximately 1 V (Pratap et al., 2006). Therefore, the decomposition voltage of PGNC-4 highlights its suitability for applications in protonic devices. Lim et al. (Lim et al., 2014) documented that the decomposition voltage of PVA:LiClO4:TiO2 was found to be 2.4 V and they used the CPE in an EDLC.
3.5.1.2 Cyclic voltammetry study
Cyclic Voltammetry (CV) examination was employed to assess the performance of EDLC using PGNC-4 CPE. Fig. 10 shows the CV plot of EDLC at various scan rates of 5, 10, 20, 50, and 100 mV s−1. No peak is seen in the CV plot signifying that no redox reaction happens at the potential range of 0 to 0.9 V. This is verified the existence of EDLCs (Liew and Ramesh, 2015). As seen in Fig. 10, the CV plot shape deviated from a leaf shape to a nearby shape of a rectangle when the scan rate decreases. High scan rate causes a departure of the CV plot from rectangular shape that is ascribed to the internal resistance and carbon porosity; hence, generating a current–voltage dependence (Kadir and Arof, 2011). The values of CCV will be derived from the profile of CV with Eq. (3) and are presented in Table 5 at different scan rates of 5, 10, 20, 50, and 100 mV s−1. The value of CCV increases as the scan rate drops. Ions use the whole vacant sites through the electrodes where ions have appropriate time for the mechanism of diffusion at short scan rates, causing in grander value of CCV (Lim et al., 2014). The CV shapes acquired in this work is similar to that achieved by Lim et al. (Lim et al., 2014). In their study, the CV at the scan rates of 10, 30, 50, and 100 mV s−1 were created for EDLCs with the system of PVA:LiClO4:TiO2-based CPE.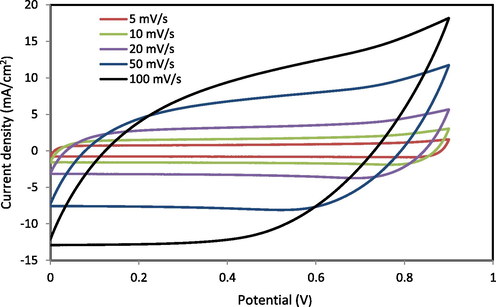
Cyclic voltammetry (CV) plot of the synthesized EDLC for the largest conducting (PGNC-4) CPE film.
Scan rates (mv/s)
Capacitance (F/g)
100
64.014
50
100.137
20
123.457
10
132.602
5
134.889
3.6 Galvanostatic charge–discharge analyses
Fig. 11a displays the EDLC charge–discharge profile at initial cycles at 0.5 mA cm−2 current density. The roughly discharge curves with linear slope designates the EDLC capacitive manners (Lim et al., 2014). The charge–discharge plot of the EDLC at 0.5 mA cm−2 for the selected cycles up to 1000th cycles is exposed in Fig. 11b, c. It could be seen that the discharge slope is still almost linear, signifying the presence of capacitive behavior of the EDLC (Lim et al., 2014). Fig. 11b,c displays the charge–discharge performance of the EDLC at specific cycles. At the beginning of charge–discharge process more ions are available to form double layer thus providing longer discharge time. As the cycle number increase, the discharge time become shorter, this is due to recombination of ion to form ion pairs or triplets. The development of ion pairs reduces the charge double-layer.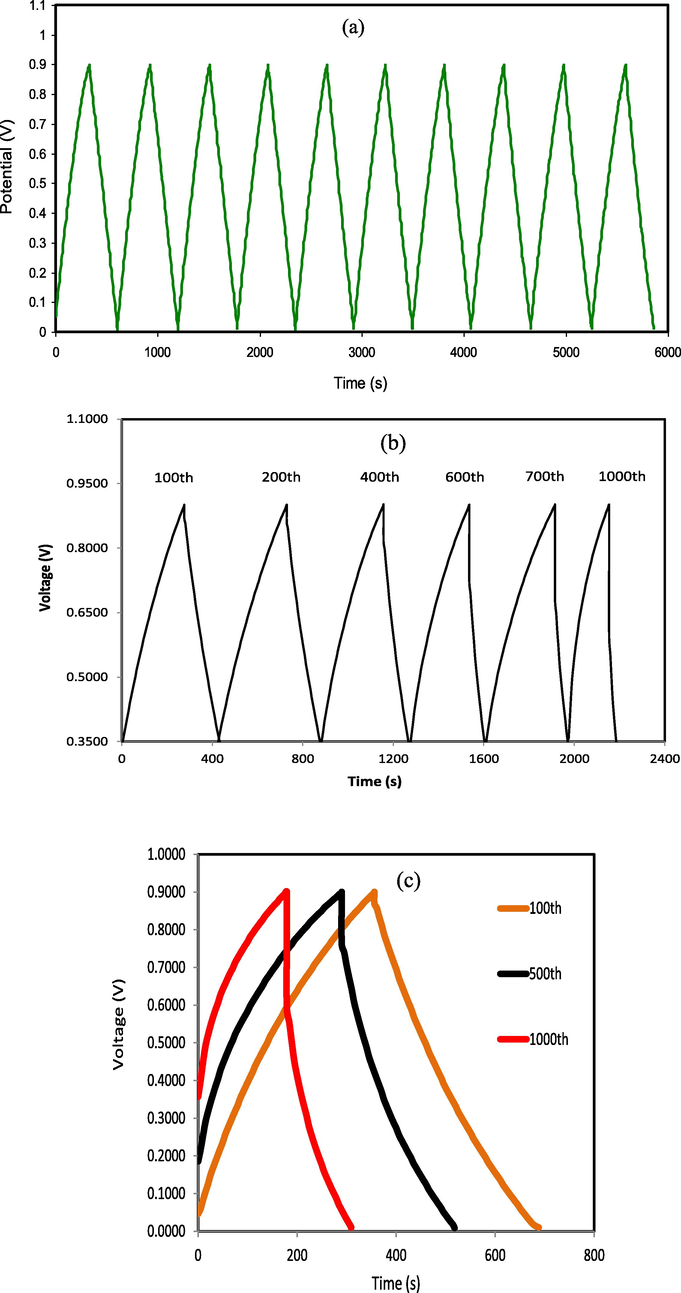
Charge–discharge profiles for the synthesized EDLC at 0.5 mA cm−2 for (a) initial cycles, (b) selected cycles of 100th, 200th, 400th, 600th, 700th, and 1000th and (c) selected cycles of 100th, 500th, and 1000th.
The value of Cd is computed by substitution the value of the slope of the discharge curves in Eq. (4). Fig. 12 displays the Cd versus number of cycles. The Cd value calculated for the 1st cycle is 128.6F g−1. This value is analogous to the CCV obtained from CV examination (see Table 5). Therefore, the Cd value accomplished from the EDLC in this study is responsible. The value of Cd was found to increase and stays constant with the average of 155.32F g−1 besides the 1st cycle till it finishes 1000 cycles. Though, in previous documents significant decrease of Cd has been discerned with raising the number of cycles (Lim et al., 2014; Liew, 2017). The achieved Cd in this study is much higher than those stated in the literature using various PEs (see Table 4).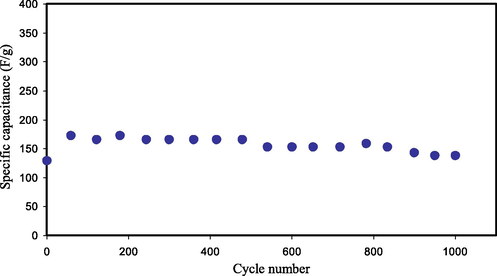
Cd of the synthesized EDLC for 1000 cycles.
The development of Cd in the EDLC is ascribed to the higher σDC value of the CPE due to the influence of the Cu(II)-complex on the enhancement of the amorphous structure (Brza et al., 2019), and the addition of GLY plasticizer (Hamsan et al., 2017). As reported by Fan et al. (Fan et al., 2018), the development of the amorphous phase is to be beneficial in local chain segmental motion that can encourage the ions transportation and hence increasing the σDC. Thus, ions can transfer freely through the PE. Fast ion migration in the CPE also encourages the adsorption of ions at the interfaces of the electrodes and electrolytes that causes greater Cd value of EDLC (Liew, 2017).
The decrease in the voltage throughout the discharging process is caused by the EDLC internal resistance. The low drop voltage value, Vd, in this study denotes that less energy is dissipated during the charge–discharge process. The value of Vd is found by using Eq. (5) and displayed in Fig. 13. It can be seen that the increase in the value of Vd is still small throughout 1000 cycles, revealing the high performance of the fabricated EDLC. The EDLC internal resistance is attributed as equivalent series resistance (ESR). Therefore, a low ESR is crucial for the EDLC application. As documented by Arof et al. (Arof et al., 2012), the ESR in the EDLC is originated from the resistance of the current collectors, PE, and the space amongst the PE and the current collector. ESR is determined via Eq. (5), and the values are illustrated in Fig. 14. A best contact among PEs and electrodes would be achieved because of low ESR, meaning that the migration of ions to the pores at the electrodes surface would be efficient (Asmara et al., 2011). Kumar & Bhat (Kumar and Bhat, 2009) documented that the increase in Vd among the cycles of charge–discharge, which creates the increase in ESR is caused by the PE degradation in the EDLC. Fortunately, the increase in the ESR of the EDLC in the current work is still small within 1000 cycles. The ESR in the current study is much lower than the ESR values documented for other EDLC devices (Zainuddin et al., 2020; Aziz et al., 2020).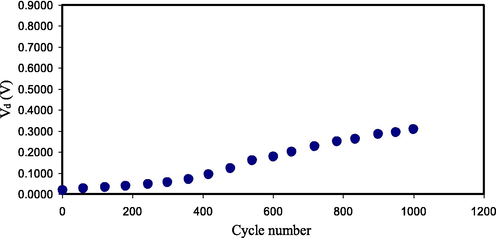
Vd pattern of the fabricated EDLC for 1000 cycles.
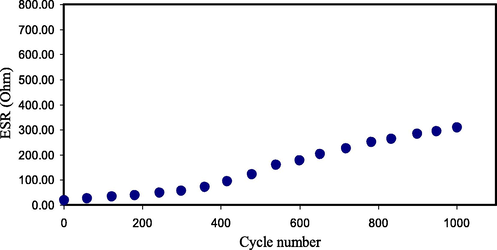
ESR pattern of the created EDLC for 1000 cycles.
The energy density (Ed) and power density (Pd) of the EDLC device are achieved using the following equations (Aziz et al., 2020):
From Fig. 15, it can be perceived that the value of Ed using Eq. (14) for the 1st cycle is 14.467 Wh kg−1.The value of Ed exhibits an increase and continues constant with the average of 17.473 Wh kg−1 within the cycles beyond the 1st cycle up to 1000 cycles. It means that the same energy barrier is subjected by ions species in migration to the surface of the AC electrodes for the processes of charge–discharge within 1000 cycles. Though, in previous reports noticable decrease in Ed value were noted with increasing the cycle number (Liew, 2017; Liew et al., 2015). They described that the decrease in the value of Ed within the cycle number is ascribed to the raise in the ESR that creates the increase of energy loss through the mechanism of charge–discharge cycles (Kadir and Arof, 2011; Wei et al., 2005). The accomplished Ed for the EDLC is sufficiently large compared to that described (3 Wh/kg) for PAA:LiTFSI:BaTiO3- based CPE (Liew, 2017). The obtained Ed in the current study is of the considerable attention in respect of the Ed value of roughly 1.56 Wh/kg that found for EDLC of the CPE system of PVA:LiClO4:TiO2 (Lim et al., 2014). Fortunately, the value of Ed (17.473 Wh kg−1) within 1000 cycles in the current work is in the range of battery energy density and significantly higher than the Ed values reported in the literature (see Table 4). These results indicate that the Cu(II)-complex as filler has a great impact on the performance of the EDLC device.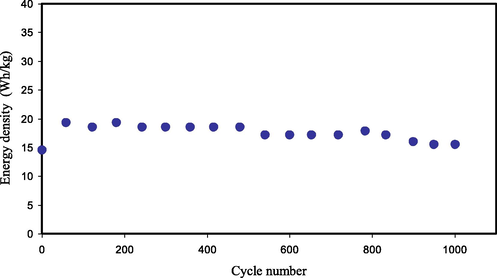
Ed of the synthesized EDLC for 1000 cycles.
The achieved Pd value using Eq. (15) for our study will be seen in Fig. 16. Over charge–discharge within 1000 cycles, the Pd value for the 1st cycle is 4960 W kg−1 and subjected to a drop up to 500th cycle with the average of 2277 W kg−1 and then continues constant with the average of 400 W kg−1 throughout the cycles beyond the 500th cycle. The drop of Pd at higher cycles is because of the depletion of the PE. Ion agglomeration after the fast charge–discharge mechanisms blocks the migration of ions to the electrodes that causes a decrease of adsorption of ions at the interfaces of the electrodes and PEs (Liew et al., 2016). This tendency of Pd drop is in agreement with the rising ESR tendency. The ESR raise at greater cycles due to the reduction in the mobile ion concentration and aggregation of ions after the swift processes of charge–discharge cycles offers smaller Pd at higher cycles (Zhong et al., 2015). The accomplished Pd for the EDLC cell is high in comparison to that reported in the literature (see Table 4).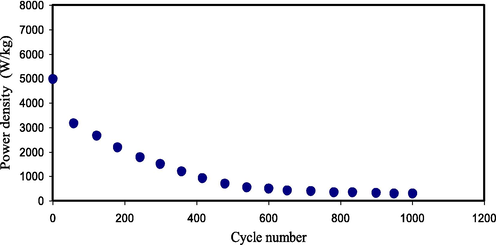
Pd of the developed EDLC for 1000 cycles.
4 Conclusion
PVA:NH4SCN:Cu(II)-complex:GLY -based CPE was efficiently fabricated using the solution casting process. The addition of Cu(II)-complex and GLY maximized the σDC up to 2.25 × 10⁻³ Scm−1. Outcome from the XRD route displayed that the highest glycerolized CPE exhibits the most amorphousity. Outcome from the XRD examination displayed that the utmost conducting plasticized system has the smallest degree of crystallinity and the XRD outcomes could also be associated to the trend in the degree of crystallinity with conductivity variation of the CPE sytems. Using the FTIR route, the interaction amongst PVA and the PE components was confirmed. The FESEM route revealed that the films surface morphology were smooth uniform at higher GLY concentration. TNM established that the dominant charge carriers were ions. The tion as well as tel for the utmost conducting CPE were determined to be 0.971 and 0.029, respectively. LSV route displayed that the decomposition voltage for PGNC-4 system is at 2.15 V, suggesting its appropriateness in the EDLC application. Capacitive manner in the synthesized EDLC was confirmed by CV examination, as no redox peaks were perceived. CCV was revealed to be affected by the used scan rates. The Cd and Ed of the EDLC are almost constant throughout 1000 cycles with average values of 155.322F/g and 17.473 Wh/Kg, respectively at a current density of 0.5 mA/cm2. Fortunately, the Ed of the EDLC in the current work is in the range of battery energy density. The low value of ESR indicates that the EDLC has a proper contact among the AC electrodes and the PEs. The EDLC has initial high Pd as 4960.31 W/Kg.
Acknowledgments
The authors appreciatively acknowledge the financial support for this work by the Ministry of Higher Education & Scientific Research-Kurdish National Research Council (KNRC)-Kurdistan Region-Iraq.
References
- Capacitive behavior studies on electrical double layer capacitor using poly (vinyl alcohol)-lithium perchlorate based polymer electrolyte incorporated with TiO2. Mater. Chem. Phys.. 2014;143:661-667.
- [CrossRef] [Google Scholar]
- Review of the use of transition-metal-oxide and conducting polymer-based fibres for high-performance supercapacitors. Mater. Des.. 2020;186:108199
- [CrossRef] [Google Scholar]
- Overview of current and future energy storage technologies for electric power applications. Renew. Sustain. Energy Rev.. 2009;13:1513-1522.
- [CrossRef] [Google Scholar]
- What are batteries, fuel cells, and supercapacitors? Chem. Rev.. 2004;104:4245-4269.
- [CrossRef] [Google Scholar]
- Simple capacitors to supercapacitors - An overview. Int. J. Electrochem. Sci.. 2008;3:1196-1217.
- [Google Scholar]
- Progress of electrochemical capacitor electrode materials: A review. Int. J. Hydrogen Energy.. 2009;34:4889-4899.
- [CrossRef] [Google Scholar]
- Super-capacitive electro-chemical performance of polymer blend gel polymer electrolyte (GPE) in carbon-based electrical double-layer capacitors. Electrochim. Acta.. 2013;112:678-685.
- [CrossRef] [Google Scholar]
- Preparation and characterization of activated carbons from oxygen-rich lignite for electric double-layer capacitor. Int. J. Electrochem. Sci.. 2018;13:2800-2816.
- [Google Scholar]
- Metal complex as a novel approach to enhance the amorphous phase and improve the EDLC performance of plasticized proton conducting chitosan-based polymer electrolyte. Membranes (Basel).. 2020;10:1-20.
- [CrossRef] [Google Scholar]
- C. Shen. Lim, K. H. Teoh, H. M. Ng, C. -Wen Liew, S. Ramesh, Ionic conductivity enhancement studies of composite polymer electrolyte based on poly (vinyl alcohol)-lithium perchlorate-titanium oxide, Adv. Mater. Lett. 8 (2017) 465–471. https://doi.org/10.5185/amlett.2017.1410.
- Hydrogel Electrolytes for Flexible Aqueous Energy Storage Devices. Adv. Funct. Mater.. 2018;28:1804560.
- [CrossRef] [Google Scholar]
- Enhancing the Efficiency of a Dye-Sensitized Solar Cell Based on a Metal Oxide Nanocomposite Gel Polymer Electrolyte. ACS Appl. Mater. Interfaces.. 2019;11:30185-30196.
- [CrossRef] [Google Scholar]
- Effect of glycerol on EDLC characteristics of chitosan : methylcellulose polymer blend electrolytes. J. Mater. Res. Technol.. 2020;9:8355-8366.
- [CrossRef] [Google Scholar]
- Enhancing the performance of green solid-state electric double-layer capacitor incorporated with fumed silica nanoparticles. J. Phys. Chem. Solids.. 2018;117:194-203.
- [CrossRef] [Google Scholar]
- Role of nano-capacitor on dielectric constant enhancement in PEO:NH4SCN:xCeO2 polymer nano-composites: Electrical and electrochemical properties. J. Mater. Res. Technol.. 2020;9:9283-9294.
- [CrossRef] [Google Scholar]
- Solid polymer electrolytes based on poly(vinyl alcohol) incorporated with sodium salt and ionic liquid for electrical double layer capacitor. Mater. Sci. Eng. B Solid-State Mater. Adv. Technol.. 2019;251
- [CrossRef] [Google Scholar]
- From Cellulose, Shrimp and Crab Shells to Energy Storage EDLC Cells: The Study of Structural and Electrochemical Properties of Proton Conducting Chitosan-Based Biopolymer Blend Electrolytes. Polymers (Basel). 2020;12:1526.
- [CrossRef] [Google Scholar]
- Synthesis and characterization of hybrid poly (N, N-dimethylacrylamide) composite hydrogel electrolytes and their performance in supercapacitor. Electrochim. Acta.. 2020;332:135438
- [CrossRef] [Google Scholar]
- The conductivity and dielectric studies of solid polymer electrolytes based on poly (acrylamide-co-acrylic acid) doped with sodium iodide. Ionics (Kiel). 2018;24:1947-1953.
- [CrossRef] [Google Scholar]
- The Effect of glycerol on the crystalline, thermal, and tensile properties of CaCl2-doped starch/PVA films. Polym. Compos.. 2015;37:3191-3199.
- [CrossRef] [Google Scholar]
- High-performance and flexible solid-state supercapacitors based on high toughness and thermoplastic poly(vinyl alcohol)/NaCl/glycerol supramolecular gel polymer electrolyte. Electrochim. Acta.. 2019;324:134874
- [CrossRef] [Google Scholar]
- Effect of the molecular weights on the optical and mechanical properties of poly(vinyl alcohol) films. Polym. Test.. 2002;21:847-850.
- [CrossRef] [Google Scholar]
- Dense branched growth of (SCN)x and ion transport in the poly(ethyleneoxide) NH4SCN polymer electrolyte. Phys. Rev. B.. 1995;52:225.
- [CrossRef] [Google Scholar]
- A new estimation of the lattice energies of the ammonium halides and the proton affinity of gaseous ammonia. Mol. Phys.. 1976;32:231-236.
- [CrossRef] [Google Scholar]
- Kadir, M. F. Z, Characteristics of proton conducting PVA-chitosan polymer blend electrolytes. Doctoral Dissertation University of Malaya (2010). Kuala Lumpur, Malaysia.
- Electrical and transport properties of NH4Br-doped cornstarch-based solid biopolymer electrolyte. Ionics (Kiel).. 2014;21:111-124.
- [CrossRef] [Google Scholar]
- Hydrogen ion conducting starch-chitosan blend based electrolyte for application in electrochemical devices. Electrochim. Acta.. 2015;158:152-165.
- [CrossRef] [Google Scholar]
- From green remediation to polymer hybrid fabrication with improved optical band gaps. Int. J. Mol. Sci.. 2019;20:3910.
- [CrossRef] [Google Scholar]
- Plasticized alkaline solid polymer electrolyte system. Mater. Lett.. 2007;61:3096-3099.
- [CrossRef] [Google Scholar]
- Evaluation and investigation on the effect of ionic liquid onto PMMA-PVC gel polymer blend electrolytes. J. Non. Cryst. Solids.. 2011;357:2132-2138.
- [CrossRef] [Google Scholar]
- Glycerolized Li+ ion conducting chitosan-based polymer electrolyte for energy storage EDLC device applications with relatively high energy density. Polymers (Basel).. 2020;12:1-19.
- [CrossRef] [Google Scholar]
- Structural, vibrational and electrical characterization of PVA-NH4Br polymer electrolyte system. Phys. B Condens. Matter.. 2008;403:2740-2747.
- [CrossRef] [Google Scholar]
- Studies of proton conducting polymer electrolyte based on PVA, amino acid proline and NH4SCN. J. Sci. Adv. Mater. Devices.. 2019;4:101-110.
- [CrossRef] [Google Scholar]
- Fabrication of polymer blend composites based on [PVA-PVP](1–x):(Ag2S)x (0.01 ≤ x ≤ 0.03) with small optical band gaps: Structural and optical properties. Mater. Sci. Semicond. Process.. 2017;71:197-203.
- [CrossRef] [Google Scholar]
- Modifying Poly(Vinyl Alcohol) (PVA) from Insulator to Small-Bandgap Polymer: A Novel Approach for Organic Solar Cells and Optoelectronic Devices. J. Electron. Mater.. 2016;45:736-745.
- [CrossRef] [Google Scholar]
- The effect of LiCF3SO3 on the complexation with potato starch-chitosan blend polymer electrolytes. Ionics (Kiel).. 2016;22:1647-1658.
- [CrossRef] [Google Scholar]
- Structural and Conduction Studies of Solid Biopolymer Electrolytes System Based on Carboxymethyl Cellulose. Am. J. Sustain. Agric.. 2015;9:15-22.
- [Google Scholar]
- Electrical impedance and conduction mechanism analysis of biopolymer electrolytes based on methyl cellulose doped with ammonium iodide. Ionics. 2016;22:2157-2167.
- [CrossRef] [Google Scholar]
- Microstructure and molecular interaction in glycerol plasticized chitosan/poly (vinyl alcohol) blending films. Macromol. Chem. Phys.. 2009;210:832-839.
- [CrossRef] [Google Scholar]
- Electrical conduction and dielectric relaxation in p-type PVA/CuI polymer composite. J. Adv. Res.. 2013;4:531-538.
- [CrossRef] [Google Scholar]
- Structural, optical, opto-thermal and thermal properties of ZnS-PVA nanofluids synthesized through a radiolytic approach. Beilstein J. Nanotechnol.. 2015;6:529-536.
- [CrossRef] [Google Scholar]
- Acrylamide modified poly(vinyl alcohol): Crystalline and enhanced water solubility. RSC Adv.. 2015;5:86598-86605.
- [CrossRef] [Google Scholar]
- Development of Polymer Blends Based on PVA:POZ with Low Dielectric Constant for Microelectronic Applications. Sci. Rep.. 2019;9:1-12.
- [CrossRef] [Google Scholar]
- Conductivity enhancement via chemical modification of chitosan based green polymer electrolyte. Electrochim. Acta.. 2013;92:161-167.
- [CrossRef] [Google Scholar]
- NH4NO3 as charge carrier contributor in glycerolized potato starch-methyl cellulose blend-based polymer electrolyte and the application in electrochemical double-layer capacitor. Ionics (Kiel).. 2017;23:3429-3453.
- [CrossRef] [Google Scholar]
- Structural, thermal and electrical properties of nano manganese-composite polymer electrolytes. Int. J. Electrochem. Sci.. 2011;6:4737-4748.
- [Google Scholar]
- Morphological and optical characteristics of chitosan(1–x): Cuox (4 ≤ x ≤ 12) based polymer nano-composites: Optical dielectric loss as an alternative method for tauc’s model. Nanomaterials.. 2017;7:1-15.
- [CrossRef] [Google Scholar]
- Biopolymeric electrolyte based on glycerolized methyl cellulose with NH4Br as proton source and potential application in EDLC. Ionics (Kiel).. 2018;24:1651-1662.
- [CrossRef] [Google Scholar]
- Influence of Microstructure on Impedance Response in Intercalation Electrodes. J. Electrochem. Soc.. 2015;162:A1202-A1214.
- [CrossRef] [Google Scholar]
- Modeling of the impedance response of porous metal hydride electrodes. Electrochim. Acta.. 2005;50:2647-2653.
- [CrossRef] [Google Scholar]
- Influence of silver ion reduction on electrical modulus parameters of solid polymer electrolyte based on chitosan-silver triflate electrolyte membrane. Express Polym. Lett.. 2010;4:300-310.
- [CrossRef] [Google Scholar]
- Effect of plasticizer on structural and electrical properties of nanocomposite solid polymer electrolytes. Ionics (Kiel).. 2011;17:127-134.
- [CrossRef] [Google Scholar]
- Crystalline and amorphous phase identification from the tanδ relaxation peaks and impedance plots in polymer blend electrolytes based on [CS:AgNt]x:PEO(x–1) (10 ≤ x ≤ 50) Electrochim. Acta.. 2018;285:30-46.
- [CrossRef] [Google Scholar]
- Solid polymer electrolytes with poly(vinyl alcohol) and piperidinium based ionic liquid for Li-ion batteries. Solid State Ionics.. 2019;333:76-82.
- [CrossRef] [Google Scholar]
- C.W. Liew, Nanocomposite Polymer Electrolytes for Electric Double Layer Capacitors (EDLCs) Application, in: Nanomaterials in energy devices, by J.H. Kiat (Ed.), First Ed., CRC Press Taylor & Francis Group, 2017: p. 40.
- Fabrication of energy storage EDLC device based on CS:PEO polymer blend electrolytes with high Li+ ion transference number. Results Phys.. 2019;15:102584
- [CrossRef] [Google Scholar]
- Li+ ion conduction mechanism in poly (ε-caprolactone)-based polymer electrolyte. Iran. Polym. J.. 2013;22:877-883.
- [CrossRef] [Google Scholar]
- Investigation on favourable ionic conduction based on CMC-K carrageenan proton conducting hybrid solid bio-polymer electrolytes for applications in EDLC. Int. J. Hydrogen Energy.. 2020;45:8727-8741.
- [CrossRef] [Google Scholar]
- A.K. Arof, S.R. Majid, Electrical Studies on Chitosan Based Proton Conductors and Application in Capacitors, Mol. Cryst. Liq. Cryst. 484 (2008) 107/[473]-116/[482]. https://doi.org/10.1080/15421400801904245.
- Influence of NH4Br as an ionic source on the structural/electrical properties of dextran-based biopolymer electrolytes and EDLC application. Bull. Mater. Sci.. 2020;43
- [CrossRef] [Google Scholar]
- Application of PVA-chitosan blend polymer electrolyte membrane in electrical double layer capacitor. Mater. Res. Innov.. 2011;15:s217-s220.
- [CrossRef] [Google Scholar]
- Characterization of ionic liquid added poly(vinyl alcohol)-based proton conducting polymer electrolytes and electrochemical studies on the supercapacitors. Int. J. Hydrogen Energy.. 2015;40:852-862.
- [CrossRef] [Google Scholar]
- Effect of ohmic-drop on electrochemical performance of EDLC fabricated from PVA: Dextran: NH4I based polymer blend electrolytes. J. Mater. Res. Technol.. 2020;9:3734-3745.
- [CrossRef] [Google Scholar]
- Electrical double-layer capacitors with plasticized polymer electrolyte based on methyl cellulose. Polym. Bull.. 2012;69:807-826.
- [CrossRef] [Google Scholar]
- Fabrication of high performance energy storage EDLC device from proton conducting methylcellulose: Dextran polymer blend electrolytes. J. Mater. Res. Technol.. 2020;9:1137-1150.
- [CrossRef] [Google Scholar]
- LiClO4 Doped Cellulose Acetate as Biodegradable Polymer Electrolyte for Supercapacitors. J. Appl. Polym. Sci.. 2008;110:594-602.
- [CrossRef] [Google Scholar]
- Stretchable carbon nanotube/ion-gel supercapacitors with high durability realized through interfacial microroughness. ACS Appl. Mater. Interfaces.. 2014;6:13578-13586.
- [CrossRef] [Google Scholar]
- Influence of nano-sized fumed silica on physicochemical and electrochemical properties of cellulose derivatives-ionic liquid biopolymer electrolytes. Ionics (Kiel).. 2018;24:807-814.
- [CrossRef] [Google Scholar]
- Ionic liquid incorporated polymer electrolytes for supercapacitor application. Indian J. Chem.. 2010;49:743-751.
- [Google Scholar]
- Polymeric rechargeable solid-state proton battery. J. Power Sources.. 2006;161:702-706.
- [CrossRef] [Google Scholar]
- Electrical, structural, thermal and electrochemical properties of corn starch-based biopolymer electrolytes. Carbohydr. Polym.. 2015;124:222-228.
- [CrossRef] [Google Scholar]
- Electric double layer capacitor based on activated carbon electrode and biodegradable composite polymer electrolyte. Ionics (Kiel).. 2014;20:251-258.
- [CrossRef] [Google Scholar]
- Preparation and characterization of PVA alkaline solid polymer electrolyte with addition of bamboo charcoal. Materials (Basel).. 2018;11:679.
- [CrossRef] [Google Scholar]
- Electrical double layer capacitor using poly (methyl methacrylate)– C4BO8Li gel polymer electrolyte and carbonaceous material from shells of mata kucing (Dimocarpus longan) fruit. Electrochim. Acta.. 2012;74:39-45.
- [CrossRef] [Google Scholar]
- Preparation and characterization of magnesium ion gel polymer electrolytes for application in electrical double layer capacitors. Electrochim. Acta.. 2011;57:91-97.
- [CrossRef] [Google Scholar]
- Polyvinyl alcohol – polystyrene sulphonic acid blend electrolyte for supercapacitor application. Phys. B Condens. Matter.. 2009;404:1143-1147.
- [CrossRef] [Google Scholar]
- A novel electrode material for electric double-layer capacitors. J. Power Sources.. 2005;141:386-391.
- [CrossRef] [Google Scholar]
- Enhanced capacitance of EDLCs (electrical double layer capacitors) based on ionic liquid-added polymer electrolytes. Energy.. 2016;109:546-556.
- [CrossRef] [Google Scholar]
- A review of electrolyte materials and compositions for electrochemical supercapacitors. Chem. Soc. Rev.. 2015;44:7484-7539.
- [CrossRef] [Google Scholar]


