

Methoxy and methylthio-substituted trans-stilbene derivatives as CYP1B1 inhibitors – QSAR study with detailed interpretation of molecular descriptors
⁎Corresponding author. natalia.piekus@cm.umk.pl (Natalia Piekuś-Słomka) kizchemanal@cm.umk.pl (Natalia Piekuś-Słomka)
-
Received: ,
Accepted: ,
This article was originally published by Elsevier and was migrated to Scientific Scholar after the change of Publisher.
Peer review under responsibility of King Saud University.
Abstract
A quantitative structure–activity relationship (QSAR) model was built using multiple linear regression (MLR) to predict the ability of series methyl and/or methylthio trans-stilbene derivatives to inhibit CYP1B1. Twenty-four compounds with their activity expressed as the negative log of the IC50 value (pIC50 [M]) were split into a training (20 compounds) and a test set (four compounds) using Kennard and Stone algorithm. Molecular descriptors were calculated using alvaDesc software after compound optimization in the Gaussian 09 package in PL-Grid. The model characterized by the best validation parameters (R2TRAIN = 0.954, Q2LOO = 0.898, R2TEST = 0.880) was chosen based on the chemometric method – cluster analysis. The applicability domain has been determined, indicating that the regression model can give reliable prediction. The study shows that the inhibitory activity against CYP1B1 of the methyl and/or methylthio trans-stilbene derivatives can be predicted by RDF035m, Mor10m, Eig04_AEA(bo), RDF070s, MaxDD descriptors. Finally, the paper attempts to interpret three-dimensional descriptors by assessing the impact of interatomic interactions, following the partition of molecules into fragments, on the final value of descriptors.
Keywords
Trans-stilbene
CYP1B1 inhibition
QSAR
Molecular descriptors

- AD
-
Applicability Domain
- AM1
-
Austin Model 1
- B3LYP
-
Becke 3 term with Lee, Yang, Parr exchange
- CA
-
cluster analysis
- DFT
-
density functional theory
- GA
-
Genetic Algorithm
- KNN
-
K-Nearest Neighbors
- LOO
-
leave-one-out
- MAE
-
mean absolute error
- MLR
-
multiple linear regression
- MNDO
-
Modified Neglect of Diatomic Overlap
- OECD
-
Organisation for Economic Cooperation and Development
- PLS
-
Partial Least Squares
- PM6
-
Parameterization Method
- RDF
-
radial distribution function
- RMSE
-
root mean square error
- SVM
-
Support Vector Machine
- QSAR
-
quantitative structure-activity relationship
Abbreviations
1 Introduction
Molecules based on the stilbene scaffold are widely represented in nature. They have aroused the interest of many scientists because of their wide range of biological properties, including anti-inflammation, cancer prevention and treatment, cardioprotection, neuroprotection, anti-diabetic, depigmentation, and some others. Stilbene skeleton consists of two phenyl rings joined by an ethylene bridge. Presence of unsaturated bond results two diastereoisomeric forms, E-1,2-diphenylethylene (trans-configuration) and Z-1,2-diphenylethylene (cis-configuration), but the trans-isomer is more common and stable disposition (Akinwumi et al., 2018). Among naturally occurring stilbenes, trans-resveratrol (3,5,4′-trihydroxy-trans-stilbene) is the most extensively studied and the best-known compound. Although resveratrol has been reported to possess many desirable pharmacological properties, it exhibits low systemic bioavailability (Tsai et al., 2017). It is the consequence of three hydroxyl groups in resveratrol molecule, which are highly available for glucuronidation or sulphation reactions. Resveratrol undergoes these second phase metabolism transformations in the intestine and liver during and after absorption. Another worth to mentioned stilbene is a dimethyl ether analogue of resveratrol, pterostilbene (3,5-dimethoxy-4′-hydroxy-trans-stilbene). Pterostilbene shares many pharmacological similarities with resveratrol. Nevertheless, it is more biologically active and has much better bioavailability than resveratrol (Akinwumi et al., 2018; Kapetanovic et al., 2011). Two methoxy groups caused increased lipophilicity, which may enhance the cell membrane permeability and is responsible for greater bioavailability (Pecyna et al., 2020; Tsai et al., 2017). This observation inspired researchers to synthesize and evaluate new trans-stilbene analogues with methoxy or bioisosteric methylthio groups in different positions of two phenyl rings (Chun et al., 2011; Kim et al., 2002; Mikstacka et al., 2012, 2014; Wierzchowski et al., 2017).
One of many mechanisms of action presented by this family of molecules is inhibition of the human cytochrome P450 1B1 (CYP1B1) enzyme. This protein is involved in the I-phase metabolism of numerous important physiological compounds, including estrogen, arachidonic acid, melatonin, retinoids, and many xenobiotics, particularly the metabolic activation of many environmental procarcinogens such as polyaromatic hydrocarbons, aromatic amines, and nitro-polycyclic hydrocarbons. It has been identified as a key enzyme in the carcinogenic action of 17-β-estradiol. CYP1B1 is expressed in the liver, like the other two members of the CYP1 family (CYP1A1 and CYP1A2) and, what is more, in various tumor tissue. The higher expression of CYP1B1 in tumor cells compared to the surrounding normal tissue has led to a greater interest in the role of CYP1B1 in tumorigenesis and its treatment (Horley et al., 2017; F. Li et al., 2017).
What is more, CYP1B1 is responsible for anti-cancer drug resistance through the metabolism of chemotherapeutic agents to inactive metabolites. For these reasons, inhibition of CYP1B1 activity is under consideration as an approach in cancer chemoprevention and cancer chemotherapy (Mikstacka & Dutkiewicz, 2021). The compounds that can inhibit the activity of CYP1B1 are the methoxy- and methylthio-trans-stilbene derivatives. The quantitative relationship between the structure of these compounds and the mentioned biological activity (QSAR, quantitative structure–activity relationship) has become the subject of the study reported in this paper. The construction of QSAR models should be based on the OECD guidelines (OECD, 2014). According to the mentioned specification, a QSAR model should be developed with (a) a defined endpoint, (b) an unambiguous algorithm to guarantee model transparency, (c) a defined domain of applicability, (d) proper measures of validation, including internal performance (as determined by goodness-of-fit and robustness) and predictivity (as represented by external validation), and (e) possible mechanistic interpretation.
The present work has three main goals: (1) calculation and validation of QSAR models by applying diverse modelling methods based on descriptors obtained by different molecular geometry optimization techniques, various methods of data pre-treatment, reduction, and selection, (2) assessment of the usefulness of cluster analysis in the selection of the best predictive model, and (3) detailed analysis and interpretation of the selected model.
2 Materials and methods
2.1 Data set
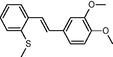
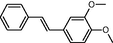
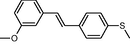
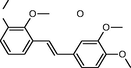
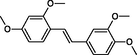
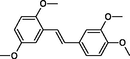
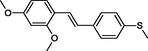
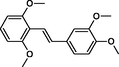
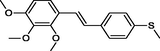
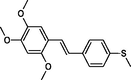
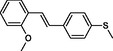
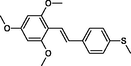
In the present work, the data set consisting of 24 molecules, trans-stilbene derivatives, was taken from the literature (Mikstacka et al., 2012, 2014; Wierzchowski et al., 2017), previously published by our co-workers. To the best of our knowledge, no QSAR model has been performed using these compounds to predict the ability to inhibit CYP1B1 enzyme. The chemical structures of studied compounds with their related activity and membership in training or test set were listed in Table 1.
|
|||||||
|---|---|---|---|---|---|---|---|
| No | Structure | pIC50a | TR/ TEb |
No | Structure | pIC50a | TR/ TEb |
| 1. |
|
7.181 | TE | 13. |
|
7.591 | TR |
| 2. |
|
8.402 | TR | 14. |
|
7.541 | TR |
| 3. |
|
6.522 | TR | 15. |
|
6.303 | TR |
| 4. |
|
6.432 | TR | 16. |

|
5.263 | TR |
| 5. |
|
6.682 | TR | 17. |

|
5.963 | TR |
| 6. |
|
6.212 | TR | 18. |
|
5.703 | TE |
| 7. |
|
6.512 | TR | 19. |
|
5.963 | TR |
| 8. |
|
5.382 | TR | 20. |
|
5.823 | TE |
| 9. |
|
5.352 | TR | 21. |
|
6.003 | TR |
| 10. |

|
6.522 | TE | 22. |
|
6.053 | TR |
| 11. |
|
7.471 | TR | 23. |
|
6.303 | TR |
| 12. |
|
7.551 | TR | 24. |
|
5.593 | TR |
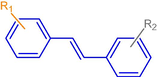
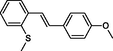
The first formula shows the general structure of the tested compounds. The colours correspond to the nomenclature used in the analysis of the received results. The blue colour signifies the core of the molecule, the orange colour signifies the substituents in Fragment 1, and the grey signifies the substituents in Fragment 2. a data from reported references; 1 (Wierzchowski et al., 2017), 2 (Mikstacka et al., 2014) 3 (Mikstacka et al., 2012); b TR – training set molecules; TE – test set molecules.
All biological activity results were obtained using the same study protocol. The duplicates were removed. Activity data expressed as IC50 values [μM] against CYP1B1 were transformed to a negative logarithmic scale (pIC50 [M]) to give numerically larger data and then used as a Y value for QSAR study. The external validation set should contain about 10–30 % of the entire set and presented activities and structures covering the whole training set range (Gramatica, 2007). Using Kennard and Stone algorithm (PLS-Toolbox 7.5 (Eigenvector Research, Inc., Manson, WA, USA) (PLS_Toolbox, 2020) in Matlab software version R2018a (The Matworks, Inc., Natick, MA, USA) (Matlab), the whole dataset was split into training (20 compounds), and test (four compounds) sets considering the ratio 5:1. The training set was used for variable selection and models construction. The remaining compounds included in the test set were used to evaluate the predictive performance of the models. As explanatory variables (X values), molecular descriptors were used. Methods of their calculation are described in the next section.
2.2 Geometry optimization methods
For calculation 3D and 4D molecular descriptors is necessary to optimize the structure’s geometry, thereby searching the molecule’s global energy minimum. For the molecular stereostructure calculations, the Gaussian 09 package (Gaussian, Inc., Wallingford CT, USA) (Frisch et al., 2009), in PL-Grid Infrastructure (PL-Grid Consortium, Poland) (2009) was used. The calculations were performed with the use of density functional theory (DFT) at the B3LYP/cc-pVDZ level (Chen & Chieh, 2003), and semi-empirical methods: Austin Model 1 (AM1) and Parameterization Method (PM6).
2.3 Descriptor’s calculation
By using alvaDesc v2.0.10 (Alvascience Srl, Lecco, Italy) (alvaDesc), a total of 5471 molecular descriptors, were computed (from 0- to 3-dimensional descriptors) (Mauri, 2020). Zero-dimensional descriptors can be calculated from the molecular formula and do not consider any information about the atom connections. As an example, can be given molecular weight and atom type counts. Information about functional group counts and atom-centered fragments but not the whole topology are considered in 1-dimensional descriptors. Two-dimensional descriptors include information about the connectivity of atoms in the molecule and atomic composition. By using the 3D representation of the molecular graph, three-dimensional descriptors are calculated. They consider the position of atoms in the three-dimensional space (Carracedo-Reboredo et al., 2021).
Gaussian 09 package (Frisch et al., 2009), in PL-Grid Infrastructure (2009) was used for additional calculation of the structure-based properties like HOMO and LUMO orbital energies and based on them global reactivity descriptors. Obtained descriptors were analysed to inspect for all missing and incorrect values.
2.4 Variable’s reduction, selection, and pre-treatment
There are many steps involved in quantitative structure–activity relationship analysis. Presently, each molecule has many potential descriptors (almost 6000) that may be used in this type of study. After data collection, it is necessary to perform variable’s reduction, selection, and pre-treatment (also known as pre-processing).
The purpose of variable reduction and selection is to remove descriptors irrelevant or negligible to a predicted biological activity of the compounds, which effects as improve computation speed, performance, and interpretability of received models. First, we reduced the number of independent variables using three different methods. Two are very simple, obvious, and popular, e.g., excluded from the database descriptors with a standard deviation less than 0.0001 or excluded from the database variables with a percentage of constant values greater than 95 %. The third one employs an existing technique for space-filling designs of experiments Wootton, Sergent, and Phan-Tan-Luu (WSP) algorithm. This variable reduction method (V-WSP) is an unsupervised approach (Ballabio et al., 2014). The V-WSP method uses a correlation threshold to reduce the number of variables with multicollinearity, redundancy, and noise, in such a manner to obtain an optimal set of descriptors with minimal correlation in multi-dimensional space (Rojas et al., 2021).
There are no certain rules on what kind of mathematical transformation the variables used in the construction of QSAR models should undergo. In this study, we perform four methods of data pre-treatment, e.g., centering, variance scaling, standardizing, range scaling. Centering (mean centering) converts all the values to fluctuations around zero instead of around the mean of the variable measurements. In this way, it adjusts for differences in the offset between variables with high and low values. Therefore, it is used to focus on the fluctuating part of the data and leaves only the relevant variation (being the variation between the observations) for analysis. Variance scaling (also known as unit autoscaling) uses the standard deviation as the scaling factor. After variance scaling, all variables have a standard deviation of one. Standardizing makes it easier to compare variables, even if those scores were measured on different scales because standardized variables have a mean of zero and a standard deviation of one. Range scaling (mean normalization) involves subtracting the mean from each observation and dividing the result by the difference between the minimum and maximum values. This procedure makes range scaling more sensitive to outliers (van den Berg et al., 2006).
Finally, further descriptors selection was made by the Genetic Algorithm (GA). This supervised method is commonly used in QSAR analysis. GA is a stochastic technique that imitates natural selection and evolution. The calculation starts by generating a set of random solutions (the population), which are analogous to a set of chromosomes in a biological system, constituted by binary vectors indicating the presence (or absence) of each descriptor in the model. In the next step, new models are made through an evolutionary process by the combination of chromosomes (models) of the initial population (crossover), in addition to randomly including (or excluding) descriptors (mutation) (Ghosh & Bagchi, 2009; Rojas et al., 2021). The fitness of each chromosome is evaluated by the fitness function. The fitness function used in the present study was the leave-one-out (LOO), cross-validated correlation coefficient (Q2LOO). The genetic algorithm procedure was iterated 10,000 times.
All calculations described in this section were performed in alvaModel v2.0.2 software (Alvascience Srl, Lecco, Italy) (AlvaModel (Software to Model QSAR Data), 2021).
2.5 QSAR models calculation
The quantitative analysis of the relationship between structural features of compounds and their ability to inhibit CYP1B1 enzyme was performed with the use of Multiple Linear Regression (MLR), Partial Least Squares (PLS), K-Nearest Neighbors (KNN), Support Vector Machine (SVM) regression methods (Huang et al., 2021) using the alvaModel v2.0.2 software (Alvascience Srl, Lecco, Italy) (AlvaModel (Software to Model QSAR Data), 2021). MLR estimates the regression coefficients' values by applying the least-squares curve fitting method. PLS regression is based on converting a large number of correlated features to a small number of uncorrelated variables called latent variables. PLS is immune to multicollinearity and is especially appropriate in dealing with a large number of explanatory variables in comparison with the number of observations (Carrascal et al., 2009). The PLS version implemented in alvaModel is based on the SIMPLS (de Jong, 1993) algorithm. The above techniques are linear methods. Therefore, they can only capture the linear relationship between an outcome variable and independent variables. Because of that, these methods may not be able to sufficiently detect the nonlinear relationships in the data (Wu et al., 2021).
The K-Nearest Neighbours algorithm is a non-parametric method most often used for classification purposes, but it can also be used for regression. In the training phase, the K-Nearest Neighbours algorithm stored the features and target values of the training dataset inside the model. In the next step, k-closest elements (called neighbours) are found, and for them, the weighted average of the predicted values of these k-neighbours are calculated. The K-Nearest Neighbours algorithm is beneficial when the relationship between the explanatory and explained variables is complex or unusual (e.g., non-monotonic), i.e., difficult to model in the classical way. If the relationship is easy to interpret (e.g., linear) and the set does not contain outliers, classical methods (e.g., MLR) will usually give more accurate results. In the present paper, as a distance measure, Euclidean distance was applied. It is the straight line distance between two points in the multi-dimensional space. The optimal number of neighbours (k) was found based on internal and external validation parameters.
Support Vector Machine (SVM) is a supervised machine-learning algorithm that can be used either as a classifier or as a regressor (in this case, it is also referred to as Support Vector Regression SVR) (Xue & Yan, 2017). SVR exposes excellent performance in solving problems occurring during QSAR analysis, such as small sample size, high-dimension, or highly nonlinear relationships. The SVM version implemented in alvaModel is a least-squares support vector machine with a Radial Basis Function (RBF) kernel (Brereton & Lloyd, 2010; Xue & Yan, 2017). In the least-squares support vector machine, the hyperplane is found by solving a set of linear equations instead of convex quadratic programming problems like for classical SVM (Carracedo-Reboredo et al., 2021; Suykens et al., 2002).
2.6 Models’ validation and comparison
The last step in QSAR model creation is validation of obtained models. The purpose of model validation is to test the model's accuracy, stability, and predictive ability. Two approaches to the model’s evaluation were used. Cross-validation was employed as an internal validation using exhaustive leave-one-out (LOO) and non-exhaustive 5-fold cross-validation to assess how well-developed models described the relationships within the calibration data. The external validation test set, which includes molecules not used in the selection of variables and model construction, was used. Models were evaluated using statistical outputs as follows: coefficient of determination of calibration (R2TRAIN), coefficient of determination of cross-validation LOO (Q2LOO), coefficient of determination of 5-fold cross-validation (Q25-FOLD), coefficient of determination of prediction (R2TEST), root mean square error of calibration (RMSETRAIN), root mean square error of prediction (RMSETEST), mean absolute error of calibration (MAETRAIN), mean absolute error of prediction (MAETEST).
Furthermore, verification of model robustness was examined by the Y-randomization test with a 100-response permutation (Eriksson et al., 2003; Tropsha et al., 2003). With the purpose of compare the results of the permutation tests, the cR2p parameter calculated according to (Ojha & Roy, 2011) was used. We also determine an Applicability Domain (AD) for the best model. The AD is a theoretical region in the chemical space surrounding both the model descriptors and modelled response. It is calculated based on molecules from a training set. The developed model can confidently predict a new molecule if the new compound lies in the AD of the QSAR model (Gramatica, 2007; Jaworska et al., 2005). The AD was investigated using William’s plot, which shows the distribution of standardized residuals against the leverage.
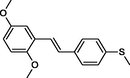
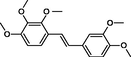
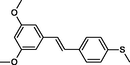
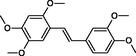
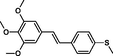
Additionally, tool called Prediction Reliability Indicator (K. Roy et al., 2018) was used to evaluate the quality of predictions for a true external set without experimental values. Twenty-eight compounds were used as a true external set (18 methoxy derivatives and ten derivatives with at least one methylthio group, Fig. 1).
- Molecules used in evaluation quality of prediction.
Based on the composite scores the quality of prediction for each molecule can be categorised as “Good” (composite score = 3), “Moderate” (composite score = 2) and “Bad or Unreliable” (composite score = 1) (Hao et al., 2020; F. Li et al., 2022; Sun et al., 2021). Optimal weighting coefficients for each rule (1) mean absolute error of leave-one-out predictions for 10 most close training compounds for each query molecule; (2) applicability domain in terms of similarity based on the standardization approach; (3) proximity of the predicted value of the query compound to the mean training response) were applied (K. Roy et al., 2018).
We decided to use the chemometric method, cluster analysis (CA), to compare and evaluate obtained models (STATISTICA version 13.3, TIBCO Software Inc., Palo Alto, CA, USA) (STATISTICA, 2021). We add, for the data set consisting of all calculated models (180 models) with their validation parameters, one “ideal” model (called reference model). Furthermore, the ratio of R2TEST to R2TRAIN, MAETRAIN to MAETEST, and RMSETRAIN to RMSETEST were calculated and used as complementary variables.
3 Results and discussion
3.1 Calculation of QSAR models
In the presented study, we build QSAR models using four modeling methods (MLR, PLS, KNN, SVR). The geometry of molecules was optimized by three different techniques (B3LYP, AM1, PM6). Five methods of data pre-processing (non-pre-processing, centering, variance scaling, standardizing, range scaling) and three types of variable reduction (exclusion descriptors with standard deviation less than 0.0001, exclusion variables with the percentage of constant values greater than 95 %, V-WSP) were applied. A genetic algorithm was used as a variable selection method in each case. As a result of the performed calculations, 180 QSAR models were obtained and characterized by various statistical, internal, and external validation parameters. Details on how to achieve this goal are described in the Material and Methods section.
3.1.1 Geometry optimization
Building QSAR models requires calculating molecular descriptors, which are ‘‘formal mathematical representations of a molecule’’ (Cronin, 2010). Optimization of the structure’s geometry (finding the stationary points on the potential energy surface of the molecule) is necessary for computing 3D and 4D molecular descriptors (obtained from the three-dimensional molecular structure). In computational chemistry, three primary methods are used for calculating molecular properties and structures. The ab initio method and density functional theory (DFT) are based only on theoretical assumptions. Ab initio methods attempt to solve the electronic Schrödinger equation given the positions of the nuclei and the number of electrons to yield helpful information such as electron densities, energies, and other properties of the system (Friesner, 2005). The second class of theoretical approaches is DFT, which uses different functionals. Dozen years ago, the most commonly used in QSAR studies was the hybrid functional B3LYP (Becke 3 term with Lee, Yang, Parr exchange). The third group, semi-empirical methods (e.g., AM1, PM3, PM5, PM6, RM1), take into account not only quantum mechanics theory. They also used parameters fitted to empirical data, especially molecular energies and geometries. The main benefit of semi-empirical techniques is the short time of calculations. However, they are considered less accurate. In the 1980 s, the semi-empirical method AM1 (Austin Model 1) was introduced as a modification of MNDO (Modified Neglect of Diatomic Overlap), thus solving its greatest weakness, in particular failure to produce hydrogen bonds, without any increase in computing time. In the next several years, improvements were made to the method of parameter optimization (PM3, PM5, PM6) for a better quality of the obtained results (Guo et al., 2021). In the present work, the structures’ geometry optimization was conducted at the at the B3LYP/cc-pVDZ level of theory, and semi-empirical methods: AM1 and PM6. The best QSAR model was obtained based on data set composed of compounds optimized by AM1 technique. There was no clear trend as to which optimization method affects better QSAR results. Received findings indicate that semi-empirical techniques (faster and less expensive regarding CPU time) can be successfully employed for geometry optimization in QSAR studies for trans-stilbene. These findings of the current study are consistent with those of Vendrame et al. (Vendrame et al., 2004) and Camilo et al. (Camilo et al., 2012), who found that PM6 method does not provide any real improvement over AM1 in the case of stilbene-like molecules.
3.1.2 Descriptors’ calculation and variables’ reduction and selection
In the present study, almost 6000 descriptors were computed for each optimised structure. This set includes 0 to 3-dimensional descriptors, structure-based properties like HOMO and LUMO orbital energies, and global reactivity descriptors based on them calculated.
A large number of variables and the associated presence of redundancy, multicollinearity, random noise, and chance correlation are common problems when dealing with multivariate regression. It is worth noting that calculating the best model was preceded by reducing variables using the V-WSP method (Ballabio et al., 2014). The principle of its unsupervised technique is to eliminate correlated variables based on the assumed correlation threshold after choosing initial variables and then replace the initial variables with the remaining variables and rerun the V-WSP algorithm until there are no variables to select (M. Li et al., 2021). In the present study, this algorithm decreased the number of independent variables by over 85 %. It can be helpful in combination with supervised selection (in this case, genetic algorithm), which can suffer from highly correlated data and chance correlation, thus giving overfitted results (Hawkins, 2004).
The response values (Y values) were transformed into a negative logarithmic scale. The range of Y values after transformation is 3.138 log units. For developing a QSAR model, the range of a Y response not less than 3–4 log units is considered suitable (K. Roy et al., 2016).
3.2 Selection of best predictive QSAR model
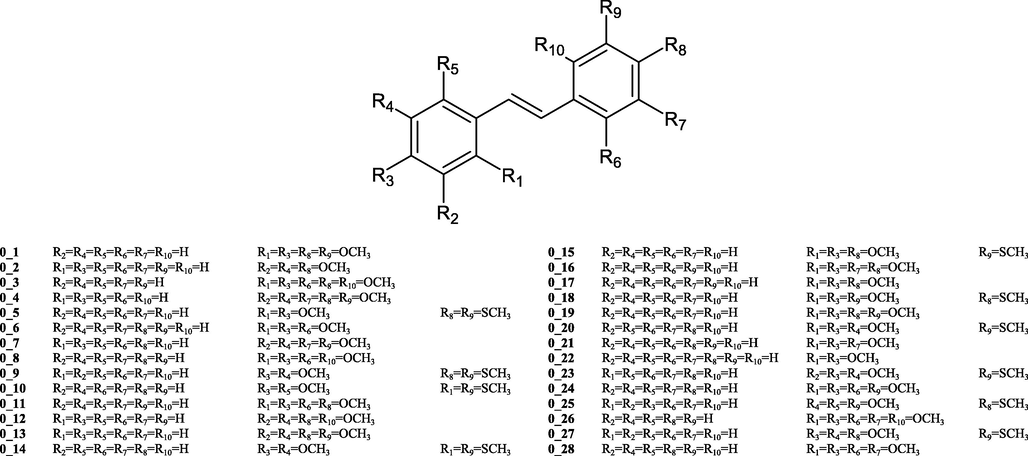
Cluster analysis (CA) is a chemometric method used in QSAR analysis mainly for data exploration – data mining (Kadam & Roy, 2006; Pirhadi et al., 2015) or splitting into training and test set (Das et al., 2016; Halder and Dias Soeiro Cordeiro, 2021; Leonard & Roy, 2006; J. Roy et al., 2019). The principle of this analysis is to cluster the most similar objects into groups. This property was applied to the comparative evaluation of the received models. The data set, consisting of the QSAR models’ and validation parameters, was subjected to cluster analysis. The “reference model” with ideal validation parameters was also added. As a clustering method, Ward’s minimum variance algorithm was used. The Euclidean distance was taken as the measure of distance. The result of CA is the dendrogram presented in Fig. 2, which allowed us to identify-one the most similar to the reference QSAR model.
- Hierarchical dendrogram for the studied regression models and reference model.
The red ellipse in Fig. 2 indicates the cluster formed by the reference model and one of the 180 built models. It proves that the indicated model has the best validation parameters.
Many validation parameters are known. Each has pros and cons, and there is no single parameter for comparing many of the QSAR models. It is especially cumbersome because more and more computer software is available, both dedicated to QSAR analysis and toolboxes dedicated to statistical programs. The consequence is that the creation of predictive models is easier and faster. It seems that the use of cluster analysis will allow a vast number of models to be fast and effective compared in the space of many validation parameters.
3.3 Analysis and interpretation of selected QSAR model
The best model was obtained using multiple linear regression. The value of pIC50 (transformed to a negative logarithmic scale, the inhibitory effect of trans-stilbene derivatives on CYP1B1) could be predicted from a linear equation:
Fig. 3 shows the plot of predicted pIC50 against the experimental results.
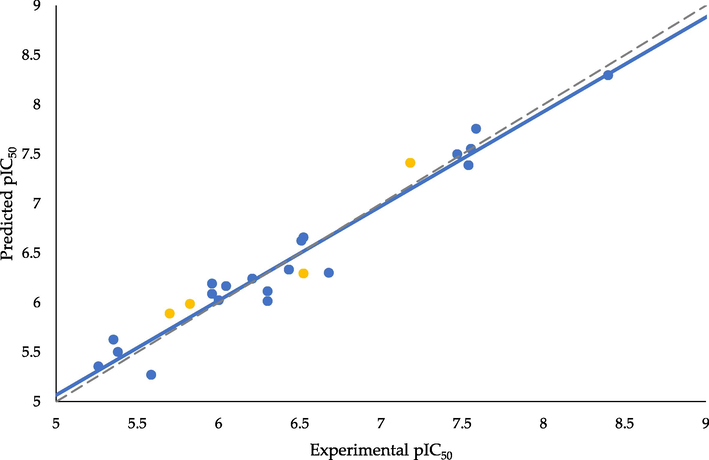
- Scatter plot of predicted versus experimentally measured pIC50 of the inhibitory effect of trans-stilbene derivatives on CYP1B1 (training set – blue points, test set – yellow points, ––– regression line, – – – ideal regression line).
3.3.1 Validation parameters and errors measures
A good prediction model should be described by: high R2 values, low root mean square errors, and mean absolute errors. The coefficient of determination R2TRAIN measures how well the model can mathematically reproduce the endpoint data of the training set (fitting ability). In the publication cited almost 4000 times, Golbraikh and Tropsha (Golbraikh & Tropsha, 2002) considered the value of R2TRAIN greater than 0.6 as the criterion of model acceptability. More restrictive judgment has been presented in (Chirico & Gramatica, 2011), where 0.7 was taken as the benchmark. Cross-validation techniques assess the internal prediction power and the robustness of the model (stability of QSAR model parameters). However, the internal validation parameters do not indicate the predictive power of the model (Gramatica, 2013). According to mentioned papers (Chirico & Gramatica, 2011; Golbraikh & Tropsha, 2002), the coefficient of determination obtained by leave-one-out cross-validation Q2LOO should take a value greater than or equal to 0.5 and 0.6, respectively. It is worth noting that the value of Q2LOO increases only when valuable predictors are added to the model but decrease otherwise (in contrast to R2TRAIN) (Gramatica, 2013).
The validation parameters of the best model are summarized in Table 2. The model is characterized by R2TRAIN = 0.954 and Q2LOO = 0.898, which satisfies the requirements mentioned above. What is more, a comparison of R2TRAIN and Q2LOO can help evaluate possible overfitting. This phenomenon occurs whenever the obtained model reflects well the relationship between the explanatory variables and the predicted value but, at the same time, may not be valid for the prediction of the dependent variable for new molecules. According to the literature, the overfitting is observed if R2TRAIN is higher than 25 % compared to the Q2LOO value, and thus, the difference between R2TRAIN and Q2LOO should not exceed the value of 0.3 (Leach, 2001; Zapadka et al., 2019). The difference between R2TRAIN and Q2LOO is 0.056, which is slightly over 6 % of R2TRAIN value. The values of external validation parameters confirmed the external predictive ability of the model. The coefficient of determination of test set (R2TEST) is greater than 0.70 (R2TEST = 0.880). As mentioned before, the value of R2TRAIN increases with each additional variable being added to the equation, regardless of its significance. The parameter that allows penalizing additional predictors is R2TRAIN, ADJ. This criterion does not automatically increase when new variables are added to the model. The slight difference between R2TRAIN and the adjusted R2TRAIN (0.954 vs 0.937) testifies the inclusion of significant variables in the model. Directions on other, more restrictive criteria in relation to the determination coefficient and its modification can be found in the previously cited paper (Golbraikh & Tropsha, 2002). They are listed in Table 2 ((R2-R02)/R2; (R2-R’02)/R2; k; k’). They are all in accordance with the so-called Golbraikh and Tropsha acceptable model criteria.
| Training set | R2TRAIN | 0.954 |
|---|---|---|
| R2TRAIN, ADJ. | 0.937 | |
| RMSETRAIN | 0.180 | |
| MAETRAIN | 0.150 | |
| Cross-validation | Q2LOO | 0.898 |
| Q25-FOLD | 0.899 | |
| Test set | R2TEST | 0.880 |
| RMSETEST | 0.206 | |
| MAETEST | 0.204 | |
| (R2-R02)/R2 | 0.002 | |
| (R2-R’02)/R2 | 0.003 | |
| k | 0.985 | |
| k’ | 1.014 | |
| Y-randomization | cR2p | 0.825 |
The root mean square errors (RMSETRAIN and RMSETEST) summarize the overall error of the model: they are calculated as the root square of the sum of squared errors in calculation divided by the total number of chemicals. The more similar are these compared values, the more the model has general applicability (Gramatica, 2013). Another measure of error is mean absolute error (MAE). It is calculated for both the training and test sets (MAETRAIN and MAETEST). However, there is no clear opinion on which of these measures is better. When both metrics are calculated, the RMSE is, by definition, never lower than the MAE (Chai & Draxler, 2014). Both measures have been determined for the described model (Table 2). Their values indicate good predictive properties of the model.
Moreover, similar metrics values for the training and test sets prove the lack of overfitting (likewise, the comparative analysis of R2TRAIN and Q2LOO). According to (K. Roy et al., 2016), the quality of the established model based on MAE-based criteria is described as good. However, it should be added that it is fully justified to use this criterion for a test set of at least ten compounds.
The evaluation of the predictive reliability was carried out with the use of Prediction Reliability Indicator software (K. Roy et al., 2018). For this purpose, the geometry of the molecules was optimized and the molecular descriptors for the compounds presented in Fig. 1 were calculated. As a result of the analysis 27 “Good” and one “Moderate” (this derivative was found to be outside AD) predictions were obtained.
3.3.2 Y-randomization
The response permutation test, called Y-randomization, was also carried out to check whether the experimental pIC50 values were correlated with the molecular descriptors by chance. The Y-randomisation technique proceeds with scrambling of the Y-column data, keeping the descriptor matrix (X-matrix) unchanged. Model randomisation, Y-scrambling is performed with the descriptors present in the developed QSAR model. Each time, the models are built using the scrambled data, and the values of coefficients of determination are calculated (Mitra et al., 2010). Based on coefficients of determination of the randomised models (R2r) and coefficient of determination of the original QSAR model (R2) according to Todeschini (Todeschini, 2010), corrected R2p (cR2p) can be calculated. A value above 0.5 might indicate that the model is not obtained by chance (K. Roy et al., 2015). On the basis of the conducted response permutation test performed for obtained model (cR2p = 0.825), it can be assumed that experimental pIC50 values are correlated with the molecular descriptors not coincidentally.
3.3.3 Applicability domain
In constructing a QSAR model, molecules' applicability domain (AD) plays a crucial role in estimating the uncertainty in predicting a particular compound based on its similarity to the compounds used to build the model. It can be described as the structural, physicochemical, or biological space information based on which the training set of the model is developed, and the model is applicable to make predictions for new compounds within the specific domain (K. Roy et al., 2015). For example, the AD could be visualized in the Williams plot of the standardized residuals of the estimated pIC50 values versus the corresponding leverage (h) values given by the molecular descriptors (Fig. 4). The vertical dashed line represents a leverage cut-off (warning leverage) h*= 3·p/n, where p is the number of model parameters, n denotes the number of compounds in the training set, and horizontal dashed lines represent the upper and lower boundaries for applicability domain (±3 of standardized residuals) (Jaworska et al., 2005). Predictions with an h value higher than h* may not be reliable because the results can be regarded as a consequence of extrapolation instead of an exact fit. As shown in Fig. 4, all molecules had h values lower than h*.
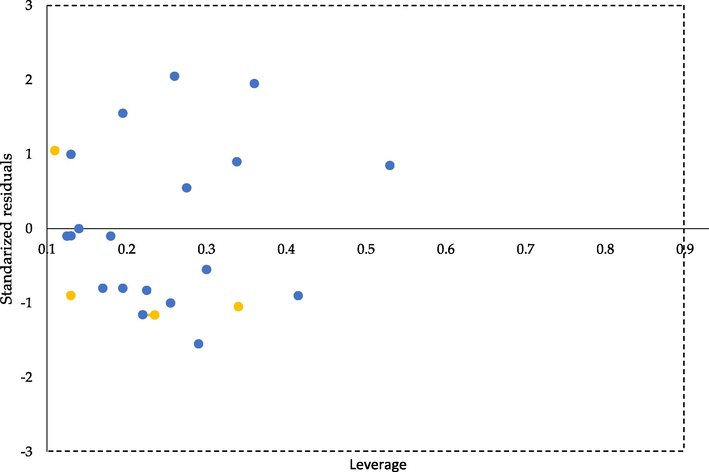
- Williams plot of applicability domain of the QSAR model for inhibition of CYP1B1(training set – blue points, test set – yellow points).
Similarly, the standardized residuals of all the molecules appeared to reside between the bordering lines. It can be concluded that the model can give reliable predictions for chemicals similar to those used to develop the model. Moreover, it proves the accurate splitting into the training and test sets.
3.3.4 Detailed interpretation of molecular descriptors
The meaning and appurtenance to the class of the selected molecular features are outlined in Table 3.
| Name | Description | Class |
|---|---|---|
| RDF035m | Radial Distribution Function – 035 / weighted by mass | RDF descriptors |
| Eig04_AEA(bo) | Eigenvalue n. 4 from augmented edge adjacency mat. weighted by bond order | Edge adjacency indices |
| Mor10m | Signal 10 / weighted by mass | 3D-MoRSE descriptors |
| RDF070s | Radial Distribution Function – 070 / weighted by I-state | RDF descriptors |
| MaxDD | Max detour distance | Topological indices |
The first step in the interpretation of the selected molecular features was to plot a radar chart for the five most (compounds: 2, 11–14) and five least (compounds: 8, 9, 16, 18, 24) active compounds (Fig. 5).
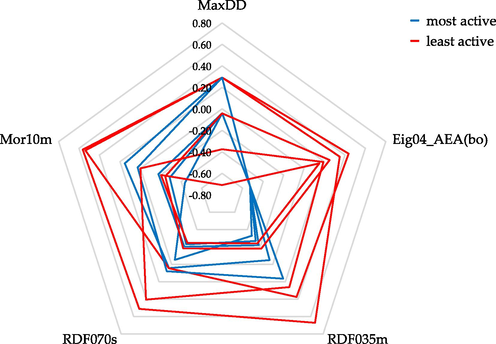
- Radar chart representing the distribution of selected descriptors (range scaled values) for five the most (compounds: 2, 11–14) and five least (compounds: 8, 9, 16, 18, 24) active trans-stilbene derivatives.
The graph shows that the Eig04_AEA(bo) is the best variable, differentiating compounds with the highest and the lowest ability to inhibit the CYP1B1 enzyme. This descriptor, together with MaxDD, contains information about the two-dimensional structure of compounds. The determination of the Eig04_AEA(bo) value is based on a binary, zero-one matrix (adjacency matrix) containing information about the presence of a neighborhood between bonds (called edges), except for the bonds of hydrogen atoms. In the next step, the data matrix is weighted by bond orders. On its basis, the principal components are computed, and the percentage of variance explained by the fourth principal component is the descriptor's value. It means that, in this group of trans-stilbene derivatives, values are not influenced by the type of substituent (methoxy or methylthio) but only by their location. As the Eig04_AEA (bo) value increases, the activity of the compound decreases (negative coefficient in the regression equation). The compound with the lowest Eig04_AEA(bo) value is compound 3. One of the phenyl rings of this molecule does not have any substituent. All four subsequent compounds (compounds: 1, 11–13) are substituted in the second position of one phenyl ring (R1) and fourth position of the second phenyl ring (R2) by methoxy and/or methylthio group (regardless of the type of substituent, the calculated descriptor value is the same).
The max detour distance (MaxDD) is defined as the length of the longest path between two vertices of a graph (Mercader et al., 2001). In the case of chemical compounds, it is the longest path between atoms (without hydrogens) in a molecule. As many as nine compounds (compounds: 2, 4–10, 14) possess the same, highest value of the MaxDD descriptor. According to the regression model's equation, higher values of MaxDD increase activity. All these compounds have substituents on both phenyl rings, at least three. Only one of them has a methylthio group. The interpretation of the definition indicates that replacing the oxygen atom with a bioisosteric sulphur atom does not affect the descriptor's value. The analysis of the structure of the compounds shows that among the tested trans-stilbene derivatives, the largest distance between atoms is in the compounds where the substituents are in the second position (R1) and the third position (R2) (the longest possible path would be between the compound substituted in the second positions in both phenyl rings, but such molecule does not exist in the data set).
In this study, the relationship between the structure and activity of trans-stilbene derivatives is expressed by the selected MLR model with five descriptors. The contributions of individual atomic pairs (depending on the molecule size from about 500 to over 1000 atomic pairs) to the 3D descriptors’ values were calculated using our standalone software (online version under construction).
For interpretation of 3D descriptors, three parts were highlighted in the structure of the compounds. One part is the compound's core (E-1,2-diphenylethylene, blue colour in Table 1). Fragment 1 consists of phenyl ring substituents (R1, orange colour in Table 1). The substituents may be placed at different positions of the phenyl ring. Fragment 2 consists of the substituents of the second phenyl ring (R2, grey colour in Table 1). The fourth position is always occupied and position third is possible.
The radial distribution function (RDF) descriptors are based on the distance distribution of the molecules. RDF is independent of the size of a molecule and unambiguously describes the three-dimensional arrangement of the atoms, and is invariant against the rotation and translation of a molecule (Zapadka et al., 2019). These features make RDF an ideal candidate as a structure-related descriptor in investigating the relationship between structure and relevant properties in drug design (Novak et al., 2020). Using different weights, including atom types, electronegativity, atom mass, or van der Waals radii, RDF can be adjusted to select among those atoms of a molecule, which give important contributions to descriptor value in deriving QSAR model (Fedorowicz et al., 2004). RDF035m descriptor contributes the most significantly to pIC50 variation as indicated by the highest standardized coefficients value. An increase in this descriptor's value was reflected by a decrease in the pIC50 value (lower ability to inhibit CYP1B1). RDF035m is calculated with the spherical volume restricted to 3.5 Å and an atomic mass as the weights.
Fig. 6 shows the theoretical distribution of the RDF035m function, considering the contribution of various atomic pairs to the final descriptor value. The experimentally determined contributions of atomic pairs constituting 80 % of the final value for the compound with the highest (compound 8) and the lowest (compound 13) RDF035m value are plotted on the graph. It can be observed that the pairs between carbons, carbon, and oxygen, carbon and hydrogen, and oxygen and hydrogen atoms dominate the final RDF035m value.
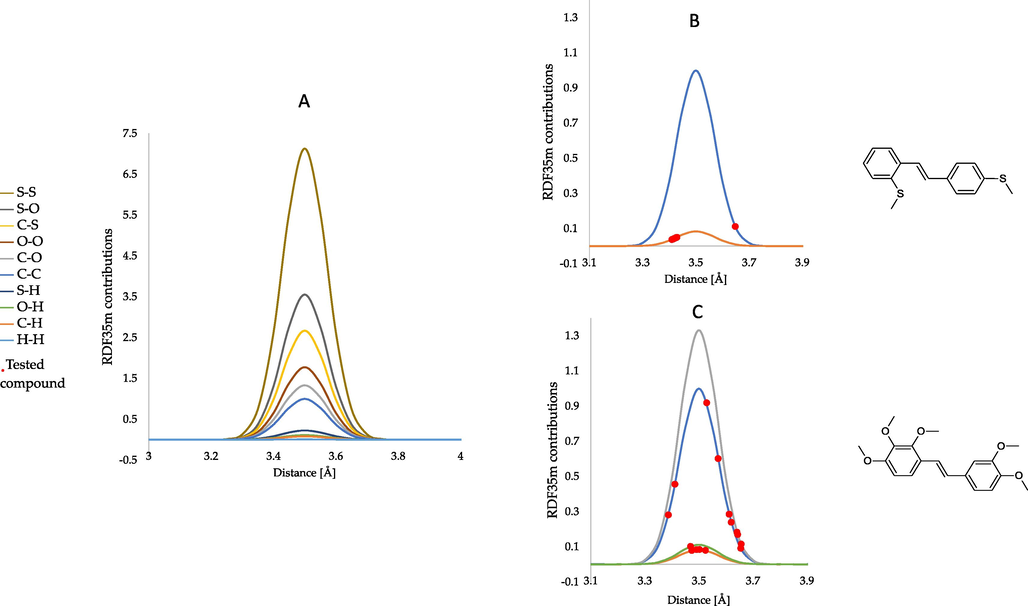
- The theoretical radial distribution function of RDF035m descriptor corresponding to different atomic pairs (A). RDF035m descriptor corresponding to different atomic pairs of compound 13 (B). RDF035m descriptor corresponding to different atomic pairs of compound 8 (C).
The contribution of atomic pairs, depending on the molecule fragment, in the RDF035m value for the five compounds with the highest (compounds: 8, 9, 24, 6, 17) descriptor value and the five compounds with the lowest (compounds: 13, 11, 15, 16, 12) is shown in Fig. 7.
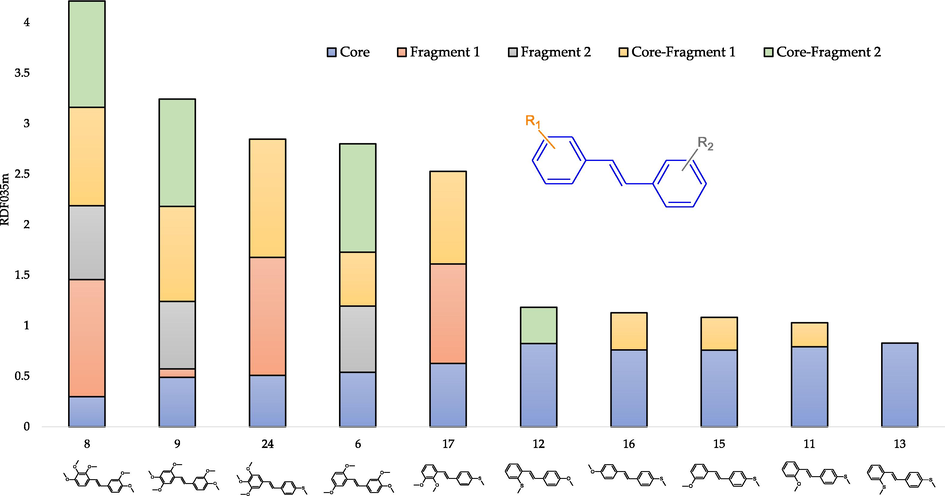
- The contribution of atomic pairs in the final RDF035m value depending on the molecule's fragment for selected trans-stilbene derivatives.
As shown in Fig. 7, for compounds with a low RDF035m value, the atomic pairs only in the molecule core account for a nearly total value of the descriptor. On the other hand, atomic pairs within Fragment 1 and 2 and between core and Fragment 1 and 2 are responsible for the high value of the descriptor. When a methylthio substituent is present, no atomic pairs from this fragment and between this fragment and core significantly contribute to RDF035m, which results in a small descriptor value (despite the use of atomic mass as a weight). The explanation for this observation may be the change (elongation) of the bond length in the presence of sulphur, which results in a smaller possible number of interatomic interactions in the range of 3.5 Å. In addition, compounds with a high RDF035m value have, in Fragment 1, three methoxy groups often adjacent to each other. Such observation is consistent with that the carbon–oxygen pairs are responsible for the high value of the descriptor because the more methoxy substituents, the greater the possibility of potential interatomic interactions between C and O. Despite their potentially greater importance due to the weighting scheme, no significant contribution to the RDF035m value of carbon–sulphur atomic pairs.
In the case of RDF070s, due to the intrinsic state weighting method (Kier & Hall, 1990), it is difficult to plot the theoretical distribution of the function, taking into account the division into different atomic pairs. Depending on the number and type of bonds, the atoms of the same element have different weights, which results in a significant multiplication of the number of possible types of interatomic pairs. An increase in this descriptor's value reflected an increase in the pIC50 value.
Fig. 8 shows that for interactions inside Fragment 1 or 2, the presence of at least two substituents is necessary. Moreover, they cannot be bonded to adjacent carbon atoms of the diphenyl skeleton. The explanation for this observation may be that RDF070s are calculated with the spherical volume of 7 Å, which is greater than the distance between two adjacent methoxy groups. The analysis of Fig. 8 revealed a decreasing contribution to the final descriptor value of interactions between core and Fragment 1 as the value of the RDF070s decreases. This can be related to the declining number of substituents. Fig. 8 also confirms that substituents cannot be in spatial proximity until significant interactions between the substituent atoms occur. That is more, Fig. 8 indicates a lack of interactions in Fragment 2, where there are at most two substituents but in adjacent positions.
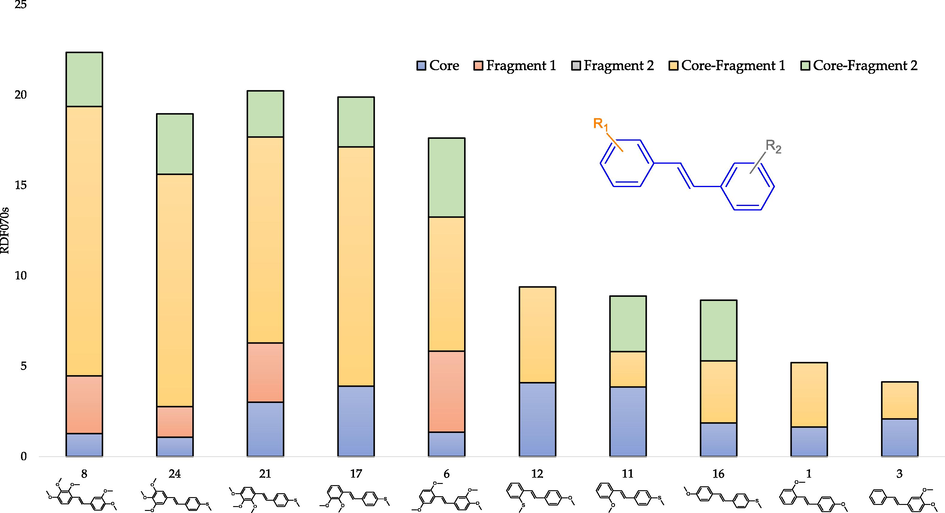
- The contribution of atomic pairs in the final RDF070s value depending on the molecule's fragment for selected trans-stilbene derivatives.
Another 3D molecular descriptor included in the regression model belongs to the class 3D-MoRSE. These descriptors are denoted as ‘Mor’ accompanied by a number which refers to the scattering parameter and a letter indicating the type of weighting. Particularly, Mor10m stands for a descriptor with the scattering parameter equal to 10 Å and weighted by atomic mass. Weighting by atomic mass practically eliminates hydrogen atoms' role while significantly increasing the effect of atoms such as phosphorus, sulphur, and chlorine on the values 3D-MoRSE descriptors (Devinyak et al., 2014). As with the RDF descriptors, the final value of 3D-MoRSE is the sum of contributions from each atomic pair of the molecule. However, as shown in Fig. 9, in the case of 3D-MoRSE, the atomic pairs can have both positive and negative contributions.
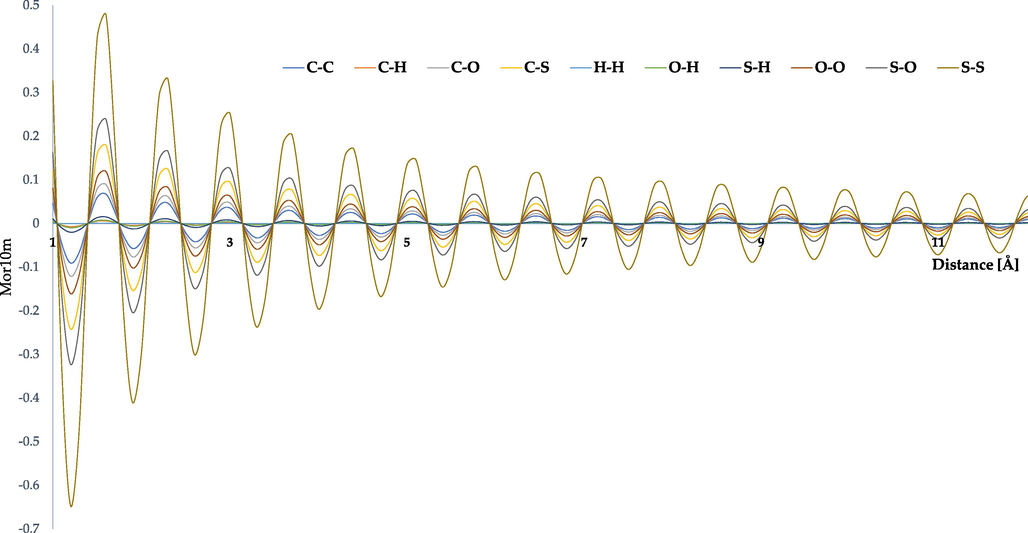
- Theoretical radial basis function of Mor10m descriptor corresponding to different atomic pairs.
For interpretation, the significant interatomic interactions with both the positive and the negative input should be identified. The coefficient for Mor10m in the regression equation indicates that the pIC50 value is directly related to this descriptor. As before, the five compounds with the highest (compounds: 8, 9, 6, 5, 4) and five with the lowest (compounds: 13, 11, 19, 18, 23) Mor10m values were subjected to detailed analysis (Fig. 10).
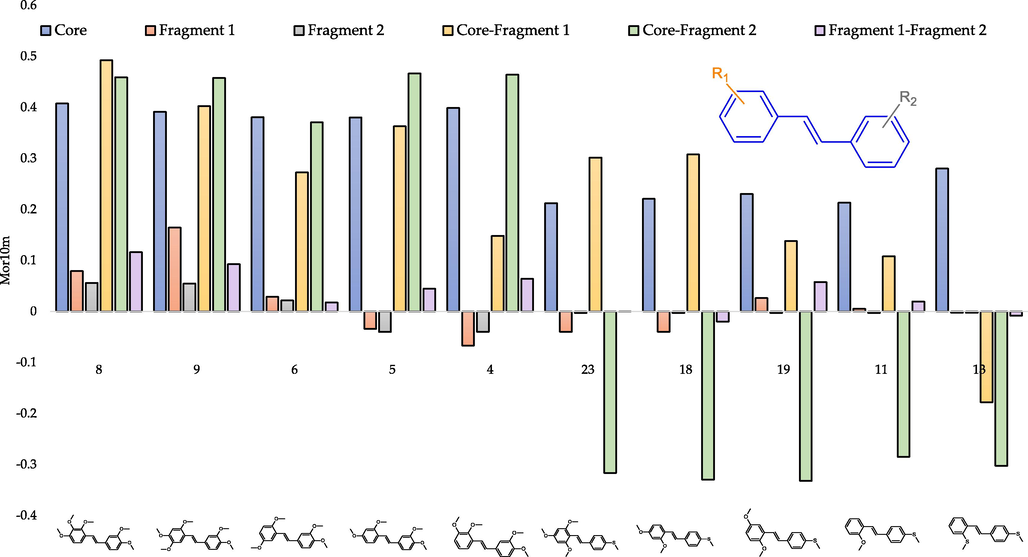
- Contribution of the atomic pairs in final Mor10m value depending on the fragment of the molecule for selected trans-stilbene derivatives.
The graph shows that interactions within the molecule core have a much more significant impact on the final Mor10m value than on RDF. On the other hand, in the case of interatomic interactions in Fragments 1 and 2, a substantial decrease in the impact of Mor10m values can be seen. Another observation is that when there is a methylthio substituent in Fragment 1 or 2, the summarized interatomic interactions between this part and the molecule core negatively contribute to the descriptor value. Fig. 11, in conjunction with Fig. 10, allows for a broad interpretation of the studied variable.

- Contribution of the interatomic interactions in the final Mor10m value depending on different trans-stilbene derivatives.
Among the interactions that significantly affect the descriptor value are those between carbon atoms, C and O, C and S, and to a lesser extent, C and H. The summarized contribution of carbon-hydrogen interactions for all ten analysed compounds is negative and very similar. As the value of Mor10m decreases, the sum of interactions between carbon and oxygen atoms decreases. Notwithstanding, in the case of interatomic interactions between C and S, an increasing influence on the final value of the descriptor is noticeable, while this contribution is negative. The described observations can be related to the number of methoxy and methylthio groups in the studied compounds. As the final value of the descriptor decreases, the number of methoxy groups decreases, while the trans-stilbene derivative with the lowest Mor10m value has two methylthio substituents (the most among the compounds tested) and no methoxy groups.
3.3.5 Brief interpretation of molecular descriptors
A critical component of QSAR analysis is determining the influence of various structural elements on the final value of molecular descriptors. The present investigation facilitates the indication of those structural elements that affect the value of the analysed descriptors. However, the ability to inhibit the enzyme CYP1B1 (and all other modelled properties) by trans-stilbene derivatives is predicted from the combination of all independent variables included in the equation, together with their regression coefficients. Moreover, analysing the influence of a single descriptor on biological activity may lead to contradictory conclusions, especially without considering the regression coefficients presented in the equation. Finally, we found a range of different responses for the various compounds when examining the individual components of the regression equation (the scaled descriptor values multiplied by regression coefficients) (Fig. 12).
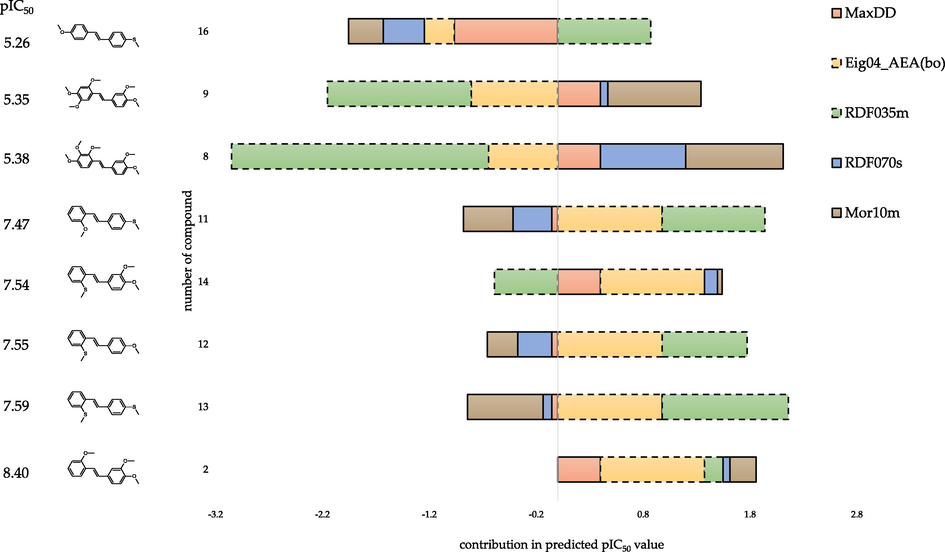
- Contribution of individual components of the regression equation on the predicted biological activity for the five most active (compounds: 2, 11–14) and three least active (compounds: 8, 9, 16) compounds. The hatched bar border indicates descriptors with a negative regression coefficient.
Analysing topological descriptors is relatively easy to conclude as they carry less information about compounds' structure than 3D descriptors. Both 2D descriptors (Eig04_AEA(bo) and MaxDD) indicated the presence of substitutions at the second (R1) and fourth positions (R2) as favourable for the activity. Conclusions regarding the beneficial effect of the substituent presence at the 2-position of the stilbene skeleton are consistent with the observations presented in (Kim et al., 2002). A large contribution to the predicted pIC50 value of Eig04_AEA(bo) (with its regression coefficient) was observed for highly active compounds. The same arrangement of substituents is also present in two of the three least active compounds. However, this equation component negatively affects the predicted biological activity and does not significantly influence the result. It is worth noting that in the absence of a substitution at the second position (R1) (compound 16), the value of the Eig04_AEA(bo) descriptor with its regression coefficient has a minor effect on predicted activity. Furthermore, the MaxDD descriptor's minor effect on the predicted activity for seven of the eight compounds analysed (Fig. 12). Conversely, compound 16 has a large negative contribution of MaxDD descriptor to the predicted activity, and the most significant influence of this equation component on the result is observed for this compound.
As demonstrated previously, the analysis of the RDF035m descriptor indicated a positive effect of the methylthio group and a negative effect of a large number of methoxy groups on the inhibition of CYP1B1. Compounds without a methylthio group and with a large number (five) of methoxy groups (compounds 8 and 9) have low activity, resulting from a significant negative effect of the RDF035m value and its regression coefficient (Fig. 12). On the other hand, the presence of two methylthio substituents and the absence of the methoxy group (compound 13) increases activity mainly due to the positive effect of this component of the equation. Furthermore, the most active compound (compound 2) does not have a methylthio group but the average number (three) of methoxy substituents. For this molecule, the influence of the equation component (-3.585 · RDF035m) on the predicted activity is the smallest among the analysed trans-stilbene derivatives.
For most of the compounds presented in Fig. 12, the effect of RDF070s, along with its regression coefficient on predicted activity, is relatively small. However, the contribution of the respective equation component (1.559 · RDF070s) in predicted pIC50 for moderate active compounds is higher.
The analysis of the influence of various structural elements on the value of the Mor10m descriptor indicated that a large number of methoxy groups improved the modelled activity, while the presence of methylthio groups did not. Considering the influence of the descriptors themselves and the regression coefficients allows for assessing the real impact of individual components of the regression equation on the predicted activity (Fig. 12). For compound 13 (with two methylthio substituents), a large negative effect of the Mor10m equation component on the predicted pIC50 value is observed. In the presence of one methylthio and one methoxy group (compounds 12, 11, 16), this effect is also negative, but to a lesser degree. Mor10m has a slight positive effect on the modelled activity of compound 14, which contains one methylthio and two methoxy substituents. On the other hand, when only methoxy groups are present (compounds: 2, 8, 9), the predicted ability to inhibit CYP1B1 Mor10m along with the regression coefficient has a positive proportional influence, depending on the number of these groups.
This study has developed several regression models to predict the inhibition activity against CYP1B1 of a series of trans-stilbene containing methoxy and/or methylthio substituents in various positions. With the use of cluster analysis, only one QSAR model was selected and further analyzed. The extended study of the chosen model proves its good predictive power and evidence of the usefulness of cluster analysis in the comparative evaluation of many computed QSAR models. It is worth noting that the established regression model fulfils all five OECD principles. The study shows that the inhibitory activity against CYP1B1 of the methyl and/or methylthio trans-stilbene derivatives can be predicted by RDF035m, Mor10m Eig04AEA(bo), RDF070s, MaxDD descriptors. The analysis indicated the presence of substitution at the second (R1) position as favourable for the predicted activity. Moreover, the beneficial effect of exchanging oxygen into the bioisosteric sulphur atom in the substituent has been demonstrated. However, the total number of substituents should not exceed three.
Author contributions
Conceptualization and methodology N.P.-S.; software, M.Z. and N.P-S.; validation, N.P-S.; investigation, N.P-S. and M.Z.; writing—original draft preparation, N.P-S.; writing—review and editing, N.P-S., and B.K.; visualization, N.P-S.; supervision, B.K. All authors have read and agreed to the published version of the manuscript.
Funding
This work was supported by the Nicolaus Copernicus University, Grant No WF514.
Acknowledgements
This research was supported in part by PL-Grid Infrastructure (http://www.plgrid.pl/en)
References
- alvaDesc (software for molecular descriptors calculation) (2.0.10). (2021). alvaScience. https://www.alvascience.com/. (accessed April 2022).
- A novel variable reduction method adapted from space-filling designs. Chemometrics and Intelligent Laboratory Systems. 2014;136:147-154.
- [CrossRef] [Google Scholar]
- Support Vector Machines for classification and regression. Analyst. 2010;135(2):230-267.
- [CrossRef] [Google Scholar]
- Comparative parametric method 6 (PM6) and Recife model 1 (RM1) study of trans-stilbene. Mol. Simul.. 2012;38(1):1-7.
- [CrossRef] [Google Scholar]
- A review on machine learning approaches and trends in drug discovery. Comput. Struct. Biotechnol. J.. 2021;19:4538-4558.
- [CrossRef] [Google Scholar]
- Partial least squares regression as an alternative to current regression methods used in ecology. Oikos. 2009;118(5):681-690.
- [CrossRef] [Google Scholar]
- Root mean square error (RMSE) or mean absolute error (MAE)? -Arguments against avoiding RMSE in the literature. Geosci. Model Dev.. 2014;7(3):1247-1250.
- [CrossRef] [Google Scholar]
- Azobenzene and stilbene: a computational study. J. Mol. Struct. (Thoechem). 2003;624(1–3):191-200.
- [CrossRef] [Google Scholar]
- Real External Predictivity of QSAR Models: How To Evaluate It? Comparison of Different Validation Criteria and Proposal of Using the Concordance Correlation Coefficient. J. Chem. Inf. Model.. 2011;51(9):2320-2335.
- [CrossRef] [Google Scholar]
- trans-Stilbenoids: Potent and selective inhibitors for human cytochrome P450 1B1. MedChemComm. 2011;2(5):402-405.
- [CrossRef] [Google Scholar]
- alvaModel (software to model QSAR data) (2.0.0). (2021). alvaScience. https://www.alvascience.com/. (accessed April 2022).
- Cronin, M. T. D. (2010). Quantitative Structure–Activity Relationships (QSARs) – Applications and Methodology. In J. and C. M. T. Puzyn Tomasz and Leszczynski (Ed.), Recent Advances in QSAR Studies: Methods and Applications (pp. 3–11). Springer Netherlands. https://doi.org/10.1007/978-1-4020-9783-6_1.
- Development of predictive QSAR models for Vibrio fischeri toxicity of ionic liquids and their true external and experimental validation tests. Toxicol. Res.. 2016;5(5):1388-1399.
- [CrossRef] [Google Scholar]
- SIMPLS: An alternative approach to partial least squares regression. Chemometrics and Intelligent Laboratory Systems. 1993;18(3):251-263.
- [CrossRef] [Google Scholar]
- Methods for reliability and uncertainty assessment and for applicability evaluations of classification- and regression-based QSARs. Environ. Health Perspect.. 2003;111(10):1361-1375.
- [CrossRef] [Google Scholar]
- Fedorowicz, A., Zheng, L., Singh, H., & Demchuk, E. (2004). QSAR Study of Skin Sensitization Using Local Lymph Node Assay Data. International Journal of Molecular Sciences 2004, Vol. 5, Pages 56-66, 5(2), 56–66. https://doi.org/10.3390/I5020056.
- Ab initio quantum chemistry: Methodology and applications. Proc. Natl. Acad. Sci.. 2005;102(19):6648-6653.
- [CrossRef] [Google Scholar]
- Frisch, M. J., Trucks, G. W., Schlegel, H. B., Scuseria, G. E., Robb, M. A., Cheeseman, J. R., Scamani, G., Barone, V., Mennucci, B., & Petersson, G. A. (2009). Gaussian 09. Gaussian, Inc.
- QSAR Modeling for Quinoxaline Derivatives using Genetic Algorithm and Simulated Annealing Based Feature Selection. Curr. Med. Chem.. 2009;16(30):4032-4048.
- [CrossRef] [Google Scholar]
- Principles of QSAR models validation: internal and external. QSAR Comb. Sci.. 2007;26(5):694-701.
- [CrossRef] [Google Scholar]
- On the Development and Validation of QSAR Models. Methods Mol. Biol.. 2013;930:499-526.
- [CrossRef] [Google Scholar]
- A review of quantum chemical methods for treating energetic molecules. Energetic Materials Frontiers. 2021;2(4):292-305.
- [CrossRef] [Google Scholar]
- Halder, A. K., & Dias Soeiro Cordeiro, M. N. (2021). QSAR-Co-X: an open source toolkit for multitarget QSAR modelling. Journal of Cheminformatics, 13(1), 1–18. https://doi.org/10.1186/S13321-021-00508-0/TABLES/8.
- In vivo toxicity of nitroaromatic compounds to rats: QSTR modelling and interspecies toxicity relationship with mouse. J. Hazard. Mater.. 2020;399:122981
- [CrossRef] [Google Scholar]
- The Problem of Overfitting. J. Chem. Inf. Comput. Sci.. 2004;44(1):1-12.
- [CrossRef] [Google Scholar]
- Discovery and characterization of novel CYP1B1 inhibitors based on heterocyclic chalcones: Overcoming cisplatin resistance in CYP1B1-overexpressing lines. Eur. J. Med. Chem.. 2017;129:159-174.
- [CrossRef] [Google Scholar]
- Huang, T., Sun, G., Zhao, L., Zhang, N., Zhong, R., & Peng, Y. (2021). Quantitative Structure-Activity Relationship (QSAR) Studies on the Toxic Effects of Nitroaromatic Compounds (NACs): A Systematic Review. International Journal of Molecular Sciences 2021, Vol. 22, Page 8557, 22(16), 8557. https://doi.org/10.3390/IJMS22168557.
- QSAR Applicability Domain Estimation by Projection of the Training Set in Descriptor Space: A Review. Altern. Lab. Anim.. 2005;33(5):445-459.
- [CrossRef] [Google Scholar]
- Cluster analysis and two-dimensional quantitative structure-activity relationship (2D-QSAR) of Pseudomonas aeruginosa deacetylase LpxC inhibitors. Bioorg. Med. Chem. Lett.. 2006;16(19):5136-5143.
- [CrossRef] [Google Scholar]
- Pharmacokinetics, oral bioavailability, and metabolic profile of resveratrol and its dimethylether analog, pterostilbene, in rats. Cancer Chemother. Pharmacol.. 2011;68(3):593-601.
- [CrossRef] [Google Scholar]
- An Electrotopological-State Index for Atoms in Molecules. Pharm. Res.. 1990;7(8):801-807.
- [CrossRef] [Google Scholar]
- Design, synthesis, and discovery of novel trans-stilbene analogues as potent and selective human cytochrome P450 1B1 inhibitors. J. Med. Chem.. 2002;45(1):160-164.
- [CrossRef] [Google Scholar]
- Molecular Modelling: Principles and Applications. Prentice Hall; 2001.
- On Selection of Training and Test Sets for the Development of Predictive QSAR models. QSAR Comb. Sci.. 2006;25(3):235-251.
- [CrossRef] [Google Scholar]
- Potential role of CYP1B1 in the development and treatment of metabolic diseases. Pharmacol. Ther.. 2017;178:18-30.
- [CrossRef] [Google Scholar]
- Systematic QSAR and iQCCR modelling of fused/non-fused aromatic hydrocarbons (FNFAHs) carcinogenicity to rodents: reducing unnecessary chemical synthesis and animal testing. Green Chem.. 2022;24(13):5304-5319.
- [CrossRef] [Google Scholar]
- Hybrid variable selection strategy coupled with random forest (RF) for quantitative analysis of methanol in methanol-gasoline via Raman spectroscopy. Spectrochim. Acta Part A Mol. Biomol. Spectrosc.. 2021;251:119430
- [CrossRef] [Google Scholar]
- alvaDesc: A Tool to Calculate and Analyze Molecular Descriptors and Fingerprints. Methods in Pharmacology and Toxicology. 2020;801–820
- [CrossRef] [Google Scholar]
- Matlab (No. R2018a). (2018). The Matworks, Inc. https://www.mathworks.com/help/matlab/release-notes-R2018a.html. (accessed November 2021).
- Mercader, A., Castro, E. A., & Toropov, A. A. (2001). Maximum Topological Distances Based Indices as Molecular Descriptors for QSPR. 4. Modeling the Enthalpy of Formation of Hydrocarbons from Elements. International Journal of Molecular Sciences 2001, Vol. 2, Pages 121-132, 2(2), 121–132. https://doi.org/10.3390/I2020121.
- New Perspectives of CYP1B1 Inhibitors in the Light of Molecular Studies. Processes. 2021;9(5)
- [CrossRef] [Google Scholar]
- Design, synthesis and evaluation of the inhibitory selectivity of novel trans-resveratrol analogues on human recombinant CYP1A1, CYP1A2 and CYP1B1. Bioorg. Med. Chem.. 2012;20(17):5117-5126.
- [CrossRef] [Google Scholar]
- 3,4,2′-Trimethoxy-trans-stilbene – a potent CYP1B1 inhibitor. Med. Chem. Commun.. 2014;5(4):496-501.
- [CrossRef] [Google Scholar]
- Exploring quantitative structure–activity relationship studies of antioxidant phenolic compounds obtained from traditional Chinese medicinal plants. Mol. Simul.. 2010;36(13):1067-1079.
- [CrossRef] [Google Scholar]
- Novak, J., Grishina, M. A., Potemkin, V. A., & Gasteiger, J. (2020). Performance of radial distribution function-based descriptors in the chemoinformatic studies of HIV-1 protease. Https://Doi.Org/10.4155/Fmc-2019-0241, 12(4), 299–309. https://doi.org/10.4155/FMC-2019-0241.
- OECD. (2014). Guidance Document on the Validation of (Quantitative) Structure-Activity Relationship [(Q)SAR] Models.
- Comparative QSARs for antimalarial endochins: Importance of descriptor-thinning and noise reduction prior to feature selection. Chemometrics and Intelligent Laboratory Systems. 2011;109(2):146-161.
- [CrossRef] [Google Scholar]
- More Than Resveratrol: New Insights into Stilbene-Based Compounds. Biomolecules. 2020;10(8)
- [CrossRef] [Google Scholar]
- Multivariate statistical analysis methods in QSAR. RSC Adv.. 2015;5(127):104635-104665.
- [CrossRef] [Google Scholar]
- November 14). Quantitative Structure-Property Relationship for the Retention Index of Volatile and Semi-Volatile Compounds of Coffee. In: Proceedings of the 25th International Electronic Conference on Synthetic Organic Chemistry. 2021.
- [Google Scholar]
- Be aware of error measures. Further studies on validation of predictive QSAR models. Chemometrics and Intelligent Laboratory Systems. 2016;152:18-33.
- [CrossRef] [Google Scholar]
- PLS_Toolbox (7.5). (2020). Eigenvector Research, Inc. https://eigenvector.com/software/pls-toolbox/. (accessed February 2022).
- PLGrid Infrastructure. (2009). PL-Grid Consortium. https://www.plgrid.pl/en. (accessed January 2022).
- Roy, K., Ambure, P., & Kar, S. (2018). How Precise Are Our Quantitative Structure−Activity Relationship Derived Predictions for New Query Chemicals? https://doi.org/10.1021/acsomega.8b01647.
- Predictive quantitative structure–property relationship (QSPR) modeling for adsorption of organic pollutants by carbon nanotubes (CNTs) Environ. Sci.: Nano. 2019;6(1):224-247.
- [CrossRef] [Google Scholar]
- Chapter 7 - Validation of QSAR Models. In: Roy K., Kar S., Das R.N., eds. Understanding the Basics of QSAR for Applications in Pharmaceutical Sciences and Risk Assessment. Academic Press; 2015. p. :231-289.
- [Google Scholar]
- Chemometric QSAR modeling of acute oral toxicity of Polycyclic Aromatic Hydrocarbons (PAHs) to rat using simple 2D descriptors and interspecies toxicity modeling with mouse. Ecotoxicol. Environ. Saf.. 2021;222:112525
- [CrossRef] [Google Scholar]
- The Importance of Being Earnest: Validation is the Absolute Essential for Successful Application and Interpretation of QSPR Models. QSAR Comb. Sci.. 2003;22(1):69-77.
- [CrossRef] [Google Scholar]
- Biological actions and molecular effects of resveratrol, pterostilbene, and 3′-hydroxypterostilbene. J. Food Drug Anal.. 2017;25(1):134-147.
- [CrossRef] [Google Scholar]
- Centering, scaling, and transformations: improving the biological information content of metabolomics data. BMC Genomics. 2006;7(1):142.
- [CrossRef] [Google Scholar]
- Comparative parametric method 5 (PM5) study of trans-stilbene. Journal of Molecular Structure: THEOCHEM. 2004;686(1):103-108.
- [CrossRef] [Google Scholar]
- Synthesis, biological evaluation and docking studies of trans-stilbene methylthio derivatives as cytochromes P450 family 1 inhibitors. Chem. Biol. Drug Des.. 2017;90(6):1226-1236.
- [CrossRef] [Google Scholar]
- Do we need different machine learning algorithms for QSAR modeling? A comprehensive assessment of 16 machine learning algorithms on 14 QSAR data sets. Briefings Bioinf.. 2021;22(4)
- [CrossRef] [Google Scholar]
- A new kernel function of support vector regression combined with probability distribution and its application in chemometrics and the QSAR modeling. Chemometrics and Intelligent Laboratory Systems. 2017;167:96-101.
- [CrossRef] [Google Scholar]
- An application of QSRR approach and multiple linear regression method for lipophilicity assessment of flavonoids. J. Pharm. Biomed. Anal.. 2019;164:681-689.
- [CrossRef] [Google Scholar]
- STATISTICA (13.3). (2021). TIBCO Software Inc. https://www.tibco.com/resources/product-download/tibco-statistica-trial-download-for-windows. (accessed April 2022)


