Microstructural changes in limestone after treatment with Na2CO3 solution: Implications for eliminating H2S in tunnels
⁎Corresponding author at: No. 66 Xuefu Avenue, Nan’an District, Chongqing 400074, China. zhangxuefu400074@126.com (Xuefu Zhang)
-
Received: ,
Accepted: ,
This article was originally published by Elsevier and was migrated to Scientific Scholar after the change of Publisher.
Peer review under responsibility of King Saud University.
Abstract
Research on the effects of the pre-injected lye on the microstructure of the surrounding rock is indispensable for H2S treatment during tunnel construction. In this study, limestone samples from the Huangjiagou tunnel in Guizhou Province in southwest China were pre-adsorbed with 500 ppm of H2S and soaked in 1 %, 3 %, and 5 % Na2CO3 solution for 12, 24, and 36 h. The changes in the pore structure and mineral composition, and the secondary precipitates formed on the rock surface after Na2CO3 solution injection were studied by using N2 gas adsorption, X-ray diffraction, and field-emission scanning electron microscopy. It is clearly shown that the average volumes of micro- and meso-pores in the samples after treated decreased by 66.17 % and 16.63 %, respectively, of the original values. This resulted in a significant decrease in the specific surface area and total pore volume. The average pore width increased linearly with increasing Na2CO3 concentration or soaking time, whereas the curve for the relationship with the specific surface area was parabolic, with a minimum at a concentration of approximately 3 % and soaking time of 24 h. Clay (e.g., illite and kaolinite) and feldspar are more easily dissolved than other minerals, and the released metal ions easily form carbonate secondary precipitates with CO32− ions. The mass dissolution of clay minerals and the blocking effect of secondary precipitation decreases the amounts of micropores and mesopores of diameter less than 10 nm, therefore the proportion of macropores increases and the fractal dimensions are simpler. The results of this study will be useful in strategy development and parameter selection for Na2CO3 solution injection for H2S treatment in tunnel engineering.
Keywords
Tunnel engineering
H2S treatment
Na2CO3 solution
Pore structure
Mineral change
1 Introduction
Because of the limitations imposed by the terrain or ecological concerns, the available ground space in many cases cannot meet the needs of traffic development. The numbers and scales of road, railway, and other tunnel projects are therefore increasing rapidly (Esen Sze et al., 2016, Hong 2017, Lueprasert et al., 2017). Complex geological conditions and the limitations of on-site investigation mean that the excavation and construction of long tunnels often encounter adverse geological hazards such as high ground stress, large deformation of soft rock, water inrush, and gas inrush (Mo et al., 2020, Zeng et al., 2022, Zhou et al., 2022). In the survey, design, and construction of coal-penetrating tunnels in most infrastructure fields, research mainly focuses on gas control in tunnels to prevent coal and gas outbursts and accidental explosions (Nyman and Ingason 2012, Yan et al., 2020). Research on the treatment of H2S, which is often associated with gas in underground engineering, has not been extensive.
Depending on its concentration, H2S exposure can cause various health-related issues because of its toxicity to the skin, and respiratory, alimentary, and neurological systems (Mirmehrabi et al., 2011, Zhu and Zhang 2019, Maie et al., 2022). In recent years, mass deaths and injuries have occurred because of the high concentrations of H2S in some tunnels (Morsali and Rezaei 2017). For example, the concentration of H2S in the air in the Hongdoushan highway tunnel in Yunnan Province, China is as high as 430 ppm.
Generally, H2S is generated by the decomposition of organic sulfides in oil and gas reservoirs under the action of heat. It is also generated from sulfates in the reservoir water in the high-temperature reduction of hydrocarbons and organic matter (Liu et al., 2012, Xie et al., 2021). The H2S in rock formations may have been present for many years, and a dynamic balance of adsorption and dissociation in rock pores and rock mass fissures is maintained (Yao et al., 2017, Deng et al., 2019). Some H2S is also dissolved in groundwater (Khave 2014). When a tunnel excavation is disturbed, H2S may gush out sharply (Tan et al., 2020). H2S is generated from the oil–gas-bearing strata and overflows into the tunnel. Reliance on grouting alone to seal the construction joints of the tunnel lining and structural cracks in the surrounding rock cannot fundamentally control the sudden emission of H2S.
At present, there is no H2S safety control standard in China’s highway tunnel industry. The maximum allowable concentration of H2S in the air stated in the current Chinese “Coal Mine Safety Regulations” is 6.6 ppm (10 mg/m3). The treatment of H2S is rarely mentioned in relevant regulations and the literature. The prevention and treatment of H2S in gas in tunnels are often based on the treatment methods used in coal mines. Lye spraying, ventilation strengthening or changing the ventilation mode, and enhancing individual protection are used to treat low concentrations of H2S in coal seam roadways (Taherian 2015, Hebda-Sobkowicz et al., 2019, Ahmadi and Hekmat 2021). H2S emissions from tunnels can also affect poultry health in the surrounding communities (Wang et al., 2016). When the H2S content is too high, the effectiveness of these measures is significantly reduced.
Some researchers have pointed out that the most effective way to remove H2S is to pre-inject lye into the rock formation. The lye and H2S react chemically inside the rock before excavation, and this fixes the sulfur. In on-site applications, the lye pre-injection technique is easy to operate and can dilute the H2S in the rock surrounding the tunnel and in construction wastewater. This is a highly maneuverable and priority measure. However, there are few reports of research on the treatment of H2S in tunnels by lye pre-injection. In particular, selection of the lye concentration and duration of the treatment for controlling H2S are mainly based on engineering experience.
Limestone is the most common type of rock encountered during tunnel excavation and construction (Toševski et al., 2011, Lee and Moon 2020, Martínez-Ibáñez et al., 2021). After injection of lye into the rock, the pH change and solute addition lead to changes in the primary mineral contents. The products of physical and chemical reactions may precipitate and cause blockage or dissolution of cracks and pores, and this affects the permeability and mechanical properties of the surrounding rock (Lyu et al., 2016, Zhang et al., 2017, Cheng et al., 2020). It is therefore important to study the microstructural changes in limestone treated by alkali injection.
In this study, limestone samples taken from the tunnel workface through the coal seam were used for H2S adsorption pretreatment and Na2CO3 lye soaking experiments. The microstructural changes in the samples, such as changes in the pore volumes, specific surface areas (SSAs), fractal dimensions, and mineral compositions, were investigated by low-temperature N2 adsorption, X-ray diffraction (XRD), and field-emission scanning electron microscopy (FE-SEM). The results provide a theoretical basis and practical information for H2S treatment with Na2CO3 lye in underground engineering.
2 Materials and methods
2.1 Sample collection, preparation, and analytical equipment
H2S is often associated with gas from coal or oil layers, therefore limestone samples from the coal-penetrating area of the Huangjiagou tunnel in Zunyi City in Guizhou Province, China were used in the experiments [Fig. 1(a)–(d)]. The tunnel crosses the mountain ridge, the terrain is undulating, and the slope vegetation is developed. The elevation of the site area is 426.7 ∼ 1103.0 m, and the relative height difference is 676.3 m. The ground elevation of the axis passage section is between 530.5 ∼ 1097.2 m, with a relative height difference of 566.7 m. The geomorphological type is a dissolution-erosion type with a low and medium mountainous landform. Translated with https://www.DeepL.com/Translator (free version)The sampling locations are shown in Fig. 1. Macroscopically uniform and well-integrated rock blocks from the same area were used to avoid heterogeneous effects. The limestone samples were crushed, ground, and evenly mixed for testing by various methods [Fig. 1(e)]. Samples of 20–60 mesh (250–840 µm) were used for pore structure analysis, and samples of 200 mesh (75 µm) were used to determine the mineral composition.
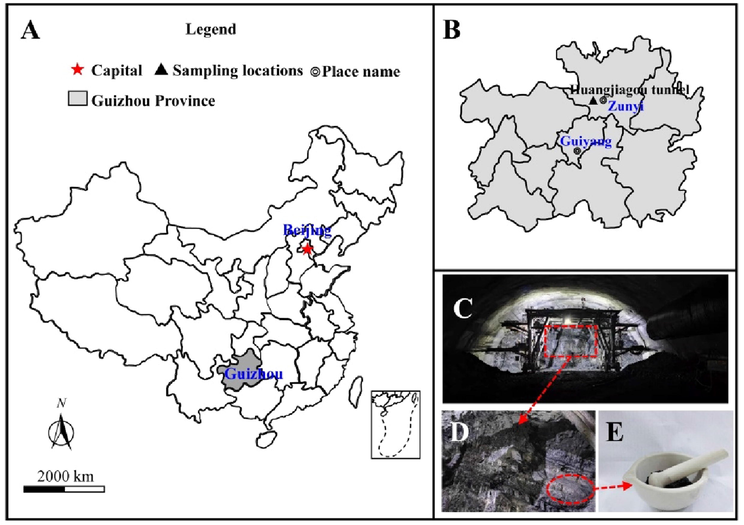
- Sampling locations at Huangjiagou tunnel work face.
The sample pore structures were investigated with a Micromeritics surface area and porosimetry system (ASAP2020, Micromeritics Instruments Corporation, Norcross, GA, USA). The mineral compositions of the limestone samples were determined with a Bruker X-ray diffractometer (Bruker D8 Advance, Billerica, MA, USA). XRD was performed with Cu Kα radiation at 40 mA and 40 kV. FE-SEM (JSM-7800F, JEOL ltd., Showa, Tokyo, Japan) was used to examine the effects of secondary precipitation on the pore structure of the rock surface (Cheng et al., 2020).
2.2 Experimental design
The samples were subjected to H2S adsorption experiments in advance to better study the microstructural changes in limestone fully adsorbed with H2S after treatment with Na2CO3 lye. Samples were prepared on the basis of the highest concentrations involved in H2S events in existing tunnels. The prepared samples were put in a sealed gas tank under a pressure of 5 MPa, and a mixed gas consisting of H2S and N2 was introduced after evacuation. The H2S was diluted to a concentration of 500 ppm with N2. The pressure in the sample tank and experimental temperature were 1 MPa and 26℃ around, respectively. The Na2CO3 lye immersion test maintained for 7 days to enable full adsorption of H2S by the sample before the reaction with Na2CO3 lye (Ge et al., 2019).
Na2CO3 solutions of three concentrations were used in this study, i.e., 1 %, 3 % and 5 %. Considering the impact on an actual project schedule, the Na2CO3 lye treatment times were set at 12, 24, and 36 h. The experimental details are shown in Table 1. After H2S gas adsorption was complete, the samples were immediately removed from the tank and put into the prepared Na2CO3 lye. A diagram of the experimental device is shown in Fig. 2 (Cheng et al., 2021).
| Sample Number | Na2CO3 Concentration/% | Treatment Time/(hour) |
|---|---|---|
| #1 (Untreated) | – | – |
| #2 | 1 % | 12 h |
| #3 | 1 % | 24 h |
| #4 | 1 % | 36 h |
| #5 | 3 % | 12 h |
| #6 | 3 % | 24 h |
| #7 | 3 % | 36 h |
| #8 | 5 % | 12 h |
| #9 | 5 % | 24 h |
| #10 | 5 % | 36 h |
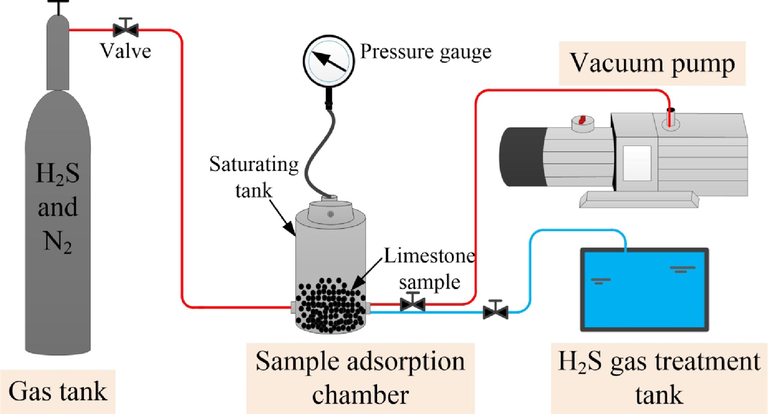
- Diagram of experimental device.
3 Results and discussion
3.1 Low-temperature N2 adsorption analysis of limestone samples
Fig. 3 shows the adsorption–desorption isotherms of the samples before and after treatment with Na2CO3 lye of different concentrations for various times. According to the International Union of Pure and Applied Chemistry classification, the low-temperature N2 adsorption isotherms of all the samples are type IV, with type H2 (b) hysteresis loops, which indicates that the pores are mainly plate pores and slit pores. The pore type of the samples basically did not change after Na2CO3 lye treatment, but the maximum adsorption capacity decreased significantly; this indicates that adsorption capacity on the samples was weaker. The differences among the maximum adsorption capacities of the treated samples were not significant; the largest decrease was for sample #2 (1 %, 12 h), and the smallest decrease was for sample #4 (1 %, 36 h).
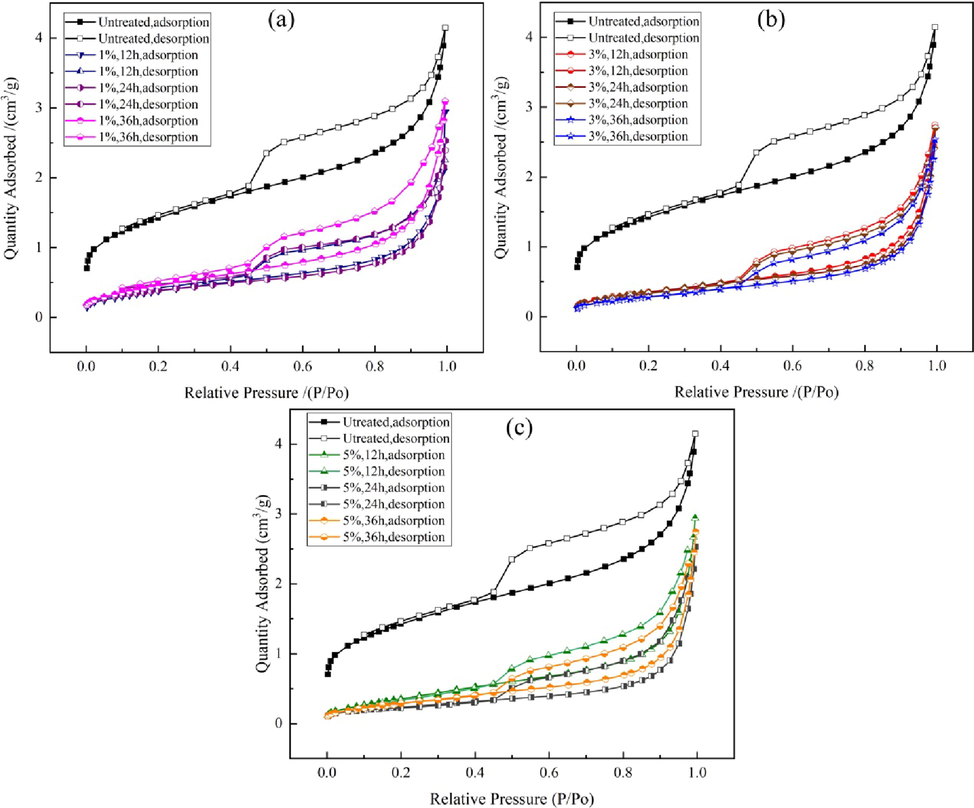
- N2 adsorption–desorption isotherms for limestone samples before and after treatment with Na2CO3 solution.
3.2 Total pore volume (TPV) and pore size distribution (PSD)
There are two main causes of the changes in the pore structures of the pretreated samples after contact with lye. First, the H2S adsorbed or freed in the pore structure of the rock is neutralized via a chemical reaction with the lye. Second, the alkaline environment created by the Na2CO3 lye will react with some of the original minerals in the sample. These reactions will cause dissolution of the inner pore surface of the rock and expansion of the pore throat, or the secondary sediments will fill and block the pores or pore throat. The combined effect changes the SSA, total pore volume (TPV), and pore size distribution (PSD) of the sample, and therefore changes the microstructure of the sample as a whole.
Generally, the complex pore structure and irregular inner surface of a rock determine its adsorption capacity and fluid permeability, which are mainly determined by the TPV, PSD, SSA, and fractal dimensions. In this study, the Barrett–Joyner–Halenda (BJH) and Brunauer–Emmet–Teller (BET) models were used to calculate the SSAs and TPVs of all the samples (Du et al., 2021). Table 2 lists the TPVs, SSAs, and average pore widths (APWs) of the samples before and after treatment with Na2CO3 solution at different concentrations for various times. The TPV of the original limestone was 6.21 × 10⁻³ cm3/g, and the APW was 5.12 nm. The maximum decrease in the TPV was 39.45 %. In contrast, the APW increased, and the maximum increase was 266.32 %.
| Sample number |
Na2CO3 solution treatment state |
BET, SSA,m2/g |
BJH,TPV(0.85–150 nm), ×10-3cm3/g |
APW, nm(4 V/A) |
|---|---|---|---|---|
| #1 | Untreated | 5.01 | 6.21 | 5.12 |
| #2 | 1 %,12 h | 1.35 | 3.76 | 10.36 |
| #3 | 1 %,24 h | 1.36 | 3.83 | 10.87 |
| #4 | 1 %,36 h | 1.62 | 5.19 | 11.78 |
| #5 | 3 %,12 h | 1.22 | 4.52 | 13.92 |
| #6 | 3 %,24 h | 1.25 | 3.98 | 13.44 |
| #7 | 3 %,36 h | 1.00 | 4.19 | 15.62 |
| #8 | 5 %,12 h | 1.29 | 5.01 | 14.15 |
| #9 | 5 %,24 h | 0.83 | 4.07 | 18.77 |
| #10 | 5 %,36 h | 1.02 | 4.09 | 16.60 |
For further analysis of the changes in the pore volumes, the pores were classified into micropores (<2 nm), mesopores (2–50 nm), and macropores (>50 nm), as shown in Fig. 4(a). For the untreated sample, the contributions of micropores, mesopores, and macropores to the TPV were 32.13 %, 52.87 %, and 15.00 %, respectively. This indicates that the sample was dominated by mesopores, and then micropores and finally macropores. However, the numbers of mesopores and micropores, which contributed more to the pore volume, clearly decreased after treatment with Na2CO3 lye under various conditions, and the volumes of micropores and mesopores decreased by 66.17 % and 16.63 %, respectively, on average, which resulted in an average decrease of 30.86 % in the TPV.
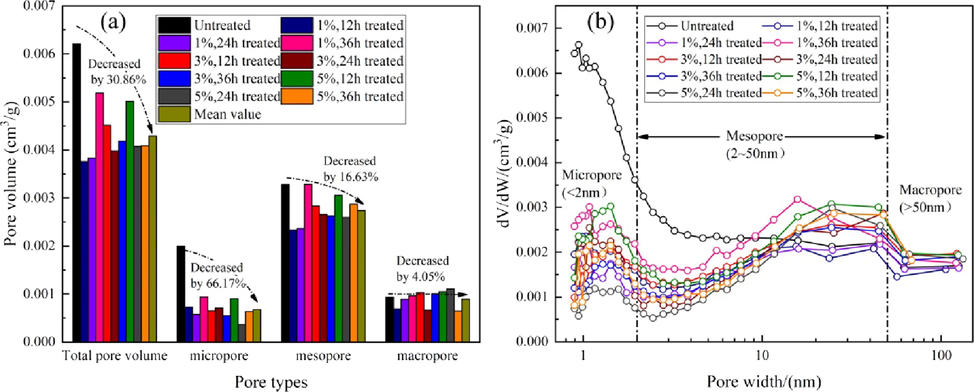
- Changes in different pore type volumes (a) and PSDs (b) under action of Na2CO3 solution.
Fig. 4(b) shows the pore size of the samples before and after Na2CO3 lye treatment is wide, from 0.87 nm to 186.5 nm. The pores in all the samples were smooth and continuous. The aperture at 10 nm is an obvious cut-off point in the overall trend of the sample PSDs. The distribution of micropores and mesopores with d < 10 nm decreased significantly, which indicates that the contributions of these pores to the TPV decreased after Na2CO3 lye treatment. The pore width peak appeared at approximately 1.5 nm. The PSDs of mesopores and macropores with d > 10 nm remained unchanged on the whole. These results indicate that the secondary precipitates formed by physical and chemical reactions are more likely to fill pores or block pore throats smaller than 10 nm, and chemical dissolution in the alkaline environment is relatively weak. For pores or throats bigger than 10 nm, the effect of chemical dissolution by the lye is slightly greater than the blocking effect of secondary precipitates.
3.3 Specific surface area (SSA)
The SSA is an important parameter in determining the adsorption capacity on a rock surface. Fig. 5 shows the decreases in the SSAs of different samples after Na2CO3 solution treatment. The SSA of the original limestone was 5.00 m2/g, and it decreased sharply after treatment. The maximum decrease in the SSA, i.e., 83.35 %, was shown by sample #9 (5 %, 24 h).
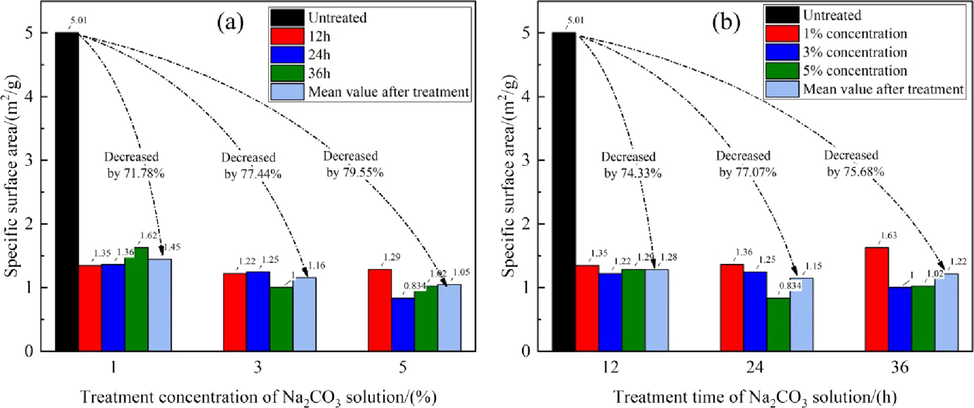
- SSAs before and after treatment with Na2CO3 solution.
Fig. 6 shows the fitting relationships between the sample SSAs and the alkali treatment concentration and time. Relative to the initial SSA of the untreated sample, even at a low lye concentration, i.e., 1 %, the SSA of sample #2 decreased sharply. However, the differences among the SSAs of the samples treated with different concentrations and for different times were not significant. Fig. 6(a) shows that for the same treatment time with Na2CO3 lye, the SSAs of the samples first decreased and then slowly increased with increasing concentration of Na2CO3 lye; the distribution is parabolic with a minimum value at a concentration slightly higher than 3 %. Similarly, for a fixed lye concentration, the SSAs showed a parabolic trend; they first decreased and then increased; the minimum value occurred at 24 h [Fig. 6(b)].
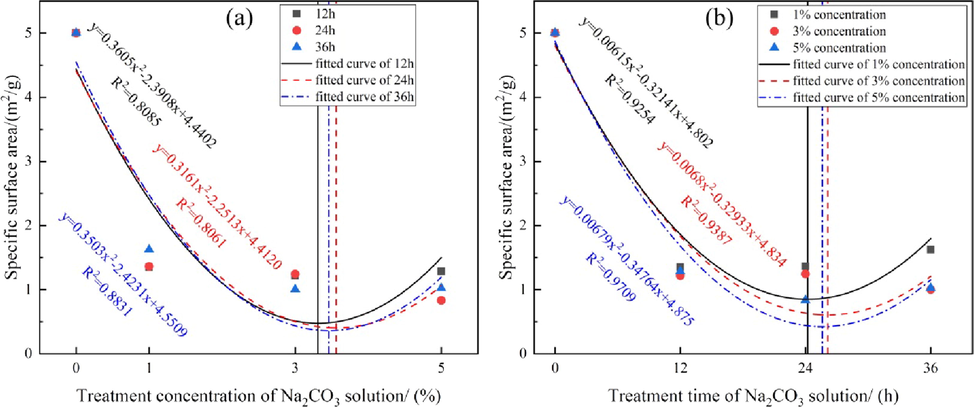
- SSA changes with Na2CO3 (a) treatment concentration and (b) treatment time.
The main reason for the decrease in the SSA in the first part of the parabola is that the volumes of micropores and partial mesopores decrease sharply after the action of lye. Because an acid–base neutralization reaction occurs between adsorbed or free H2S in the limestone pores and the Na2CO3 lye, and the Na2CO3 lye also causes primary mineral chemical dissolution, metal ions are released and easily react with CO32− in the solution to generate secondary mineral precipitates. These attach to the micropore or mesopore surfaces on the rock, which are then deposited and form blockages. These phenomena decrease the number of micropores and mesopores, which contribute more to the SSA than macropores do. In the latter part of the parabola, the SSA increases because the Na2CO3 lye penetrates deeper into the rock sample with increasing concentration or treatment time. The degree of hydrolysis or dissolution of quartz, clay, and other minerals deep in the limestone is enhanced, and a small number of new pores or some channels are formed. These slightly increase the number of pores and lead to a slight increase in the SSA. This indicates that an increase in the concentration or time leads to stronger alkaline dissolution of the rock.
3.4 Fractal dimensions of pore surface and internal structure
The reasons for the overall reduction in the SSA were further investigated by determining the fractal dimensions of the pores (Fig. 7). The Frenkel–Halsey–Hill (FHH) model was used to calculate the fractal dimensions of all the samples (Fu et al., 2017); the results are shown in Table 3. The fractal values at relative pressures (P/P0) <0.45 and>0.45 were used to represent the fractal characteristics of the pore surface and pore internal structure, respectively. The equation for the FHH calculations is (Avnir and Jaroniec 1989, Zhang et al., 2014).
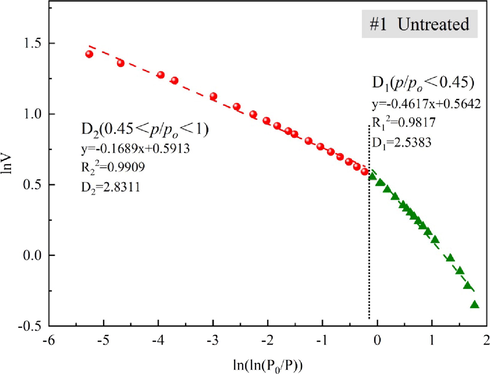
- Schematic diagram of fractal dimension calculation for sample #1.
| Sample number |
Na2CO3 lye treatment state |
Fractal Dimension of Pore Surface D1(p/po < 0.45) |
Fractal Dimension of Pore Structure D2(p/po > 0.45) |
||||
|---|---|---|---|---|---|---|---|
| D1 | Fitted Equation (1) | R2 | D2 | Fitted Equation (1) | R2 | ||
| #1 | Untreated | 2.54 | y = -0.4617x + 0.5642 | 0.9817 | 2.83 | y = -0.1689x + 0.5913 | 0.9909 |
| #2 | 1 %,12 h | 2.35 | y = -0.6446x-0.6862 | 0.9949 | 2.68 | y = -0.3183x-0.6601 | 0.9926 |
| #3 | 1 %,24 h | 2.46 | y = -0.6446x-0.6862 | 0.9949 | 2.67 | y = -0.3183x-0.6601 | 0.9926 |
| #4 | 1 %,36 h | 2.33 | y = -0.6737x-0.4895 | 0.9967 | 2.67 | y = -0.3266x-0.4388 | 0.9885 |
| #5 | 3 %,12 h | 2.38 | y = -0.6174x-0.7811 | 0.9963 | 2.65 | y = -0.3543x-0.7172 | 0.9930 |
| #6 | 3 %,24 h | 2.34 | y = -0.6594x-0.7526 | 0.9950 | 2.66 | y = -0.3418x-0.7672 | 0.9902 |
| #7 | 3 %,36 h | 2.35 | y = -0.6492x-0.9648 | 0.9972 | 2.62 | y = -0.3789x + 0.9250 | 0.9927 |
| #8 | 5 %,12 h | 2.21 | y = -0.7926x-0.6730 | 0.9979 | 2.65 | y = -0.3491x-0.6285 | 0.9933 |
| #9 | 5 %,24 h | 2.42 | y = -0.5769x-1.1760 | 0.9949 | 2.57 | y = -0.4266x-1.2172 | 0.9898 |
| #10 | 5 %,36 h | 2.29 | y = -0.7106x-0.9281 | 0.9979 | 2.63 | y = -0.3710x-0.8974 | 0.9886 |
In physical terms, the larger the fractional dimension is, the more complex the three-dimensional space of the rock inner pore is. For the fractal calculation results in Table 3, a decrease in D1 means that the pore surface of the sample after treatment with Na2CO3 solution was smoother than that of the untreated sample, which is conducive to desorption of H2S gas from the pore surface and absorption by the lye. A decrease in D2 means that the communication channels between different pores became simpler and more regular, and a gas or liquid could flow better and react adequately. The fractal dimensions of the pore surface and pore internal structure decreased considerably after lye treatment, which is in agreement with the declining trend of the SSAs.
In addition, we found a good positive linear correlation between the APW and the Na2CO3 concentration and treatment time, as shown in Fig. 8. The APW increased with increasing concentration and treatment time. This is similar to the results reported for the American Fenton Hill Enhanced Geothermal System Project. Under laboratory conditions, Na2CO3 solution was used to chemically stimulate a reservoir; the rock solubility increased with increasing stimulation time and concentration of the Na2CO3 solution (Norbeck et al., 2018). These results again show that an increase in the APW makes the channels in the rock more regular and ordered.
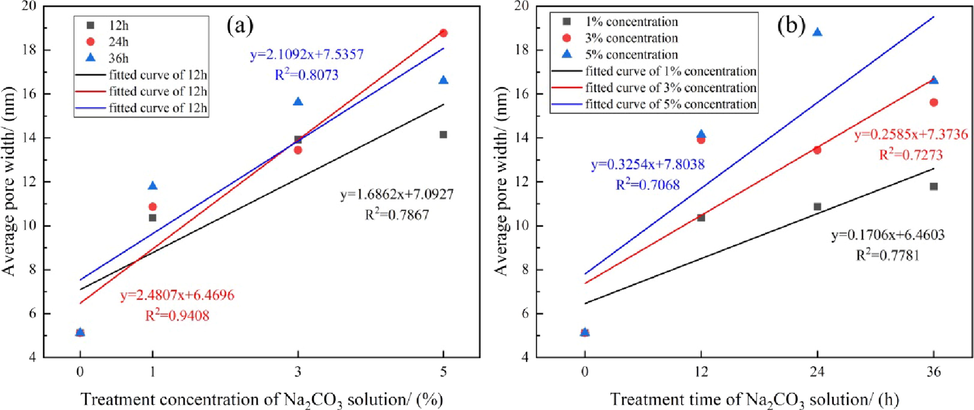
- Variations in APW with Na2CO3 (a) treatment concentration and (b) treatment time.
4 Mechanism of interaction between Na2CO3 solution and rock
4.1 Physicochemical reactions and mineral composition changes in samples
The dissolution ratio of H2S in water is 2.6:1, therefore it can be considered that all H2S is dissolved in the lye within the infiltration range. In the presence of Na2CO3 solution, H2S gas first undergoes an acid–base neutralization reaction. H2S reacts with Na2CO3 to produce sodium bicarbonate and sodium hydride, which are soluble in water. The solution contains extensive sodium carbonate hydrolyzed, which creates an environment with a lot of hydroxide ions. This thus inhibits the reversible reaction of the bicarbonate and hydrogen sulfide generating gases to form carbonic acid and hydrogen sulfide. Therefore, H2S molecules are fixed as NaHS and be eliminated basically with Na2CO3 solution. The specific reactions are shown in equations (2)–(4).
The Na2CO3 lye not only absorbs adsorbed or free H2S in the rock, but also interacts physically and chemically with the minerals originally in the rock. Mella et al. reported that chemical stimulation with a Na2CO3 solution has a strong dissolution effect on quartz and calcite, and the dissolution extent increases with increasing formation temperature (Mella et al., 2006). This reaction with minerals and rocks is slower than those with acidic chemical stimulation. After the reaction with the rock sample, some of the alkaline solution dissolves branched groups to generate amorphous SiO2 or amorphous aluminosilicate alteration minerals, e.g., Na combines with Si and Al to form sodium feldspar. These feldspar minerals are attached to the rock surface and some new fractures will be blocked by these secondary minerals (Var et al., 2010). The primary minerals (calcite, feldspar, etc.) in the rock may release Ca2+, Mg2+, and other metal ions after dissolution. These can combine with CO32− to produce precipitates such as CaCO3 and MgCO3, which become attached to fractures or pore channels (Ahmadi and Yuan 2014). This blocks the channels and prevents the deep rock mass from contacting the alkaline liquid, which hinders further dissolution of the rock mass. In addition, Na2CO3 can combine with silicate generated by quartz reactions and metal ions generated by the dissolution of feldspar minerals to form secondary minerals such as kaolinite and albite or destroy the crystal structures of illite and kaolinite in clay minerals to generate secondary precipitates such as feldspar. Na2CO3 reacts with the rock minerals and generates a variety of minerals via a dynamic dissolution–precipitation process (Xu et al., 2009). The possible reactions between the Na2CO3 solution and rock minerals are shown in equations (5)–(11).
Quartz:
Dolomite:
Feldspar:
Illite:
Kaolinite:
We used XRD to determine the mineral compositions of the samples before and after Na2CO3 solution injection under various conditions; the results are shown in Table 4. Generally, the brittle mineral content had little effect on the rock micropores. After alkali treatment, the mineral compositions of the samples mainly showed that the clay mineral and feldspar relative contents decreased, whereas the calcite relative content increased. This indicates that the clay minerals and feldspar are more unstable than other minerals in an alkaline solution, and the divalent metal ions released after chemical dissolution can easily combine with CO32− to form a wide range of carbonates. This results in an increase in the relative amount of calcite. In addition, partial hydroxide precipitation and the formation of a large number of silicoaluminate ions can occur. A combination of these results and the changes in the PSDs of all the samples (Fig. 4) indicates that the secondary precipitates newly generated via various physical and chemical reactions, which can fill micropores or mesopores (d < 10 nm) or clog pore throat channels, are mainly responsible for the changes in the sample pore structures after Na2CO3 solution injection. The volume of micropores and mesopores filled or blocked by precipitates is therefore greater than the volume increase caused by chemical dissolution. Correspondingly, the TPVs and SSAs of the samples will decrease, and the overall APWs will increase.
| Sample number | Na2CO3 solution treatment state | Mineral composition(%) | ||||
|---|---|---|---|---|---|---|
| Quartz | Dolomite | Calcite | Feldspar | Clay (Illite / Kaolinite) | ||
| #1 | Untreated | 9.1 | 0.2 | 2.2 | 37.7 | 51.0 (30.6 / 20.2) |
| #2 | 1 %,12 h | 30 | 14.6 | 19 | 2.3 | 34.3 (26.1 / 8.2) |
| #3 | 1 %,24 h | 13.6 | 6.7 | 14.7 | 26.5 | 38.5 (26.5 / 12) |
| #4 | 1 %,36 h | 24.7 | 8.3 | 21.3 | 7.3 | 38.4 (27.8/ 10.6) |
| #5 | 3 %,12 h | 27.1 | 8.1 | 16.2 | 3 | 45.6 (22.2 / 23.4) |
| #6 | 3 %,24 h | 7.6 | 6.5 | 16.8 | 34.5 | 34.5 (22.7/11.8) |
| #7 | 3 %,36 h | 13.5 | 0 | 33 | 2.1 | 51.4 (51.4/0) |
| #8 | 5 %,12 h | 25.3 | 0.2 | 27.9 | 12.2 | 34.4 (25.4/9) |
| #9 | 5 %,24 h | 5.9 | 7.5 | 14.1 | 30 | 42.5 (30.1 / 12.4) |
| #10 | 5 %,36 h | 16.1 | 13 | 15 | 3.1 | 52.8 (34.3 / 18.5) |
| Mean value (from #2 to#10) |
18.2 | 7.2 | 19.8 | 13.4 | 41.4 (29.6 / 11.8) | |
4.2 Corrosion and precipitate attachment on surface and in pores of sample
A cubic limestone block of dimensions 15 mm × 15 mm × 15 mm was used to investigate the formation and attachment of precipitates on the surface and in the pores of the sample. After marking and identifying specific areas of a fresh section of the block by using FE-SEM, H2S pre-adsorption and immersion in Na2CO3 solution (3 %, 24 h) were performed. By sub-regional observation of the sample surface, the regions with obvious features are found in advance, and the coordinates of the approximate positions are marked, as shown in the figure below. After the sample is processed, place it on the observation platform according to the original placement position and direction, and re-enter the previously recorded coordinates. The formation of precipitates on the rock surface and around the pores at the same position were then observed for comparative analysis; the images are shown in Fig. 9.
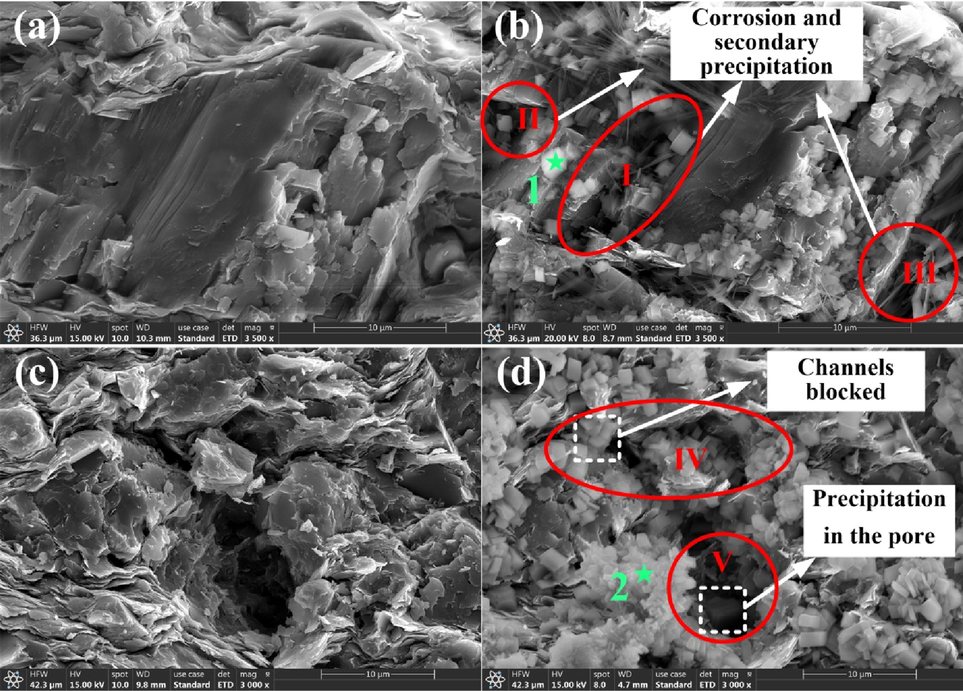
- Corrosion and precipitation at same locations in samples before and after treatment with Na2CO3 solution (3 %, 24 h).
Fig. 9(a) and (b) show FE-SEM contrast images of the same position on the sample surface before and after Na2CO3 solution treatment. Fig. 9(c) and (d) are contrast images near the same pore. The images show that a large number of chemical corrosion pits were formed in regions I, II, and III of the sample surface. After their formation, these craters were covered by newly formed granular or flocculent sediments. Regions IV and V show the formation of sediment near a macropore, and blockage of the pore. The formation of precipitates leads to blockage of the original crack channel; the diameter of the orifice is reduced, and the newly generated granular precipitates can be observed intuitively in the internal pore. Elemental energy spectrum analysis was performed at green points 1 and 2 in Fig. 9; the results are shown in Tables 5 and 6. The results show that the precipitated products were mainly CaCO3 and MgCO3, with some newly generated feldspar, illite, and kaolinite. From Fig. 9, we can conclude that mineral dissolution and precipitation of new minerals occurred. These massive deposits are an important reason for the decreases in the TPV and SSA. New mineral generation and the secondary precipitates attached to the surface and in the pores at the same locations confirm our inference.
| Element | Mass percent/% | Atomic percentage/% | |
|---|---|---|---|
| O | 57.07 | 66.88 | |
| Si | 10.45 | 6.97 | |
| Al | 8.94 | 6.21 | |
| C | 8.27 | 12.91 | |
| Pt | 4.10 | 0.39 | |
| Na | 3.94 | 3.21 | |
| K Fe Ca Mg |
3.69 1.60 1.26 0.68 |
1.77 0.54 0.59 0.53 |
| Element | Mass percent/% | Atomic percentage/% |
|---|---|---|
| Ca | 44.35 | 22.95 |
| O | 44.24 | 57.35 |
| C | 11.41 | 19.70 |
5 Conclusion
In this study, limestone in the surrounding rocks of typical coal-penetrating tunnels in Guizhou, China were used for H2S pretreatment and Na2CO3 solution treatment. Analyses of the changes in the pore volumes, PSDs, and SSAs, rock chemical dissolution, and sediment generation in the samples led to the following conclusions being drawn.
1. The pore types of limestone treated with Na2CO3 solution did not change, but its adsorption capacity declined significantly because of the significant decreases in the TPV and SSA. The maximum reductions in the TPV and SSA were 39.45 % and 83.4 %, respectively. The average pore size showed an overall increase, with a maximum increase of 266.32 %.
2. The numbers of micropores, mesopores, and macropores in the treated samples decreased on average by 66.17 %, 16.63 %, and 4.05 %, respectively. The decreases in the pore volume and specific surface area were mainly caused by the decreases in the numbers of the micropores and partial mesopores; this is consistent with the PSD curves for micropores (d < 2 nm) and mesopores (2 nm < d < 10 nm). With increasing Na2CO3 solution concentration or soaking time, there is a good positive linear relationship between the APW and the lye solution concentration and soaking time. The relationship between the rock SSA and the treatment solution concentration and soaking time is parabolic, with a minimum value when the concentration is approximately 3 % and the soaking time is approximately 24 h.
3. The reaction between limestone and Na2CO3 solution is a dynamic process that involves chemical dissolution and reprecipitation. Chemical dissolution occurs in many primary minerals, but clay minerals and feldspar are more unstable than other minerals, and their chemical dissolution is more pronounced. The released metal ions easily combine with CO32− to form secondary carbonate precipitates. A large amount of clay mineral dissolution significantly decreases the numbers of micropores and mesopores with d < 10 nm. This results in an increase in the relative proportion of macropores, which decreases the fractal dimensions of the samples and makes the internal pore structures more regular and ordered.
Acknowledgment
This work was supported by the National Natural Science Foundation of China (No. 51904049); the Postdoctoral Science Foundation Funded Project of China (No. 2021 M693750); the Chongqing Postdoctoral Research Fund Project (No.2010010006228345); the Yunnan Fundamental Research Projects (Grant No. 202101BE070001-039); and the Yunnan Department of Education Science Research Fund Project (Grant No. 2022 J0055). We thank Helen McPherson, PhD, from Liwen Bianji (Edanz) (www.liwenbianji.cn) for editing the English text of a draft of this manuscript.
Declaration of competing interest
The authors declare no conflict of interest.
References
- Numerical and experimental investigation of air flow behavior and H2S gas emission through an inclined traversed tunnel. J. Braz. Soc. Mech. Sci. Eng.. 2021;43
- [CrossRef] [Google Scholar]
- Gas wells chemical stimulation – experimental design and field optimization. J. Petrol. Sci. Eng.. 2014;113:36-45.
- [CrossRef] [Google Scholar]
- An Isotherm Equation for Adsorption on Fractal Surfaces of Heterogeneous Porous Materials. Langmuir. 1989;5:1431-1433.
- [Google Scholar]
- Effects of Supercritical CO2 Treatment Temperatures on Mineral Composition, Pore Structure and Functional Groups of Shale: Implications for CO2 Sequestration. Sustainability.. 2020;12:3927.
- [CrossRef] [Google Scholar]
- The effect of subcritical and supercritical CO2 on the pore structure of bituminous coals. J. Nat. Gas Sci. Eng.. 2021;94:104132
- [CrossRef] [Google Scholar]
- Hydrogen Sulfide Accumulation Factors in Coal Mine of Southeastern Margin of Junggar Basin in China. Appl. Ecol. Environ. Res.. 2019;17:683-697.
- [Google Scholar]
- CO2 and CH4 adsorption on different rank coals: A thermodynamics study of surface potential, Gibbs free energy change and entropy loss. Fuel. 2021;283:118886
- [CrossRef] [Google Scholar]
- Tunnelling undercrossing existing live MRT tunnels. Tunn. Undergr. Space Technol.. 2016;57:241-256.
- [CrossRef] [Google Scholar]
- Characteristics of pore structure and fractal dimension of low-rank coal: A case study of Lower Jurassic Xishanyao coal in the southern Junggar Basin, NW China. Fuel. 2017;193:254-264.
- [CrossRef] [Google Scholar]
- Effects of Supercritical CO2 Treatment Temperature on Functional Groups and Pore Structure of Coals. Sustainability.. 2019;11:7180.
- [CrossRef] [Google Scholar]
- Pattern of H2S concentration in a deep copper mine and its correlation with ventilation schedule. Measurement. 2019;140:373-381.
- [CrossRef] [Google Scholar]
- Typical Underwater Tunnels in the Mainland of China and Related Tunneling Technologies. Engineering.. 2017;3:871-879.
- [CrossRef] [Google Scholar]
- Delineating subterranean water conduits using hydraulic testing and machine performance parameters in TBM tunnel post-grouting. Int. J. Rock Mech. Min. Sci.. 2014;70:308-317.
- [CrossRef] [Google Scholar]
- Excessive groundwater inflow during TBM tunneling in limestone formation. Tunn. Undergr. Space Technol.. 2020;96:103217
- [CrossRef] [Google Scholar]
- Origin of hydrogen sulfide in coal seams in China. Saf. Sci.. 2012;50:668-673.
- [CrossRef] [Google Scholar]
- Numerical investigation of tunnel deformation due to adjacent loaded pile and pile-soil-tunnel interaction. Tunn. Undergr. Space Technol.. 2017;70:166-181.
- [CrossRef] [Google Scholar]
- Experimental Investigation of Mechanical Properties of Black Shales after CO(2)-Water-Rock Interaction. Materials.. 2016;9
- [CrossRef] [Google Scholar]
- Using oxygen/ozone nanobubbles for in situ oxidation of dissolved hydrogen sulfide at a residential tunnel-construction site. J. Environ. Manage.. 2022;302:114068
- [CrossRef] [Google Scholar]
- Micro and macro-structural effects of high temperatures in Prada limestone: Key factors for future fire-intervention protocols in Tres Ponts Tunnel (Spain) Constr. Build. Mater.. 2021;286:122960
- [CrossRef] [Google Scholar]
- Mella, M., Kovac, K., Xu, T., et al., 2006. Calcite dissolution in geothermal reservoirs using chelants.
- Hazards of mechanized tunnel excavation in H2S bearing ground in Aspar tunnel. Iran. Environ Earth Sci.. 2011;66:529-535.
- [CrossRef] [Google Scholar]
- Benchmark solutions of large-strain cavity contraction for deep tunnel convergence in geomaterials. J. Rock Mech. Geotech. Eng.. 2020;12:596-607.
- [CrossRef] [Google Scholar]
- Assessment of H2S emission hazards into tunnels: the Nosoud tunnel case study from Iran. Environ Earth Sci.. 2017;76
- [CrossRef] [Google Scholar]
- Field observations at the Fenton Hill enhanced geothermal system test site support mixed-mechanism stimulation. Geothermics. 2018;74:135-149.
- [CrossRef] [Google Scholar]
- Experiences of TBM operation in gas bearing water condition – A case study in Iran. Tunn. Undergr. Space Technol.. 2015;47:1-9.
- [CrossRef] [Google Scholar]
- Status of research on hydrogen sulphide gas in Chinese mines. Environ. Sci. Pollut. Res. Int.. 2020;27:2502-2521.
- [CrossRef] [Google Scholar]
- Some engineering properties of limestone: Tunnel Stražina case study (Croatia) Tunn. Undergr. Space Technol.. 2011;26:242-251.
- [CrossRef] [Google Scholar]
- Experimental Study of the Chemical Stimulation of Iranian Fractured Carbonate Reservoir Rocks as an EOR Potential, the Impact on Spontaneous Imbibition and Capillary Pressure. Sci. Iran Trans. C. 2010;17:37-45.
- [Google Scholar]
- The National Air Emissions Monitoring Study’s Southeast Layer Site: Part V. Hydrogen Sulfide and Volatile Organic Compounds. Trans. ASABE. 2016;59:681-693.
- [Google Scholar]
- Genesis, controls and risk prediction of H2S in coal mine gas. Sci. Rep.. 2021;11:5712.
- [CrossRef] [Google Scholar]
- On modeling of chemical stimulation of an enhanced geothermal system using a high pH solution with chelating agent. Geofluids. 2009;9:167-177.
- [CrossRef] [Google Scholar]
- Prevention and control of gas hazards in a tunnel under construction: a case study. Environ. Earth Sci.. 2020;79
- [CrossRef] [Google Scholar]
- Construction risks of Huaying mount tunnel and countermeasures. Front. Struct. Civil Eng.. 2017;11:279-285.
- [CrossRef] [Google Scholar]
- Analytical solutions of noncircular tunnels in viscoelastic semi-infinite ground subjected to surcharge loadings. Appl. Math. Model.. 2022;102:492-510.
- [CrossRef] [Google Scholar]
- Determining fractal dimensions of coal pores by FHH model: Problems and effects. J. Nat. Gas Sci. Eng.. 2014;21:929-939.
- [CrossRef] [Google Scholar]
- Mechanical behaviour of Longmaxi black shale saturated with different fluids: an experimental study. RSC Adv.. 2017;7:42946-42955.
- [CrossRef] [Google Scholar]
- Disaster mechanism of tunnel face with large section in sandy dolomite stratum. Eng. Fail. Anal.. 2022;131:105905
- [CrossRef] [Google Scholar]
- A Novel H2S Gas Sensor Applied to the Construction Workers During the Construction Process. Sci. Adv. Mater.. 2019;11:143-146.
- [CrossRef] [Google Scholar]


