

Translate this page into:
Microwave plasma torch mass spectrometry for some rare earth elements
⁎Corresponding authors. Msriac@163.com (Lihong Li), jt1990jt@163.com (Tao Jiang), zhiqiangz@iccas.ac.cn (Zhiqiang Zhu)
-
Received: ,
Accepted: ,
This article was originally published by Elsevier and was migrated to Scientific Scholar after the change of Publisher.
Peer review under responsibility of King Saud University.
Abstract
Rare earth elements (REEs) have been widely applied in modern industry and material science due to their special chemical properties and luminescence properties, but their environment pollution problem has also attracted attention. How to trace and control impact of REEs on environment and develop highly sensitive methods for REEs analysis have practical significance. Microwave plasma torch (MPT) is a kind of simple, low power consumption (∼200 W) and easily operated plasma generators. When it was coupled with varied mass spectrometers as ion source of mass spectrometry (MS), i.e. MPT-MS can use for the analysis of metal elements in aqueous with the remarkable advantage of only minimal or even no simple pretreatment, and can meet comprehensive requirements of environmental control and water quality monitoring. MPT-MS have also an ability to carry out online real-time monitoring and analysis of water environment. Compared with the traditional ICP-MS, it can obtain more effective information and has higher sensitivity (the detection limit is at sub-ppb level). This paper reviews common methods and research progress of REEs analysis in recent years. Practical applications and advantages of MPT in the analysis of REEs are briefly summarized. Specifically, this paper introduces some work recently done in our group on analysis of REEs by the MPT, including analysis of metal elements distribution in water samples in local Poyang Lake, and general rules of formation and behavior of complex metal ions in the MPT plasma are also proposed afterwards. Through the practically dealing with the Poyang Lake case by the MPT, hopefully this would interest more academia into this area so as to speed up development of the MPT itself.
Keywords
Microwave plasma torch
Ambient Mass Spectrometry
Fieldable ion source
Rare earth elements

1 Introduction
Rare earth elements (REEs)are particularly of importance in modern industry and material science field, due to their specific 4f shell electrons and thus exhibiting special chemical properties and luminous characters, they have found quite extensive applications in various scenarios, including electronics, permanent magnets, hybrid and electric cars, wind power, compact fluorescent lamps, petrochemical, metallurgy, machinery, light industry, environmental protection, agriculture etc.(G. Xu, 1995, B. Hu and J. Yin 2006, K. Binnemans et al., 2013, M. Tennesen 2014, W. Zheng et al., 2015, T. Zhong et al., 2015, T. Zhong et al., 2017, X. Lei et al., 2018, V. Srivastava et al., 2018, Y. Tu and C. T.Johnston 2018, M. Anenburg et al., 2020, B. Frietsch et al., 2020, H. Abdollahi et al., 2021, A. M. Schmitz et al., 2021, B. Deng et al., 2022, X. Zhang et al., 2022) In fact, REEs have a good reputation as industrial vitamins and are used as indispensable raw materials in most advanced science and technology as well as military industry. REEs are also essential to the green economy in the transition of fossil fuel to green energy due to their increasing demand in green and energy saving applications.
However, along with large amounts of unreasonable and irregular exploitation of rare earth resources and discard of the REEs contained materials, pollution of REEs is becoming more severe and receiving increasing attentions in recent years. Once these REEs make their ways into nature, it will inevitably lead to a high toxicity level in soil. Eventually, these toxic derivatives will be digested or inhaled by human or animals via various food chains, causing substantial harm to ecosystem.(J. Chen et al., 2006, B. Hu and J. Yin 2006) Although, effect of REEs on the biological body is yet unclear till now, positive and negative aspects have been reported (F. Sulotto et al., 1986, B. Yang and J. Feng 2002, J. Chen et al., 2006, L. Liu et al., 2019, C. Li et al., 2021, E. Morel et al., 2021). These uncertainties are partly due to the deficiency of high-sensitive, high-speed and high-throughput (3-High) analytical tools suitable for REEs. Obviously, a 3-high analysis method will accelerate immensely the analysis and provide a more explicit pattern in this field. Similarly, potential application fields of REEs are also increasing in current society, and demands for high-sensitivity analysis tools for REEs are becoming more and more stringent.(D. J. Fray 2000, T. Uda et al., 2000, I.D.Hughes et al., 2007, Z. Zhang et al., 2017, A. Negrea et al., 2018, L. Chen et al., 2020, J. J. M. Nelson et al., 2020) On one hand, the distribution of REEs within environmental samples is wide and varied. For instance, for biological samples, generally, the reported concentration range is from ng/g to μg/g, that is 10-6 to 10-9, while for atmospheric dust, soil and water sample, the corresponding concentration variation covers 10-6 to 10-9, even low to 10-12, depending on the sample source and the detection methods. (B. Hu and J. Yin 2006) More exact demonstrates should demand for advanced analytical techniques. On the other hand, with owing to the chemical properties of the similarity of the 17 REEs, REEs sources always contain a mixture of several REEs full stop, the most difficult point of REEs analysis is to get a highly pure REE of interest/target, this means that detection of REEs is usually accompanied by extraction and pre-separation. For instance, Chen et al.(H. Chen et al., 2020) developed a novel online sequential fractionation analysis without pre-separation, which can analysis As(III) and As(V) online in turn. Due to advantages of extremely low sample consumption, high throughput and minimized experimental manipulation, this method provides a new idea for online analysis of REEs. Therefore, in order to develop sensitive analytical methods for REEs is of real significance and immense interest, and has become one of hot points and posed a challenge in analytical science.(M. Anithaa et al., 2015, U. Pal et al., 2021).
In this short review, we hope to summarize our works about the MPT (microwave plasma torch) mass spectrometry studies of some REEs. Firstly, we gave a short introduction about progress on the analytical method for REEs and novel applications in distinguishing origin area of some crop products. We then focus on our group’s experimental systems, LTQ (linear ion trap) mass spectrometer and home-built quadrupole mass spectrometer, which are only two currently available mass spectrometers to be used to couple with the MPT ion source. These two MPT mass spectrometers were compared on the sensitive detection of trace levels of REE ions in water. For those rare earth elements in context, including yttrium, lanthanum, cerium, praseodymium, neodymium, samarium and europium etc., their generated complex ions in plasma, were assigned in both positive and negative ionic modes, and further characterized in collision induced dissociated (CID) experiments. These results exhibit multi-advantages and potential applications of MPT mass spectrometry in fast analysis of REEs elements in water samples. These newly established MPT mass spectra of REEs also may help to develop new separation techniques more suitable for REEs.
2 A short review on the analytical methods for REEs
Currently, there are many kinds of analytical techniques applied in the detection of REEs, most of them must be operated with the aid of extraction and separation.(T. Zhong et al., 2015, H. Chen et al., 2020) These techniques include atomic absorption/ fluorescence spectroscopy(AAS/AFS),(T. Cesca et al., 2018, Y. Zhong et al., 2019) atomic emission spectroscopy(AES),(W. Jiang et al., 2003) X-ray fluorescence spectroscopy(XFS),(R. Fernández-Ruiz and J. Capmany 2001) neutron activation analysis (NAA),(S. Ohde 2003)X-ray diffraction(XRD),(X. Jin et al., 2021)inductively coupled plasma optical emission spectrometer(ICP-OES)(S. Yenisoy‐Karakaş et al., 2004)and inductively coupled plasma mass spectrometer (ICP-MS),(V. Balaram 1996, C. Moor et al., 2000, T. Pasinli et al., 2005, W. Wu et al., 2015, S. Shen et al., 2022) and so on. ICP-MS, and its various derived forms, as well as other isotope dilution mass spectrometry, such as thermal ionization mass spectrometry (TIMS),(J. Baker et al., 2002, G. D.Pollack et al., 2009, J. Harvey and E. F. Baxter 2009, J. M. Koornneef et al., 2015)has become one of the most commonly used techniques in conventional REE analysis. They have all multiple advantages, including extremely high sensitivity, high efficiency, broad dynamics range and synchronous analysis of various elements, affording the highest precision isotopic data of single REEs and data reproducibility in the ppm range for isotopic ratios and in the 0.1 % range for concentrations. The sensitivity of ICP-MS has reached the level of 0.01 ng/g for almost REEs, compared with only about 10 ng/g for ICP-OES under the same conditions. However, restricted by its clumsy and expensive equipment, sample injection mode, matrix effect and difficulty in direct analysis of solid sample, ICP-MS is hardly applied in fast field analysis of REEs. Therefore, there is a demand for new analytical techniques in a certain extensive field.
Desorption electrospray ionization (DESI),(Z. Takats et al., 2004) invented by Graham Cook’s laboratory in 2004, relies on solvent extraction on sample surface and ionizes to obtain localized information. One of the most important advantages of DESI is that it allows for the analysis of a sample in its native state, therefore DESI brings the breakthrough in atmospheric mass spectrometry technology and initiates innovatively an analytical technology without sample pretreatment. Novelty of the idea enables the ionization of samples with scarcely sample pretreatment or even no need of sample pretreatment, therefore reduces the analytical procedure and time, particularly in ambient analysis, although ambient mass spectrometry has developed substantially in the past nearly twenty years, and a lot of ambient ion sources have emerged and been applied for various kinds of complex matrix samples. Another issue considered for ambient analysis is atmospheric pressure manipulation, there are more than 10 types of ionization techniques based on the atmospheric plasma that have been invented, including plasma jet ionization, dielectric barrier discharge ionization (DBDI),(N. Na et al., 2007) desorption atmospheric pressure chemical ionization (DAPCI),(H. Chen et al., 2007, S. Yang et al., 2009)desorption corona beam ionization (DCBI),(X. Li et al., 2010, H. Wang et al., 2010)plasma-assisted desorption ionization (PADI),(L. V. Ratcliffe et al., 2007) flowing atmospheric pressure afterglow (FAPA),(F. J. Andrade et al., 2008, M. Smoluch et al., 2014) micro-plasma discharge ionization (MDI),(J. M. Symonds et al., 2010, J. M. Symonds et al., 2014)low-temperature plasma (LTP) ionization(J. D. Harper et al., 2008)etc., all of which generatevisible plasma(G. A. Harris et al., 2011) having obtained a series of achievements in the analysis of complex matrix samples and greatly expanded the range of analytical objects of mass spectrometry, including metabolomics,(C. A. Smith et al., 2006, A. Lommen 2009, H. Gu et al., 2011) proteomics,(Z. Pan et al., 2007, H. Gu et al., 2010) forensic medicine,(J. J. Thoma et al., 2001, M. Wood et al., 2006) and quality monitoring(J. Rieder et al., 2001). Usually, these plasma-related methods employed an intense (usually several kilovolts) and low frequency (up to 850 Hz) alternating electronic field to produce a plasma under atmospheric pressure. Nevertheless, temperature of plasma is so low that it limits excitation capacity required for metal elements analysis (usually ∼ 300 Kelvin in excitation temperature).
Firstly introduced a novel plasma generator, microwave plasma torch (MPT), as early as in 1985 by Jin and his collaborators(Q. Jin et al., 1985), provides a new approach to do atmospheric pressure mass spectrometry. This kind of plasma device employs a commercial high-frequency (2450 MHz) microwave, which makes the plasma to have higher power and more practicability in applications. The MPT achieved substantially improvement later at Indiana University where the MPT can be applied in a variety of supporting gases, including Ar, He, N2, Ne or air. The MPT was also able to produce a flame-like plasma, which is quite similar to ICP.(Q. Jin et al., 1991, K. J. Jankowski and E. Reszke 2010) Based on its multiple merits, for instance, small size, low power consumption, low cost, easy operation and high excitation efficiency, the MPT had raised considerable attentions in the field of analytical chemistry and received been explored in many applications. The most typical one is to use an excitation light source in AES portable spectrometer,(Y. Duan et al., 2000, G. Feng et al., 2004) supercritical fluid chromatography (SFC),(Q. Jin et al., 1990) liquid chromatography (LC)(J. A. C. Broekaert et al., 1998)mainly for elemental analysis, including some halogens. On the other hand, in addition to being able to produce a bright flame as a light source, the MPT itself generates a high-temperature plasma with excellent excitation ability. Based on this feature, numerous efforts have been made to use the MPT as anion source of mass spectrometers.(B. W. Pack et al., 1998)Such as, the MPT has been employed in a mass spectrometer coupled a capillary gas chromatography to detect halogenated hydrocarbons separated by the latter. Later, Zhang and Zhu et. al.(T. Zhang et al., 2013) studied direct desorption/ionization ability of the MPT on a LTQ mass spectrometer under ambient conditions by analyzing a series of small organic molecules. The results showed that the MPT could be a useful alternative to ambient ion source. Additionally, the MPT has been often used for detection of metal elements,(X. Xiong et al., 2015, C. Chu et al., 2016, T. Jiang et al., 2016, Z. Zhu et al., 2016, X. Xiong et al., 2016(a), X. Xiong et al., 2016(b), J. Yang et al., 2017, X. Xiong et al., 2018, T. Jiang et al., 2020(a), T. Jiang et al., 2020(b), T. Jiang et al., 2021) although ICP mass spectrometry has dominated in this field, i.e. element analysis by mass spectrometry. The MPT mass spectrometry still exhibited some novel features which are significantly different with those obtained by traditional ICP mass spectrometry. These peculiar properties may be more helpful in metal element analysis. For instance, negative mode of transition metal elements in MPT-LTQ-MS is more suitable for fast screen than positive mode.(X. Xiong et al., 2016(b)) In spite of mysterious and elusory mechanism, a lot of efforts have also been made on study of almost all the transition metal elements and attempted to summarize phenomenologically rules of ionic formation, and those results showed that the MPT mass spectrometry can be used as a beneficial supplement of ICP-MS. Moreover, the MPT mass spectrometry has also huge potential applications in field analysis.
3 Some novel applications as the distinguishability index
The development of new analysis methods for tracing REEs in plants to their origin is a valuable and interesting application. Many scholars have made a great deal of efforts in this aspect. Nie et al.(G. Nie et al., 2014) utilized clustering analysis combining the detected data of REEs in tea from different regions and showed that REEs contents can be used as an important index to distinguish tea producing areas. D. Joebstl et al.(D. Joebstl et al., 2010) used chemometricsmethod, multivariate discriminate analysis, to analyze rare earth elements in pumpkin seed oil and distinguish the origin of pumpkin seed oil. Their results showed variable rare earth element patterns, making it possible to trace the origin of these oils. E. G. Farmaki et al.(E. G.Farmaki et al., 2012)established a linear discriminant model based on the data of 10 REEs in olive oil from 4 different regions in Greece, and the prediction accuracy of the model can reach ca.73 %. Q. Yao et al.(Q. Yao et al., 2017) applied absolute contents of some heavy REEs as a fingerprint in the discriminate analysis of An’xi Tieguanyin Tea and Hua’an Tieguanyin Tea. Li et al.(A. Li et al., 2020) established a method for geographical origin discrimination of peaches to provide technical support for protection of geographical indication products and for tracing geographical origin of agricultural products. The contents of 16 rare earth elements determined by ICP-MS were used in a discriminate model based on multiple comparative analysis and general discriminate analysis for identifying the geographical origin of peaches. Multiple comparative analysis showed that there were significant differences both in nitrogen isotopes between various growth areas, and in carbon and oxygen isotope ratios between peaches grown in hilly regions and those grown in plain regions, as well as in contents difference of the rare earth elements Ce, Eu, Gd and Er among different producing places. Their results showed that REEs fingerprint analysis combined with chemometrics is feasible to identify geographical origin of peaches in small spatial scale.
The quality of crops and cash crops is closely related to local site environmental geochemical and edaphicconditions. It is of great significance for crop and cash crop production to explore element geochemical characteristics of rock soil plant system in planting area. REEs are undoubtedly very important indicators, which are believed to be closely associated with unique and excellent qualities of many crops, for instance(A. Volokh et al., 1989, A. Wyttenbach et al., 1998, Z. Hu et al., 2004, C. Turra et al., 2013, J. Cheng et al., 2015), navel orange(J. Cheng et al., 2015) and blueberry(C. Li et al., 2021). Zhang et al.(Z. Zhang et al., 2021)examined feasibility of using REEs as a fingerprints to distinguish 17 groups of navel oranges collected from different bedrock areas in Ningdu, Ganzhou, China, and to determine15 kinds of rare earth elements as indexes with distinguishing characteristics integrated employing one-wayanalysisofvariance, principal component analysis, Fisher linear discriminate analysis as well as orthogonal partial least squares discriminate analysis. Their results showed that the distribution curves of rare earth elements in soil and navel orange in different bedrock areas of Ningdu were basically the same, and the average contents of rare earth elements La, Pr, Nd, Gd, Tb, Dy, Y, Sm, Ho and Er in navel orange were significantly different in those planted in the two bedrock areas. Li et al.(C. Li et al., 2021) employed field investigation and indoor analysis paper to study the geochemical characteristics of REEs in rocks, soils, blueberry plants and blueberry fruits of blueberry core producing areas in Guizhou Province. Their results indicated the content of REEs in surface soil is higher than that in the bottom of soil profile and the distribution curves of REEs in soils in the area under survey are basically consistent with those in rocks. In addition, they showed the contents of La, Ce, Nd and Yin roots, leaves, stems, and fruits of blueberry were similar, all exhibiting a descending trend, and the distribution curve showed a right-leaning pattern. From these results, they concluded that distribution pattern of REEs in blueberry plants is basically consistent with that in rock and soil, and the inheritance of REEs in rock-soil–plant system is obvious. On the other hand, the data and distributions of REES also provide bases for the formulation and revision of soil policies and regulations.(E. Morel et al., 2021).
4 Two kinds of experimental platforms
In principle, MPT as a plasma ion source can be coupled with any types of mass spectrometer. Subject to our working conditions, we mainly focused on two kinds of mass spectrometer, a LTQ mass spectrometer and a simple quadrupole mass spectrometer, for which the different MPT platforms were built respectively. The MPT mass spectra for REEs obtained from these two platforms are slightly different, which provides a great opportunity to get the universal features of the MPT mass spectra of REEs.
4.1 Configurations and operations of MPT
The MPT is core of MPT mass spectrometry. Traditionally, MPT consists of coaxial cylindrical three-layer copper tubes, which is the microwave input tube, working gas flow in central tube and supporting gas flow in the intermediate tube. The outer tube is matched to the microwave input with an outer diameter of 26 mm and inner diameter of 22 mm. Sampling microwave (worked at 2450 MHz) with a power up to 200 W is input the intermediate tube through a coaxial cable and propagated in the cavity between the intermediate tube and outer tube, forming a stable microwave electromagnetic field in the torch cavity. The intermediate tube (5.5 mm o.d and 4.5 mm i.d.) and central tube (3 mm o.d. and 2 mm i.d.) are for the gas flowing. In our MPT, argon gas is used. The argon gas is separated into two routes, one is directly introduced into the intermediate tube with a flow rate about 450 mL/min, and another flowing around at 800 mL/min is used to nebulize the sample solution and carry the dried samples again into the central tube. Two flowing rates were adjusted via two rotameters working in the range of (100–1000 mL/min) to optimize the experimental conditions. Such a setup is just for the dual-flow system, which is beneficial to optimize the plasma jet shape. The plasma is started with a spark, which is created manually by a short circuit between the intermediate tube and the inner tube. By optimizing these adjusting parameters, a stable visible cone-shaped plasma jet is generated on the top opening of the MPT and extended into the air at atmospheric pressure. The excited temperature of plasma may be about between the range of 800–2000 K. Such a high temperature ensures the excitation capacity of MPT ion source. In our experiments, MPT was fixed on a translate-stage keeping the coaxial distance about at 1 mm from the mass spectrometer ion inlet to the tip of the plasma (refer to Fig. 1).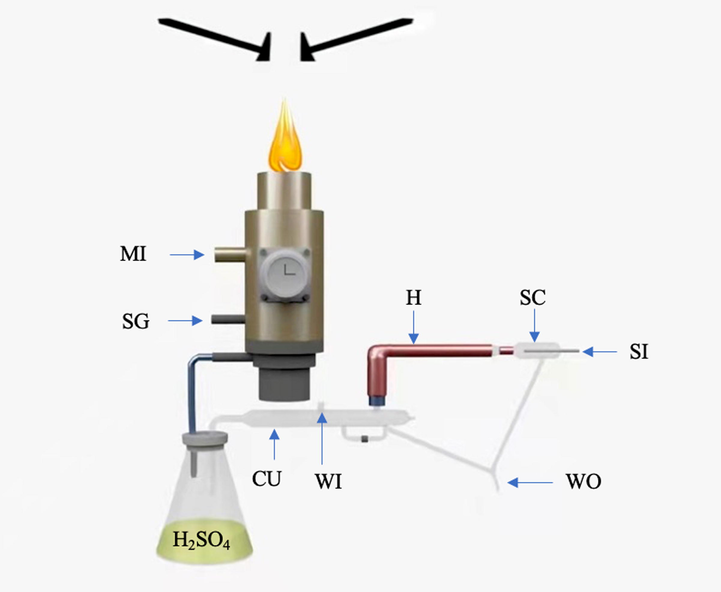
Experimental schematic diagram of MPT ion source coupled with a mass spectrometer, either LTQ or Q-MS.
4.2 The desolvation system
The current form of MPT mass spectrometry is mainly suitable for aqueous liquid samples. However, owing to the well-known reason that there are abundant absorption bands in microwave range for water molecule, most of microwave energy was wasted and cannot be used to produce MPT plasma. In order to reduce this consumption, generally, two approaches can be taken. One is to employ a traditional desolvation unit, as we did in our lab, it comprised the pneumatic nebulizer, spray chamber, heated region, condenser, and desiccation chamber. Custom glassware forms the pneumatic nebulizer spray chamber, and the heated tube. The heated tube is 25 cm long and is wrapped with heating tape which is monitored with a thermocouple and a heater controller (XMT61X, Beijing Huibang Science Technology Co. ltd., China), with controllable temperature at 140 °C or so. The condenser was homed-made for secondary drying. A 500 mL flask was filled with concentrated sulfuric acid (98 %) to further remove the H2O molecules from the aerosol before the aerosol enters into the plasma through the MPT central tube (also refer to Fig. 1). The generated ions are directly introduced in continuous mode into the mass spectrometer through the atmospheric inlet to analysis.
Another more modern approach is to employ a nafion tube(I. Klyuzhin et al., 2008, C. O’Rourke et al., 2011, Y. Yin et al., 2016) instead of the custom heated and condensed tube. The nafion tube is a perfluoro sulfonic ionomer multi-bundle system consisting of a polytetrafluoroethylene backbone and regularly spaced side chains terminated by sulfonate ionic groups. Nafion tube have the advantages of producing the universal exclusion region with relatively large exclusion zone as well as exclusion surface and its commercially available in convenient tubular shape. Nafion tubes have been used in our MPT experimental system instead of the traditional dissolving device, using chemical affinity of sulfonic acid to remove gas, could dry large flow of gas in a short time, so that the efficiency is greatly improved. Moreover, the installation is even simpler and the operation is stable, which provides a guarantee for the dry samples to enter the mass spectrometer.
4.3 The two mass spectrometers: LTQ and quadrupole mass spectrometer
Here, two kinds of mass spectrometers are described briefly.
LTQ mass spectrometer The commercial LTQ XL mass spectrometer (Thermo Fisher Scientific, San Jose, CA, USA) was optimized for the REEs analysis with the capillary voltage at ± 44 V and the tube lens voltage of ± 80 V. The temperature of the heated capillary was 150 °C. The mass spectra were collected with an average time of 1.5 min. Ions of interest were isolated with a mass-to-charge window width of 0.8 units for collision-induced dissociation (CID) experiments by applying a collision energy (CE) of 30 % (arbitrary unit defined by the MS manufacturer). The commercial software Xcalibur is inherently used for LTQ control and data processing.
The quadrupole mass spectrometer Here, the involved quadrupole mass spectrometer (Q-MS) is homebred in Chinese instrumental company (Beijing Perkinje General Instrument Co. ltd). The instrument comprises of an atmospheric sample inlet, a quadrupole mass filter, ion transferring and optics system, vacuum system and control electronics. It has a size about 75 × 55 × 45 cm3, and works currently in positive ion mode for detection of heavy metal elements. Instrument control and data acquisition is performed by homemade software in C++ language. The theoretical mass range of this simple mass spectrometer covers 50–1000 Th, which is determined by the quadruple geometry, RF frequency and maximum RF amplitude. The simple mass spectrometer can give unit resolution in the 100–300 Th intervals. The core parts of the quadruple mass filter and the ion funnel have been constructed. And the vacuum system of this simple mass spectrometer was supported by an oil-free 2-stage scroll vacuum pump (8 L/min, SKY WXG-8B) as well as a miniature turbo pump (260 L/s, Pfeiffer Split Flow 310, PM P04), and the controller for the turbo pump. The oil-free scroll vacuum pump is able to provide a backing pressure of 102 Pa at a pumping speed of 8 L/min. The miniature turbopump provides an ultimate pressure at the level of 10-4 Pa in the vacuum chamber.
5 MPT-LTQ mass spectra of REEs
Currently, linear ion trap mass spectrometer (LTQ-MS) is one of the most commonly used commercial mass spectrometers with a rectilinear ion trap as the core part. This rectilinear ion trap could trap plenty of ions under suitable conditions. Consequently, it can analyze a very weak ion signal and provide up to 7 secondary mass spectra. In addition, LTQ-MS can work in positive and negative ion modes and give the characteristic MPT-LTQ mass spectra of REEs complex cations or anions produced in the MPT plasma. The latter is based on the matter of fact, when REEs combine with more than the number of NO3– radicals, the elements to be analyzed can exist in the complicated form of negative ions. In short, MPT-LTQ mass spectrometry has two affluent detecting ways for REEs, producing richer and more comprehensive information.
5.1 Positive mode
In our previous work(X. Xiong et al., 2015, T. Jiang et al., 2016, X. Xiong et al., 2016(a), X. Xiong et al., 2016(b), J. Yang et al., 2017, X. Xiong et al., 2018), we showed that the negative mode is more suitable to analyze the REEs in aqueous solution. However, for the sake of completeness, the information of positive mode is also useful since it could, having provided some instructive information. Let’s start with Lanthanum element.Fig. 2 a) shows the typical MPT mass spectrum of lanthanum collected from an experiment using 10 mg/L lanthanum chloride standard solution in positive mode in the range of 130–360 Th. Three major peaks, located at m/z 317, 334 and 351 dominate this mass spectrum, in. These two peak can be respectively assigned to [La(NO3)2·3H2O]+, [La(NO3)2·3H2OOH]+and[La(NO3)2·3H2O2OH]+, in an arithmetic sequence with a difference of 17, which are easily calculated from the empirical molecular formula. The multi-step collision induced dissociation experiments were performed on the peak of m/z 317 to further confirm its assignment. Fig. 2b) shows the MPT MSN mass spectra, n up to 6, in which the precursor ion m/z 317 lost successively-three H2O groups to generate the peak at m/z 299, 281, 263 in MS2, MS3 and MS4 spectra, respectively. The sub-precursor should contain two NO3– groups; in further CID experiments, the main fragment was that of m/z 233 by the loss of NO in MS5 spectrum. The ultimate fragment ion is that of m/z 155, which was produced from the disaggregation of the ion of m/z 233 by throwing away a group of NO4 and would not be dissociated further in CID experiments. Although such a group of NO4 seems a little strange, it cannot be affirmed by current technique tool till now and it is merely a calculated result according to the molecular formula. The ion of m/z 155 may be assigned to (LaO)+. Many parallel experiments have showed that the ion of m/z 155 is always the final fragment ions in positive mode, which demonstrated that the relevant anion groups NO3– in the MPT mass spectra were originated from the background in the plasma but not the sample solution, and also verified these assignments above. The peak of m/z 334 has an almost identical dissociated sequence except the losing of a group OH more than m/z 317. The group OH is also distinct characteristics involving the MPT mass spectra of metal elements.(T. Jiang et al., 2016, X. Xiong et al., 2016(a))This similarity hints that these two peaks of m/z 317 and 334 were originated from the similar ionic forms of lanthanum elements. On the other hand, lanthanum has two natural isotopes: 139La with a natural abundance of 99.91 % and 138La with a natural abundance of 0.89 %. The latter is too weak to ignore, in other word, lanthanum can be thought as a monoisotopic element, which is according with our experimental observation.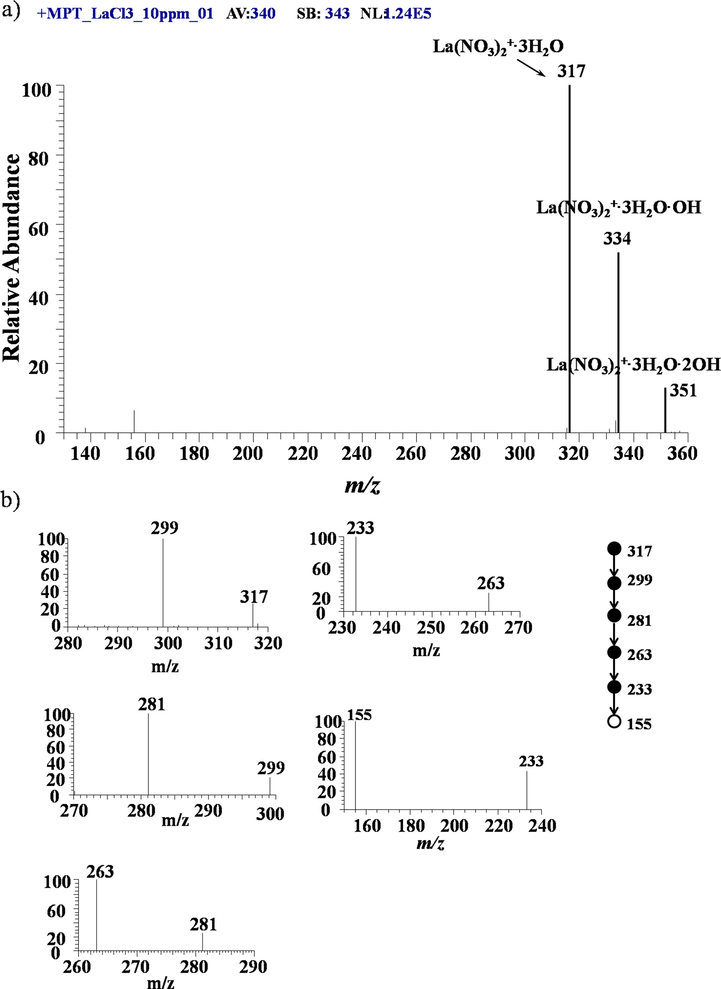
a) MPT-MS of lanthanum chloride in positive ion mode in LTQ; b) Tandem mass spectra of the precursor ion of m/z 317 obtained in LTQ.
Second typical example is neodymium, as shown in previous works(X. Xiong et al., 2015), which exhibited almost exactly the same spectral properties and dissociation rules. A new but a little bit different example is cerium. Fig. 3a is the typical MPT mass spectrum of cerium in positive mode collected in the range of m/z 250–300 Th, where a 10 mg/L cerium standard solution was used. Clearly, there are a pair peaks, located at m/z 272 and 274 (round up to an integer due to the inherent error of LTQ-MS) in this mass spectrum, with intensity ratio near to 15. Combined with the empirical molecular formula, summarized in our previous works about the MPT mass spectra of metal elements, the ion of m/z 272 and 274 can be assigned to [140CeO(NO3)∙3H2O]+ and[142CeO(NO3)∙3H2O]+, which may exist in a more stable form [Ce(OH)2(NO3)∙2H2O]+. These two possible structures are both a little different with that of lanthanum. The difference also hints the complexity of MPT plasma and the formation mechanism of REEs. Comparing the peak intensity with the isotopic abundance is also significant. Cerium has four natural isotopes, 136Ce(0.19 %), 138Ce(0.25 %), 140Ce(88.48 %) and 142Ce(11.07 %). The abundances of the former two are too small tube observed in this mass spectrum due to the limited finite dynamic range of LTQ-MS, so they can be negligible. The abundant ratio of the latter two isotopes is 7.99, which is only nearly half the intensity ratio of the two peaks in latter pair observed in positive ionic mode. And this result is far not good as that in the negative mode MPT mass spectra of cerium,(X. Xiong et al., 2015) therein the corresponding values are 7.56 and 8, almost a perfect match, the roughly same value may due to the symmetric ionic structure. The reason for this mismatch is still unclear. More direct evidences for these assignments depended on the tandem mass spectrometry experiments. Fig. 3b)-e) are the MSn mass spectra of the precursor ions at m/z 272, n = 2, 3, 4, 5 respectively. As shown, the precursor ions of m/z 272 produce first the fragment of m/z 254 by losing a H2O group. In MS3, sub-precursor of m/z 254 can produce the minor fragment of m/z 236 by the loss of a second H2O group and the major fragment of m/z 218 by throwing away a thirdH2O group. Finally, the fragment of m/z 218 yields the peak at m/z 172 by the loss of a NO2 group and yields the peak at m/z 156 by losing further a O group. The ionic fragment of m/z 156 may be assigned to [CeO]+, similar to the rule get from Lanthanum, exhibiting parallel isotopic pattern. Thereby, the tandem mass spectra of the ions of m/z 272 supports this assignment.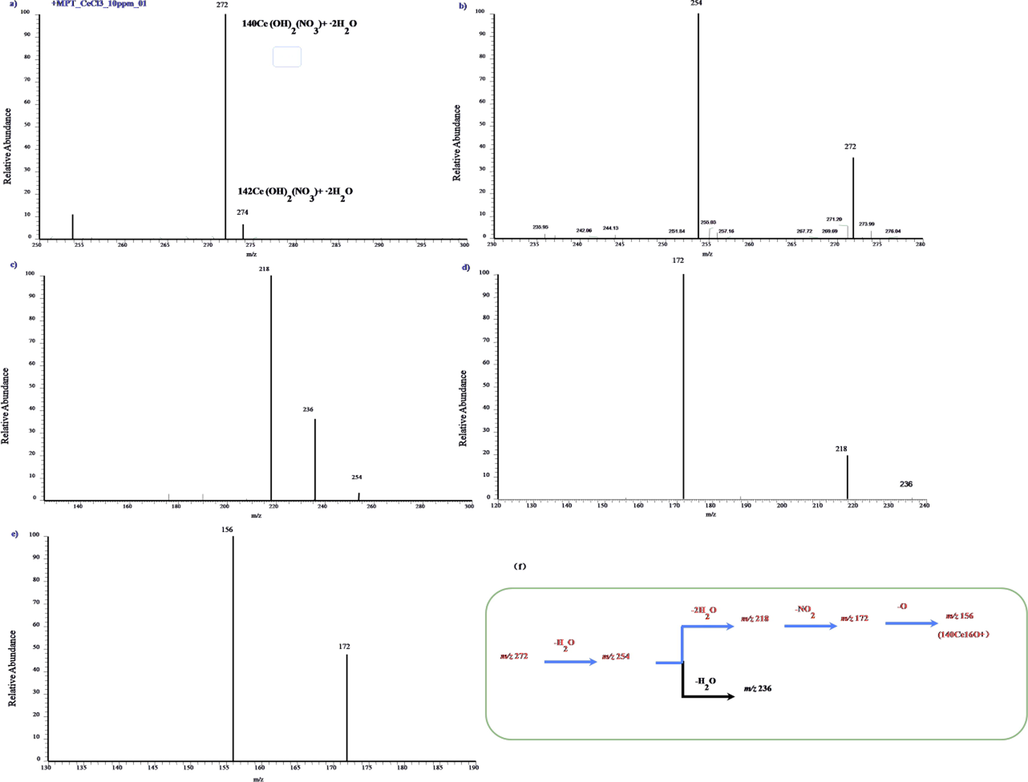
a) MPT-MS of ceriumchloride in positive ion mode in LTQ; b)-e) Tandem mass spectra of the precursor ion of m/z 272 obtained in LTQ; f) The dissociation scheme of the precursor ion of m/z 272 is summarized as a graphicalrepresentation.
Finally, look simply at the example of europium for later easy comparison with its own negative mode. As shown in Fig. 4, the outstanding peak appear at m/z 349, which can be assigned to [153Eu(NO3)2·4H2O]+, meeting the general rule mentioned above. The adjacent nearby peak at m/z 347, should be attributed to its isotopic peak. However, a certain puzzling problem is that the intensity ratios of these two peaks deviate from the corresponding abundance ratios of the two isotopes of europium, that is, 151Eu with a natural abundance of 47.8 % and 153Eu with a natural abundance of 52.2 %. This will cause some problems that hard to solve. Some other transition metal elements also show similar defects in positive mode. A stick contrast is that these ratios measure in negative mode will be more approximate to the abundant ration of the corresponding isotopes, demonstrating that the negative mode is more suitable to the detection of metal elements in particular applications, see next section. In Fig. 4, there are others remarkable peaks, such as m/z 331, 329. Obviously, they derive from the dissociation of m/z 349, 347 by losing a H2O molecule, respectively. The inset shows the concrete dissociated processes of m/z 349.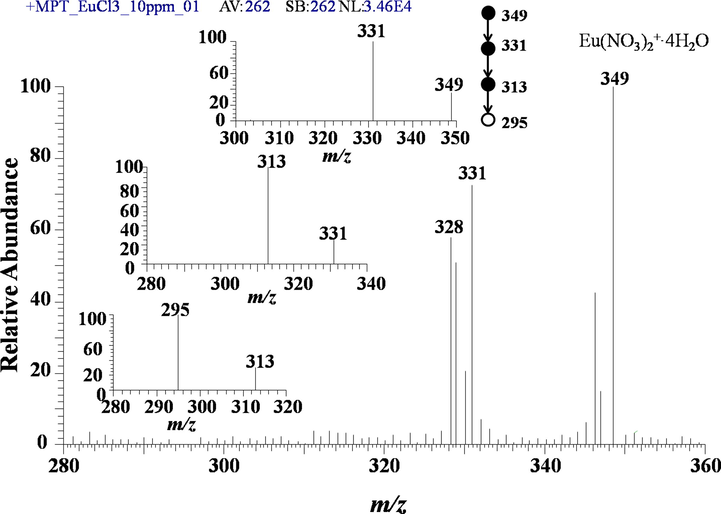
MPT-MS of europium chloride in positive ion mode in LTQ. The inset is dissociation scheme of the precursor ion of.
5.2 MPT mass spectra of REEs in negative mode
A lot of our work have shown that the negative mode of REEs in the MPT mass spectra have more suitable situation than that in the positive mode.Fig. 5 is the typical MPT mass spectrum of lanthanum in negative mode collected in the range of m/z 300–400, where a 10 mg/L lanthanum chloride solution was used. Clearly, different with its positive mode, the main peak appears atm/z 387with a relative weak peak located at m/z 324. This difference is 63, maybe due to a fragment from the precursor m/z 387 by losing a NO3-related group. Based on the previous empirical formula, this precursor m/z 387can be assigned to [La(NO3)4]-. Fig. 5 b)-d) is the MSn mass spectra of this precursor ion, n = 2, 3, 4, respectively. As shown, the precursor ions of m/z 387 produce first the fragment of m/z 341 by losing a NO2 group. Therein, there are still two in negligible peaks located at m/z 342 and 357, which may both stem from the rearrangement of the precursor ions in CID processes and cannot be explained explicitly. In MS3, sub-precursor of m/z 341 can produce the minor fragment of m/z 313 by the loss of NO group and the major fragment of m/z 295by throwing away a second NO2 group, and the fragment of m/z 295 yields are lative weak peak at m/z 263 by the loss of a O2 group and yields the peak at m/z 281 by losing a 14 Da group. The two fragment ions of m/z 263and 281cannot be divided further in collision induced dissociation. The fragment m/z 263 can be assigned easily to may be assigned to [La(NO3)2]-. Thereby, the ion of m/z 388 was assigned to [La(NO3)4]- is reasonable, which meets the general rules on the common anionic formation of transition metal elements in MPT plasma.(X. Xiong et al., 2015, C. Chu et al., 2016, X. Xiong et al., 2016(b), J. Yang et al., 2017).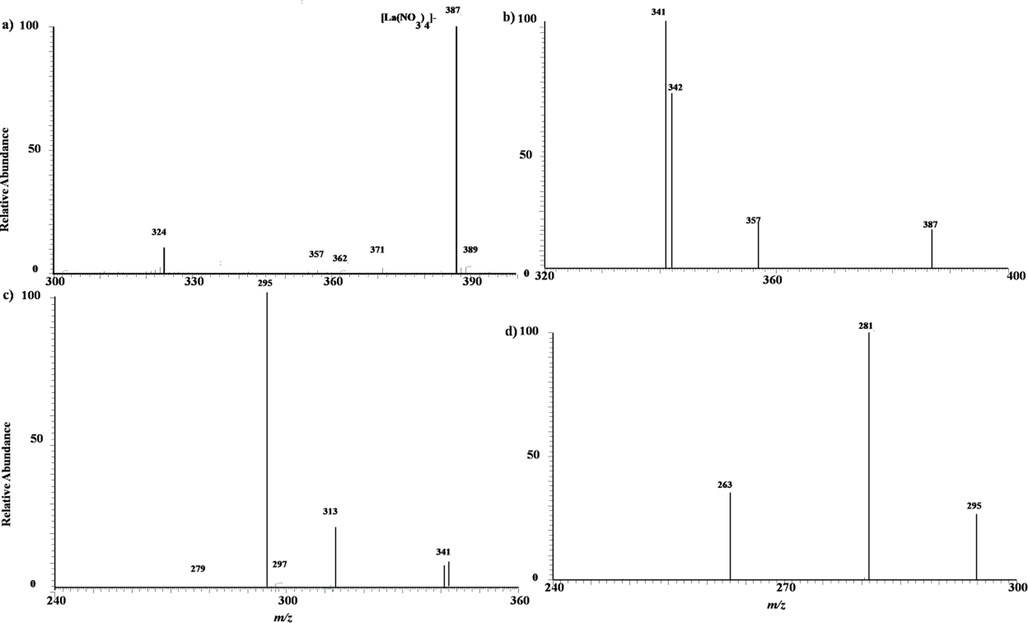
a) MPT-MS of lanthanumchloride in negative ion mode in LTQ; b)-d) Tandem mass spectra of the precursor ion of m/z 387 obtained in LTQ.
Praseodymium is also a single isotope rare earth element. Fig. 6 shows its MPT- LTQ mass spectra in negative mode. The main peak is m/z 389, assigned to [Pr(NO3)4]-, satisfying the feature of praseodymium’s isotope distribution. In this mass spectrum, there are two non-ignorable weak peaks, located at m/z 373 and m/z 343. The former is assigned to [Pr(NO3)3(NO2)]- by casting away an oxygen atom, and the latter is due to [PrO(NO3)3]-, the result of losing a NO2 group. Fig. 6 b)-d) exhibits the tandem mass spectra of m/z 389. In MS2, the mainly fragment peak is m/z 343, [PrO(NO3)3]-, and it further produce the third fragment m/z 297, [PrO2(NO3)2]-by throwing a second NO2 group. Finally, the fragment m/z 297 yields the ion m/z 265 by abandoning a 32 Da, O2 group. This multiple collision induced dissociation experiments verify the assignments about the complex ions of praseodymium.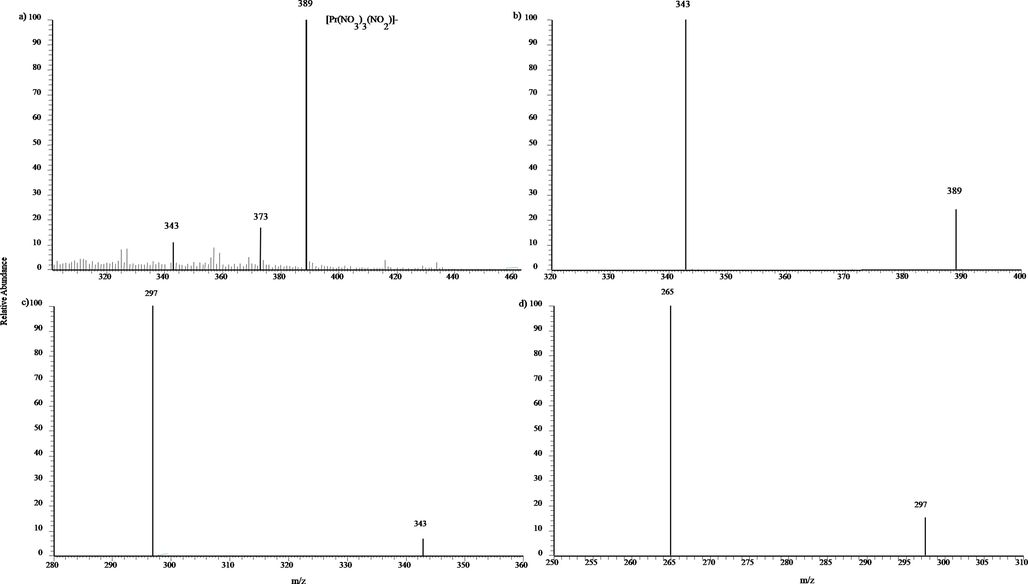
a) MPT-MS of praseodymium chloride in negative ion mode in LTQ; b)-d) Tandem mass spectra of the precursor ion of m/z 389 obtained in LTQ.
Next then, let’s look at neodymium. Relative to the almost single isotope of lanthanum, neodymium is a representative multiple isotopic elements, which has seven major natural isotopes: 142Nd with a natural abundance of 27.2 %, 143Nd with a natural abundance of 12.2 %, 144Nd with a natural abundance of 23.8 %, 145Nd with a natural abundance of 8.3 %, 146Nd with a natural abundance of 17.2 %, 148Nd with a natural abundance of 5.7 %, 150Nd with a natural abundance of 5.6 %. Fig. 6 is a typical MPT mass spectra collected from the experiments of 10 mg/L neodymium standard solution. As shown in Fig. 7a), there are seven-peak bands with central positions at m/z 390. The set of peak exhibits a feature of alternating stronger and weaker, which is according with the abundant distribution of europium’s seven major natural isotopes. Empirically, this mass spectral bands can be assigned tentatively to [Nd(NO3)4]-. The intensity ratio of major seven mass spectral peaks at m/z 390, 391, 392, 393, 394, 396 and 398 was 1:0.491:0.907:0.354:0.637:0.237:0.199, which was approximately agreed with the neodymium natural isotopic ratio (1:0.448:0.875: 0.305:0.632:0.209:0.206), and this values are obviously better than the corresponding one in positive mode.(X. Xiong et al., 2015)These results demonstrate that negative mode of MPT-MS are just more suitable for the detection of REEs. Although further studies are necessary on the overall low, one of the possible reasons is that the complicated ionization mechanism for metal ions in MPT plasma. Rigid verification still depends on the tandem mass spectrometry. Fig. 7b) show the MS2 spectra of the two representative mass spectral peaks, m/z 390 (upper plane) and 392 (lower plane), which evidently exhibited parallel feature, i.e. losing firstly aNO2group. Fig. 7 c) and d) show the MS2and MS3 spectra of another two representative mass spectral peaks, m/z 394 and m/z 396, respectively, also revealing the analogous fragmentation patterns. This analog supports the judgment that the set of seven-peak originates from the major natural isotopes of neodymium. Further tandem mass spectrometry experiments (not shown) exhibit the similar sequent feature with that of lanthanum and cerium.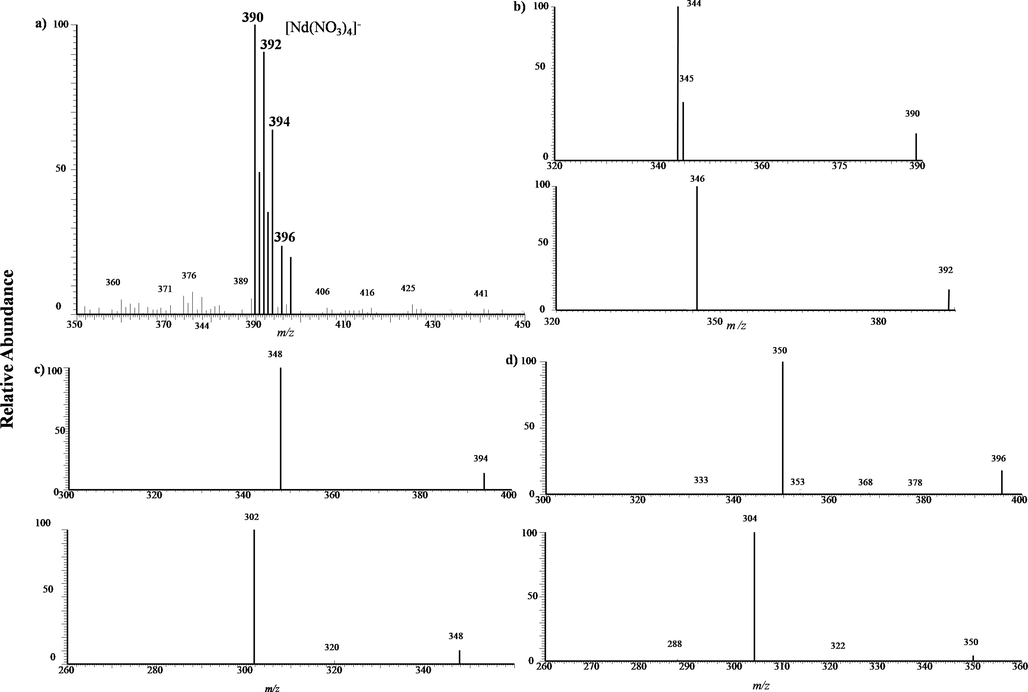
a) MPT-MS of neodymium chloride in negative ion mode in LTQ; b) Tandem mass spectra of the precursor ion of m/z 390(upper plane) and m/z 392(lower plane) obtained in LTQ. c) and d) Tandem mass spectra of the precursor ion of m/z 394 and 396, respectively, all exhibiting isotopic features.
Next again, turn to europium. As mentioned above, Europium has two natural isotopes: 151Eu and 153Eu. These two isotopes have nearly equal abundance. Fig. 8a) showed the typical MPT-LTQ mass spectra of europium collected from the experiments of 10 mg/L europium standard solution. The remarkable signal is a twin peak located at m/z 399 and 401, and the two peaks have roughly the same intensity, according with the distribution of europium’s isotopes. Following the above analysis, this two peaks are easily assigned to [151Eu(NO3)4]- and [153Eu(NO3)4]-. There are two pairs of miniature peaks located at m/z 337 and 339 as well as m/z 383 and 385. The former is due to the cleavage of the precursors by losing a NO3 group and the latter is owing to the loss of an Oxygen atom. The splitting phenomenon agrees with the cracking pattern mentioned above, refer to Fig. 8 b) and c) for the dissociated detailed.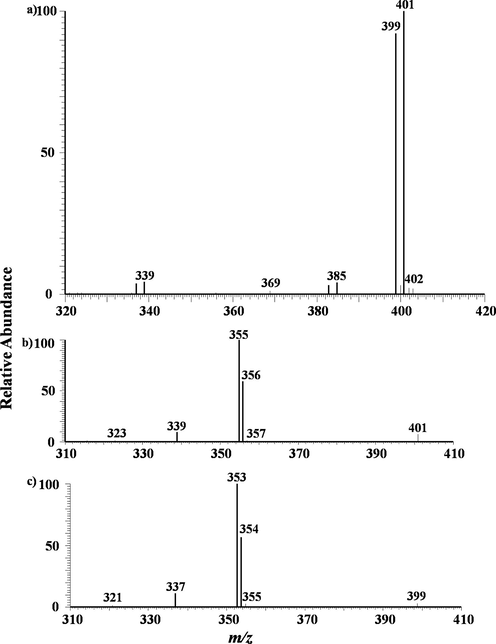
a) MPT-MS of europium chloride in negative ion mode in LTQ; b) Tandem mass spectra of the precursor ion of m/z 401 obtained in LTQ. c) Tandem mass spectra of the precursor ion of m/z 399 obtained in LTQ, similar with b) exhibiting isotopic features.
Finally, look briefly at the case of samarium, see Fig. 9. There are several mass spectral peaks in the range of m/z 390–405, including 392(13.69 %), 395(56.58 %),396(44.04 %), 397(53.36 %), 398(29.18 %), 400(100 %) and 402(80.57 %). And their intensities are interdigitated. The main peak m/z 400 can be assigned to [152Sm(NO3)4]-. Samarium is also a multiple isotopic element, which has seven natural isotopes: 144Sm with a natural abundance of 3.1 %, 147Sm with a natural abundance of 15.0 %, 148Sm with a natural abundance of 11.3 %, 149Sm with a natural abundance of 13.8 %, 150Sm with a natural abundance of 7.4 %, 152Sm with a natural abundance of 26.7 %, 150Sm with a natural abundance of 22.7 %. This fact fits in well with the measured intensity ratio.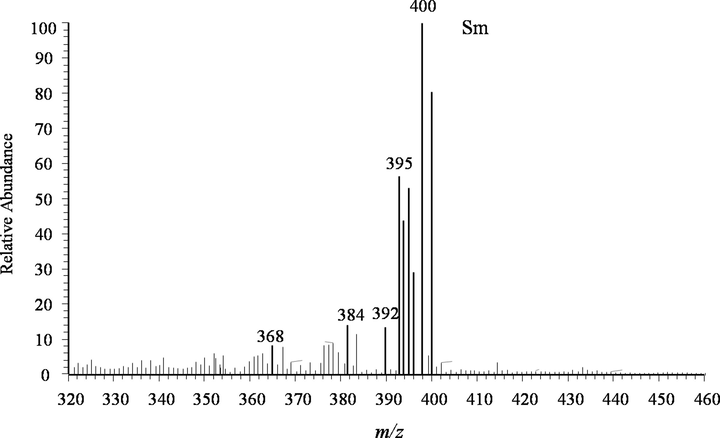
The MPT-MS of samarium chloride in negative ion mode in LTQ.
6 MPT-Q mass spectra of REEs
On another experimental platform, a homemade quadrupole mass spectrometer (Q-MS) combined with the same MPT ion source competed the above experiments under almost the same conditions(refer to Fig. 6 in Reference Xu et al(H. Xu et al., 2016)). Although the construction of this Q-MS is different with that of LTQ-MS, mainly due to the additional ion funnel structure (refer to Fig. 1also in Reference Xu et al) which leads to more frequent collision induced dissociation before the complex REEs ions entering the quadrupole filter. Consequently, only simple forms of REEs ions present in the result mass spectra, the intrinsic ion signals combined with the evaluating of the isotopic distribution comparing with the peak profile also give the directly evidences for the detection of REEs. Fig. 10 shows the typical MPT-Q mass spectra of some REEs. Fig. 10a) is the result using yttrium standard solution. The isolate strong peak at m/z 106 can be assigned to the ion of [90YO]+, well agree with the feature that yttrium is a natural monoisotopic rare earth element. Usually, these REEs under this research exist in + 3 valence state in aqueous solutions, however, they cannot exist in the form of single atomic kernel otherwise the observed mass-to-charge ration will be 90/3 = 30, which is too low to be detected in current quadruple mass spectrometer with the detected down limit is 50 Th. We did not also observe the signal of90Y+ ion in our mass spectrum, which originated from the result of charge state changing. More debates on charge state changing of REEs will be postponed in Section 7.2. This detected ions should be that they combine with an oxygen atom in the MPT plasma to form the ion [90YO]+.Fig. 10b) having the same characteristic is that of [139LaO]+. In addition, Fig. 10c) for cerium and Fig. 10d) for europium, are both double peaks of structure and the intensity ratio agree with their abundant distribution. Thus, it is easy to assign them to [CeO]+ and [EuO]+. In addition, a particle ore sample can be directly analyzed the contained several symbiotic REEs after only nitrification and dilution. Thus, this home-made MPT-Q mass spectrometer is enough for the actual REEs detection.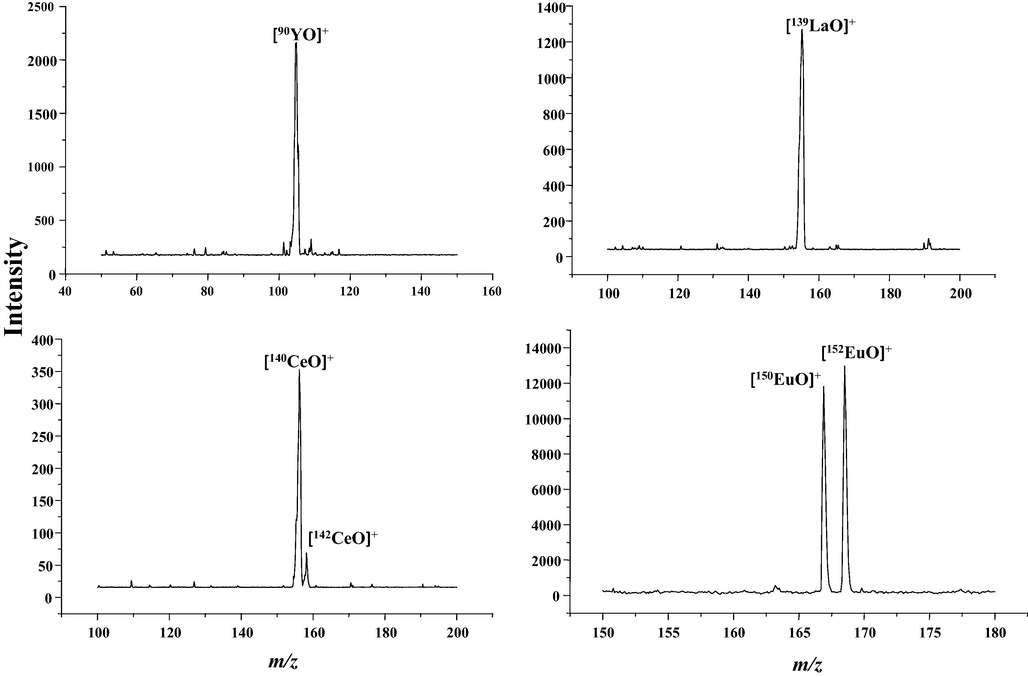
The MPT-MS of some REEs collected in Q-MS. a) yttrium; b)lanthanum; c) cerium;d)neodymium.
7 Discussion
7.1 The complex ions of REES produced in MPT plasma
From those mass spectral data, it can be seen that REEs exist commonly in complex ions in MPT plasma. From this point of view, it is different from ICP plasma. The most essential reason is that the temperature of MPT plasma is relatively low and it is not enough to strip all other atoms. Moreover, MPT works usually under ambient conditions and does open to the air. Therefore, there are several reagent ions in MPT plasma, such as NO3, NO2, O, H2O, OH and so on. These reagent ions, on one hand, make the REEs to be analyzed more complicated. On the other hand, for the same family elements, these complex ions are general in analogicalform. Studying these rules of forming complex ion certainly promote to identify these elements, rather than just isotopes distribution.
For REEs, the rules in the positive and negative complex modes are not completely identical. Comparing the positive mode, the negative ions of REES are more conformable. For all REES under this study the complex negative ions can be written uniformly in the form of [M(NO3)4]-(where, M represents rare earth element). And it can discard successivly a NO3 group or NO2 group even an O group in collision induced dissociation, depending on the collision energy and other related conditions. However, for the complex positive ions of REEs, the rules seem a bit complicated. In the previous works about the MPT mass spectra of the transition elements, a uniform formula was given: [M(NO3)m(NO2)n(OH)k(H2O)l]+(where, m, n, k, l represent integers or zero). Here, it is also easily that the complex positive ions meet this formula. While as the abandoned fragments in collision induced dissociation of REEs, H2O priority to OH, and then NO2, NO3, minimum case is of NO. The most concise ionic form occurs in the MPT-Q-MS, mainly the specific structure of ion funnel. For those REEs under what we studied, they all existed in the form of [MO]+ (However, it is not absolute for all metals. Refer to Reference Zhu et al(Z. Zhu et al., 2016)). These concise forms are certainly beneficial for the quantitative analysis.
7.2 Charge state changing
Metal ions are closely related to their own charge states. Thus, giving some discussions about the charge state changing of REEs in MPT plasma as well as the collision induced dissociation is intriguing. In our previous work, we had shown that for the transition metal element, molybdenum, the charge state in the complex ions produced in MPT plasma is independent of the initial solutions or samples. That is, molybdenum always exists its highest state, +6 state. However, for REEs, the commonest charge state is + 3 state, whether in the positive mode or in the negative mode, and whether in LTQ mass spectrometer or in quadruple mass spectrometer, maybe due to that the atomization efficiency of plasma produced by MPT is low. Those reagent ions do more likely play roles of making the REEs ion reaching its + 3 state. It is worth noting that in the initial solutions, REEs exist also in its + 3 state, which hints that MPT-MS may gain the information on the original valence states of some specialized metallic ions and have a potential as a supplement of ICP-MS for the morphological analysis of these specialized metal elements.
Understanding in detail the changes in the valence states of rare earth atoms and the evolution of complex particle structures during bonding is an intriguing and also a quite difficult challenge, which relies on the development of advanced computational tools. Considerable progresses have been made in this regard and relevant work of these respects may refer to a series of articles of Li et al.(N. Jiang et al., 2015, W. Huang et al., 2016, W.-L. Li et al., 2018, X. Chen et al., 2019, Z. Zhuo et al., 2019, Y. Zheng et al., 2020).
7.3 The quantitative analysis of REEs by using MPT mass spectrometers
In MPT-LTQ mass spectrometry, both the positive and negative mode can perform qualitative and quantitative analysis. As we have seen above, the noise of negative running mode is smaller than that of positive running mode, and the spectral structure and the dissociation pattern are more uniform in negative mode. It leads that the quantitative performance of MPT-LTQ negative MS is better than that in positive mode. Moreover, monitoring the major fragments in the MPT-MS2 mass spectra would give much lower limit of detection (LOD) values due to the less background noise. In addition, adopting secondary mass spectrum as the quantitative analysis can also surmount the disruption from some potential false signals, for example, resulting from the adjacent REEs isotopes. Therefore, the negative mode LTQ-MS2is adopted for the measurement semi-quantitatively of the concentration of single REE in water to verify the capacity of MPT-MS in the detection of REEs. Table 1summarized these measured quantitative data, where according to triple noise level, the LOD of this method employing LTQ-MS2 is estimated at the level of 0.1 ng/mL with the square correlation coefficient R2 larger than 0.99. Although, these LOD values are higher about one magnitude than those obtained in ICP-MS. Individually, the LOD for praseodymium is even as low as 0.04 μg/L, highly close to the level of ICP-MS. Besides, as mentioned above, MPT mass spectrometry possess its own unique advantages in quickly identifying and mass spectral features. Therefore, MPT-LTQ-MS is still of particularly special as an alternative supplement to the field analysis of REEs in water by ICP-MS.
element
MPT-LTQ-MS2
MTQ-Q-MS
Linear range (ng/mL)
R2
LOD (ng/mL)
RSD (n = 6, %)
Linear range (ng/mL)
R2
LOD (ng/mL)
RSD
Y
1–100
0.999
0.574
3–11
200–1000
0.981
60.51
5.4–11.2
La
1–250
0.998
0.2
7.8–14.1
50–300
0.937
17.12
2.7–13.8
Ce
1–250
0.998
0.29
6.3–9.4
50–600
0.971
21.51
1.6–8.6
Pr
1–100
0.999
0.04
2.4–10.1
–
–
–
–
Nd
1–250
0.998
0.114
3.6–14.7
50–1000
0.974
23.45
1.3–10.2
Sm
1–500
0.998
0.388
9.4–21.2
–
–
–
–
Eu
1–250
0.999
0.369
3–8.1
10–1000
0.981
11.03
3.8–19.0
Similarly, the quantitative analysis of REEs can be also performed on the MPT-Q mass spectrometer. Relative to the ion trap type of mass spectrometer, the quadruple mass spectrometer is unfavorable in this case and neither is the technique of second mass spectrometry quantifying. Thus, the LOD values obtained from MPT-Q mass spectrometer for parts of REEs are incomparable with those from ICP-MS, even LTQ-MS, only generally arriving at tens of ng/mL, two or three orders of magnitude larger than that of LTQ-MS2 (also see Table 1). Other quantitative indexes are comparable with those of MPT-LTQ-MS2, which means the MPT-MS itself is reliable in analysis of REEs in water samples.
Although ICP-MS has multi-advantages, the power-consume is high and the working conditions is relative rigor. The micro-wave power applied in MPT is about 10 % of that of ICP. Moreover, the MPT is certain popular-price so that it is suitable for the portable analysis and it meets the demands in field analysis and on-line of environmental water samples.
8 Conclusion
In this short review, we summarized integratedly the results on the MPT mass spectra of REEs, both MPT-LTQ MS and MPT-Q MS, including the characteristics of the complex ions of REEs and their dissociation rule, as well as the contrasts between both semi-quantitative analyses. We demonstrated that the MPT-MS is autility and reliable approach for the analysis of REEs in water at trace levels. Nevertheless, in real applications, this MPT-MS still ought to combine with extraction and separation methods to isolate single REE for more accurate analysis. Regardless, as a low-cost and sensitive method, it is still promising and can be used as a supplement of ICP applied in field analysis of REEs in water.
Acknowledgements
The corresponding authors are also grateful to the kindly discussion and assistance from Dr. Xiaohong Xiong and Mr. Shangxian Wang. This work was funding supported by National Science Foundation, China (No.21866027), the science and technology research project foundation of Jiangxi Provincial Department of education, China (No: GJJ190881) and Guangdong International Science and Technology Cooperation Project, China (No.2018A050506020).
Declaration of Competing Interest
The authors declare that they have no known competing financial interests or personal relationships that could have appeared to influence the work reported in this paper.
References
- Superadsorbent Fe3O4-coated carbon black nanocomposite for separation of light rare earth elements from aqueous solution: GMDH-based neural network and sensitivity analysis. J. Hazard. Mater.. 2021;416:1-15.
- [CrossRef] [Google Scholar]
- Atmospheric pressure chemical ionization source. 1. ionization of compounds in the gas phase. Anal. Chem.. 2008;80:2646-2653.
- [Google Scholar]
- Rare earth element mobility in and around carbonatites controlled by sodium, potassium, and silica. Sci. Adv.. 2020;6:1-10.
- [Google Scholar]
- Solvent extraction studies of rare Earths from thiocyanate medium with N, N, Ń, Ń-tetra(2-ethylhexyl) diglycolamide. Sep. Sci. Technol.. 2015;50:430-436.
- [CrossRef] [Google Scholar]
- Rapid and highly reproducible analysis of rare earth elements by multiple collector inductively coupled plasma mass spectrometry. Geochim. Cosmochim. Acta. 2002;66:3635-3646.
- [Google Scholar]
- Recent trends in the instrumental analysis of rare earth elements in geological and industrial materials. Trends Anal. Chem.. 1996;15:475-486.
- [Google Scholar]
- A close-up of three microwave plasma sources in view of improved element-specific detection in liquid chromatography. Spectrochim. Acta. 1998;53:331-338.
- [Google Scholar]
- Rare-earth fluorescence thermometry of laser-induced plasmon heating in silver nanoparticles arrays. Sci. Rep.. 2018;8:1-9.
- [CrossRef] [Google Scholar]
- Lanthanides with unusually low oxidation states in the PrB3(-) and PrB4(-) Boride clusters. Inorg. Chem.. 2019;58:411-418.
- [CrossRef] [Google Scholar]
- Grain size distribution and clay mineral distinction of rare Earth ore through different methods. Minerals. 2020;10:1-27.
- [CrossRef] [Google Scholar]
- Instrumentation and characterization of surface desorption atmospheric pressure chemical ionization mass spectrometry. Chinese J. Anal. Chem.. 2007;35:1233-1240.
- [CrossRef] [Google Scholar]
- Rare earth nanoparticles prevent retinal degeneration induced by intracellular peroxides. Nat. Nanotechnol.. 2006;1:142-150.
- [Google Scholar]
- Online sequential fractionation analysis of arsenic adsorbed onto ferrihydrite by ICP-MS. Anal. Chem.. 2020;92:14309-14313.
- [CrossRef] [Google Scholar]
- Rare earth element transfer from soil to navel orange pulp (Citrus sinensis Osbeck cv. Newhall) and the effects on internal fruit quality. PLoS ONE. 2015;10:1-15.
- [CrossRef] [Google Scholar]
- Direct determination of rare Earth elements in REE ores using microwave plasma torch coupled with quadrupole mass spectrometry. Rock Miner. Anal.. 2016;35:468-474.
- [CrossRef] [Google Scholar]
- Design and development of a highly sensitive, field portable plasma source instrument for on-line liquid stream monitoring and real-time sample analysis. Rev. Sci. Instrum.. 2000;71:1557-1563.
- [CrossRef] [Google Scholar]
- G.Farmaki, E., N. S.Thomaidis, K. S.Minioti, et al., 2012. Geographical Characterization of Greek Olive Oils Using Rare Earth Elements Content and Supervised Chemometric Techniques. Analytical Letters. 45, 920-932. https://doi.org/10.1080/00032719.2012.655656.
- Development of a miniature simultaneous MPT spectrometer. Microchem. J.. 2004;76:17-22.
- [CrossRef] [Google Scholar]
- Determination of the rare-earth:Nb mass ratio in doped LiNbO3 by the TXRF technique. J. Anal. At. Spectrom.. 2001;16:867-869.
- [CrossRef] [Google Scholar]
- The role of ultrafast magnon generation in the magnetization dynamics of rare-earth metals. Sci. Adv.. 2020;6:1-7.
- [Google Scholar]
- Geometry-independent neutral desorption device for the sensitive EESI-MS detection of explosives on various surfaces. Analyst. 2010;135:779-788.
- [CrossRef] [Google Scholar]
- Principal component directed partial least squares analysis for combining nuclear magnetic resonance and mass spectrometry data in metabolomics: application to the detection of breast cancer. Anal. Chim. Acta. 2011;686:57-63.
- [CrossRef] [Google Scholar]
- Low-temperature plasma probe for ambient desorption ionization. Anal. Chem.. 2008;80:9097-9104.
- [Google Scholar]
- Ambient sampling/ionization mass spectrometry: applications and current trends. Anal. Chem.. 2011;83:4508-4538.
- [CrossRef] [Google Scholar]
- An improved method for TIMS high precision neodymium isotope analysis of very small aliquots (1–10 ng) Chem. Geol.. 2009;258:251-257.
- [CrossRef] [Google Scholar]
- Physiological and biochemical effects of rare earth elements on plants and their agricultural significance: a review. J. Plant Nutr.. 2004;27:183-220.
- [Google Scholar]
- Progress of separation and determination methods for rare Earth elements. J. Chinese Rare Earth Soc.. 2006;24:513-522.
- [Google Scholar]
- On the highest oxidation states of metal elements in MO4 molecules (M = Fe, Ru, Os, Hs, Sm, and Pu) Inorg. Chem.. 2016;55:4616-4625.
- [CrossRef] [Google Scholar]
- Lanthanide contraction and magnetism in the heavy rare earth elements. Nature. 2007;446:650-653.
- [CrossRef] [Google Scholar]
- Jankowski, K. J. and E. Reszke, 2010. Microwave Induced Plasma Analytical Spectrometry. , RSC Publishing, Milton Road, Cambridge, UK.
- Direct mass spectrometric analysis of zinc and cadmium in water by microwave plasma torch coupled with a linear ion trap mass spectrometer. Int. J. Mass Spectrom.. 2016;399–400:33-39.
- [CrossRef] [Google Scholar]
- Rapid analysis of tetracycline in honey by microwave plasma torch mass spectrometry with ablation samples. Anal. Methods. 2020(a);12:535-543.
- [CrossRef] [Google Scholar]
- An easy and simple kilowatt-MPT-MS-based metal elements analysis method for rapid environmental water monitoring: an example from Poyang Lake of China. Arabian J. Chem.. 2020(b);13:7939-7952.
- [CrossRef] [Google Scholar]
- Comparative study on a kilowatt-MPT-MS-based method with two ion polarity modes for the inert palladium metal. Analyst. 2021;146:1760-1771.
- [CrossRef] [Google Scholar]
- Determination of trace europium by use of the new fluorescence system europium-sparfloxacin-1,10-phenanthroline-sodium dodecyl sulfate. Anal. Bioanal. Chem.. 2003;377:681-684.
- [CrossRef] [Google Scholar]
- Theoretical studies on Hexanuclear Oxometalates [M6L19](q-) (M = Cr, Mo, W, Sg, Nd, U). electronic structures, oxidation states, aromaticity, and stability. Inorg. Chem.. 2015;54:7171-7180.
- [CrossRef] [Google Scholar]
- XRD and TEM analyses of a simulated leached rare earth ore deposit: implications for clay mineral contents and structural evolution. Ecotoxicol. Environ. Saf.. 2021;225:1-12.
- [CrossRef] [Google Scholar]
- Atomic emission detector for gas chromatography and supercritical fluid chromatography. J. Anal. Atomic Spectromet.. 1990;5:487-494.
- [Google Scholar]
- A microwave plasma torch assembly for atomic emission spectrometry. Spectrochim. Acta. 1991;46B:417-430.
- [Google Scholar]
- Identification of the geographical origin of pumpkin seed oil by the use of rare earth elements and discriminant analysis. Food Chem.. 2010;123:1303-1309.
- [CrossRef] [Google Scholar]
- New method of water purification based on the particle-exclusion phenomenon. Environ. Sci. Technol.. 2008;42:6160-6166.
- [Google Scholar]
- Koornneef, J. M., N. ikogosian, M. J. v. Bergen, et al., 2015. TIMS analysis of Sr and Nd isotopes in melt inclusions from Italian potassium-rich lavas using prototype 1013Ω amplifiers. Chemical Geology. 397, 14-23. https://doi.org/10.1016/j.chemgeo.2015.01.005.
- Intense near-infrared-II luminescence from NaCeF4:Er/Yb nanoprobes for in vitro bioassay and in vivo bioimaging. Chem. Sci.. 2018;9:4682-4688.
- [CrossRef] [Google Scholar]
- Discriminations of the geographical origin of peach based on stable isotope and rare Earth element fingerprint characteristics. Food Sci.. 2020;41:322-328.
- [CrossRef] [Google Scholar]
- Chemical bonding of crystalline LnB6 (Ln = La-Lu) and its relationship with Ln2B8 gas-phase complexes. Inorg. Chem.. 2018;57:12999-13008.
- [CrossRef] [Google Scholar]
- Geochemical characteristics of rare earth elements in rock soil plant system in blueberry core production area of Guizhou Province. J. Chinese Soc. Rare Earths. 2021;39:653-662.
- [CrossRef] [Google Scholar]
- Desorption corona beam ionization coupled with a Poly(dimethylsiloxane) substrate: broadening the application of ambient ionization for water samples. Anal. Chem.. 2010;82:9188-9193.
- [Google Scholar]
- Research progress on rare earth in the damage of human health. China Occup. Med.. 2019;46:625-632.
- [Google Scholar]
- MetAlign: interface-driven, versatile metabolomics tool for hyphenated full-scan mass spectrometry data preprocessing. Anal. Chem.. 2009;81:3079-3086.
- [Google Scholar]
- Inductively coupled plasma mass spectrometry: a versatile tool for a variety of different tasks. Fresenius J. Anal. Chem.. 2000;366:159-164.
- [Google Scholar]
- Mixtures of rare earth elements show antagonistic interactions in Chlamydomonas reinhardtii. Environ. Pollut.. 2021;287:1-8.
- [CrossRef] [Google Scholar]
- Development of a dielectric barrier discharge ion source for ambient mass spectrometry. J. Am. Soc. Mass Spectrom.. 2007;18:1859-1862.
- [CrossRef] [Google Scholar]
- Rare Earth elements removal from water using natural polymers. Sci. Rep.. 2018;8:1-11.
- [CrossRef] [Google Scholar]
- High-throughput screening for discovery of benchtop separations systems for selected rare earth elements. Commun. Chem.. 2020;3:1-6.
- [CrossRef] [Google Scholar]
- Origin characteristics of rare Earth elements in tea in South Shaanxi Province. J. Chinese Soc. Rare Earths. 2014;32:759-763.
- [CrossRef] [Google Scholar]
- Unexpected water flow through Nafion-tube punctures. Phys. Rev.. 2011;83:1-5.
- [CrossRef] [Google Scholar]
- Determination of rare earth elements in carbonatites from the Kangankunde Mine, Malawi by instrumental neutron activation analysis. J. Radioanal. Nucl. Chem.. 2003;257:433-435.
- [Google Scholar]
- Determination of halogenated hydrocarbons by helium microwave plasma torch time-of-flight mass spectrometry coupled to gas chromatography. Anal. Chem.. 1998;70:3957-3963.
- [Google Scholar]
- Extraction behavior of yttrium with Aliquat336 from nitrate and thiocyanate media: A microscopic view from computational analysis. Mater. Today Commun.. 2021;28:1-9.
- [CrossRef] [Google Scholar]
- Principal component analysis of urine metabolites detected by NMR and DESI-MS in patients with inborn errors of metabolism. Anal. Bioanal. Chem.. 2007;387:539-549.
- [CrossRef] [Google Scholar]
- Preconcentration and atomic spectrometric determination of rare earth elements (REEs) in natural water samples by inductively coupled plasma atomic emission spectrometry. Anal. Chim. Acta. 2005;547:42-49.
- [CrossRef] [Google Scholar]
- D.Pollack, G., E. J.Krogstad and A. Bekker, 2009. U–Th–Pb–REE systematics of organic-rich shales from the ca. 2.15 Ga Sengoma Argillite Formation, Botswana: Evidence for oxidative continental weathering during the Great Oxidation Event. Chemical Geology. 260, 172-185. https://doi.org/10.1016/j.chemgeo.2008.10.038.
- Surface analysis under ambient conditions using plasma-assisted desorption/ionization mass spectrometry. Anal. Chem.. 2007;79:6094-6101.
- [Google Scholar]
- Online monitoring of air quality at the postanesthetic care unit by proton-transfer-reaction mass spectrometry. Anesth. Analgesia. 2001;92:389-392.
- [Google Scholar]
- Generation of a Gluconobacter oxydans knockout collection for improved extraction of rare earth elements. Nat. Commun.. 2021;12:1-11.
- [CrossRef] [Google Scholar]
- Rapid unseparated rare earth element analyses by isotope dilution multicollector inductively coupled plasma mass spectrometry (ID-MC-ICP-MS) Int. J. Mass Spectrom.. 2022;471:1-9.
- [CrossRef] [Google Scholar]
- XCMS: processing mass spectrometry data for metabolite profiling using nonlinear peak alignment, matching, and identification. Anal. Chem.. 2006;78:779-787.
- [Google Scholar]
- Determination of hexabromocyclododecane by flowing atmospheric pressure afterglow mass spectrometry. Talanta. 2014;128:58-62.
- [CrossRef] [Google Scholar]
- Synthesis and application of biocompatible nontoxic nanoparticles for reclamation of Ce3+ from synthetic wastewater: toxicity assessment, kinetic, isotherm and thermodynamic study. J. Rare Earths. 2018;36:994-1006.
- [Google Scholar]
- Microplasma discharge ionization source for ambient mass spectrometry. Anal. Chem.. 2010;82:621-627.
- [Google Scholar]
- Microplasma discharge vacuum ultraviolet photoionization source for atmospheric pressure ionization mass spectrometry. J. Am. Soc. Mass Spectromet.. 2014;25:1557-1564.
- [CrossRef] [Google Scholar]
- Mass spectrometry sampling under ambient conditions with desorption electrospray ionization. Science. 2004;306:471-473.
- [Google Scholar]
- Soil scientists are tracking down rare and endangered soils in a quest to document and preserve—“pedodiversity”. Science. 2014;346:692-695.
- [Google Scholar]
- Desorption–ionization on silicon mass spectrometry: an application in forensics. Anal. Chim. Acta. 2001;442:183-190.
- [Google Scholar]
- Rapid recovery of rare earth elements in industrial wastewater by CuFe 2 O 4 synthesized from Cu sludge. J. Rare Earths. 2018;36:513-520.
- [CrossRef] [Google Scholar]
- The phosphorus fertilizer production as a source of rare-earth elements pollution of the environment. Joint Institute for Nuclear Research; 1989.
- Desorption corona beam ionization source for mass spectrometry. Analyst. 2010;135:688-695.
- [CrossRef] [Google Scholar]
- Recent applications of liquid chromatography-mass spectrometry in forensic science. J. Chromatogr. A. 2006;1130:3-15.
- [CrossRef] [Google Scholar]
- Direct determination of 14 trace rare Earth elements in high purity Nd2 O3 by triple quadrupole inductively coupled-plasma mass spectrometry. Chin. J. Anal. Chem.. 2015;43:697-702.
- [CrossRef] [Google Scholar]
- Rare earth elements in soil and in soil-grown plants. Plant Soil. 1998;199:267-273.
- [Google Scholar]
- Some rare Earth elements analysis by microwave plasma torch coupled with the linear ion trap mass spectrometry. Int. J. Anal. Chem.. 2015;2015:1-10.
- [CrossRef] [Google Scholar]
- Microwave plasma torch mass spectrometry for the direct detection of copper and molybdenum ions in aqueous liquids. J. Mass Spectrom.. 2016(a);51:369-377.
- [CrossRef] [Google Scholar]
- Detection of common transition metal in water by microwave plasma torch mass spectra in negative ion mode. Chem. J. Chinese Univ.. 2016(b);37:867-872.
- [Google Scholar]
- The study of bismuth ions in drinking water at ultratrace levels by a microwave plasma torch coupled with linear ion trap mass spectrometry. Anal. Methods. 2018;10:1346-1352.
- [CrossRef] [Google Scholar]
- Rare Earths. Bejing: China, Metallurgical Industry Press; 1995.
- Design and performance evaluation of a novel ion funnel driven by a phase-modulated rectangular wave. Rapid Commun. Mass Spectromet.. 2016;30:1079-1086.
- [CrossRef] [Google Scholar]
- Detection of melamine in milk products by surface desorption atmospheric pressure chemical ionization mass spectrometry. Anal. Chem.. 2009;81:2426-2436.
- [CrossRef] [Google Scholar]
- The functions of transferrin and its receptor with lanthan ides and other metal ions. Prog. Chem.. 2002;14:287-291.
- [Google Scholar]
- The study of titanium and zirconium ions in water by MPT-LTQ mass spectrometry in negative mode. Int. J. Environ. Res. Public Health. 2017;14:1-10.
- [CrossRef] [Google Scholar]
- Application of heavy rare earth elements as a fingerprint in discriminant analysis of An’xi Tieguanyin Tea and Hua’an Tieguanyin Tea. Modern Food Sci. Technol.. 2017;33:295-299.
- [CrossRef] [Google Scholar]
- Determination of major and rare earth elements in bastnasite ores by ICP-AES. Anal. Lett.. 2004;37:2701-2709.
- [CrossRef] [Google Scholar]
- Enhanced proton conductivity of Nafion composite membrane by incorporating phosphoric acid-loaded covalent organic framework. J. Power Sources. 2016;332:265-273.
- [CrossRef] [Google Scholar]
- Swelling of clay minerals in ammonium leaching of weathered crust elution-deposited rare earth ores. Rare Met.. 2017;37:72-78.
- [CrossRef] [Google Scholar]
- Effects of rare earth elements on bacteria in rhizosphere, root, phyllosphere and leaf of soil-rice ecosystem. Sci. Rep.. 2022;12:1-17.
- [CrossRef] [Google Scholar]
- Application of rare earth element fingerprints in discrimination of navel orange from differ- ent bedrock areas in Ningdu. J. Chinese Rare Earth Soc. 2021:1-9.
- [Google Scholar]
- Direct desorption/ionization of analytes by microwave plasma torch for ambient mass spectrometric analysis. J. Mass Spectrom.. 2013;48:669-676.
- [CrossRef] [Google Scholar]
- 2-Butene Tetraanion Bridged Dinuclear Samarium(III) complexes via Sm(II)-mediated reduction of electron-rich olefins. J. Am. Soc.. 2020;142:10705-10714.
- [CrossRef] [Google Scholar]
- Lanthanide-doped upconversion nano-bioprobes: electronic structures, optical properties, and biodetection. Chem. Soc. Rev.. 2015;44:1379-1415.
- [CrossRef] [Google Scholar]
- Nanophotonic coherent light-matter interfaces based on rare-earth-doped crystals. Nat. Commun.. 2015;6:1-6.
- [CrossRef] [Google Scholar]
- Nanophotonic rare-earth quantum memory with opticlly controlled retrieval. Science. 2017;357:1392-1395.
- [Google Scholar]
- In vivo molecular imaging for immunotherapy using ultra-bright near-infrared-IIb rare-earth nanoparticles. Nat. Biotechnol.. 2019;37:1322-1331.
- [Google Scholar]
- A microwave plasma torch quadrupole mass spectrometer for monitoring trace levels of lead and cadmium in water. Rapid Commun. Mass Spectromet.. 2016;30(Suppl 1):44-50.
- [CrossRef] [Google Scholar]
- A perspective on studying electronic structure of batteries through soft X-ray spectroscopy. Chin. J. Struct. Chem.. 2019;38:1909-1915.
- [CrossRef] [Google Scholar]


