

Translate this page into:
MonoTip C18 pipette tip solid-phase extraction coupled with liquid chromatography-tandem mass spectrometry enables rapid and automated therapeutic drug monitoring of tyrosine kinase inhibitors
⁎Corresponding authors. dichen@zzu.edu.cn (Di Chen), fccxiey@zzu.edu.cn (Ya Xie), 13503823257@163.com (Nian Shi)
-
Received: ,
Accepted: ,
This article was originally published by Elsevier and was migrated to Scientific Scholar after the change of Publisher.
Abstract
This work presents an advanced automated monolithic C18 pipette-tip solid-phase extraction (PT-SPE) method seamlessly integrated with liquid chromatography-tandem mass spectrometry (LC-MS/MS) for precise therapeutic drug monitoring of eleven tyrosine kinase inhibitors (TKIs) in biological samples. Commercially available MonoTip C18 columns facilitate superior extraction efficiency and selectivity from complex biological matrices owing to their large surface areas and enhanced mass transfer capabilities. The sample preparation process, conducted by aspirating and dispensing solutions using a pipettor, completes the overall extraction process within 3 min. The method validation demonstrated excellent linearity within the range of 0.2/0.5/0.8 to 200 ng/mL, with detection limits ranging from 0.049 to 0.206 ng/mL. The method exhibited outstanding accuracy and precision, with intraday relative recovery rates ranging from 96.3 % to 115.0 % and interday recovery rates ranging from 95.0 % to 115.7 %, with coefficient of variation values consistently below 13.8 %. The proposed method is distinguished by its exceptional efficiency, reduced solvent use, enhanced environmental sustainability, and streamlined automation—key advantages in the realm of clinical therapeutic drug monitoring of TKIs. Overall, the MonoTip C18 PT-SPE technique, coupled with LC-MS/MS, offers a formidable, eco-friendly, and effective strategy for the TDM of TKIs, marking a significant advancement in the field.
Keywords
Tyrosine kinase inhibitors
Therapeutic drug monitoring
Pipette-tip solid-phase extraction
Liquid chromatography-tandem mass spectrometry
Bioanalysis

1 Introduction
In recent years, the landscape of cancer treatment has significantly evolved with the increasing exploration and approval of tyrosine kinase inhibitors (TKIs) for the management of malignancies and other diseases (Khamouli et al., 2024; Petrazzuolo et al., 2022). These agents have become an integral part of therapeutic regimens due to their potent molecular activity and promising pharmacodynamics in combating malignant conditions (Sunder et al., 2023). However, despite their efficacy at the molecular level, TKIs present pharmacokinetic profiles that pose challenges to their optimal clinical application (Chen et al., 2024; Ye et al., 2024).
Typically, administered orally, the metabolism of these TKIs is largely governed by cytochrome P450 enzymes, which are susceptible to induction or inhibition by various dietary and pharmacological agents. This leads to pronounced inter- and intra-individual variability in drug metabolism, potentially resulting in subtherapeutic or, conversely, toxic plasma levels of TKIs (Vavrová et al., 2022). This complexity is further compounded by the initial dosing strategy, which does not account for the wide variability observed among patients, as well as factors such as poor prognosis, pharmacodynamic issues such as receptor mutations, and patient adherence to treatment regimens (Guengerich, 2021).
Given these challenges, therapeutic drug monitoring (TDM) has emerged as a pivotal tool for optimizing the use of TKIs. TDM, which involves measuring drug concentrations in blood, can significantly enhance treatment outcomes by tailoring dosages to individual patient needs, thereby mitigating adverse effects and contributing to cost-effectiveness in healthcare (Bian et al., 2021). This approach is particularly valuable for drugs such as TKIs, where interindividual pharmacokinetic variability is marked. The development of reliable, sensitive methods for determining TKI concentrations, such as liquid chromatography-tandem mass spectrometry (LC-MS/MS), is crucial for the successful implementation of TDM in clinical settings, ensuring that patients receive the most effective and safe levels of these vital medications (Jung et al., 2019; Puisset et al., 2023).
However, the quantitative determination of drugs within complex biological matrices presents a significant challenge in the field of bioanalysis. The drug of interest is embedded in a biological matrix with a complex biochemical composition, encompassing a broad spectrum of components, including salts, acids, bases, proteins, cells, and a variety of small organic molecules, both exogenous and endogenous, such as lipids and lipoproteins (Briki et al., 2024). Consequently, even with the high selectivity and sensitivity afforded by advanced analytical techniques such as LC-MS/MS, these methods are not entirely free from complications such as matrix effects (Gniazdowska and Rudzki, 2023; Nasiri et al., 2021). These effects can diminish the selectivity of the methods and reduce the sensitivity for the analyte of interest in the processed biological sample.
Therefore, sample preparation has become a critical step in bioanalytical methods (Li et al., 2021). Essentially, the goal of sample preparation is to selectively isolate the analyte of interest from the surrounding matrix, reduce or eliminate the presence of matrix components in the final sample, and, if necessary, concentrate the analyte to detectable levels (Bylda et al., 2014; Kole et al., 2011). It is also the most labor intensive and prone to errors, highlighting the need for robust, reproducible methods in the development of techniques for the determination of various tyrosine kinase inhibitors through sample preparation and LC-MS/MS (Miura and Takahashi, 2016). Currently, numerous sample preparation techniques have been developed for the analysis of TKIs (Ye et al., 2024). Liquid-liquid extraction and its derivative microextraction methods, such as salting-out-assisted liquid–liquid extraction and hollow-fiber liquid-phase microextraction, have gained popularity because of their broad extraction capabilities and gentle conditions (Ahmed et al., 2020; Hooshmand and Es'haghi, 2018; Zhuang et al., 2017). However, these methods often lack selectivity because they rely solely on the differential partition coefficients of analytes between two phases (Li et al., 2021). Solid-phase extraction (SPE) has become a go-to approach for TKI pretreatment due to the vast array of column types and sorbents available (Andrade-Eiroa et al., 2016). Notably, the emergence of innovative microextraction techniques, such as solid-phase microextraction (SPME), has enhanced extraction efficiency while adhering to the principles of green chemistry by reducing the use of organic solvents. Various SPME configurations, including biocompatible SPME, hollow-fiber SPME, and thin-film SPME, have been introduced (Gómez-Ríos et al., 2016; Hatamluyi and Es'haghi, 2017; Khodayari et al., 2021). Despite these advancements, the reported methods for TKI sample preparation often involve cumbersome material preparation or complex sample pretreatment steps, or they require skilled personnel for precise operation, which hinders automation. This lack of robustness and the difficulty in method transfer across laboratories pose significant barriers to their widespread application. For TDM of TKIs in clinical settings, the development of robust methods that allow seamless integration with online automation in analytical equipment is crucial (Singh and Bast, 2015).
This study focused on the development of an automated monolithic C18 pipette-tip solid-phase extraction (PT-SPE) method seamlessly integrated with LC-MS/MS for the accurate determination of eleven TKIs. This method leverages the unique properties of commercially available MonoTip C18 columns, such as large surface areas and enhanced mass transfer capabilities, to provide superior extraction efficiency and selectivity from complex biological matrices. Efforts were made to optimize the extraction parameters, ensuring optimal recovery and sensitivity for the targeted TKIs. A comprehensive evaluation of the method's performance, including its accuracy, precision, limit of detection, and limit of quantification, was conducted across various biological samples. A comparative analysis with traditional extraction methods was conducted, emphasizing the assessment of the efficiency, solvent consumption, and environmental impact of the proposed method. This evaluation aimed to highlight the method's enhanced efficiency, reduced solvent usage, improved environmental sustainability, and ease of automation.
2 Materials and methods
2.1 Chemicals and reagents
Methanol (MeOH), ethanol (EtOH), and acetonitrile (ACN) of HPLC grade were obtained from Shanghai Pharmaceutical Group Chemical Reagent Co., Ltd. Acetone (AC) of GC grade, potassium dihydrogen phosphate (purity ≥ 99 %), and phosphoric acid (purity ≥ 85 %) were obtained from Shanghai Aladdin Biochemical Technology Co., Ltd. Analytical grade sodium hydroxide (NaOH) was obtained from Tianjin Zhiyuan Chemical Reagent Co., Ltd. Erlotinib (Erl), ibrutinib (Ibru), pazopanib (Paz), afatinib (Afa), nilotinib (Nilo), dasatinib (Dasa), and sunitinib (Suni) were obtained from Aladdin Biochemical Technology Co., Ltd., located in Shanghai, China. Imatinib (Ima), crizotinib (Criz), ceritinib (Cer), gefitinib (Gef) and cyproconazole (a pesticide, used as an internal standard due to its moderate hydrophobicity and the absence of endogenous interference in plasma) were procured from Shanghai Yien Chemical Technology Co., Ltd., which is also based in Shanghai, China. Deionized water was obtained from a Milli-Q water purification system (Millipore, Billerica, MA, USA). The chemical structures of the 11 TKIs analyzed in this study are shown in Fig. 1.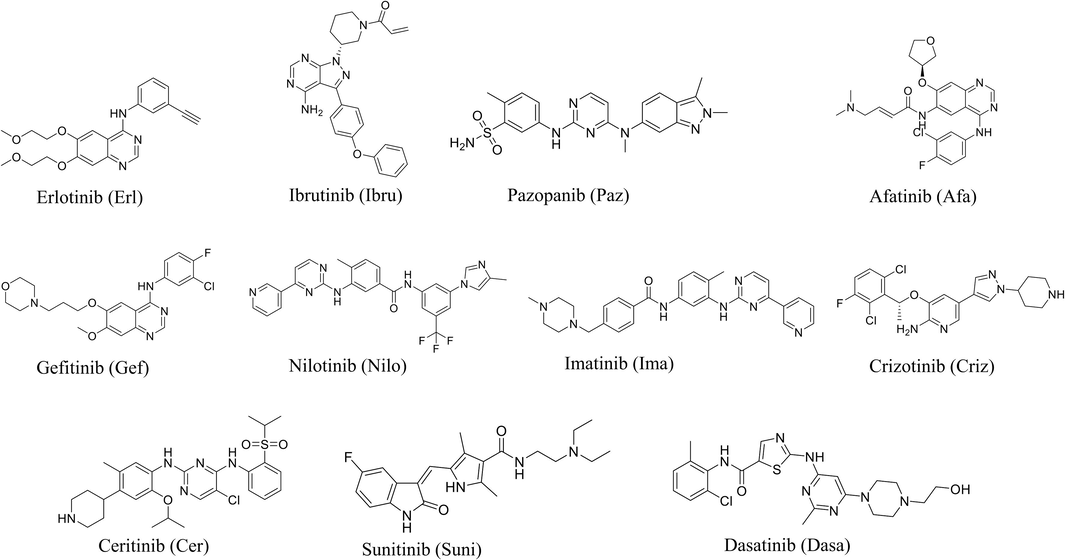
Chemical structures of the 11 TKIs analyzed in this study.
A mixed standard solution of eleven TKIs at a concentration of 1 mg/mL was prepared in DMSO and stored at −20 °C for subsequent experiments. For subsequent experiments, the standard solution was initially diluted with ACN to a concentration of 10 μg/mL and further diluted with deionized water to the desired concentration. The internal standard stock solution was prepared at a concentration of 1 mg/mL in ACN.
2.2 Sample sources and pretreatment
Blank plasma samples were collected from healthy volunteers aged 25 to 40 years who had not been exposed to any drugs for at least one year at the First Affiliated Hospital of Zhengzhou University, Henan, China. Special care should be taken during the handling of plasma samples to avoid possible hemolysis, as it may affect the results. The collection and use of these samples were conducted with the approval of the Ethics Committee of the First Affiliated Hospital of Zhengzhou University, Henan, China.
To prepare spiked samples at the desired concentrations, TKIs and internal standards were added to the blank plasma samples. Subsequently, 100 μL of the spiked plasma sample was mixed with 200 μL of ethanol for protein precipitation. The supernatant was then obtained by high-speed centrifugation (15000 rpm) and diluted to 1 mL with distilled water. Finally, the resulting solution underwent PT-SPE processing.
2.3 The PT-SPE procedure
Commercially available MonoTip C18 pipette tips from GL Sciences™ Inc., Japan, were used for PT-SPE. As described in the product manual, the design features a silica monolith modified with a C18 functional group (Turoňová et al., 2021). This monolithic silica comprises a dual pore structure, incorporating continuous through-pores alongside silica skeletons that possess meso-pores. This unique configuration contributes to a low pressure drop and facilitates robust interactions between the analytes and the surface. Thus, the use of MonoTip C18 pipette tips can simplify the sample processing workflow through straightforward pipetting, offering a more efficient and time-saving alternative to traditional SPE methods.
In this study, MonoTip C18 pipette tips with a maximum volume of 200 μL were modified to accommodate the processing of larger volume samples. This was achieved by combining the MonoTip C18 pipette tip with a 1 mL pipette tip: a portion of the upper end of the MonoTip C18 tip and a section of the lower end of the 1 mL tip were removed, allowing the two to be assembled together. The modified MonoTip C18 pipette tip was subsequently attached to an electronic pipettor for PT-SPE processing (Fig. 2).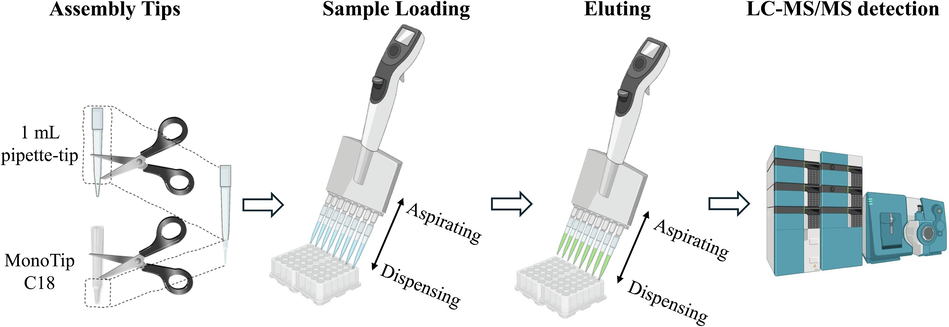
A schematic diagram of MonoTip C18 PT-SPE-enabled automated sample processing.
The extraction process was performed as follows: first, the modified MonoTip C18 was activated by aspirating/dispensing 0.5 mL of ACN for 2 cycles. Subsequently, 0.5 mL of water was aspirated/dispensed for 2 cycles to wash and remove the acetonitrile residue. Next, 1 mL of sample solution was aspirated/dispensed for 10 cycles, enabling the target analytes to be adsorbed by monolithic C18. Next, a washing step was carried out by aspirating/dispensing 200 μL of water for 2 cycles. Finally, 200 μL of EtOH was aspirated/dispensed for 10 cycles to achieve effective desorption. Two microliters of the desorption solution was used for LC-MS/MS analysis.
2.4 LC-MS/MS analysis
Chromatographic separation was carried out on a Shimadzu Prominence system utilizing a Waters Acquity UPLC BEH C18 column (2.1 × 50 mm, 1.7 μm). The mobile phases comprised a 0.1 % formic acid aqueous solution (A) and a 0.1 % formic acid acetonitrile solution (B), with a flow rate of 0.2 mL/min. A gradient elution method was used for component separation, starting with 5 % B, held for 0.15 min, then increased to 30 % B at 0.2 min and held for 4.3 min. This was followed by a stepwise increase to 60 % B at 4.6 min, which was maintained for 2.4 min. The system then rapidly returned to the initial 5 % B within 0.1 min and remained there for 2.9 min, resulting in a total run time of 10 min. The injection volume of the sample was 2 μL.
MS/MS detection was performed using a Sciex API 5500 triple quadrupole mass spectrometer (AB Sciex, Framingham, MA, USA) equipped with an electrospray ionization (ESI) source. The mass spectrometer was operated in positive ion mode with multiple reaction monitoring (MRM) mode. The source temperature was set to 550 °C with an ion spray voltage of 5500 V. The gas settings were as follows: curtain gas at 30 psi, ion spray voltage at 5500 V, source temperature at 550 °C, nitrogen gas (gas 1) at 50 psi, and turbocharger source gas (gas 2) at 50 psi. The declustering potential was set to 110 V, the entrance potential to 10 V, and the collision cell exit potential to 11 V for all TKIs. The dwell time for each analyte was 70 msec. Data analysis and system control were performed using Scientific Analyst® software, version 1.6.2. The specific mass spectrometry parameters for the TKIs are listed in Supplementary Table 1.
Analyte
Q1
Q3
CE (V)
Dwell Time (msec)
Erl
394.2
278.1
40
70
Ibru
441.1
304.2
30
70
Paz
438.2
357.3
35
70
Afa
486.1
371.1
38
70
Gef
447.1
128.2
31
70
Nilo
530.1
289.1
38
70
Ima
494.2
394.2
34
70
Criz
450.1
259.2
28
70
Cer
558.1
516.2
33
70
Suni
399.2
326.2
25
70
Dasa
488.1
401.1
38
70
2.5 Method validation
The validation process included the assessment of matrix effects, linearity, limits of detection (LOD), limits of quantification (LOQ), accuracy, and precision. The matrix effects were evaluated by comparing the analyte responses in plasma samples to those in pure solutions under the same conditions. The internal standard-normalized matrix effects were assessed by calculating the ratio of the analyte's response in the blank matrix to its response in a pure solution, and then dividing this by the response of the internal standard under the same conditions. The linearity of the method was evaluated by preparing a series of standard solutions at various concentrations, which were then analyzed to construct calibration curves. LODs and LOQs were determined based on signal-to-noise ratios of 3:1 and 10:1, respectively. The accuracy and precision of the method were validated by analyzing spiked plasma samples at three different concentration levels (1, 20, and 100 ng/mL).
3 Results and discussion
3.1 Preliminary evaluation of extraction efficiency
In this study, MonoTip C18 pipette tips were modified to accommodate larger sample volumes by combining them with 1 mL pipette tips. This modification was achieved by removing specific sections from both tips and assembling them together, effectively increasing the volume capacity of the MonoTip C18. The modified tips were then attached to an electronic pipettor for PT-SPE processing. The extraction procedure involved several key steps: activation of the modified tip with ACN, followed by washing with water to remove any residual ACN. The sample solution was then processed through multiple aspirating/dispensing cycles to allow the target analytes to adsorb onto the C18 material. After a washing step with water, the analytes were desorbed using EtOH and subsequently analyzed by LC-MS/MS. This process, as depicted in Fig. 2, outlines the sequence from tip assembly to sample processing and final analysis by LC-MS/MS.
To evaluate the feasibility of the proposed PT-SPE method for extracting TKIs from aqueous solutions, this study compared the LC-MS/MS chromatograms of 500 ng/mL standard solutions, 100 ng/mL extracted samples, and blank samples for 11 TKIs. As shown in Fig. 3, the results demonstrate that the retention times of the sample peaks after PT-SPE treatment are consistent with those of the standard solutions. Moreover, the peak intensities of the 100 ng/mL sample solutions after extraction enrichment were comparable to those of the 500 ng/mL standard solutions, indicating satisfactory extraction and enrichment efficiency of the method. Furthermore, considering that the aspirating/dispensing solution was manually controlled, there was concern about whether variations in the flow rate during the aspirating/dispensing cycle could impact the efficiency of the PT-SPE method. The duration of each cycle is variable; however, the results confirm that the extraction recovery remains stable, with a coefficient of variation (CV) of less than 7.5 %, which is deemed acceptable. This stability underlines the method's robustness against flow rate fluctuations. In conclusion, the extraction method effectively extracts and enriches TKIs from aqueous solutions, demonstrating good reproducibility.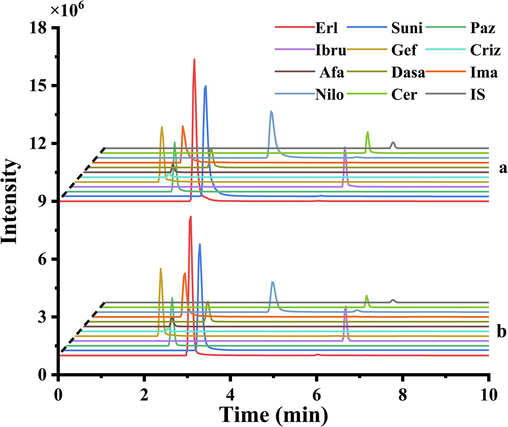
LC-MS/MS chromatograms of (a) TKI standard solution (500 ng/mL), and (b) TKI-spiked standard solution (100 ng/mL) treated with PT-SPE.
3.2 Optimization of extraction conditions
Optimization of the key factors influencing PT-SPE was conducted using a mixed standard solution at a concentration of 100 ng/mL. The critical parameters under investigation included the pH of the sample solution, the type and volume of desorption solvent, and the number of aspirating/dispensing cycles for both extraction and desorption. The extraction efficiency was assessed through the analysis of peak areas corresponding to the target analytes.
3.2.1 pH of the sample solution
Using potassium dihydrogen phosphate, a 20 mM buffer solution was prepared, and the pH was adjusted to 3, 4, 5, 6, 7, 8, 9, 10, and 11 using phosphoric acid and sodium hydroxide. Subsequently, the working solutions were diluted under different pH conditions to investigate the impact of pH on the extraction efficiency of the analytes. The experimental results shown in Fig. 4A revealed a relatively stable trend in the peak areas of analytes under neutral and alkaline pH conditions, with significantly greater peak areas than under acidic pH conditions. Considering the convenience of the experimental procedures, the subsequent experiments adopted a 20 mM buffer solution (pH 7.0) as the dilution solvent for the working solution, facilitating PT-SPE analysis under neutral conditions.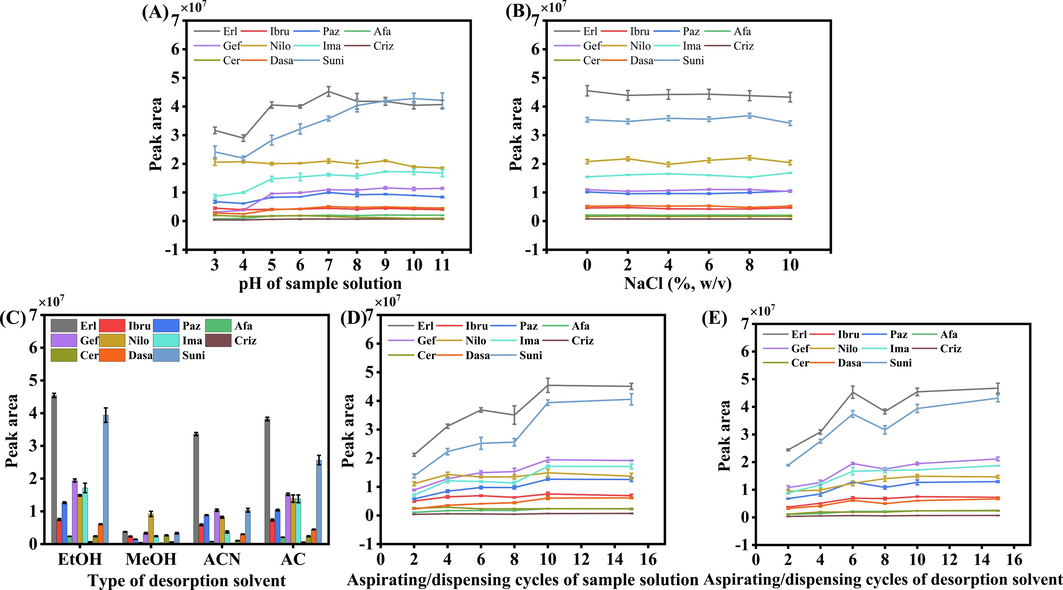
Optimization of the extraction conditions: (A) pH of sample solution, (B) salt concentration of sample solution, (C) type of desorption solvent, (D) number of aspirating/dispensing cycles of sample solution and (E) number of aspirating/dispensing cycles of desorption solvent.
3.2.2 Salt concentration of the sample solution
The salting-out effect was examined to determine if it would enhance extraction recoveries by reducing the solubility of the analytes in the aqueous phase. Specifically, the effect of ionic strength on the extraction recoveries of the selected compounds was investigated by adding NaCl at various concentrations (0 % to 10 %, w/v) to the sampling solution. The results presented in Fig. 4B demonstrate that the salt concentration had minimal impact on the extraction efficiencies of the compounds under study. This observation indicates that the salting-out effect does not significantly influence the recovery of these analytes in this particular extraction method. As a result, to maintain the simplicity of the experimental procedure, no salt was added in subsequent experiments.
3.2.3 Type and volume of desorption solvent
The selection of the desorption solvent is crucial for achieving optimal desorption efficiency in PT-SPE. Therefore, an investigation was conducted considering solvents such as EtOH, MeOH, ACN, and AC. The experimental results shown in Fig. 4C demonstrated that EtOH exhibited the most effective desorption performance. Consequently, EtOH was chosen as the final desorption solvent for subsequent analyses. EtOH is also a low-toxicity solvent, greatly enhancing the environmental friendliness of the method.
3.2.4 Aspirating/dispensing cycles for extraction and desorption
By optimizing the number of aspiration/dispensing cycles during both the adsorption and desorption processes, the goal was to achieve complete adsorption and desorption in the shortest possible time. The extraction efficiency was assessed for various aspiration/dispensing cycles, specifically 2, 4, 6, 8, 10, and 15 cycles. The results shown in Fig. 4D indicated that beyond 10 extraction cycles, there was no significant improvement in the extraction efficiency with additional aspiration/dispensing cycles. Therefore, 10 aspiration/dispensing cycles were determined to be the optimal conditions for extraction. Similarly, an examination of desorption efficiency was conducted under different aspiration/dispensing cycles. The data shown in Fig. 4E revealed that 10 aspiration/dispensing cycles represented the optimal desorption conditions.
3.3 Method validation
3.3.1 Matrix effects
Initially, the blank plasma samples were evaluated using the proposed method under optimal extraction conditions. The results showed no interference signals, indicating the method's robustness against coexisting substances. Then, after blank plasma samples were subjected to protein precipitation, they were individually spiked with a mixture of standard compounds and internal standard solution, leading to the preparation of spiked samples at a concentration of 20 ng/mL (with the internal standard at 10 ng/mL). A comparative analysis with similarly processed pure solution samples was conducted to investigate the matrix effects. The matrix effect was defined as the ratio of the analyte's response in the blank matrix post extraction to the analyte's response in the pure solution (Bu et al., 2023; Chen et al., 2023). As demonstrated in Table 2, the experimental results highlighted a significant matrix effect in the plasma samples, with values ranging from 45.6–65.0 %, necessitating correction by adding internal standards. After normalization to the internal standard, the matrix effect was calculated as the absolute matrix effect of the analyte divided by the absolute matrix effect of the internal standard. The results showed that after internal standard normalization, the matrix effect ranged between 85.6 % and 114.7 %. This internal standard normalization method effectively mitigated matrix effects, enabling accurate quantitative analysis.
Analyte
Matrix Effect (%)
Internal standard normalized matrix effect (%)
Erl
49.0
86.5
Ibru
49.6
87.6
Paz
46.8
85.6
Afa
59.3
104.7
Gef
54.6
96.4
Nilo
48.6
85.7
Ima
61.7
108.9
Criz
50.0
88.2
Cer
45.6
89.5
Suni
65.0
114.7
Dasa
48.9
86.3
3.3.2 Linear ranges and detection limits
The stock solution was methodically diluted to produce mixed standard solutions at concentrations of 0.1, 0.2, 0.5, 1, 2, 5, 10, 20, 50, 100, and 200 ng/mL, maintaining an internal standard concentration of 10 ng/mL. Next, PT-SPE was performed under the identified optimal experimental conditions. A standard curve was accurately generated by plotting the analyte concentrations on the x-axis against the ratio of the analyte to internal standard peak areas on the y-axis. As indicated in Table 3, the results demonstrated that the method maintained excellent linearity across the 0.2/0.5/0.8 to 200 ng/mL range, with correlation coefficients (R2) surpassing 0.993 for all analytes. The LODs for the 11 TKIs ranged from 0.049 to 0.206 ng/mL, while the LOQs ranged from 0.162 to 0.686 ng/mL.
Analyte
Linear Range (ng/mL)
Linearity Regression Equation
R2
LOD (ng/mL)
LOQ (ng/mL)
Erl
0.2–200
y = 0.5601x + 0.4421
0.9998
0.051
0.168
Ibru
0.5–200
y = 0.0429x-0.1045
0.9948
0.120
0.396
Paz
0.2–200
y = 0.0918x-0.0889
0.9988
0.049
0.162
Afa
0.5–200
y = 0.0121x + 0.0422
0.9932
0.112
0.365
Gef
0.5–200
y = 0.0615x + 0.1802
0.9960
0.106
0.350
Nilo
0.5–200
y = 0.1468x-0.0651
0.9991
0.098
0.325
Ima
0.5–200
y = 0.1002x + 0.1374
0.9993
0.117
0.386
Criz
0.8–200
y = 0.0039x + 0.0157
0.9957
0.206
0.686
Cer
0.2–200
y = 0.0094x-0.0070
0.9985
0.050
0.168
Suni
0.2–200
y = 0.3113x + 0.3942
0.9977
0.051
0.173
Dasa
0.2–200
y = 0.0360x + 0.0825
0.9974
0.049
0.164
3.3.3 Accuracy and precision
The accuracy and precision of the analytical method were validated through the assessment of intraday and interday relative recovery as well as CV. As shown in Table 4, across three different concentrations of samples (1, 20, and 100 ng/mL), the intraday relative recoveries ranged from 96.3 % to 115.0 %, while the interday recoveries ranged from 95.0 % to 115.7 %. Concurrently, the CV values were consistently below 13.8 %. This comprehensive dataset underscores the excellent accuracy and precision of the analytical method being evaluated.
Analytes
Intraday (n = 3)
Interday (n = 3)
Low
Medium
High
Low
Medium
High
Recoveries (%)
CVs (%)
Recoveries (%)
CVs (%)
Recoveries (%)
CVs (%)
Recoveries (%)
CVs (%)
Recoveries (%)
CVs (%)
Recoveries (%)
CVs (%)
Erl
102.9
8.3
107.8
11.0
111.1
7.9
98.7
7.0
107.4
8.8
110.2
8.9
Ibru
105.3
12.6
111.1
13.2
115.0
9.2
95.0
12.5
109.8
11.5
111.5
13.8
Paz
103.9
12.8
109.2
12.9
106.4
10.1
98.9
11.7
109.8
12.0
107.4
9.2
Afa
109.0
7.9
108.6
8.4
107.5
12.5
105.6
2.4
107.4
10.7
110.5
8.5
Gef
109.3
8.7
110.0
9.0
107.3
12.2
100.1
12.7
109.4
10.4
110.1
8.4
Nilo
112.6
8.0
99.1
4.4
108.1
8.5
102.8
7.0
100.6
12.6
101.9
3.4
Ima
98.9
11.1
110.2
8.9
97.9
12.4
102.7
10.7
109.4
11.1
100.9
8.3
Criz
101.0
11.6
112.6
11.9
107.3
10.6
100.4
11.6
107.5
12.1
108.7
8.1
Cer
96.3
2.4
110.1
2.2
110.5
8.5
98.4
9.2
102.8
7.0
109.1
11.1
Suni
105.9
9.8
111.0
8.1
112.5
12.3
100.8
8.9
109.7
10.2
115.7
11.8
Dasa
99.0
4.9
104.7
13.3
106.2
10.9
98.9
6.7
108.1
9.4
107.7
9.2
3.3.4 Specificity
According to the ICH guideline M10, specificity refers to the ability of a bioanalytical method to detect and distinguish the analyte from other substances (Booth et al., 2019). The LC-MS/MS method, which utilizes retention time, precursor ion mass, and fragment ion mass, inherently exhibits high specificity. The potential interference from endogenous compounds was investigated by analyzing 20 different blank plasma samples, including 5 from hyperlipidemic patients and 5 from diabetic patients. Interference was defined as MRM signals with retention times within 0.3 min of the target analyte (Djerada et al., 2013). The tested blank plasma samples (n = 20) showed no interference within the retention time window for each detected specific ion, indicating the satisfied specificity of the proposed method.
3.4 Real sample analysis
Due to increasingly stringent ethical and privacy concerns, patient plasma samples were not accessible. Therefore, the accuracy of the established quantitative analysis method was validated within a single-blind study design (Han et al., 2024; Wang et al., 2024). Specifically, an independent individual prepared spiked samples, which were then analyzed using the proposed method by another person. The operator was unaware of the actual spiked concentrations until the results were revealed. As shown in Table 5, the detected concentrations closely matched the spiked concentrations across all three levels, with relative errors not exceeding ± 4.4 %. These results indicate that the method is highly reliable and suitable for analyzing TKIs in real plasma samples.
Analytes
Spiked (2.2 ng/mL)
Spiked (32 ng/mL)
Spiked (110 ng/mL)
Detected (%)
Relative errors (%)
Detected (%)
Relative errors (%)
Detected (%)
Relative errors (%)
Erl
2.27 ± 0.09
3.0 %
30.73 ± 1.01
−4.0 %
105.44 ± 1.77
−4.2 %
Ibru
2.15 ± 0.04
−2.4 %
31.56 ± 0.80
−1.4 %
107.27 ± 4.78
−2.5 %
Paz
2.21 ± 0.03
0.6 %
31.64 ± 0.95
−1.1 %
111.16 ± 3.56
1.1 %
Afa
2.30 ± 0.05
4.6 %
32.28 ± 0.43
0.9 %
107.92 ± 3.06
−1.9 %
Gef
2.24 ± 0.07
1.8 %
32.58 ± 1.44
1.8 %
115.41 ± 3.74
4.9 %
Nilo
2.10 ± 0.09
−4.4 %
31.91 ± 1.06
−0.3 %
107.52 ± 1.13
−2.3 %
Ima
2.12 ± 0.10
−3.7 %
33.32 ± 0.67
4.1 %
111.38 ± 1.17
1.3 %
Criz
2.17 ± 0.07
−1.6 %
32.18 ± 0.56
0.6 %
105.60 ± 3.43
−4.0 %
Cer
2.11 ± 0.02
−4.2 %
31.68 ± 1.18
−1.0 %
110.15 ± 2.98
0.1 %
Suni
2.14 ± 0.08
−2.9 %
32.91 ± 0.87
2.8 %
114.41 ± 4.46
4.0 %
Dasa
2.17 ± 0.05
−1.3 %
33.34 ± 0.77
4.2 %
106.71 ± 2.68
−3.0 %
3.5 Method advantages
The proposed method was compared with several previously reported methods that utilize adsorbent-based extraction for sample preparation and LC-MS/MS for detection (Table 6). The following key advantages of the newly established method deserve emphasis: (1) The approach is characterized by a significant reduction in the use of toxic solvents, achieved by utilizing low-toxicity ethanol as the desorption solvent, reflecting a strong commitment to environmentally sustainable practices. By minimizing reliance on harmful solvents, this method not only reduces the ecological footprint of the analytical process but also aligns with the principles of green analytical chemistry (Nowak et al., 2021; Sajid and Płotka-Wasylka, 2022), promoting safer and more sustainable laboratory practices; (2) The use of commercially available MonoTip C18 pipette tips, combined with automation through electronic pipettors, greatly enhances sample processing efficiency. This automation simplifies the analytical workflow, making it more user-friendly and accessible, while also facilitating high-throughput analysis. This is particularly beneficial for busy clinical laboratories that require efficient and reliable methods for therapeutic drug monitoring; (3) The method is designed to simplify the sample preparation workflow. The desorption solvent (ethanol) can be directly injected into the analysis system without the need for time-consuming drying and reconstitution steps, further enhancing the efficiency and ease of use. Note: DSPE: dispersive solid-phase extraction; MSPE: magnetic solid-phase extraction.
Sample and Dosage
Analyte
Material
Extraction method
Detection technique
LOQ
Ref
Plasma (300 µL)
Vemurafenib, dabrafenib, cobimetinib, trametinib and binimetinib
Oasis MCX
SPE
LC-MS/MS
0.4–1 µg/mL
(Rousset et al., 2017)
Plasma (300 µL)
Afa, axitinib, bosutinib, Criz, dabrafenib, Dasa, Erl, Gef, Ima, lapatinib, Nilo, ponatinib, regorafenib, regorafenib M2, regorafenib M5, ruxolitinib, sorafenib, sunitinib and vandetanib
Oasis®
MCX, 96-well micro-elution plateSPE
LC-MS/MS
0.1–25 ng/mL
(Merienne et al., 2018)
Plasma (300 µL)
Peficitinib, tofacitinib, baricitinib, Ima, filgotinib, ruxolitinib, Dasa, bosutinib, Nilo, ponatinib and Ibru
Oasis µ-SPE MCX 96-well µElution Plate
µSPE
LC-MS/MS
0.30–5.03 ng/mL
(Koller et al., 2020)
Plasma (100 µL)
Imatinib mesylate
Metal-organic framework MIL-101(Cr)
Vortex-assisted DSPE
LC-MS/MS
1 ng/mL
(Qi et al., 2016)
Plasma (100 µL)
Alectinib, Afa, apatinib, icotinib, Dasa, Criz, regorafenib, vemurafenib, N-desmethyl imatinib, Erl, Cer, Ima, sorafenib, Gef and lapatinib
Magnetic core coated with polystyrene–divinylbenzene–pyrrolidone polymer (96-well plates)
MSPE
LC-MS/MS
2.5–10.0 ng/mL
(Li et al., 2022)
Plasma (200 µL)
Imatinib mesylate
Chitosan grafted onto Fe3O4 @poly(N-vinyl-caprolactam)
MSPE
LC-MS/MS
1.0 ng/mL
(Sahebi et al., 2019)
Plasma (100 μL)
Erl, Ibru, Paz, Afa, Gef, Nilo, Ima, Criz, Suni and Dasa
MonoTip C18
PT-SPE
LC-MS/MS
0.162– 0.686 ng/mL
This work
Collectively, these advantages highlight the method's potential to revolutionize TKI monitoring in clinical settings, offering a robust, efficient, easily automatable, and environmentally conscious approach, and reinforcing its significant contribution to advancing current analytical techniques.
4 Conclusion
This study successfully developed and validated an innovative automated MonoTip C18 PT-SPE method seamlessly integrated with LC-MS/MS for the efficient TDM of eleven TKIs in biological samples. The method demonstrated remarkable efficiency, accuracy, and precision, with an excellent linear range and low detection limits, ensuring its reliability for clinical applications. The optimization of the extraction conditions and the robustness of the method against matrix effects further underscore its potential for widespread use in clinical settings. Importantly, the reduced solvent consumption and rapid processing time of this method highlight its environmental sustainability and operational efficiency. This research paves the way for enhanced TDM of TKIs, offering significant contributions to personalized medicine and patient care in oncology, underscoring the critical role of advanced analytical techniques in the evolving landscape of cancer treatment.
CRediT authorship contribution statement
Qianqian Wang: Writing – original draft, Methodology. Yuwei Liu: Writing – original draft, Methodology. Yuanyuan Zheng: Methodology. Di Chen: Writing – review & editing, Funding acquisition, Conceptualization. Ya Xie: Writing – review & editing, Funding acquisition. Nian Shi: Writing – review & editing, Funding acquisition.
Acknowledgments
The authors are thankful for the financial support from the Natural Science Foundation of Henan (242300421273), Henan Province Medical Science and Technology Research Project jointly built by the Ministry and Province (LHGJ20220392), the Key Scientific Research Projects of Universities in Henan Province (23A320044) and the Henan Provincial Science and Technology Research Project (242102311184).
Declaration of competing interest
The authors declare that they have no known competing financial interests or personal relationships that could have appeared to influence the work reported in this paper.
References
- A fully automated on-line salting-out assisted liquid-liquid extraction capillary electrophoresis methodology: Application to tyrosine kinase inhibitors in human plasma. Talanta. 2020;208:120391
- [CrossRef] [Google Scholar]
- Solid-phase extraction of organic compounds: A critical review (Part I) TrAC Trends Anal. Chem.. 2016;80:641-654.
- [CrossRef] [Google Scholar]
- Towards wearable and implantable continuous drug monitoring: A review. J. Pharm. Anal.. 2021;11(1):1-14.
- [CrossRef] [Google Scholar]
- Booth, Stevenson, Pillutla, Buonarati, Beaver, Fraier, Garofolo, Haidar, Islam, James, Kadavil, Kavetska, Li, Satterwhite, Savoie, Subramaniam, Tampal, Thway, Woolf, Blaye, Andisik, Briscoe, Cape, Dasgupta, Fischer, Haidar, Hayes, Kamerud, Lima Santos, Nehls, Soo, Vinter, Whale, Xu, Cho, Edmison, Kassim, Rocha, Welink, Amur, Bandukwala, Cherry, Hopper, Ishii-Watabe, Kirshner, Maher, Pedras-Vasconcelos, Saito, Saunders, Skibeli, Verthelyi, Wang, & Yan. (2019). 2019 White Paper On Recent Issues in Bioanalysis: FDA BMV Guidance, ICH M10 BMV Guideline and Regulatory Inputs (Part 2 – Recommendations on 2018 FDA BMV Guidance, 2019 ICH M10 BMV Draft Guideline and Regulatory Agencies' Input on Bioanalysis, Biomarkers and Immunogenicity). Bioanalysis, 11(23), 2099-2132. doi: 10.4155/bio-2019-0270.
- Liquid chromatography coupled to tandem mass spectrometry (LC-MS/MS) methods for the therapeutic drug monitoring of cytotoxic anticancer drugs: An update. J. Chromatogr. B. 2024;1236:124039
- [CrossRef] [Google Scholar]
- Matrix-assisted laser desorption/ionization high-resolution mass spectrometry for high-throughput analysis of androgenic steroid adulteration in traditional Chinese medicine based on d0/d5-Girard's reagent P labeling. Talanta. 2023;253:124006
- [CrossRef] [Google Scholar]
- Recent advances in sample preparation techniques to overcome difficulties encountered during quantitative analysis of small molecules from biofluids using LC-MS/MS. Analyst. 2014;139(10):2265-2276.
- [CrossRef] [Google Scholar]
- Coupling in-syringe kapok fiber-supported liquid-phase microextraction with flow injection-mass spectrometry for rapid and green biofluid analysis: Determination of antidepressants as an example. J. Pharm. Biomed. Anal.. 2023;229:115380
- [CrossRef] [Google Scholar]
- Pretreatment and analysis techniques development of TKIs in biological samples for pharmacokinetic studies and therapeutic drug monitoring. J. Pharm. Anal.. 2024;14(4):100899
- [CrossRef] [Google Scholar]
- Validation of a fast method for quantitative analysis of elvitegravir, raltegravir, maraviroc, etravirine, tenofovir, boceprevir and 10 other antiretroviral agents in human plasma samples with a new UPLC-MS/MS technology. J. Pharm. Biomed. Anal.. 2013;86:100-111.
- [CrossRef] [Google Scholar]
- How does the order of sample analysis influence the matrix effect during LC-MS bioanalysis? J. Chromatogr. B. 2023;1227:123800
- [CrossRef] [Google Scholar]
- Biocompatible solid-phase microextraction nanoelectrospray ionization: an unexploited tool in bioanalysis. Anal. Chem.. 2016;88(2):1259-1265.
- [CrossRef] [Google Scholar]
- A history of the roles of cytochrome P450 enzymes in the toxicity of drugs. Toxicol. Res.. 2021;37(1):1-23.
- [CrossRef] [Google Scholar]
- A green and rapid deep eutectic solvent dispersed liquid–liquid microextraction with magnetic particles-assisted retrieval method: Proof-of-concept for the determination of antidepressants in biofluids. J. Mol. Liq.. 2024;395:123875
- [CrossRef] [Google Scholar]
- A layer-by-layer sensing architecture based on dendrimer and ionic liquid supported reduced graphene oxide for simultaneous hollow-fiber solid phase microextraction and electrochemical determination of anti-cancer drug imatinib in biological samples. J. Electroanal. Chem.. 2017;801:439-449.
- [CrossRef] [Google Scholar]
- Hydrophilic modified magnetic multi-walled carbon nanotube for dispersive solid/liquid phase microextraction of sunitinib in human samples. Anal. Biochem.. 2018;542:76-83.
- [CrossRef] [Google Scholar]
- Therapeutic drug monitoring of teicoplanin using an LC–MS/MS method: Analysis of 421 measurements in a naturalistic clinical setting. J. Pharm. Biomed. Anal.. 2019;167:161-165.
- [CrossRef] [Google Scholar]
- Comprehensive in silico discovery of c-Src tyrosine kinase inhibitors in cancer treatment: A unified approach combining pharmacophore modeling, 3D QSAR, DFT, and molecular dynamics simulation. J. King Saud Univ. - Sci.. 2024;36(3):103076
- [CrossRef] [Google Scholar]
- Trace-level monitoring of anti-cancer drug residues in wastewater and biological samples by thin-film solid-phase micro-extraction using electrospun polyfam/Co-MOF-74 composite nanofibers prior to liquid chromatography analysis. J. Chromatogr. A. 2021;1655:462484
- [CrossRef] [Google Scholar]
- Recent advances in sample preparation techniques for effective bioanalytical methods. Biomed. Chromatogr.. 2011;25(1–2):199-217.
- [CrossRef] [Google Scholar]
- Effective quantification of 11 tyrosine kinase inhibitors and caffeine in human plasma by validated LC-MS/MS method with potent phospholipids clean-up procedure. Application to Therapeutic Drug Monitoring. Talanta. 2020;208:120450
- [CrossRef] [Google Scholar]
- Recent advances in sample preparation techniques for quantitative detection of pharmaceuticals in biological samples. TrAC Trends Anal. Chem.. 2021;142:116318
- [CrossRef] [Google Scholar]
- Development and validation of an UPLC-MS/MS method for simultaneous determination of fifteen targeted anti-cancer drugs in human plasma and its application in therapeutic drug monitoring. J. Pharm. Biomed. Anal.. 2022;212:114517
- [CrossRef] [Google Scholar]
- High throughput routine determination of 17 tyrosine kinase inhibitors by LC–MS/MS. J. Pharm. Biomed. Anal.. 2018;150:112-120.
- [CrossRef] [Google Scholar]
- Routine therapeutic drug monitoring of tyrosine kinase inhibitors by HPLC–UV or LC–MS/MS methods. Drug Metab. Pharmacokinet.. 2016;31(1):12-20.
- [CrossRef] [Google Scholar]
- Overview, consequences, and strategies for overcoming matrix effects in LC-MS analysis: a critical review. Analyst. 2021;146(20):6049-6063.
- [CrossRef] [Google Scholar]
- White analytical chemistry: an approach to reconcile the principles of green analytical chemistry and functionality. TrAC Trends Anal. Chem.. 2021;138:116223
- [CrossRef] [Google Scholar]
- Trial Watch: combination of tyrosine kinase inhibitors (TKIs) and immunotherapy. OncoImmunology. 2022;11(1):2077898.
- [CrossRef] [Google Scholar]
- Therapeutic Drug Monitoring of Tyrosine Kinase Inhibitors in the Treatment of Advanced Renal Cancer. Cancers. 2023;15(1):313.
- [CrossRef] [Google Scholar]
- The metal-organic framework MIL-101(Cr) as efficient adsorbent in a vortex-assisted dispersive solid-phase extraction of imatinib mesylate in rat plasma coupled with ultra-performance liquid chromatography/mass spectrometry: Application to a pharmacokinetic study. J. Chromatogr. A. 2016;1449:30-38.
- [CrossRef] [Google Scholar]
- An UPLC-MS/MS method for the quantification of BRAF inhibitors (vemurafenib, dabrafenib) and MEK inhibitors (cobimetinib, trametinib, binimetinib) in human plasma. Application to treated melanoma patients. Clin. Chim. Acta. 2017;470:8-13.
- [CrossRef] [Google Scholar]
- Chitosan grafted onto Fe3O4@poly(N-vinylcaprolactam) as a new sorbent for detecting Imatinib mesylate in biosamples using UPLC-MS/MS. Analyst. 2019;144(24):7336-7350.
- [CrossRef] [Google Scholar]
- Adverse effects of tyrosine kinase inhibitors in cancer therapy: pathophysiology, mechanisms and clinical management. Signal Transduct. Target. Ther.. 2023;8(1):262.
- [CrossRef] [Google Scholar]
- Screening of multi-targeted natural compounds for receptor tyrosine kinases inhibitors and biological evaluation on cancer cell lines, in silico and in vitro. Med. Oncol.. 2015;32(9):233.
- [CrossRef] [Google Scholar]
- Application of microextraction in pipette tips in clinical and forensic toxicology. TrAC Trends Anal. Chem.. 2021;143:116404
- [CrossRef] [Google Scholar]
- The impact of individual human cytochrome P450 enzymes on oxidative metabolism of anticancer drug lenvatinib. Biomed. Pharmacother.. 2022;145:112391
- [CrossRef] [Google Scholar]
- Polyaniline-coated kapok fibers for convenient in-syringe solid-phase microextraction and determination of organochlorine and pyrethroid pesticide residues in aqueous samples. Talanta. 2024;271:125706
- [CrossRef] [Google Scholar]
- Chromatographic and mass spectrometric analytical strategies for profiling tyrosine kinase inhibitors in biological samples. Microchem. J.. 2024;201:110694
- [CrossRef] [Google Scholar]
- Simultaneous quantification of imatinib and its main metabolite N-demethyl-imatinib in human plasma by liquid chromatography–tandem mass spectrometry and its application to therapeutic drug monitoring in patients with gastrointestinal stromal tumor. Biomed. Chromatogr.. 2017;31(12):e4022.
- [Google Scholar]


