

Translate this page into:
Multi-component pharmacokinetics assessment of Artemisia annua L. in rats based on LC-ESI-MS/MS quantification combined with molecular docking
⁎Corresponding author. qiufeng@ccmu.edu.cn (Feng Qiu)
-
Received: ,
Accepted: ,
This article was originally published by Elsevier and was migrated to Scientific Scholar after the change of Publisher.
Peer review under responsibility of King Saud University.
Abstract
Artemisia annua L. (A. annua) has been used as herbal medicine in China for thousands of years for clearing deficiency heat, treating malaria and removing jaundice. A rapid, sensitive and specific liquid chromatography coupled with electrospray ionization tandem mass spectrometry (LC–ESI–MS/MS) method was developed, validated, and successfully used for simultaneous quantification of the active components in rat plasma after oral administration of A. annua extract. Molecular docking of each component with drug metabolizing enzymes was carried out to explore the effect of each component on CYP-mediated drug metabolism. Two coumarins (scopolin (SPL) and scopoletin (SPLT)), three flavonoids (rutin (RUT), chrysosplenol D (CHD), casticin (CAS)) and three sesquiterpenes (arteannuin B (ARN), dihydroartemisinic acid (DARM) and artemisinic acid (ARM)) were detected in rat plasma after oral administration. CHD and CAS were rapidly absorbed into rat blood with the Tmax values of 0.11 ± 0.04 h and 0.13 ± 0.05 h, respectively. Their half-lives (t1/2 2.68 ± 3.62 h and 0.33 ± 0.07 h) were shorter. SPLT were also rapidly absorbed into the blood (Tmax 0.15 ± 0.03 h), but exhibited a longer half-life (t1/2 6.53 ± 1.84 h), indicating that it could be effective in vivo for a longer period of time. The peak time of SPL, RUT, DARM and ARM ranged from 1 ∼ 4 h, demonstrating that they could maintain considerable concentrations for a longer time. ARN showed strong enterohepatic circulation in rats, leading to slower onset time and longer effect. A few components including SPLT, CHD, CAS and ARN could be metabolized into their corresponding II phase metabolites combining with glucuronic acid or sulfuric acid. RUT could decompose its glycosyl to generate genin. The molecular docking results indicated that those flavonoids and coumarins of A. annua interacting with CYPs mainly through hydrogen bonding and π-π stacking had better CYP450 enzyme binding ability than the sesquiterpenoids, which were easier to induce drug interactions. This study presented an integrated strategy for investigating the pharmacokinetic behaviors of eight components in A. annua and laid the foundation for revealing the mechanism of action of A. annua in the organism.
Keywords
Artemisia annua L.
LC–ESI–MS/MS
Molecular docking
Pharmacokinetics

- A. annua
-
Artemisia annua L.
- HPLC-DAD
-
High-performance liquid chromatography coupled with diode array detection
- LC-ESI-MS/MS
-
Liquid chromatography coupled with electrospray ionization tandem mass spectrometry
- ESI
-
Electrospray ionization
- MRM
-
Multiple reaction monitoring
- QC
-
Quality control
- SPL
-
Scopolin
- SPLT
-
Scopoletin
- RUT
-
Rutin
- CYN
-
Cynaroside
- ISH
-
Isorhamnetin
- CHD
-
Chrysosplenol D
- CAS
-
Casticin
- ARN
-
Arteannuin B
- ART
-
Artemisinin
- DARM
-
Dihydroartemisinic acid
- ARM
-
Artemisinic acid
- CYP450
-
Cytochrome P450
- CE
-
Collision energy
- DP
-
Declustering potential
- EP
-
Entrance potential
- CXP
-
Cell exit potential
- LLOQ
-
Lower limit of quantification
Abbreviations
1 Introduction
With the discovery of artemisinin (ART) showing significant antimalarial activity (Shi et al., 2022), Artemisia annua L. (A. annua), the only natural source of ART, has attracted much attention. A. annua has been used in China for thousands of years. Its antimalarial effect was first recorded in “Zhou Hou Bei Ji Fang” written by Hong Ge (283–363 CE) in ancient China. “Wen Bing Tiao Bian” written by Jutong Wu (1758–1836 CE) in the Qing Dynasty suggested that A. annua could be used in combination with turtle nails to treat the depletion of essence and blood in the body caused by long-term illness. Modern chemical studies have shown that A. annua contains sesquiterpenes, flavonoids, coumarins, volatile oils, polysaccharides and other chemical components (Iqbal et al., 2012, Li et al., 2019a, 2019b). Most of the current research hotspots focus on ART and its derivates, whose activities mainly include antimalarial, antitumor and immunomodulatory activity (Oh et al., 2009, Li et al., 2012, Wang et al., 2020). However, the pharmacological activities of coumarins, flavonoids and other sesquiterpenes in A. annua determined in our previous work should not be neglected (Fu et al., 2020), such as the good antitumor activity of various flavonoids (Fu et al., 2022), and the synergistic enhancement of antimalarial activity of arteannuin B (ARN), artemisinic acid (ARM) and scopoletin (SPLT) (Cai et al., 2017, Li et al., 2018).
It is well known that the bioavailability of most active components in herbal medicines is usually not high due to unbalanced lipid-water partition coefficient, efflux of P-gP and/or MRP-2, strong hepatic first-pass effect and extensive metabolism (He et al., 2010, Puglia et al., 2017). Therefore, the in vivo pharmacokinetic process (absorption, distribution, metabolism, excretion, etc.) of the chemical components contained in A. annua may also meet challenges. The absorption of the different active components, the absorption extent of its blood components, and the changed pattern of each component in blood circulation and in various organs and tissues may greatly affect the specific clinical efficacy of A. annua.
Currently, most pharmacokinetic studies focus on artemisinin and its potentiating components for antimalarial effects (Li et al., 2018, Dai et al., 2019), while studies on other components of A. annua are relatively rare. Only the changes of three flavonoid components and their glucuronide metabolites in rats were determined (Wang et al., 2019a, 2019b). Based on the good activities of A. annua and its complex chemical components, it is necessary to investigate the chemical structures in the blood, absorption rate and the pattern of concentration changes in the blood circulation through pharmacokinetic experiments, so as to clarify the absorption and utilization of the active ingredients of A. annua in vivo.
We previously studied the compositional profile of A. annua using HPLC − DAD method and finally determined the contents of 11 components (Fu et al., 2020). These 11 components include coumarins, flavonoids and sesquiterpenes in A. annua, covering a wide range of polarity from high to low. They were used to differentiate the quality differences of A. annua from different origins, which could, to some extent, reflect the characteristics and clinical application differences of A. annua. Therefore, this study established a rapid, sensitive and specific liquid chromatography coupled with electrospray ionization tandem mass spectrometry (LC–ESI–MS/MS) method for simultaneous quantification of various active components in plasma, including two coumarins, five flavonoids and four sesquiterpenoids. The current method was applied to evaluate the pharmacokinetic behavior of A. annua in rats, to lay the foundation for revealing the mechanism of A. annua in the body.
2 Materials and methods
2.1 Chemicals and materials
A. annua herbal samples collected from Hebei province were purchased from Anguo medicinal material market (Hebei, China), and these herbal samples were identified by Associate Professor Rong Luo (Capital Medical University, Beijing, China) according to the Pharmacopoeia of the People's Republic of China. A voucher specimen (HB181025R29) was deposited at the specimen repository of the Department of Traditional Chinese Medicine, Capital Medical University.
Scopolin (SPL, purity > 98.0 %, batch No. PS010518), scopoletin (SPLT, purity > 98.0 %, batch No. PS010525), rutin (RUT, purity 95.0 %, batch No. BF07B077), cynaroside (CYN, purity 98.0 %, batch No. A18A1013) and casticin (CAS, purity > 98.0 %, batch No. PS000670) were all purchased from PUSH-BIO Technology Co. ltd. (Chengdu, Sichuan, China). Isorhamnetin (ISH, purity 98.0 %, batch No. P23A9F68614) and chrysosplenol D (CHD, purity ≥ 98.0 %, batch No. W08M10K87497) were provided by Shanghai Yuanye Bio-Technology Co. ltd. (Shanghai, China). Artemisinin (ART, purity 99.6 %, batch No. 100202–201606) was obtained from National Institutes for Food and Drug Control. Arteannuin B (ARN), artemisinic acid (ARM) and dihydroartemisinic acid (DARM) were isolated, purified and standardized from A. annua in our lab (Zhang et al., 2007, Zhang et al., 2016). Their structures were verified by UV, IR, 1H NMR, 13C NMR and MS assays and the purity was calculated to be > 98.0 % through peak area normalization method. Buspirone hydrochloride used as an internal standard (IS) in the positive ion mode (purity 99.0 %, batch No. 6-EOD-111–1) was purchased from Toronto Research Chemicals Co. ltd. (Toronto, Canada). Phenytoin sodium used as IS in the negative ion mode (purity 99.9 %, batch No. BNV229) was provided by Bide Pharmatech Co. ltd. (Shanghai, China). The structures of the each compound can be found in our previous study (Fu et al., 2020).
HPLC-grade methanol and acetonitrile were purchased from Thermo Fisher Scientific (Massachusetts, USA). Formic acid (HPLC grade) was supplied by Beijing Chemical Works (Beijing, China). Dimethyl sulfoxide was purchased from Amresco Co. ltd. (Cleveland, OH, US). Sodium carboxymethyl cellulose (CMC-Na) was obtained from Beijing Fengli Jingqiu Pharmaceutical Co. ltd. (Beijing, China). Purified water was provided by Wahaha Co. ltd. (Hangzhou, Zhejiang, China). Tween 80 was purchased from (Sinopharm Group Chemical Reagent Co. ltd. (Beijing, China). Heparin sodium (potency ≥ 140 U/mg) was obtained from Solarbio life sciences Co. ltd. (Beijing, China).
2.2 Instruments and analytical conditions
A Shimadzu HPLC system equipped with two LC-20AD pumps, SIL-20AC constant temperature autosampler, CTO-20A column thermostat and CBM-20A controller was used for separation. Mass spectrometric detection was performed on a PI 4000 Qtrap (Applied Biosystems, Waltham, MA, USA). The MS/MS system was operated at unit resolution in the multiple reaction monitoring (MRM) mode. The detection signals and plasma concentrations in LC-ESI-MS/MS assay were obtained using Analyst (version 1.6.3). Each sample was eluted on the Agilent Zorbax XDB C18 column (50 mm × 2.1 mm, 3.5 μm) at a flow rate of 0.5 mL/min using water containing 0.1 % formic acid (A) and acetonitrile containing 0.1 % formic acid (B). For the gradient procedure, the proportion of B mobile phase was stable at 5 % for the first 30 s, and then increased rapidly to 90 % between 30 and 90 s. This ratio remained constant during the next 1.7 min. Finally, the percentage rapidly decreased to 5 % from 3.00 to 3.01 min, and remained until 4.00 min. To obtain the most appropriate MS parameters of all analytes and IS, their methanol solutions at a concentration of 1.0 μg/mL were detected in positive and negative mode. The optimised MS detection parameters in positive mode included an ion source temperature of 500 °C, ion voltage of 5000 V, curtain gas of 25 psi, nebulizing gas of 55 psi, and turbo ion spray gas of 55 psi, which served for the analytes SPL, RUT, CYN, ISH, CHD, CAS, ARN, ART and IS (positive). The optimised MS detection parameters in negative mode included an ion source temperature of 500 °C, ion spray voltage of −4500 V, curtain gas of 30 psi, nebulizing gas of 55 psi, and turbo ion spray gas of 55 psi, which served for SPLT, DARM, ARM and IS (negative). The remaining specific parameters, such as parent ion, product ion, collision energy (CE), declustering potential (DP) and entrance potential (EP), cell exit potential (CXP), are shown in Table 1. The secondary mass spectra of 11 target components and internal standards are shown in Fig. 1. SPLT, CYN, and ARM had no stable product ions other than the quantitative product ions, but the accuracy of the parent ions and quantitative product ions of these components were verified by reference to previous studies (Qiu et al., 2018, Li et al., 2019a, 2019b, Fu et al., 2020). The component showed no obvious product ions for qualitative purposes.
MS Parameters
Q1 (m/z)
Product ion for quantification (m/z)
Product ions for identification (m/z)
DP (V)
EP (V)
CE (eV)
CXP (V)
SPL
354.9
193.1
–
90
10
23
16
RUT
611.3
303.3
465.2
70
10
30
12
CYN
449.0
287.0
–
95
10
27
15
ISH
317.1
301.9
274.1
100
10
35
12
CHD
360.8
328.0
345.1
127
12
36
17
CAS
375.1
317.1
359.2, 299.0
118
10
46
17
ARN
249.0
185.2
189.1, 145.0
88
15
15
17
ART
283.2
151.2
88.9
84
15
21
10
+IS
386.0
122.0
222.2
20
10
30
15
SPLT
191.3
175.9
147.8
–47
–10
–22
–10
DARM
234.9
73.0
217.0
–76
–10
–28
–15
ARM
279.0
233.0
–
–29
–10
–15
–15
–IS
251.0
208.0
102.1
–61
–10
–20
–12
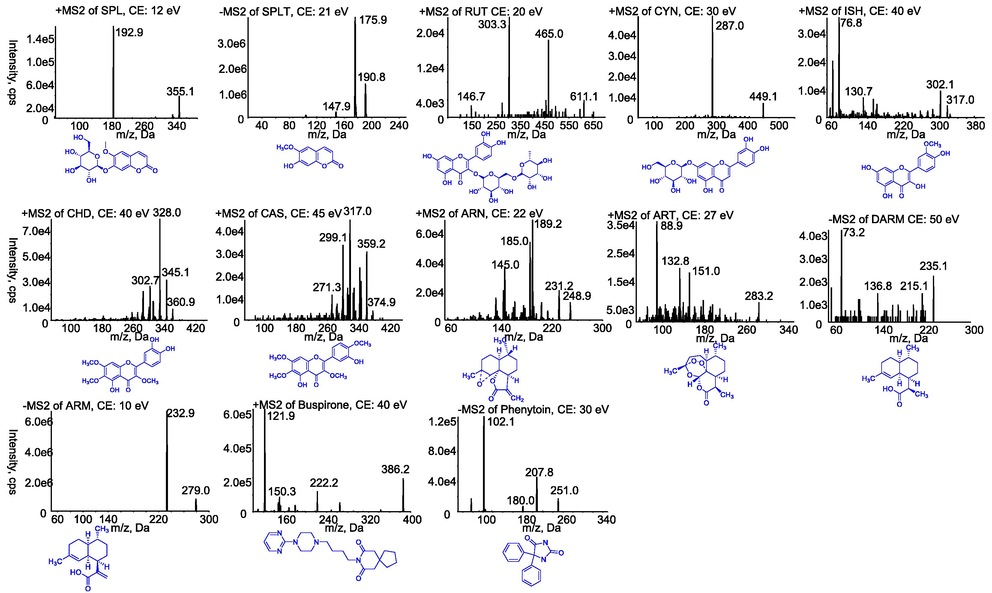
Product ion mass spectra of eleven target components and internal standards. SPL (A); RUT (B); CYN (C); ISH (D); CHD (E); CAS (F); ARN (G); ART (H); buspirone (I); SPLT (J); DARM (K); ARM (L); phenytoin (M).
2.3 Experimental Animals
The animal experiment was carried out according to the Guide for the Care and Use of Laboratory Animals (published by the USA National Institutes of Health, NIH Publication no. 85–23, revised 1996), and was approved by the Experimental Animal Welfare Ethics Committee of Capital Medical University (Approval No. AEEI-2015–180). Six Male Sprague-Dawley (SD) rats aged 6 ∼ 8 weeks with body weight of 210 ± 10 g were provided by Beijing HFK Bioscience Co. ltd. (Beijing, China). Newly arrived rats were acclimatized in animal cages for 1 week while being given food and water. Food was withdrawn 18 h before the start of the experiment.
2.4 Preparation of solutions
2.4.1 Preparation of standard solution, calibration curve and quality control samples
The stock solutions of SPL, SPLT, RUT, CYN, ISH, CHD, CAS, ARN, ART, DARM, ARM, buspirone and phenytoin were prepared in dimethyl sulfoxide at a concentrations of 1.00 mg/mL. For the preparation of calibration curves, a series of mixed working standards at concentrations of 10.0–10,000 ng/mL for SPL, SPLT, RUT, CYN, ISH, CHD, CAS and ARN, 20.0–20,000 ng/mL for ART, 500–500,000 ng/mL for DARM, and 50.0–50,000 ng/mL for ARM, were obtained by diluting a mixture of the stock solutions with methanol. Similarly, the working solutions of quality control (QCs) samples with high, medium, or low concentrations were prepared. They contained SPL, SPLT, RUT, CYN, ISH, CHD, CAS, and ARN of 20.0, 500, and 8000 ng/mL, ART of 400, 2000, and 16,000 ng/mL, DARM of 10,000, 50,000, 400,000 ng/mL, and ARM of 100, 2000, 40,000 ng/mL.
2.4.2 Preparation and QC of A. annua extract
The A. annua extract was prepared by heating and refluxing the original material for 1 h using 80 % ethanol (1:40), followed by rotary volatilization and lyophilization. To calculate the pharmacokinetic parameters of each component, the content of each component was determined by the current LC–ESI–MS/MS.
2.5 Pharmacokinetics experiment
Two days before starting the pharmacokinetic experiments, model rats were prepared by implanting a polyethylene cannula into the jugular vein of each rat after receiving pentobarbital anesthesia (50 mg/kg, intravenous). The cannulas were exposed on the back of the neck and filled with heparin saline (20 units/mL). The formal experiment was performed after the rats had fasted for 12 h. To achieve slow release and stability in vivo, A. annua extract suspensions containing suspending and wetting agents were prepared as drug delivery formulations. Aliquots of 20 g extract powder were dispersed in distilled water containing 0.5 % (w/v) CMC-Na and 0.5 % (v/v) Tween-80 as a suspension for in vivo experiments. The dosing suspension was freshly prepared on the day of the experiment. Based on our team's and others’ previous pharmacodynamic and pharmacokinetic experiments (Li et al., 2018, Wang et al., 2019a, 2019b), the oral administration dose was set at 4 g/kg of rat weight. The blood samples (∼0.3 mL) were collected through the jugular vein into heparinised tubes before administration and at 0.083, 0.167, 0.5, 1.0, 2.0, 4, 6, 8, 12, 24 and 48 h. Plasma samples were obtained by centrifuging the blood samples immediately at 4000 g for 5 min and then stored at −20 °C until analysis.
2.6 Plasma sample preparation
Fifty microliters of each plasma sample were processed by adding 100 μL of IS solution and 5 μL of standard solution (for method validation) or methanol (for actual sample analysis). After vortexing for 1 min, the samples were centrifuged at 10,000 g and 4 °C for 10 min. Five microliters of supernatant was injected into the LC–ESI–MS/MS system for analysis.
2.7 Method validation
According to the FDA biological sample analysis guidelines (2018), the LC–ESI–MS/MS method was fully validated, including selectivity, linearity, lower limit of quantification (LLOQ), precision and accuracy, recovery, matrix effect, and stability.
2.7.1 Selectivity
The selectivity of the method was evaluated by comparing the chromatograms of each analyte in blank plasma, standard spiked plasma, and a sample plasma.
2.7.2 Linearity, range and LLOQ
Linearity was evaluated by plotting the calibration curves. The regression equations were obtained by least squares (weight of 1/X2) linear regression on the ratio of the component peak area to internal standard peak area with the component concentration in plasma. Parameters including slope, intercept and correlation coefficient of the calibration curves were calculated, where the correlation coefficient (R) ≥ 0.99 was acceptable. The lower limit of quantification (LLOQ) referred to the lowest concentration whose precision and accuracy should be within −20 to 20 %.
2.7.3 Accuracy and precision
LLOQ and QC samples with low, medium and high concentrations (n = 5) were analyzed three times in parallel. The actual concentration of each component was calculated by the accompanying calibration curve. Accuracy was obtained from the relative error expressed as percentage (RE%), and precision was calculated using the relative standard deviation (RSD%). The intra- and inter-batch precision of LLOQ and QCs did not exceed ± 20 % and ± 15 %, respectively.
2.7.4 Recoveries and matrix effects
The extraction recoveries were evaluated through the ratio of mean peak areas between regularly prepared QC samples (low, medium and high concentrations) and spike-after-extraction plasma samples. Similarly, the matrix effect was assessed through the ratio of peak areas between post-extraction samples spiked with analytes and mobile phase spiked with analytes at the same concentration.
2.7.5 Stability
The stability of each analyte at different conditions (room temperature for 24 h, −80 °C for 1 month, and three freeze–thaw cycles from −20 °C to room temperature) was assessed by analyzing five replicates at QC levels. It could be acceptable when the stability of all analytes ranged from 85 % to 115 %.
2.8 Analysis of pharmacokinetic parameters
The pharmacokinetic program DAS (version 2.0) was used to calculate the main pharmacokinetic parameters such as Cmax, Tmax, AUC, t1/2, MRT, VZ/F, and ClZ/F, which represent peak concentration, peak time, area under the curve, half-life, average dwell time, apparent volumes of distribution and clearance, respectively. All the results were demonstrated as mean ± SD, and statistical analysis was implemented using a single-tailed Student’s t test.
2.9 Molecular docking
To clarify the molecular interactions between the components determined and human CYPs, SPL, SPLT, RUT, CHD, CAS, ARN, DARM and ARM were separately docked into the active pockets of CYP1A2 (PDB ID: 2HI4), 2C9 (PDB ID: 5W0C), 2C19 (PDB ID: 4GQS), 2D6 (PDB ID: 5TFT), 2E1 (PDB ID: 3T3Z) and 3A4 (PDB ID: 3UA1), using the Glide program designed by Schrödinger Inc. (New York, USA). Molecular docking was performed after the protein and ligand were prepared. The “Protein Preparation” module of the “Glide” toolkit was used to analyze the target protein, including removing water and solvent molecules, adding polar hydrogen to the molecular structure, adding charge, and repairing lost amino acid residues to optimise the protein structure. Using the “Receptor Grid Generation” module, the active region of the protein molecule was defined as a cavity within 0.5 Å of the original ligand, centered on the ligand molecule in the crystal structure, which was the ideal site for docking with the component. The “Ligand Docking” module was used to perform molecular docking and to calculate the interaction between ligand molecules and proteins. The optimised small molecules were molecularly docked to the active pockets of the protein one by one and the binding of each ligand molecule to the target protein was evaluated. A Docking score ≥ 5 indicated that the ligand was able to interact with the receptor and the higher the score, the stronger the binding between the protein and the small molecule (Jain 1996).
3 Results and discussion
3.1 Method validation
The typical chromatograms of the blank plasma solution without IS, standard plasma solutions of different concentrations and the sample plasma solution are shown in Fig. 2. Thirteen channels were illustrated and the retention times of SPL, SPLT, RUT, CYN, ISH, CHD, CAS, ARN, ART, DARM, ARM and two ISs were 1.71, 1.83, 1.76, 1.77, 1.95, 1.96, 2.05, 2.14, 2.20, 2.37, 2.40, 1.77 and 1.94 min, respectively. All the peaks of the analytes and ISs were detected with excellent resolution as well as peak shapes. The endogenous substances and possible metabolites in the plasma did not interfere with the determination of each component and the IS. Meanwhile, the test component and the ISs did not interfere with each other, indicating that the LC–ESI–MS/MS method established in this study had good selectivity. The regression equations, correlation coefficients, ranges and LLOQs are shown in Table 2. There was excellent correlation between the ratio of peak area and concentration for each component within the test ranges. The LLOQs were all 1.00 ng/mL for SPL, SPLT, RUT, CYN, ISH, CHD, CAS and ARN, while the LLOQs for ART, DARM and ARM were 20.0, 500 and 5.00 ng/mL, respectively, indicating that this method was sensitive for the quantitative assessment of most components. The assay precision and accuracy results are shown in Table 3. The intra- and inter-batch precisions (RSD) of these analytes were all less than 13.2 % and 11.0 %, and the accuracies ranged from 89.6 % to 114 %. The extraction recovery and matrix effect of the 11 analytes and IS data are shown in Table 4. Mean absolute recovery of 11 components ranged from 93.6 % to 106 % with RSD ≤ 12.7 %, and the matrix effects ranged from 92.7 % to 104 % with RSD ≤ 7.87 %. The stability data in Table 5 indicated that the 11 analytes in rat plasma were all stable with RSD < 13.1 % for autosampler for 24 h, three freeze–thaw cycles and long-term (30 days at −80 °C).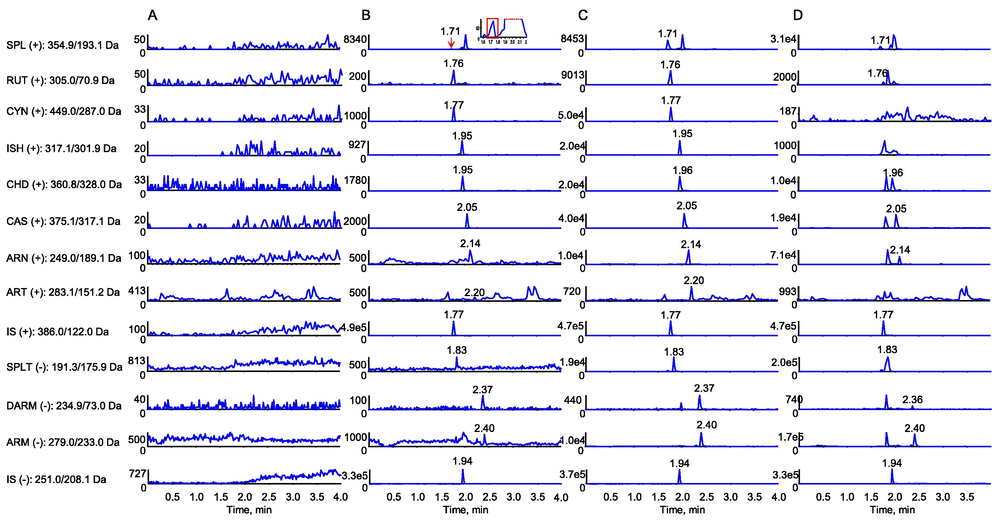
MRM chromatograms of 11 components and two ISs in the plasma of SD rats determined by LC–ESI–MS/MS. (A) Blank plasma without added components and internal standards. (B) Blank plasma supplemented with LLOQ concentration level component and internal standard. SPL, SPLT, RUT, CYN, ISH, CHD, CAS and ARN were all at 1.00 ng/mL, while ART, DARM and ARM were at 20.0, 500 and 5.00 ng/mL, respectively. (C) Blank plasma supplemented with MQC concentration level component and internal standard. SPL, SPLT, RUT, CYN, ISH, CHD, CAS and ARN were all at 50 ng/mL, while ART, DARM and ARM were at 200, 5000 and 200 ng/mL, respectively. (D) Plasma collected from rats after single administration of 4 g/kg. The peak acquisition time points were 5 min after administration for CAS (8.04 ng/mL), CHD (5.98 ng/mL), DARM (589 ng/mL) and ARM (6720 ng/mL), and 8 h after administration for SPL (79.1 ng/mL), SPLT (38.1 ng/mL), ISH, ART, LUT (2.00 ng/mL), CYN and ARN (99.0 ng/mL).
Analytes
Regression equations
Correlation coefficient (R)
Linear range (ng/mL)
LLOQ (ng/mL)
SPL
Y = 5.64 × 10⁻⁴X + 4.39 × 10⁻⁵
0.9981
1.00 ∼ 1000
1.00
SPLT
Y = 1.44 × 10⁻³X + 3.44 × 10⁻⁴
0.9993
1.00 ∼ 1000
1.00
RUT
Y = 4.97 × 10⁻⁴X + 6.29 × 10⁻⁶
0.9978
1.00 ∼ 1000
1.00
CYN
Y = 1.82 × 10⁻³X + 2.89 × 10⁻⁴
0.9983
1.00 ∼ 1000
1.00
ISH
Y = 2.90 × 10⁻⁵X + 3.02 × 10⁻⁵
0.9982
1.00 ∼ 1000
1.00
CHD
Y = 1.92 × 10⁻³X + 9.59 × 10⁻⁴
0.9977
1.00 ∼ 1000
1.00
CAS
Y = 1.43 × 10⁻²X + 1.51 × 10⁻³
0.9984
1.00 ∼ 1000
1.00
ARN
Y = 8.64 × 10⁻⁴X + 4.33 × 10⁻⁴
0.9979
1.00 ∼ 1000
1.00
ART
Y = 2.76 × 10⁻⁶X + 6.96 × 10⁻⁵
0.9954
20.0 ∼ 20,000
20.0
DARM
Y = 2.97 × 10⁻⁷X + 1.83 × 10⁻⁴
0.9991
500 ∼ 50,000
500
ARM
Y = 8.78 × 10⁻⁵X + 1.58 × 10⁻⁴
0.9984
5.00 ∼ 5000
5.00
Analyte
Con. (ng/mL)
Batch 1
Batch 2
Batch 3
Inter-batch
RSD (%)
Accuracy (%)
RSD (%)
Accuracy (%)
RSD (%)
Accuracy (%)
RSD (%)
Accuracy (%)
SPL
1.00
1.06 ± 0.05
5.08
106
1.07 ± 0.04
3.42
107
1.03 ± 0.04
3.66
103
1.05 ± 0.02
1.90
105
2.00
1.96 ± 0.14
7.07
97.9
2.09 ± 0.22
10.7
104
2.15 ± 0.13
6.11
107
2.07 ± 0.10
4.81
103
50.0
50.7 ± 4.38
8.64
101
52.9 ± 3.08
5.83
106
51.5 ± 5.85
11.4
103
51.7 ± 1.14
2.20
103
800
839 ± 56.5
6.73
105
855 ± 18.4
2.15
107
852 ± 56.5
6.63
106
849 ± 8.56
1.01
106
SPLT
1.00
0.98 ± 0.06
6.30
97.7
0.99 ± 0.07
7.52
99.5
1.04 ± 0.05
4.97
104
1.00 ± 0.03
3.05
100
2.00
2.08 ± 0.11
5.25
104
2.06 ± 0.18
8.93
103
2.02 ± 0.12
5.78
101
2.06 ± 0.03
1.52
103
50.0
52.4 ± 2.73
4.52
105
53.2 ± 3.43
6.45
106
53. ± 1.63
3.09
106
52.9 ± 0.45
0.85
106
800
829 ± 16.9
2.04
104
811 ± 51.7
6.38
101
843 ± 16.0
1.90
105
828 ± 15.7
1.89
103
RUT
1.00
1.03 ± 0.04
4.12
103
0.96 ± 0.10
10.5
96.1
1.14 ± 0.01
1.14
114
1.05 ± 0.09
8.72
105
2.00
2.02 ± 0.08
4.04
101
2.09 ± 0.12
5.89
105
2.12 ± 0.17
7.88
106
2.08 ± 0.05
2.33
104
50.0
51.9 ± 3.09
5.94
104
54.0 ± 1.65
3.06
108
49.8 ± 4.20
8.40
99.5
51.9 ± 2.10
4.05
104
800
804 ± 55.5
6.91
101
790 ± 66.2
8.38
98.8
800 ± 34.4
4.29
100
798 ± 7.30
0.92
99.9
CYN
1.00
1.02 ± 0.03
3.09
102
0.93 ± 0.02
2.39
93.0
1.09 ± 0.03
2.49
109
1.01 ± 0.08
7.75
101
2.00
2.15 ± 0.16
7.34
107
2.15 ± 0.02
0.76
107
2.12 ± 0.07
3.20
106
2.14 ± 0.02
0.86
107
50.0
50.9 ± 4.82
9.47
102
54.8 ± 1.47
2.68
110
52.7 ± 3.38
6.42
105
52.8 ± 1.93
3.66
106
800
814 ± 59.0
7.25
102
811 ± 41.5
5.11
101
817 ± 37.2
4.56
102
814 ± 3.00
0.37
102
ISH
1.00
1.07 ± 0.06
5.19
107
1.02 ± 0.05
5.32
102
1.11 ± 0.03
2.89
111
1.06 ± 0.05
4.36
106
2.00
2.03 ± 0.06
2.75
102
2.08 ± 0.05
2.43
104
2.02 ± 0.20
9.94
101
2.05 ± 0.03
1.59
102
50.0
48.5 ± 4.30
8.90
96.8
52.7 ± 2.55
4.83
105
50.4 ± 2.66
5.30
101
50.5 ± 2.12
4.20
101
800
793 ± 39.1
4.93
99.2
851 ± 36.9
4.33
106
773 ± 29.0
3.76
96.6
806 ± 40.7
5.05
101
CHD
1.00
1.02 ± 0.06
6.16
102
0.98 ± 0.05
4.87
97.8
1.04 ± 0.05
5.10
104
1.01 ± 0.03
3.12
101
2.00
2.06 ± 0.15
7.20
103
2.09 ± 0.04
1.85
105
2.04 ± 0.17
8.30
102
2.06 ± 0.03
1.27
103
50.0
53.4 ± 2.73
5.11
107
53.5 ± 2.39
4.46
107
49.8 ± 5.55
11.2
99.7
52.2 ± 2.15
4.11
105
800
813 ± 38.1
4.68
102
753 ± 34.2
4.54
94.2
820 ± 34.2
4.17
103
795 ± 36.5
4.59
99.4
CAS
1.00
0.98 ± 0.06
6.40
97.5
0.98 ± 0.09
9.61
97.7
1.07 ± 0.05
4.49
107
1.01 ± 0.06
5.59
101
2.00
1.97 ± 0.11
5.67
98.4
2.08 ± 0.02
1.18
104
2.09 ± 0.14
6.67
105
2.05 ± 0.07
3.40
102
50.0
51.9 ± 3.33
6.40
104
50.1 ± 3.08
6.14
100
48.6 ± 4.59
9.45
97.2
50.2 ± 1.69
3.36
100
800
791 ± 96.4
12.2
99.1
737 ± 64.7
8.78
92.2
853 ± 53.2
6.24
107
794 ± 57.7
7.28
99.3
ARN
1.00
0.99 ± 0.10
10.4
98.8
1.03 ± 0.08
7.39
103
0.91 ± 0.23
12.5
99.4
0.98 ± 0.06
5.91
100
2.00
2.01 ± 0.15
7.66
100
2.03 ± 0.17
8.27
101
1.98 ± 0.18
8.99
98.9
2.01 ± 0.02
1.20
100
50.0
50.2 ± 5.82
11.6
102
53.7 ± 2.93
5.46
107
43.1 ± 7.37
11.1
93.2
49.0 ± 5.40
11.0
101
800
769 ± 84.5
11.0
97.8
697 ± 65.2
9.35
89.6
778 ± 83.4
10.7
97.2
748 ± 44.5
5.95
94.9
ART
20.0
20.6 ± 1.30
6.32
103
19.0 ± 2.51
13.2
97.4
20.3 ± 2.18
10.7
101
20.0 ± 0.84
4.22
101
40.0
40.3 ± 1.37
3.39
101
40.5 ± 4.15
10.2
101
37.7 ± 2.00
5.30
94.1
39.5 ± 1.58
4.01
98.7
200
207 ± 18.9
9.12
104
201 ± 23.8
11.9
100
196 ± 8.62
4.41
97.7
201 ± 5.82
2.89
101
1600
1624 ± 115
7.11
101
1602 ± 110
6.84
100
1714 ± 35.8
2.09
107
1647 ± 53.9
3.60
103
DARM
500
489 ± 36.8
7.51
97.9
506 ± 23.0
4.55
101
538 ± 31.4
5.84
108
511 ± 24.9
4.87
102
1000
1031 ± 65.4
6.35
103
1052 ± 86.0
8.17
105
987 ± 18.7
1.90
98.7
1023 ± 33.0
3.22
102
5000
5122 ± 316
6.17
102
5084 ± 412
8.10
102
5036 ± 168
3.33
101
5081 ± 43.1
0.85
102
40,000
40280 ± 2622
6.51
101
39460 ± 3482
8.82
98.6
41520 ± 2946
7.09
104
40420 ± 1037
2.57
101
ARM
5.00
5.25 ± 0.23
4.41
105
4.91 ± 0.29
5.94
98.1
5.05 ± 0.31
6.22
101
5.07 ± 0.17
3.34
101
10.0
10.1 ± 0.42
4.21
101
10.6 ± 0.76
7.13
106
10.4 ± 0.53
5.07
104
10.3 ± 0.27
2.64
103
200
214 ± 11.2
5.23
107
217 ± 6.53
3.01
108
214 ± 8.73
4.09
107
215 ± 1.79
0.83
107
4000
3940 ± 308
7.81
98.5
3844 ± 406
10.6
96.2
4046 ± 316
7.80
101
3943 ± 101
2.56
98.7
Analyte
Con. (ng/mL)
Matrix effect (%)
RSD (%)
Recovery (%)
RSD (%)
SPL
2.00
98.3
0.93
98.3
1.06
50.0
99.9
0.52
101.5
2.61
800
101.4
1.69
99.2
1.49
SPLT
2.00
101.7
4.39
93.6
3.33
50.0
96.1
3.92
95.8
2.29
800
92.7
7.87
96.1
2.73
RUT
2.00
99.7
1.76
101.3
2.91
50.0
97.9
2.60
105.4
2.32
800
100.3
0.60
101.2
3.31
CYN
2.00
98.0
6.69
102.4
3.02
50.0
96.7
3.63
103.9
2.36
800
104.0
5.66
104.1
3.45
ISH
2.00
96.0
5.42
100.7
12.7
50.0
100.9
0.93
95.5
1.54
800
100.8
2.50
96.1
3.12
CHD
2.00
99.9
0.83
94.7
3.85
50.0
98.9
1.68
96.8
3.60
800
97.0
3.43
98.3
1.20
CAS
2.00
98.2
7.22
102.1
1.34
50.0
101.6
3.99
101.0
4.23
800
102.6
4.55
102.5
4.27
ARN
2.00
100.4
4.31
103.2
6.44
50.0
98.1
1.19
106.0
1.56
800
98.5
1.00
105.7
2.70
ART
40.0
98.6
5.12
103.1
5.70
200
93.5
5.50
105.5
3.86
1600
96.9
2.36
104.9
3.38
DARM
1000
98.2
7.22
101.4
7.74
5000
101.6
3.99
103.7
10.3
40,000
102.6
4.55
95.2
2.80
ARM
10.0
100.5
4.16
101.0
7.42
200
97.8
3.44
102.4
4.02
4000
102.8
3.43
102.9
1.54
Analyte
Con. (ng/mL)
Three freeze/thaw cycles
Autosampler for 24 h (4 °C)
Long-term (30 days at − 80 °C)
RSD (%)
RE (%)
RSD (%)
RE (%)
RSD (%)
RE (%)
SPL
2.00
1.87 ± 0.15
8.17
0.37
1.97 ± 0.11
5.65
5.51
1.97 ± 0.13
6.46
5.21
50.0
46.2 ± 2.09
4.53
–12.9
51.4 ± 1.89
3.68
–3.15
49.4 ± 3.71
7.50
–6.67
800
849 ± 35.7
4.20
–1.79
827 ± 33.6
4.07
–4.48
796 ± 57.1
7.17
–8.15
SPLT
2.00
2.17 ± 0.07
3.06
4.40
2.01 ± 0.15
7.38
–2.96
2.07 ± 0.16
7.81
–0.54
50.0
50.5 ± 2.77
5.49
–3.27
49.0 ± 3.21
6.55
–6.38
50.3 ± 2.88
5.72
–3.80
800
857 ± 33.7
3.94
3.34
806 ± 82.7
10.3
–2.91
839 ± 51.8
6.17
1.24
RUT
2.00
1.94 ± 0.15
7.89
–7.98
2.05 ± 0.10
4.97
–2.86
2.09 ± 0.12
5.76
–0.95
50.0
50.5 ± 4.76
9.43
–4.55
51.8 ± 3.83
7.39
–2.05
50.5 ± 4.76
9.43
–4.55
800
788 ± 46.8
5.94
–3.31
838 ± 57.2
6.83
2.84
787 ± 63.9
8.12
–3.52
CYN
2.00
1.88 ± 0.22
11.9
–12.8
2.01 ± 0.16
2.80
–6.59
2.13 ± 0.06
2.89
–1.08
50.0
49.5 ± 2.34
4.72
–7.57
53.3 ± 2.49
4.67
–0.47
53.6 ± 2.12
3.95
0.08
800
820 ± 42.1
5.13
0.51
784 ± 42.3
5.40
–3.87
820 ± 42.1
5.13
0.51
ISH
2.00
2.03 ± 0.06
2.75
–0.93
1.99 ± 0.12
5.98
–2.84
2.05 ± 0.16
7.64
–0.13
50.0
49.2 ± 4.01
8.16
1.19
48.6 ± 3.01
6.19
–0.38
45.2 ± 1.63
3.61
–7.06
800
793 ± 39.1
4.93
–5.22
810 ± 28.9
3.57
–3.17
797 ± 45.3
5.69
–4.78
CHD
2.00
2.06 ± 0.15
7.20
–0.13
2.10 ± 0.18
8.55
1.89
2.11 ± 0.14
6.57
2.76
50.0
53.4 ± 2.73
5.11
–0.6
50.3 ± 5.53
11.0
–6.05
50.3 ± 3.42
6.79
–6.32
800
791 ± 58.0
7.33
96.8
782 ± 47.0
6.01
2.60
743 ± 44.3
5.96
–2.53
CAS
2.00
2.05 ± 0.12
5.75
4.36
1.96 ± 0.15
7.47
–0.12
2.04 ± 0.24
6.84
4.26
50.0
48.3 ± 2.11
4.37
–6.57
48.6 ± 6.36
13.1
–5.95
49.2 ± 3.02
6.13
–5.18
800
853 ± 53.2
6.24
10.9
812 ± 70.7
8.71
6.18
726.8 ± 65.1
8.95
–4.08
ARN
2.00
2.01 ± 0.15
7.66
0.48
1.97 ± 0.10
4.88
–1.42
2.08 ± 0.16
7.52
3.83
50.0
50.8 ± 4.45
8.75
7.53
48.3 ± 4.51
9.33
2.48
52.2 ± 2.96
5.67
10.6
800
781 ± 65.2
8.34
0.30
806 ± 44.4
5.50
3.56
739 ± 39.9
5.40
–4.88
ART
40.0
38.6 ± 4.35
11.3
2.11
37.0 ± 1.80
4.80
–2.16
40.8 ± 0.96
2.35
7.45
200
196 ± 14.3
7.33
0.57
203 ± 15.6
7.68
3.68
202 ± 16.3
8.04
3.86
1600
1636 ± 79.9
4.88
–3.59
1676 ± 109
6.49
–1.33
1684 ± 105
6.21
–0.88
DARM
1000
1036 ± 55.5
5.36
4.96
1035 ± 77.0
7.44
4.90
1021 ± 40.2
3.93
3.47
5000
5254 ± 211
4.02
4.38
5072 ± 488
9.61
0.83
5170 ± 372
7.20
2.67
40,000
43180 ± 1527
3.54
4.50
40280 ± 2622
6.51
–2.61
41300 ± 2586
6.26
–0.13
ARM
10.00
9.91 ± 0.35
3.49
–1.02
10.4 ± 0.70
6.69
4.00
10.1 ± 0.58
5.68
1.22
200
216 ± 7.09
3.29
–1.28
208 ± 9.81
4.71
–4.75
213 ± 4.55
2.13
–2.48
4000
4148 ± 265
6.40
8.18
3726 ± 432
11.6
–2.85
4014 ± 315
7.86
3.99
3.2 Method optimization
The response values of the 11 components to be measured in the positive and negative ionization modes were found to be different. SPL, RUT, CYN, ISH, CHD, CAS, ARN and ART had high and stable response values in the positive ionization mode, while SPLT, DARM and ARM had higher response values in the negative ionization mode, and therefore were quantified in the positive and negative ionization modes, respectively. To achieve accurate quantification, two ISs, buspirone and phenytoin, were used for positive and negative ion modes, respectively.
To ensure the separation of these components and the interfering components, and to shorten the analysis time as much as possible, different elution gradients were investigated when establishing the method. Eventually, it was found that good separation of the components could be achieved with the available gradients, and the analysis time was only 4.0 min, allowing the analysis of at least 200 samples per day. Since the chemical components in plasma samples are very complex and are variable at different time points, we also tried another fast and sensitive method (UPLC-PDA) in the pre-study stage. Finally, the LC-ESI-MS/MS method was more sensitive and was able to detect compounds at low concentrations as much as possible at different time points.
Although studies have been conducted to analyze artemisinin and flavonoids in A. annua in blood (Dai et al., 2019, Wang et al., 2019a, 2019b), no analytical method has been fully validated for the simultaneous quantitative determination of coumarins, flavonoids and sesquiterpenoids in A. annua in blood. In this study, the LC-ESI- MS/MS method was developed for the simultaneous determination of 11 chemical components in plasma, and eight of them were detected in plasma from rats orally administered A. annua. This is the first time that so many components in A. annua have been simultaneously detected in rat plasma.
3.3 Optimization and quantitative analysis of dosing suspension
Since A. annua is usually administered orally in the form of decoctions in clinical practice, the extract of A. annua for administration was obtained by heating and refluxing to ensure its similarity to that in clinical use. The contents of 11 compounds in A. annua extract were 0.146 mg/kg for SPL, 0.603 mg/kg for SPLT, 0.019 mg/kg for RUT, 0.016 mg/kg for CYN, 0.068 mg/kg for ISH, 0.138 mg/kg for CHD, 0.177 mg/kg for CAS, 0.124 mg/kg for ARN, 0.096 mg/kg for ART, 0.565 mg/kg for DARM, 3.50 mg/kg for ARM. The doses given to the rats were 0.584 mg/kg for SPL, 2.41 mg/kg for SPLT, 0.074 mg/kg for RUT, 0.064 mg/kg for CYN, 0.272 mg/kg for ISH, 0.552 mg/kg for CHD, 0.707 mg/kg for CAS, 0.496 mg/kg for ARN, 0.383 mg/kg for ART, 2.26 mg/kg for DARM, and 14.0 mg/kg for ARM.
Suspensions as oral drug delivery formulations were prepared to enable the components of A. annua to exert their therapeutic effects slowly and stably. To improve the stability of A. annua extract in the dispersion medium (water), small amounts of CMC-Na and Tween-80 were used as a suspension aid and wetting agent, respectively, so that A. annua extract could be uniformly dispersed in the aqueous medium, reducing the phenomenon of extract settling and phase separation, and finally enabling all six rats to be given the drug solution uniformly.
3.4 Pharmacokinetic study
The validated LC–ESI–MS/MS method was implemented to monitor the pharmacokinetic study of 11 components in rat plasma after oral administration of A. annua extract at a dose of 4 g/kg. The DAS software with a non-compartmental model was used to calculate the pharmacokinetic parameters. The results showed that two coumarins (SPL and SPLT), three flavonoids (RUT, CHD and CAS) and three sesquiterpenes (ARN, DARM and ARM) were detected in rat plasma by LC–ESI–MS/MS, but ART, CYN and ISH were not detected, indicating that the blood concentrations of these three components were lower than the corresponding quantitative levels. The blood concentrations of these three components were lower than the corresponding LLOQs (20.0, 1.00 and 1.00 ng/mL, respectively). ART was not detected in this pharmacokinetic study, which may have been for the following reasons: (1) A. annua used in this study originated from Hebei, China, and the content of ART in this region is lower (Fu et al., 2020); (2) to take into account extraction of other active components in A. annua, the extract was obtained by heating reflux in 80 % ethanol, resulting in loss of ART (Nahar et al., 2020); and (3) the bioavailability of ART is low, about 12.2 % in rats (Fu et al., 2021).
Since the content of ARM in plasma was higher, and exceeded the upper limit of the linear range of the current determination method, the content of ARM was measured after all samples were diluted 10 times with blank plasma. The mean plasma concentration–time profiles of the eight components are shown in Fig. 3, and the main pharmacokinetic parameters of each component are shown in Table 6.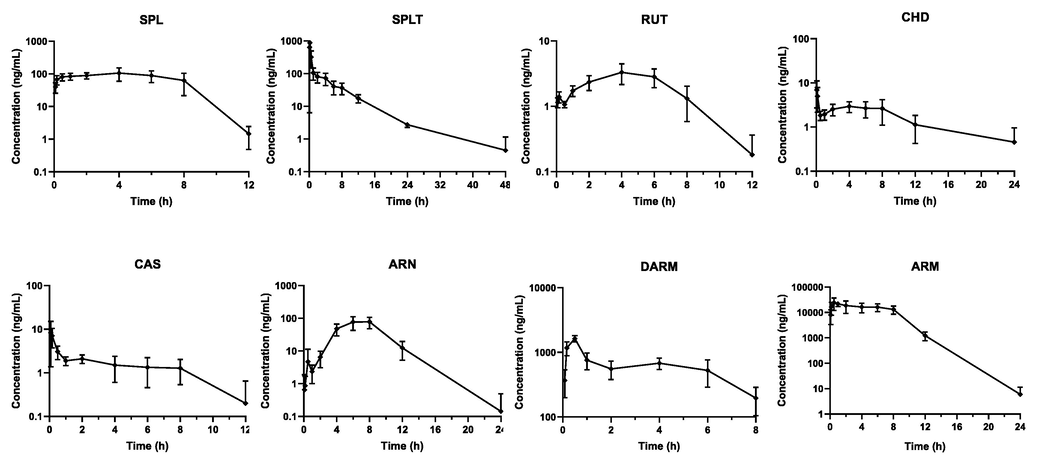
Mean plasma concentration–time profiles of eight analytes in SD rats after oral administration of A. annua extract (Mean ± SD, n = 6).
Parameters
SPL
SPLT
RUT
CHD
CAS
ARN
DARM
ARM
Dose (mg/kg)
0.584
2.41
0.074
0.552
0.707
0.496
2.26
14.0
AUC(0-t) (μg/L*h)
845 ± 267
1098 ± 353
30.5 ± 19.9
78.3 ± 25.5
32.2 ± 18.1
574 ± 97.0
5426 ± 1958
171240 ± 45806
AUC(0-∞) (μg/L*h)
846 ± 268
1107 ± 349
38.0 ± 17.3
108 ± 25.8
37.7 ± 25.8
772 ± 452
7027 ± 3457
172477 ± 46723
MRT(0-t) (h)
4.82 ± 0.39
5.39 ± 1.43
8.77 ± 5.50
17.7 ± 1.66
8.63 ± 4.93
7.31 ± 0.88
3.32 ± 1.44
4.83 ± 0.43
MRT(0-∞) (h)
4.89 ± 0.40
5.87 ± 1.51
14.9 ± 8.29
38.4 ± 18.8
13.9 ± 11.3
6.69 ± 2.19
6.41 ± 4.24
4.90 ± 0.40
t1/2 (h)
6.62 ± 1.59
6.53 ± 1.84
6.60 ± 1.46
2.68 ± 3.62
0.33 ± 0.07
10.3 ± 1.40
4.32 ± 2.85
6.49 ± 3.03
Tmax (h)
3.17 ± 2.21
0.15 ± 0.03
3.69 ± 2.29
0.11 ± 0.04
0.13 ± 0.05
6.67 ± 1.63
1.36 ± 1.44
0.92 ± 0.58
CLz/F (L/h/kg)
0.73 ± 0.17
2.41 ± 0.95
2.62 ± 2.65
5.37 ± 1.28
20.6 ± 10.3
0.77 ± 0.28
0.33 ± 0.14
0.77 ± 0.28
Vz/F (L/kg)
5.36 ± 4.51
23.1 ± 11.5
36.0 ± 30.3
199 ± 99.2
334 ± 149
2.60 ± 1.14
1.88 ± 0.80
2.60 ± 1.14
Cmax (μg/L)
121 ± 37.7
653 ± 179
3.99 ± 2.71
7.08 ± 3.23
13.1 ± 6.06
93.3 ± 31.2
1698 ± 440
24200 ± 8384
Both SPL and SPLT are coumarins, and SPLT is the glycoside element of SPL. In comparison, SPLT reached peak concentration faster than SPL, and the peak concentration ratio was about 1:4, which was consistent with the content ratio of both in A. annua (Table 6). Both components reached their elimination t1/2 at ∼ 6 h, indicating that the elimination rate of SPLT in vivo was slower than that of SPL. Also, the amount of SPL absorbed into the blood (AUC) was higher.
After oral administration, some glycosides may be hydrolysed into aglycones by glycoside hydrolases at the edge of the small intestinal villi and absorbed into the blood, which in turn may be reformed into glycosides in the blood by the action of phase II metabolic enzymes such as glucuronidase or sulfurylase in the small intestine or liver (Pei and Guo 2006). Metabolism of SPL in rats to produce SPLT has been reported (Li et al., 2019a, 2019b). Therefore, variation of blood concentrations of SPL and SPLT in vivo is not entirely influenced by their own concentrations, but a dynamic equilibrium resulting from their mutual transformation in vivo. The slower elimination of SPLT than SPL may also be due to the gradual metabolic conversion of SPL to SPLT in vivo, which prolongs the duration of action of SPLT in vivo.
Studies have shown that coumarin glycosides are more hydrophilic and not easily absorbed due to the attachment of glycosyl groups, whereas free coumarins have greater hydrophobicity and can be absorbed in the intestine by passive diffusion through biological membranes (Shan et al., 2011). Most glycoside elements have stronger antioxidant, antidiabetic, anti-inflammatory, antibacterial, anticancer, and anticoagulant activities than their corresponding glycosides have, and glycoside elements are more likely to bind to plasma proteins in vivo, thus maintaining stable properties and exerting therapeutic effects through sustained release (Xiao 2017). Combining the actual absorption and literature reports, it is speculated that SPLT might have a higher bioavailability than SPL.
RUT, CHD and CAS are all flavonoids. CHD and CAS are two methoxy flavonoids with similar structures and high concentrations (138 and 177 μg/g, respectively) in A. annua. They both reached Cmax and decreased in vivo rapidly, but with longer MRTS. The plasma concentration time curve of CHD showed obvious double peaks, which usually be caused by enterohepatic circulation, double absorption sites in the intestine, and gastrointestinal circulation (Liu et al., 1996, Nguyen et al., 2015, Cai et al., 2016). Although the in vitro concentration of CHD was lower than that of CAS, the bimodal phenomenon resulted in a higher absorption rate and MRT of CHD in the blood than CAS, suggesting that CHD may have a higher bioavailability than CAS. RUT is similar to SPL in that both are flavonoid glycosides. It took a long time to reach Cmax and exhibited a long elimination t1/2 and mean retention time. Due to the bimodal peaks showing in the concentration time curve, it has a higher blood absorption despite its low concentration in A. annua.
ARN, DARM and ARM are all sesquiterpene components. DARM and ARM are structurally similar, and both reached Cmax rapidly in the blood, indicating that both components were rapidly absorbed and had a rapid onset of action. As we have reported previously (Fu et al., 2020), the content of ARM in A. annua is actually much higher than other components. ARM showed rapid absorption in rat stomach due to a free carboxyl group in its structure (Fig. 1), and thus a higher bioavailability. Therefore, the values of AUC and Cmax of ARM were higher than those of other compounds. At the same time, the absorption of these two components into blood was higher than that of coumarins and flavonoids, which indicates that these two components might play an important role in the therapeutic effect of A. annua. The chemical structure of ARN differs from that of the two acidic components, leading to its difference in absorption. ARN reached Cmax after 6 h and the elimination t1/2 at ∼ 10 h, revealing a slower absorption and a longer time to exert its effect. In addition, the plasma concentration–time curves of ARN and DARM exhibited double peaks, and the second peak was significantly higher than the first, which may also be related to the effects of enterohepatic circulation (Liu et al., 1996, Nguyen et al., 2015, Cai et al., 2016).
Enterohepatic circulation is usually affected by various factors, including bile acid action, species, gender, development stage, nutritional status, disease status, and exogenous chemicals, etc. The phenomenon of enterohepatic circulation usually occurs in small molecule compounds with lower polarity, which could lead to the significant prolongation of the half-life, and show a multi peak behaviors in their plasma concentration time curves (Roberts et al., 2002, Gao et al., 2014). ARN is just a small molecule compound with lower polarity. The elimination t1/2 of ARN in combination with ART, DARM and SPLT is 2.84 h (Zhang et al., 2016), which differs significantly from the present study; presumably due to the coexisting components in the A. annua extract that affect its absorption and metabolism. The complex components of A. annua extract may interact with each other after entering the body, increasing the enterohepatic circulation of ARN and resulting in the slow absorption and elimination of ARN under these conditions.
Differences in the pharmacokinetic behaviour of active monomers and herbal extracts have been reported. For example, the administration of Hippophae rhamnoides L. increased the oral bioavailability of RUT and reduced the oral bioavailability of its active monomer quercetin (Kammalla et al., 2015). The administration of Ginkgo biloba extract significantly increased the in vivo absorption and exposure, and prolonged the retention time of each flavonoid monomer component (Wang et al., 2017). Thus, it is evident that the influence of coexisting components in A. annua extracts on the in vivo processes of the active ingredients is more complex, and the contribution of the active ingredients to the overall efficacy of the extracts needs to be further evaluated in conjunction with the biological effects in vitro and in vivo.
In summary, after the administration of A. annua extract to SD rats, CHD and CAS were rapidly absorbed into the blood with a short t1/2, suggesting that they had rapid onset of action and elimination. SPLT was also rapidly absorbed into the blood and had a longer t1/2, indicating that it had a rapid onset of action and longer duration of action. The peak time of SPL, RUT, DARM and ARM ranged from 1 to 4 h. The absorption rate of the four components into the blood was slower, while the elimination t1/2 and MRT showed that their retention and elimination in the body were not much different from those of the other components. Among the eight components, ARN had the slowest peak velocity and longest t1/2, reaching Cmax at ∼ 6 h. It was absorbed into the blood twice, indicating that it was absorbed into the blood slowly and had a slow onset of action in the body and a longer duration of action.
The chromatographic channels for SPLT, RUT, CHD, CAS, ARN and ARM showed two peaks at some time points, and their responses changed with time points, indicating that these peaks were generated by metabolism in vivo. As a glycoside, RUT was metabolised to aglycone in vivo with reduced polarity, resulting in a delayed chromatographic peak. CHD, CAS, ARN and ARM, which do not contain glycosyl groups, may have undergone glucuronidation or sulfation metabolism in vivo to produce metabolites with enhanced water solubility and polarity, resulting in the appearance of an advanced peak. The sample channel for SPLT appeared as a peak with the same retention time as SPL, and presumably SPLT bound glucose in vivo to become a glycoside. In future studies, the metabolites could be measured indirectly by enzymatic hydrolysis to completely hydrolyse the metabolite into the form of the target component.
3.5 Molecular docking assessment
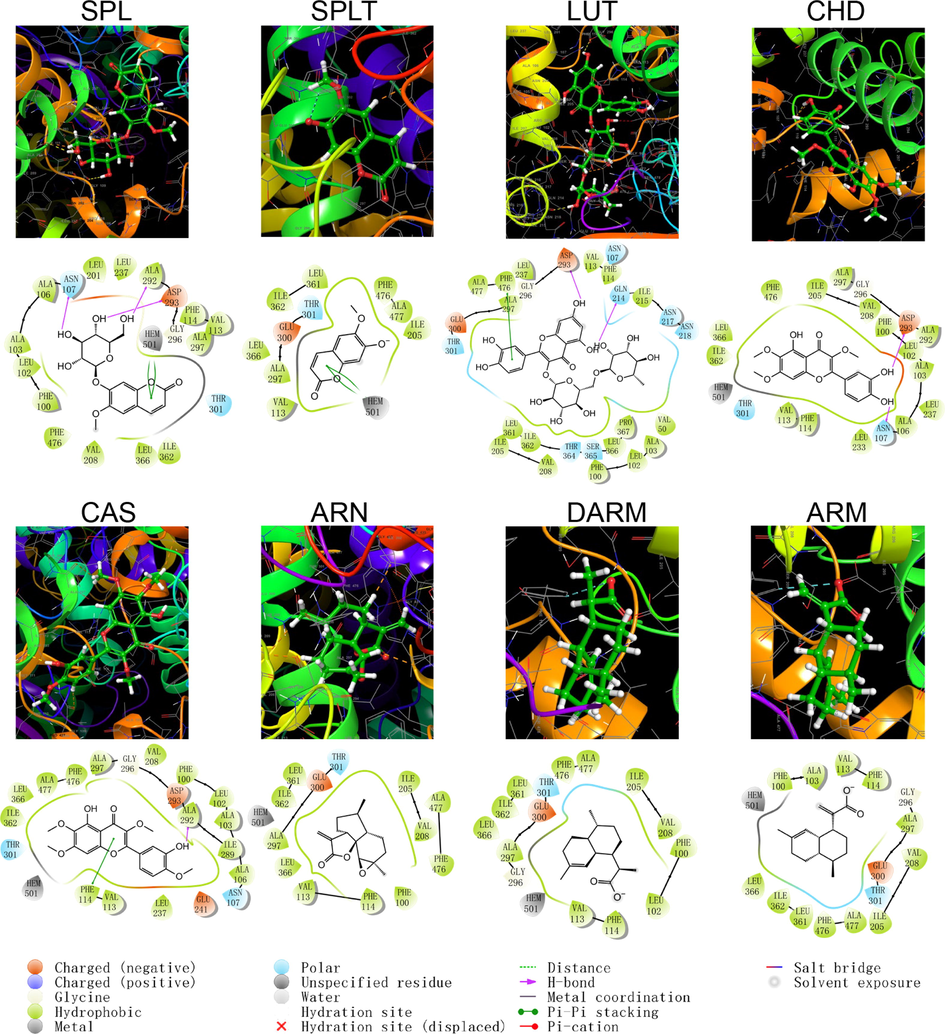
The program “Ligrep” was used to prepare eight small ligand molecules in A. annua, among which SPLT and RUT produced two ligand conformations, and the lowest energy stereo conformation was selected for molecular docking. The molecular docking between the prepared protein and the generated ligands was performed in the XP model of “Glide”. The docking scores and binding modes are shown in Table 7, and the structural patterns of docking are shown in Figs. 4–9. The binding activities of protein receptors and small molecule ligands were positively correlated with the absolute values of the docking scores. No interaction between protein and ligand.
CYP450
PDB ID
Analyte
Docking Score(kcal/mol)
Hydrogen bond
π–π stacking
Salt bridge
1A2
2HI4
RUT
–10.32
GLY 233, SER 232, LYS59, TYR495, GLU228, ARG252
–
–
SPL
–9.199
THR124,ASP320
PHE226
–
CHD
–8.442
–
PHE226
–
DARM
–7.159
–
–
–
ARM
–6.887
–
–
–
SPLT
–6.711
–
PHE226
–
CAS
–6.628
PRO493, ASN60
–
–
ARN
–1.933
ARG503
–
–
2C9
5W0C
RUT
–12.887
ARG108, ASN204
PHE114
–
SPL
–10.332
ARG108, GLY296
PHE114, PHE100, PHE476
–
CAS
–8.160
ARG108, LEU102
PHE114
–
CHD
–7.773
ARG108, LEU102, ASP224
PHE114
–
ARM
–6.883
–
–
–
DARM
–6.873
–
–
–
SPLT
–6.357
ARG108
PHE114
–
ARN
–5.511
ARG108
–
–
2C19
4GQS
RUT
–11.48
ASP293, GLN214
PHE476
–
CHD
–8.084
–
ASP293, ASN107
–
SPL
–7.678
ASN107, ALA292, ASP293
HEM501
–
CAS
–7.244
ALA292
PHE114
–
ARN
–5.96
–
–
–
SPLT
–5.398
–
HEM501
–
DARM
–5.056
–
–
–
ARM
–5.025
–
–
–
2D6
5TFT
RUT
–10.399
ASP301, GLU216, LEU213
PHE483
ARG221
SPL
–7.628
ALA209
HEM601
–
CHD
–7.471
GLY373, SER304
PHE120
–
ARM
–6.667
ARG221, GLN244
–
ARG221
DARM
–6.325
ARG221, GLN244
–
ARG221
CAS
–5.981
GLU216
PHE120
–
SPLT
–4.933
SER304
PHE120
–
ARN
–3.932
ARG221
–
–
2E1
3T3Z
RUT
–10.334
SER231, THR212, PRO229
–
–
SPL
–6.82
PHE37, GLN47
TRP214
–
CHD
–6.198
PHE37
–
–
CAS
–5.262
GLN47
PHE46,TRP214
–
ARN
–4.218
GLN47
–
–
SPLT
–4.121
GLN47, PHE37
–
–
DARM
–3.913
–
–
–
ARM
–3.692
GLN47
–
–
3A4
3UA1
RUT
–13.642
THR224, ALA370, ARG106
PHE215
–
CHD
–8.955
SER119, ARG106
ARG105
–
SPL
–8.808
GLU374, ARG372, ALA370, SER119
PHE108
–
CAS
–7.258
SER119
PHE215
–
SPLT
–5.487
ARG106, SER119
PHE108
–
ARN
–5.252
SER119
–
–
ARM
–4.715
–
–
ARG212
DARM
–3.612
–
–
–
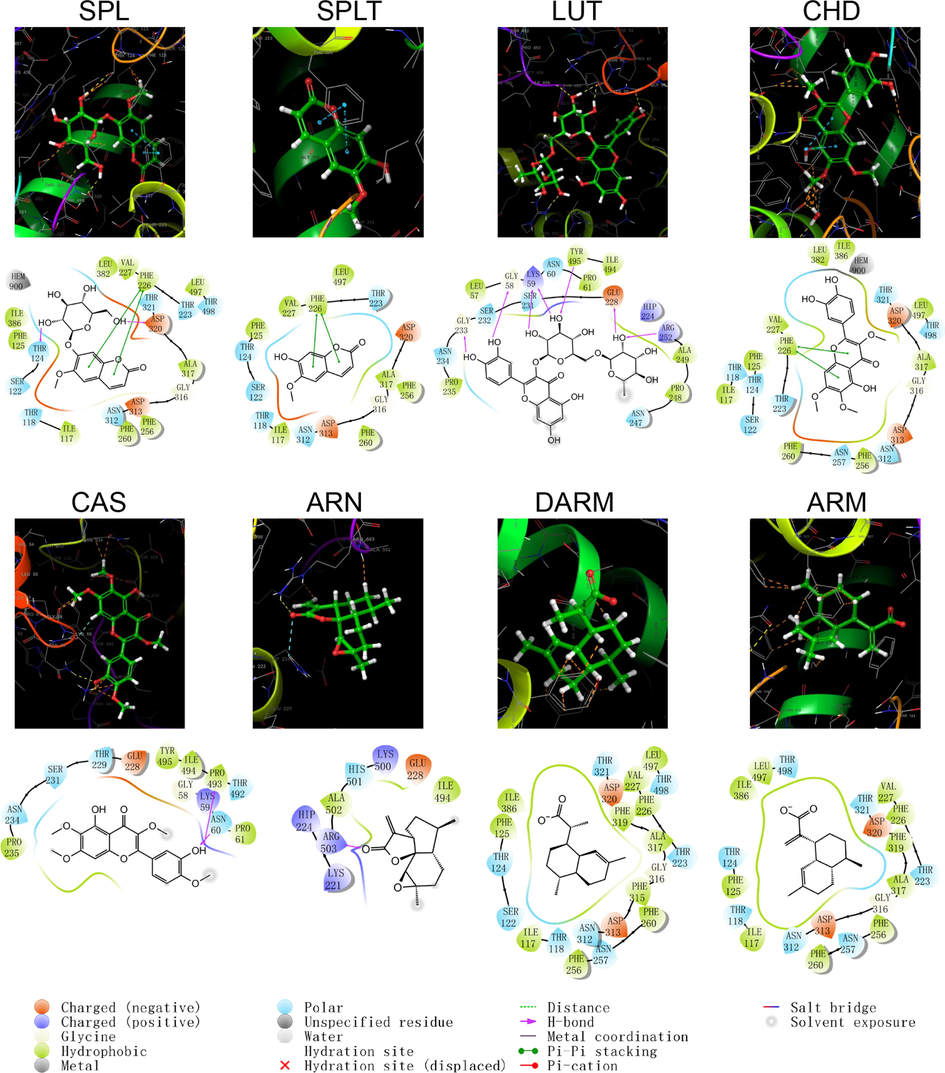
Schematic structure and pattern diagram of the molecular docking of the active components of A. annua with CYP450 1A2 (PDB ID 2HI4).
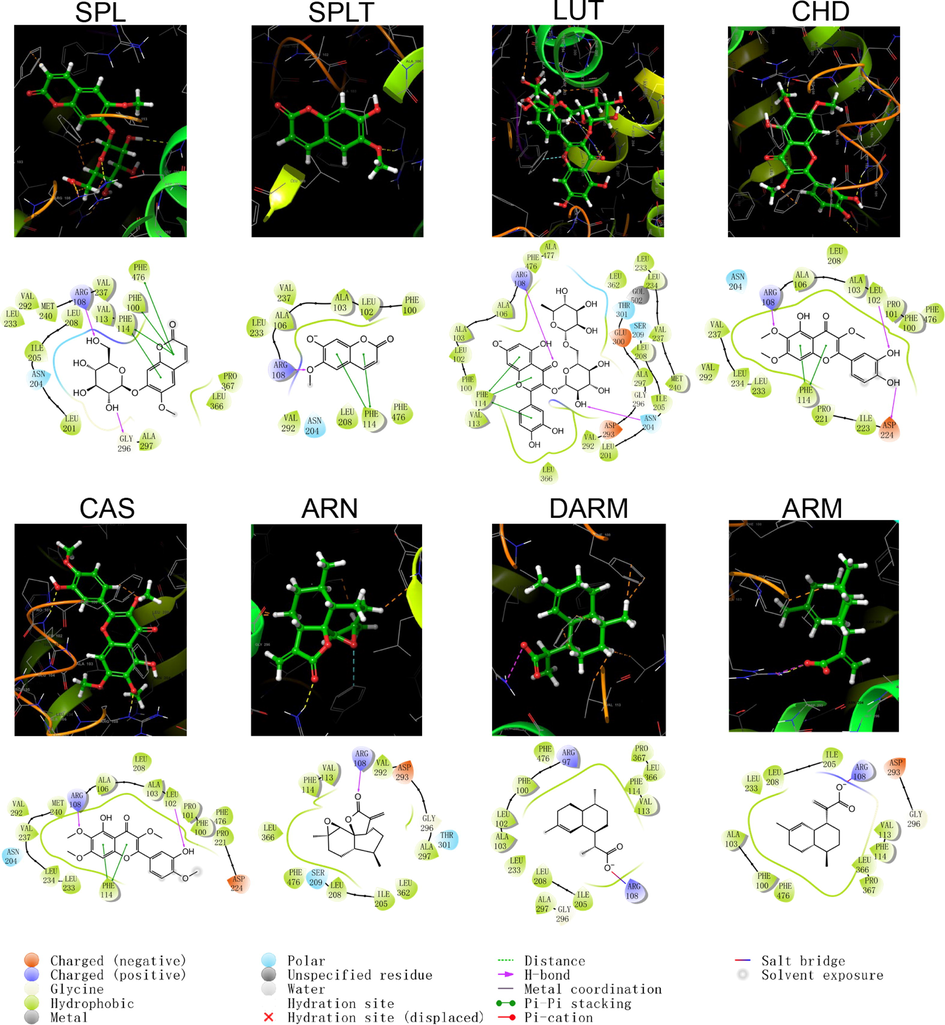
Schematic structure and pattern diagram of the molecular docking of the active components of A. annua with CYP450 2C9 (PDB ID 5W0C).
Schematic structure and pattern diagram of the molecular docking of the active components of A. annua with CYP450 2C19 (PDB ID 4GQS).
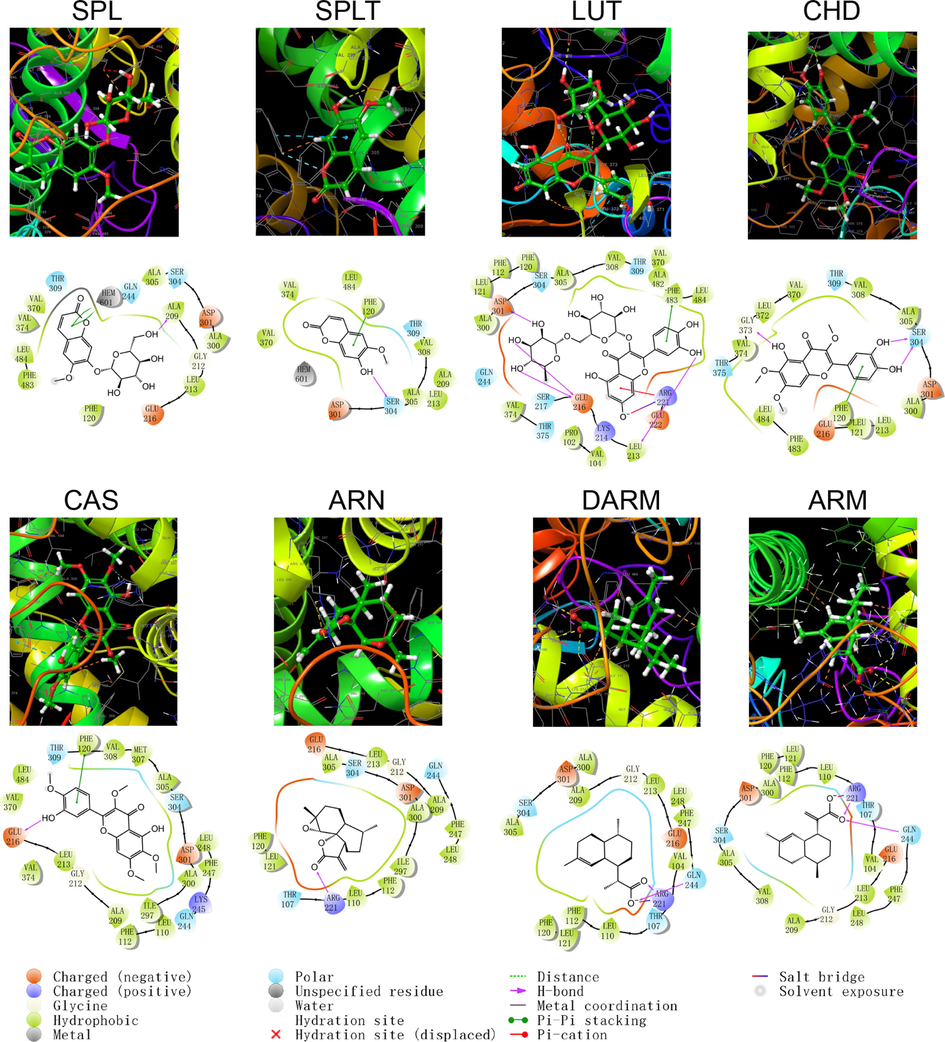
Schematic structure and pattern diagram of the molecular docking of the active components of A. annua with CYP450 2D6 (PDB ID 5TFT).
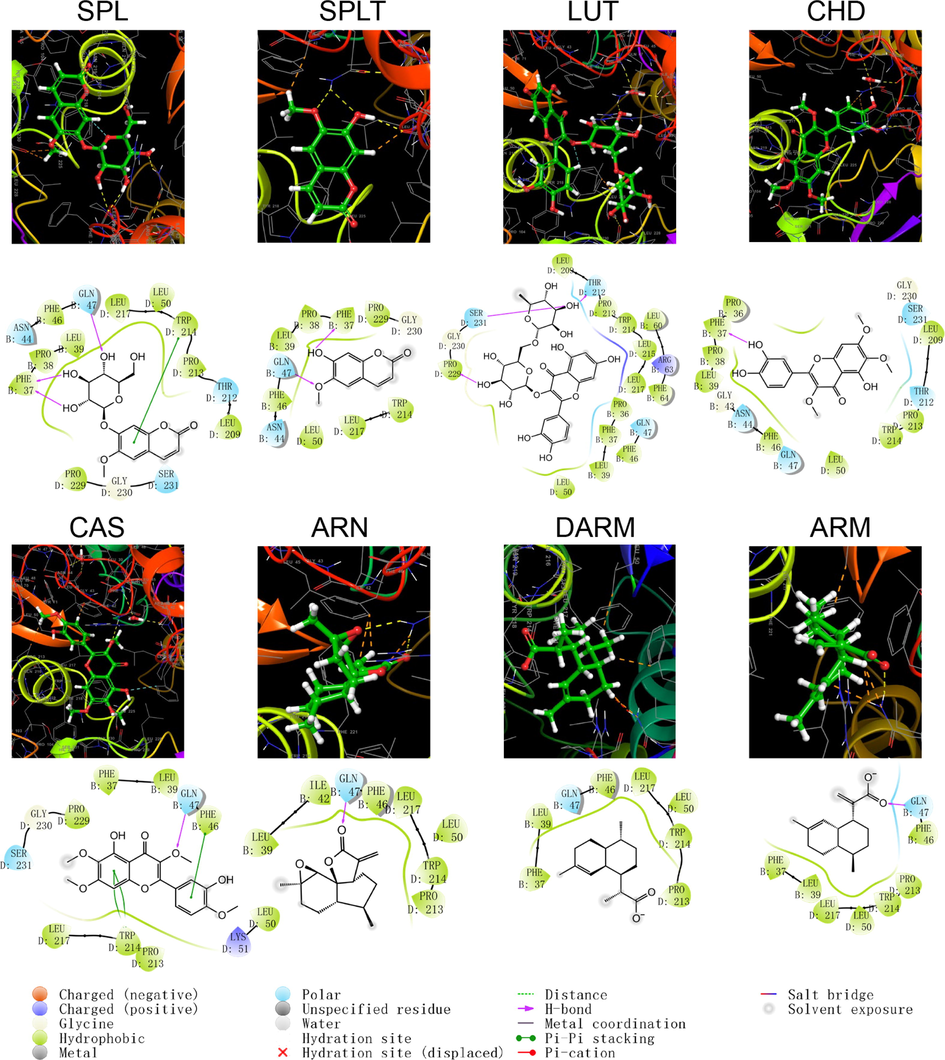
Schematic structure and pattern diagram of the molecular docking of the active components of A. annua with CYP450 2E1 (PDB ID 3T3Z).
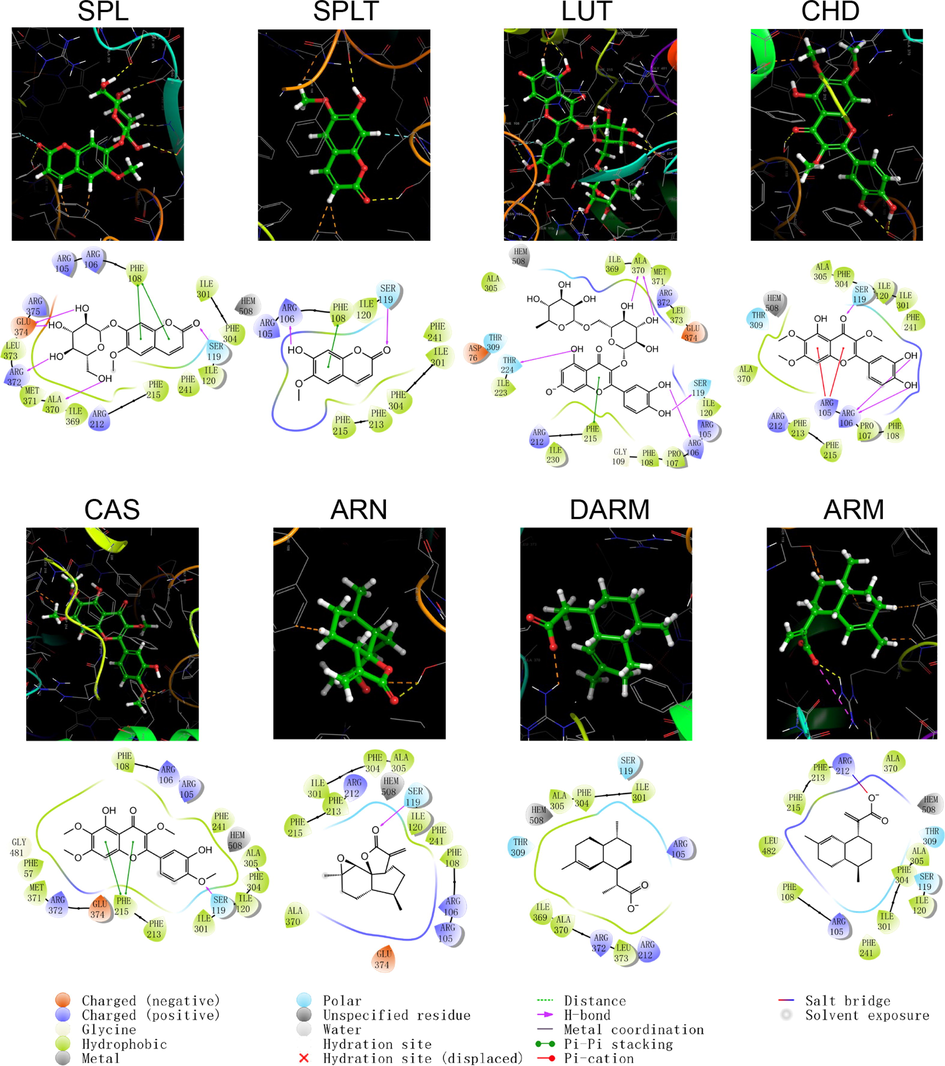
Schematic structure and pattern diagram of the molecular docking of the active components of A. annua with CYP450 3A4 (PDB ID 3UA1).
As shown by the docking score and docking pattern diagram, most of the coumarins and flavonoids such as RUT, SPL, CHD and CAS, bound well to CYP450 (|Docking score| > 5), mainly through hydrogen bonding and π–π stacking. RUT also formed a salt bridge with CYP2D6. SPLT had a docking score < 5 with CYP2D6 and 2E1, but still produced hydrogen bonding and π–π stacking with the enzyme. The sesquiterpenes had weak interactions with proteins. Both DARM and ARM only formed π–π stacking with residues ARG221 and GLN244 of CYP2D6 and salt bridges with ARG221, except for ARN, which had hydrogen bonding with all five isoforms of structures (except CYP2C19). The above suggests that coumarins and flavonoids in A. annua are more likely to bind to CYP450 enzymes in the liver than sesquiterpenes are, affecting the metabolism of other components by these metabolic enzymes. Flavonoids are a class of substances that readily affect CYP450 and have complex effects. Multiple flavonoids can affect the activity of the same cytochrome P450 enzyme, and the same flavonoid can affect the activity of multiple cytochrome P450 enzymes. Either they act as agonists, antagonists, or both. These effects are also related to the dosage and concentration of flavonoids (Chen et al., 2014).
The following takes CYP3A4 as an example for detailed description: CYP3A4 is the most studied isoform of the CYP3A subfamily and is mainly found in the small intestine and liver (Lolodi et al., 2017). By docking score, the component that bound most strongly to CYP3A4 was the polar flavonoid, RUT, followed in order by CHD, SPL, CAS, SPLT, ARN, ARM and DARM. RUT formed hydrogen bonds with three amino acid residues, THR224, ALA370 and ARG106 in CYP3A4, and a stable interaction with PHE215 via π–π stacking. Both CHD and SPLT formed hydrogen bonds with ARG106 and SER119 in CYP3A4, with the former forming π–π cations with ARG105 and the latter forming π–π stacking with PHE108. SPL interacted with a variety of residues, including GLU374, ARG372, ALA370 and SER119, which also formed π–π stacks with PHE108. CAS only formed hydrogen bonding and π–π stacking with AER119 and PHE215, respectively. The sesquiterpene components weakly bound to CYP3A4. ARN only formed hydrogen bonding with SER119, ARM formed a salt bridge and hydrogen bonding with ARG212, and DARM had no interaction with CYP3A4.
CYPs are the main one-phase drug metabolizing enzyme family, which participates in the metabolism of > 95 % of drugs and natural products. CYP1A2, 2B6, 2C9, 2C19, 2D6, 2E1 and 3A4 are the most active enzymes involved in liver metabolism, and have the ability to catalyze the biotransformation of a large number of endogenous and exogenous components (Coon 2005, Manikandan and Nagini 2018). Changes in the activity and expression of CYPs may cause changes in CYP-mediated drug metabolism, thereby affecting pharmacokinetic behaviour. SPL, SPLT, RUT, CHD, CAS, and ARN detected in the current pharmacokinetic study may all have a considerable effect on the inhibition or induction of CYP450 enzymes, thus affecting the metabolism of these enzymes to other components in vivo and leading to changes in their pharmacokinetic behaviour. Therefore, the absorption and metabolic characteristics of each active component of A. annua with complex composition in rats are not only influenced by the ADME/T properties of the component itself, but may also be affected by the metabolic interactions of each component. This could also partially explain the significantly lower absorption and elimination rates of ARN in the pharmacokinetic study.
According to the literature, 14 %–31 % of herbal medicines are currently used in combination with chemical drugs in clinical practice (Eisenberg et al., 1998, Ang-Lee et al., 2001, Kaufman et al., 2002), and the combination of some of these herbal and chemical drugs can lead to adverse drug–drug interactions, resulting in diminished therapeutic effects or even toxicity (Hu et al., 2005). Therefore, the blood-entering components of A. annua may not only interact with each other as active components, but may also competitively bind chemical drugs at the CYP site of action in the case of combination with chemical components, thus affecting the therapeutic efficacy. The current computer simulations initially suggested that the active components of A. annua affected the activity of metabolic enzymes in vivo, but more elaborate experimental designs are needed for subsequent validation to fully elucidate the metabolic characteristics of A. annua in vivo and to lay the foundation for its rational clinical application.
4 Conclusion
A rapid, sensitive and specific LC–ESI–MS/MS method was established for the simultaneous quantification of eleven components in the rat plasma after gavage administration of A. annua extracts. Two coumarins (SPL and SPLT), three flavonoids (RUT, CHD and CAS) and three sesquiterpenes (ARN, DARM and ARM) were detected. The possible interactions of the individual components as they pass through the liver were evaluated using molecular docking. Coumarins and flavonoids of A. annua have better CYP450 enzyme binding ability than the sesquiterpenoids and are prone to induce drug interactions.
Acknowledgements
This work was supported by the National Natural Science Foundation of China (No. 82174062 and 81573682).
Declaration of Competing Interest
The authors declare that they have no known competing financial interests or personal relationships that could have appeared to influence the work reported in this paper.
References
- Herbal medicines and perioperative care. J. Am. Med. Assoc.. 2001;286:208-216.
- [CrossRef] [Google Scholar]
- Oral pharmacokinetics of baicalin, wogonoside, oroxylin A 7-O-β-d-glucuronide and their aglycones from an aqueous extract of Scutellariae Radix in the rat. J. Chromatogr. B: Anal. Technol. Biomed. Life Sci.. 2016;1026:124-133.
- [CrossRef] [Google Scholar]
- Investigation of the component in Artemisia annua L. leading to enhanced antiplasmodial potency of artemisinin via regulation of its metabolism. J. Ethnopharmacol.. 2017;207:86-91.
- [CrossRef] [Google Scholar]
- Metabolism of Flavonoids in Human: A Comprehensive Review. Current Drug Metabolism.. 2014;15:48-61.
- [CrossRef] [Google Scholar]
- Cytochrome P450: nature's most versatile biological catalyst. Annu. Rev. Pharmacol. Toxicol.. 2005;45:1-25.
- [CrossRef] [Google Scholar]
- Comparison of in vitro/in vivo blood distribution and pharmacokinetics of artemisinin, artemether and dihydroartemisinin in rats. J. Pharm. Biomed. Anal.. 2019;162:140-148.
- [CrossRef] [Google Scholar]
- Trends in alternative medicine use in the United States. J. Am. Med. Assoc.. 1998;280:1569-1575.
- [CrossRef] [Google Scholar]
- Phytochemical analysis and geographic assessment of flavonoids, coumarins and sesquiterpenes in Artemisia annua L. based on HPLC-DAD quantification and LC-ESI-QTOF-MS/MS confirmation. Food Chem.. 2020;312
- [CrossRef] [Google Scholar]
- Oral Bioavailability Comparison of Artemisinin, Deoxyartemisinin, and 10-Deoxoartemisinin Based on Computer Simulations and Pharmacokinetics in Rats. Acs Omega.. 2021;6:889-899.
- [CrossRef] [Google Scholar]
- Casticin and chrysosplenol D from Artemisia annua L. induce apoptosis by inhibiting topoisomerase IIa in human non-small-cell lung cancer cells. Phytomedicine. 2022;100:154095
- [CrossRef] [Google Scholar]
- Drug enterohepatic circulation and disposition: constituents of systems pharmacokinetics. Drug Discovery Today. 2014;19:326-340.
- [CrossRef] [Google Scholar]
- Disposition pathways and pharmacokinetics of herbal medicines in humans. Curr. Med. Chem.. 2010;17:4072-4113.
- [CrossRef] [Google Scholar]
- Chemical Composition of Artemisia annua L. Leaves and Antioxidant Potential of Extracts as a Function of Extraction Solvents. Molecules. 2012;17:6020-6032.
- [CrossRef] [Google Scholar]
- Scoring noncovalent protein-ligand interactions: a continuous differentiable function tuned to compute binding affinities. J. Comput. Aided. Mol. Des.. 1996;10:427-440.
- [CrossRef] [Google Scholar]
- Comparative pharmacokinetic interactions of Quercetin and Rutin in rats after oral administration of European patented formulation containing Hipphophae rhamnoides and Co-administration of Quercetin and Rutin. Eur. J. Drug. Metab. Pharmacokinet.. 2015;40:277-284.
- [CrossRef] [Google Scholar]
- Recent patterns of medication use in the ambulatory adult population of the United States - The Slone survey. J. Am. Med. Assoc.. 2002;287:337-344.
- [CrossRef] [Google Scholar]
- Anti-inflammatory and immunomodulatory mechanisms of artemisinin on contact hypersensitivity. Int. Immunopharmacol.. 2012;12:144-150.
- [CrossRef] [Google Scholar]
- Antifungal coumarins and lignans from Artemisia annua. Fitoterapia.. 2019;134:323-328.
- [CrossRef] [Google Scholar]
- Evaluation of pharmacokinetics, bioavailability and urinary excretion of scopolin and its metabolite scopoletin in Sprague Dawley rats by liquid chromatography–tandem mass spectrometry. Biomed. Chromatogr.. 2019;33:e4678.
- [Google Scholar]
- Combination of artemisinin-based natural compounds from Artemisia annua L. for the treatment of malaria: Pharmacodynamic and pharmacokinetic studies. Phytother. Res.. 2018;32:1415-1420.
- [CrossRef] [Google Scholar]
- A two-site absorption model to fit gemfibezil in human pharmacokinetic data. Acta Pharm. Sin.. 1996;31:737-741.
- [Google Scholar]
- Differential Regulation of CYP3A4 and CYP3A5 and its Implication in Drug Discovery. Curr. Drug Metab.. 2017;18:1095-1105.
- [CrossRef] [Google Scholar]
- Cytochrome P450 Structure, Function and Clinical Significance: A Review. Curr. Drug Targets. 2018;19:38-54.
- [CrossRef] [Google Scholar]
- A review on the latest advances in extraction and analysis of artemisinin. Phytochem. Anal.. 2020;31:5-14.
- [CrossRef] [Google Scholar]
- The influence of single-dose and short-term administration of quercetin on the pharmacokinetics of midazolam in humans. J. Pharm. Sci.. 2015;104:3199-3207.
- [CrossRef] [Google Scholar]
- Synthesis and anti-cancer activity of covalent conjugates of artemisinin and a transferrin-receptor targeting peptide. Cancer Lett.. 2009;274:33-39.
- [CrossRef] [Google Scholar]
- Advances in flavonoid absorption and metabolism research. Chin. Pharm. J.. 2006;411:568-572.
- [Google Scholar]
- Modern drug delivery strategies applied to natural active compounds. Expert Opin. Drug Deliv.. 2017;14:755-768.
- [CrossRef] [Google Scholar]
- Quality evaluation of the artemisinin-producing plant Artemisia annua L. based on simultaneous quantification of artemisinin and six synergistic components and hierarchical cluster analysis. Ind. Crops Prod.. 2018;118:131-141.
- [CrossRef] [Google Scholar]
- Enterohepatic circulation - Physiological, pharmacokinetic and clinical implications. Clin Pharmacokinet.. 2002;41:751-790.
- [CrossRef] [Google Scholar]
- Advances in studies on absorption and metabolism of natural coumarins. China J. Chin. Mater. Med.. 2011;36:81-84.
- [Google Scholar]
- Liquid chromatography-tandem mass spectrometry assay for the simultaneous determination of three major flavonoids and their glucuronidated metabolites in rats after oral administration of Artemisia annua L. extract at a therapeutic ultra-low dose. J. Sep. Sci.. 2019;42:3330-3339.
- [CrossRef] [Google Scholar]
- Development of an ultra-fast liquid chromatography-tandem mass spectrometry method for simultaneous determination of seven flavonoids in rat plasma: Application to a comparative pharmacokinetic investigation of Ginkgo biloba extract and single pure ginkgo flavonoids after oral administration. J. Chromatogr. B Analyt. Technol. Biomed. Life Sci.. 2017;1060:173-181.
- [CrossRef] [Google Scholar]
- Dihydroartemisinin suppresses bladder cancer cell invasion and migration by regulating KDM3A and p21. J. Cancer.. 2020;11:1115.
- [CrossRef] [Google Scholar]
- Dietary flavonoid aglycones and their glycosides: Which show better biological significance? Crit. Rev. Food. Sci. Nutr.. 2017;57:1874-1905.
- [CrossRef] [Google Scholar]
- Effects of arteannuin B, arteannuic acid and scopoletin on pharmacokinetics of artemisinin in mice. Asian Pac. J. Trop. Med.. 2016;9:677-681.
- [CrossRef] [Google Scholar]
- Determination of artemisinin, arteannuin B and artemisinic acid in Herba Artemisiae Annuae by HPLC-UV-ELSD. Acta Pharm. Sin. B.. 2007;42:978-981.
- [Google Scholar]


