

Translate this page into:
Multi-wavelength thermal-lens spectrometry for high-accuracy measurements of absorptivities and quantum yields of photodegradation of a hemoprotein–lipid complex
⁎Corresponding authors. ZharovVladimirP@uams.edu (Vladimir Zharov), proskurnin@gmail.com (Mikhail Proskurnin)
-
Received: ,
Accepted: ,
This article was originally published by Elsevier and was migrated to Scientific Scholar after the change of Publisher.
Peer review under responsibility of King Saud University.
Abstract
Accurate measurements of absorptivities and quantum yields of biochemical species under various conditions are an important task of applied photonics and analytical chemistry. In this work, we provide a comparison of the capabilities of thermal-lens spectrometry to measure these parameters of various samples. Measurements of relevant model substances, biologically active substituted 2-thiohydantoins and their complexes of copper(I,II) and heme proteins (forms of hemoglobin and cytochrome c), showed negligible differences in apparent molar absorptivities for thermal-lens spectrometry and optical-absorption (spectrophotometric) data. The values for tabletop and microscale thermal-lens measurements under batch conditions differ insignificantly. The precision of measurements of molar absorptivities by thermal-lens spectrometry is no less than in the case of spectrophotometry or the precision is even higher in the cases of low absorptivities. For cardiolipin–cytochrome c-NO complex, the difference between absorptivity values calculated from thermal-lens data and acquired by spectrophotometry is significant due to complex photodegradation. The quantum yield of its photolysis reaction calculated from optical absorption and thermal-lens data altogether at two wavelengths for 0.4–360 s of the reaction, 0.46 ± 0.04, was estimated.
Keywords
Multispectral photothermal spectroscopy
Thermal-lens spectrometry
2-thiohydantoins (2-thioxo-imidazolidin-4-ones)
Cytochrome c
Hemoglobin
Absorptivity

1 Introduction
Photothermal spectroscopy (PTS) has an increasingly high impact on applied photonics, especially in biology and medicine and in materials science (Nedosekin et al., 2013a; Vidovic et al., 2013; Bagheri et al., 2014; Cassano et al., 2014; Guo et al., 2014). Photothermal spectroscopy and thermal-lens spectrometry (TLS) as a most widespread photothermal method have two advantages over conventional (transmission) methods of molecular absorption spectroscopy (spectrophotometry and IR-spectroscopy). The first of them is considerably higher sensitivity because TLS is based on direct measurements of the nonradiative energy transfer from excited chromophore molecules (Bialkowski, 1996). Thermal relaxation in the sample results in a nonuniform refractive-index spatial profile (a thermal lens effect). Its optical strength is proportional to the sample absorbance and, thus, to the absorber concentration and its absorptivity. As a result, TLS provides detection limits of 10−9–10−6 abs. units or ca. 10−11 mol L−1 (Bialkowski, 1996; Proskurnin et al., 2015) e.g. the sensitivity that is comparable to laser-induced fluorimetry but for non-fluorescing chromophores and with a low impact from light scattering (Fischer and Georges, 1996).
The second advantage of PTS, and TLS in particular, is the possibility of measurements of chromophore absorption in complex (even living) systems and in vivo studies (Liu and Franko, 2014b; Nedosekin et al., 2014) and also with a low impact from scattering backgrounds (Georges, 1999).
These two advantages provide an important feature of TLS. In many applications of laser photonics, it is important to know the absorption-band parameters of the species in question—and simultaneously with high sensitivity and high precision. Especially important is the determination of absorptivities at low concentrations and in low volumes of real samples as a basis of elucidation of reaction or bioprocess mechanisms. However, at this level, the possibilities of conventional transmission measurements become limited (Luk’yanov and Novikov, 2000; Proskurnin et al., 2003; Skvortsov, 2013), while indirect methods sometimes lead to spurious results. Thus, PTS, together with photoacoustic techniques (Galanzha and Zharov, 2012; Haisch, 2012; Wang and Hu, 2012), becomes the tool in demand. This was used for measuring absorbances at a very low level such as pure water (Cruz et al., 2009), stable species (Cruz et al., 2011, 2013), and disperse solutions (Ryasnyanskiy et al., 2009; Marcano et al., 2011). Certainly, TLS and other photothermal methods are used for optical materials (Wu et al., 1997; Faycel, 1999; Ono et al., 2000; Commandre et al., 2008; Proskurnin, 2014). However, especially for complex systems, the correctness and accuracy of photothermal measurements require both the trueness and precision of measurements (ISO, 1994); thus, the accuracy verification of these values by the comparison with convention methods is required.
Next, if the absorption-band parameters are known with high accuracy, the conditions of photothermal measurements, especially in the case of laser-induced modalities, can be used for experiments that are more sophisticated. Thus, if there are processes competing with thermal relaxation of the laser-excited samples (e.g. luminescence or photochemistry), the thermal-lens effect strength decreases, which can be used for elucidating such processes and estimating their yields (Fischer and Georges, 1996; Lapotko et al., 2002), especially for fluorescence (Fischer and Georges, 1997; Isak et al., 2000; Yamaji et al., 2001; Santhi et al., 2004a,b; Tanaka et al., 2004; Cruz et al., 2010; Estupinan-Lopez et al., 2013; Würth et al., 2015). Photochemical reaction yields for fast processes were also measured by thermal-lens spectrometry from time-resolved experiments (Pedreira et al., 2004, 2006; Astrath et al., 2009, 2010a). On the other hand, TLS and more advanced techniques such as thermal-lens microscopy (Chen et al., 2011; Dudko et al., 2012; Cassano et al., 2014; Liu and Franko, 2014a) are used in complex biomedical applications (Brusnichkin et al., 2010; Nedosekin et al., 2013a, 2014; Cassano et al., 2014; Vidovic et al., 2014), which also require a high level of accuracy of the primary results on absorption of chromophores and for the whole system.
Thus, the aim of this study was dual. The first one was to evaluate the figures of merit of TLS for accurate determination of absorption-band parameters taking into account both their trueness and precision. We selected the examples of biologically active complexes (2-thiohydantoins) and relevant heme proteins (hemoglobin and oxidized and reduced cytochrome c) which are extensively measured by TLS in vitro and in vivo.
The second aim was to compare photochemically stable and unstable species to elucidate the possibilities of measuring quantum yields of slow photochemical reactions by TLS. It was done by the example of a slowly and irreversibly photodegradable nitrosyl complex of cytochrome c in the presence of cardiolipin (Osipov et al., 2007; Brusnichkin et al., 2008) to estimate the quantum yield by the comparison of molecular absorption data obtained from conventional transmission measurements and thermal-lens spectrometry.
2 Material and methods
2.1 Reagents and solvents
Water from a Milli Q water purification system (Millipore, France) was used: specific resistance 18.2 MΩ cm, Fe, 2 ppt; dissolved SiO2, 3 ppb; total ion amount, <0.2 ppb; TOC, <10 ppb; the own thermal-lens signal, 0.004 ± 0.001. The glassware was washed with acetone followed by conc. nitric acid. 69% nitric and 37% hydrochloric acids (PA-ACS-ISO grade, Panreac, Spain) and acetonitrile (CH3CN, Merck, gradient grade for HPLC) were used throughout. Aqueous solutions of hemoglobin (RENAM, Russia, 159 g L−1) and cytochrome c from equine heart, 99% (Sigma, USA, M = 12383 Da) for biochemistry were used. The reagents: 1,10-phenanthroline iron(II) sulfate complex (ferroin, 0.025 mol L−1, CAS No. 14634-91-4, Sigma–Aldrich) and phosphoric acid (H3PO4, 85%, Riedel–de Haën) were used throughout. All other reagents and solvents used in this study were of chemically pure grade or higher and were used without further purification.
Complex of iron(II) with 1,10-phenanthroline was synthesized as described previously (Filichkina et al., 1992a). The synthesis of thiohydantoins: 3-phenyl-5-(pyridylmethylene)-2-thiohydantoin (I), 3-allyl-5-(pyridylmethylene)-2-thiohydantoin (II) and 3-(propen-2-yl)-5-(pyridine-2-ylmethylene)-3,5-dihydro-4H-4-oxoimidazol-2-yl)-thio]-ethane (III) (Majouga et al., 2004) and their copper complexes with I (Beloglazkina et al., 2005) and II mono- and di-complexes (Beloglazkina et al., 2014; Majouga et al., 2014) were discussed in detail in previous studies. TLS procedures for hemoglobin and cytochrome c are described previously (Brusnichkin et al., 2008, 2009).
2.2 Auxiliary measurements
Spectrophotometric measurements in batch and flow modes were made using an Agilent Cary 60 spectrophotometer (USA) with l = 10 mm, 0.3 cm3. The pH values were measured by an inoLab pH Level 1 pH-meter (Germany) with a glass pH-selective electrode (precision ± 5%). Solutions were mixed with a Biosan MMS 3000 automixer (Latvia) and a micro-stirrer.
2.3 Tabletop thermal-lens measurements
The scheme of the tabletop thermal-lens spectrometer (Tsar’kov et al., 2011; Volkov et al., 2012) is shown in Fig. 1. The key parameters are summarized in Table 1 (from this point on, the subscript “p” will denote the probe beam, and the subscript “e” will stand for the excitation beam). The optical-scheme optimization to avoid the convection and Soret effects is described elsewhere (Proskurnin et al., 2011). Quartz cells with four optical walls and optical path lengths of 10 mm were used throughout.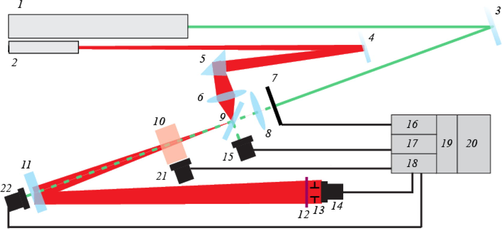
Schematics of the tabletop thermal-lens spectrometer; 1 is excitation laser; 2 is probe laser; 3, 4, 9, and 11 are dichroic mirrors; 5 is a quartz prism; 6 and 8 are focusing lenses; 7 is a mechanical shutter; 10 is a sample; 12 and 13 are broadband optical filter and a pinhole, respectively; 14, 15, 21, and 22 are photodiodes; 16 is the shutter DAC control; 17 and 18 are ADC amplifier units; 19 is a ADC/DAC converter unit; 20 is a PC.
Excitation Ar+ laser
Innova 90-6 (Coherent, USA)Wavelengths, λe (nm)
532.0
514.5
501.7
496.5
488.0
476.5
472.7
465.8
Power range at the sample (TEM00 mode), Pe (mW)
1–210
1–200
5–30
4–30
1–250
5–30
2–20
2–12
Waist radius (μm)
55 ± 3
Focal distance of the focussing lens (mm)
300
Probe He–Ne laser
HRP020 (ThorLabs, USA)Wavelength, λp (nm)
632.8
Power range at the sample (TEM00 mode), Pp (mW)
2
Waist radius (μm)
25.0
Focal distance of the focussing lens (mm)
185
Other parameters
Sample optical path l (mm)
0.1–40.0
Chopper rate (Hz)
0.5–4
Geometry constant B
0.378
The excitation-laser beam 1 after the reflecting mirror 3 went through a mechanical modulator (shutter) 7, was focused with the lens 8 (focal distance 330 mm), and went through a dichroic mirror of ZR-100 type (Russia) 9 and, next, to the sample 10. A part of excitation beam energy reflected with the adjustment dichroic mirror 9 was directed to the excitation-power control photodiode 15 (L-3DP3C, Panasonic, Japan). The signal from this photodiode, through an amplifier unit 17, which converted the photocurrent into voltage, entered the channel 2 of the ADC/DAC converter unit 19, which was connected via a cable to a PC 20. To synchronize the detection system and the shutter, a control DAC channel 16 of the ADC/DAC unit was used. The probe laser beam 2 was directed to the adjustment mirror 9 using a system of a mirror 4, a quartz prism 5, and a focusing lens 6 (focal distance 185 mm). After the sample 10, both the excitation and probe beams were preliminarily separated with a dichroic mirror 11. The reflected probe beam went through a broadband filter 12 of KS-11 type (Russia) to eliminate the rest of the excitation radiation and a pinhole 13 (diameter 2 mm) to remove the diffraction pattern at the edges of the thermal lens and then reached the primary photodiode 14 (L-3DP3C, Panasonic, Japan). After current-to-voltage conversion, the signal was handled through the channel 1 of the ADC/DAC converter unit 19. The excitation radiation transmitted through the mirror 11 was measured by the secondary photodiode 22 (L-3DP3C type) to measure the photometric (transmission) signal at the excitation wavelength. Another photodiode of L-3DP3C type 21 was attached to the side wall of the sample cell to account for secondary scattering or fluorescence of the sample. The signals from photodiodes 21 and 22 were handled by the extra amplifier channels 18 of the ADC/DAC converter unit.
An ADC/DAC homemade unit based on C8051F061 board (C8051F060DK development kit, Silicon Labs, USA) was used in an external-trigger mode (from the PC). It had the following parameters: two 16-bit ADC channels, two 12-bit DAC channels, ADC time, 2 μs; and readout frequency, 1–5 kHz. The developed software communicated with the unit through a RS-232 serial interface. The homemade software was written on Borland C++ ver. 5 (Borland Corp., USA).
The spectrometer had a linear dynamic range of the signal of four orders of magnitude (the corresponding range of absorption coefficients for 10 mm optical pathways is 1 × 10⁻⁶ to 2 × 10⁻² cm−1) and the response time of 0.05–200 s (depending on the selected measurement parameters, namely, on the data throughput rate and time, the number of points to be averaged, etc.). A local increase in temperature due to the photothermal effect is 0.001–20 °C, thus from completely non-invasive to invasive impacts.
The spectrometer provided a readjustment of the geometry of the optical scheme and the variation of the excitation power in a wide range, which provided the absorbed energy range from 0.1 mJ to 20 J; excitation power, 1–200 mW; intensities from 250 to 5 × 10⁷ W cm−2; and irradiation times from 0.01 to 100 s.
2.4 Photothermal microscope
The setup was built using an Olympus IX81 inverted microscope platform (Olympus America, Center Valley, PA, USA), and a tunable pulsed optical parametric oscillator (Opolette HR 355 LD, OPOTEK, Inc., Carlsbad, CA, USA) with the spectral range, 400–2200 nm; pulse width, 5 ns; pulse repetition rate, 100 Hz; and energy fluence range, 0.1–104 mJ cm−2 (Nedosekin et al., 2012). For photothermal measurements, we used achromatic objectives (100 × DPlan, oil, NA 1.25 and 40 × PlanApo N, NA 1.42). In a thermal-lens mode, laser-induced temperature-dependent variations of the refractive index (the thermal lens) upon absorption of the excitation laser radiation caused the defocusing of a collinear He–Ne laser (model 117A, Spectra-Physics, Santa Clara, CA, USA) probe beam with a wavelength of 632.8 nm and power of 1.4 mW. A decrease in the beam intensity at its center (referred to as the thermal-lens signal) was detected by a photodetector with a built-in preamplifier (PDA36A, 40 dB amplification, ThorLabs, Newton, NJ, USA) after transiting a narrow-bandpass filter (MaxLine® laser clean-up filter; central wavelength, 633 nm; spectral bandwidth, 12.5 nm; LL01-633-12.5, Semrock, Inc., Rochester, NY, USA).
2.5 Data handling
The thermal-lens signal was measured as a relative change in the probe-beam intensity Ip at the photodetector plane (Bialkowski, 1996) for a thermal equilibrium
as
Molar absorptivities ɛopt (Tables 2–4) in the concentration range 10−6–10−4 M were measured using spectrophotometry against water. The selection of concentrations of the analytes for measuring absorbances was selected so they belong to linear calibration ranges for both methods as depicted in Fig. 2.
Chromophore
λe nm
ɛopt, L mol−1 cm−1
× 10−4
ɛTLS, L mol−1 cm−1
× 10−4
Eexp
Iron(II) tris(1,10-phenanthrolinate)
457.9
0.92 ± 0.04
0.90 ± 0.02
(0.89 ± 0.03)13.82 ± 0.09
465.8
0.94 ± 0.03
0.94 ± 0.03
(0.92 ± 0.03)
472.7
0.96 ± 0.03
0.99 ± 0.03
(0.98 ± 0.04)
476.5
0.99 ± 0.02
1.02 ± 0.03
(1.01 ± 0.03)
488.0
1.03 ± 0.02
1.02 ± 0.03
(1.04 ± 0.03)
496.5
1.07 ± 0.01
1.06 ± 0.02
(1.05 ± 0.03)
501.7
1.10 ± 0.02
1.10 ± 0.03
(1.11 ± 0.04)
514.5
1.11 ± 0.02
1.11 ± 0.03
(1.11 ± 0.04)
Free ligand I
457.9
0.03 ± 0.01
0.023 ± 0.004
13.8 ± 0.1
465.8
0.025 ± 0.01
0.020 ± 0.005
472.7
0.015 ± 0.01
0.018 ± 0.004
476.5
0.015 ± 0.01
0.014 ± 0.005
488.0
0.013 ± 0.008
0.013 ± 0.004
496.5
–
0.009 ± 0.005
501.7
–
0.006 ± 0.004
Copper(II) complex of I
457.9
0.26 ± 0.04
0.26 ± 0.04
13.8 ± 0.1
465.8
0.24 ± 0.04
0.25 ± 0.02
472.7
0.22 ± 0.05
0.22 ± 0.05
476.5
0.21 ± 0.06
0.23 ± 0.04
488.0
0.17 ± 0.05
0.165 ± 0.03
496.5
0.14 ± 0.04
0.135 ± 0.02
501.7
0.12 ± 0.04
0.12 ± 0.03
514.5
0.09 ± 0.03
0.10 ± 0.01
Chromophore
λe nm
ɛopt, L mol−1 cm−1
× 10−4
ɛTLS, L mol−1 cm−1
× 10−4
Eexp
Free ligand II
457.9
0.023 ± 0.004
0.021 ± 0.003
13.7 ± 0.1
465.8
0.019 ± 0.002
0.020 ± 0.003
472.7
0.017 ± 0.005
0.016 ± 0.002
476.5
0.015 ± 0.001
0.016 ± 0.001
488.0
0.013 ± 0.003
0.012 ± 0.002
496.5
0.009 ± 0.001
0.010 ± 0.001
501.7
0.008 ± 0.002
0.008 ± 0.001
514.5
0.005 ± 0.001
0.005 ± 0.002
Copper(II) complex of II
457.9
0.027 ± 0.003
0.029 ± 0.002
13.8 ± 0.1
465.8
0.025 ± 0.002
0.024 ± 0.004
472.7
0.024 ± 0.003
0.023 ± 0.002
476.5
0.023 ± 0.002
0.024 ± 0.003
488.0
0.020 ± 0.004
0.021 ± 0.002
496.5
0.017 ± 0.002
0.017 ± 0.001
501.7
0.015 ± 0.003
0.016 ± 0.003
514.5
0.013 ± 0.002
0.013 ± 0.001
Free ligand III
457.9
0.0010 ± 0.0003
0.0009 ± 0.0003
13.8 ± 0.1
465.8
0.0007 ± 0.0003
0.0007 ± 0.0003
472.7
0.0006 ± 0.0002
0.0007 ± 0.0003
476.5
0.0006 ± 0.0004
0.0006 ± 0.0001
488.0
0.0005 ± 0.0004
0.0005 ± 0.0002
496.5
0.0003 ± 0.0004
0.0004 ± 0.0002
Copper(II) complex of III
457.9
0.020 ± 0.003
0.021 ± 0.002
13.8 ± 0.1
465.8
0.015 ± 0.002
0.016 ± 0.003
472.7
0.013 ± 0.004
0.013 ± 0.003
476.5
0.011 ± 0.003
0.012 ± 0.002
488.0
0.008 ± 0.004
0.009 ± 0.003
496.5
0.006 ± 0.003
0.006 ± 0.002
Chromophore
λe nm
ɛopt, L mol−1 cm−1
× 10−4
ɛTLS, L mol−1 cm−1
× 10−4
Eexp
HbH
465.8
1.51 ± 0.01
1.50 ± 0.03
13.7 ± 0.1
472.7
1.30 ± 0.02
1.29 ± 0.02
476.5
1.31 ± 0.01
1.29 ± 0.03
488.0
1.43 ± 0.01
1.41 ± 0.01
496.5
1.56 ± 0.01
1.55 ± 0.02
501.7
1.78 ± 0.01
1.77 ± 0.02
514.5
2.33 ± 0.01
2.30 ± 0.01
532.0
3.35 ± 0.01
3.31 ± 0.02
HbO2
465.8
3.69 ± 0.02
3.65 ± 0.07
13.8 ± 0.1
472.7
3.12 ± 0.02
3.11 ± 0.03
476.5
2.88 ± 0.02
2.86 ± 0.04
488.0
2.375 ± 0.009
2.36 ± 0.01
496.5
2.14 ± 0.02
2.12 ± 0.02
501.7
2.01 ± 0.02
2.00 ± 0.02
514.5
2.04 ± 0.02
2.02 ± 0.01
532.0
4.55 ± 0.02
4.50 ± 0.03
metHb
476.5
3.20 ± 0.02
3.19 ± 0.03
13.7 ± 0.1
488.0
3.39 ± 0.02
3.33 ± 0.03
501.7
3.59 ± 0.02
3.56 ± 0.02
514.5
3.20 ± 0.02
3.16 ± 0.03
532.0
2.74 ± 0.02
2.70 ± 0.02
Cyt c (II)
457.9
0.88 ± 0.01
0.88 ± 0.02
(0.87 ± 0.05)13.8 ± 0.1
476.5
0.56 ± 0.01
0.53 ± 0.02
(0.54 ± 0.04)
488.0
0.49 ± 0.01
0.48 ± 0.03
(0.48 ± 0.04)
496.5
0.47 ± 0.01
0.46 ± 0.02
(0.47 ± 0.04)
514.5
0.76 ± 0.01
0.77 ± 0.02
(0.72 ± 0.05)
Cyt c (III)
457.9
0.21 ± 0.01
0.20 ± 0.02
(0.21 ± 0.05)13.9 ± 0.1
476.5
0.20 ± 0.01
0.20 ± 0.02
(0.19 ± 0.04)
488.0
0.18 ± 0.01
0.19 ± 0.03
(0.20 ± 0.04)
496.5
0.26 ± 0.01
0.25 ± 0.02
(0.28 ± 0.03)
514.5
1.21 ± 0.01
1.22 ± 0.03
(1.20 ± 0.05)
532.0
0.71 ± 0.01
0.72 ± 0.02
(0.72 ± 0.05)
Cardiolipin-cyt c (III)-NO
488.0
0.67 ± 0.04
0.26 ± 0.04
5.3 ± 0.2
532.0
1.12 ± 0.03
0.64 ± 0.04
7.9 ± 0.3
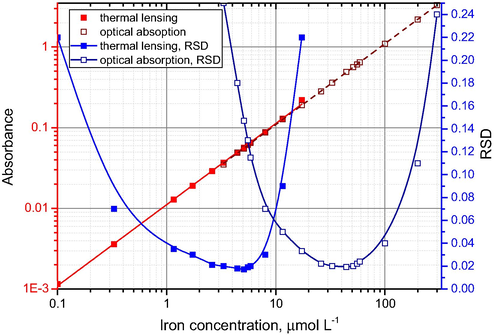
Linear calibration ranges of absorbance (red lines, straight; correspond to the left log-scale Y-axis) and experimental relative standard deviations (RSD) of measurements (blue lines, splined; correspond to the right linear Y-axis) for iron(II) tris(1,10-phenanthrolinate) by thermal lensing (light-color curves) recalculated to absorbance and optical absorption measurements (dark-color curves).
3 Results and discussion
3.1 Complex compounds
The thermal-lens spectrometer implements a back-synchronized measurement mode (Brusnichkin et al., 2010). This measurement modality features different measurement conditions for the blooming and dissipating of the thermal lens. This provides more reliable conditions for measurements of steady states of a fully developed photothermal effect and complete thermal dissipation of thermally induced effects in the end of each cycle of the excitation of the thermal lens (Korobov et al., 2013; Nedosekin et al., 2013b; Proskurnin et al., 2015; Loginova et al., 2016). Thus, the advantages of this modality are (i) the possibility of detection under batch and flow conditions with no change in the optical scheme and measurement conditions; (ii) higher precision due to the averaging of steady-state data and automatic exclusion of spurious points; and (iii) a linear dynamic range of more than five orders of magnitude including rather strongly absorbing (Fig. 2) and scattering samples. However, this modality shows a somewhat lower detection sensitivity compared to lock-in detection schemes more commonly used in TLS (Joshi et al., 2009; Astrath et al., 2010b; Korte et al., 2011; Malacarne et al., 2011; Liu and Franko, 2014b; Marinković et al., 2014); however, it provides a larger volume of information for studies of complex formation at trace concentrations, transient heat dynamics around absorbing nanoparticles, etc. (Brusnichkin et al., 2010; Galkin et al., 2010; Proskurnin et al., 2010; Zhirkov et al., 2010).
The concentrations of the analytes were selected to get the suitable sensitivity and a low error of measurements. The comparison of photothermal and optical absorption sensitivities can be taken in a form of the minimum detectable absorbance for the same detector type (which is correct for the comparison of thermal lensing and optical-absorption measurements) and the same source of excitation (Luk’yanov and Novikov, 2000). In a simplified form, for absorption (opt)/TLS it is given by the equation (Loginova et al., 2016)
The first experiments were made using iron(II) tris(1,10-phenanthrolinate). This iron(II) chelate was used as it served for modeling many experiments in thermal lensing (Seibel and Faubel, 1998; Sato et al., 1999; Tokeshi et al., 2000; Proskurnin et al., 2005; Ghaleb et al., 2006; Smirnova et al., 2012) and it is used for targeting supramolecular interactions with proteins (Boumans et al., 1997), so the accuracy of its measurement at low levels by thermal lensing should be verified.
Table 2 shows a comparison of molar absorptivities for complexes using TLS (4) and optical-absorption spectra. For all the cases—the iron(II) chelate, 3-phenyl-5-(pyridylmethylene)-2-thiohydantoin, and its Cu(II) complex—and the selected set of wavelengths, the difference in the values is insignificant, consistent with previous results (Filichkina et al., 1992a,b; Proskurnin et al., 2004), and indicates the absence of a bias in absorption measurements with the selected TLS modality.
The comparison of molar absorptivities by the tabletop spectrometer (Section 2.3) and its microscopic variant designed and optimized for biological studies (Nedosekin et al., 2012) show negligible changes for iron. The results for Cu(II) in acetonitrile and iron(II) in water allow us to conclude that the precision of measurements does not depend on the solvent.
Fig. 3 shows the precision of measurements (relative standard deviation, RSD) of the iron(II) chelate for different optical path lengths. It shows that all the curves obey the same relationship, which can be approximated for low thermal-lens signals as hyperbolic (Smirnova et al., 2008) and for the lower parts, RSD is a linear function of the optical path length. This can be used for selecting the appropriate path length to increase the precision of measurements of light absorption using TLS.
Dependence of the relative standard deviation (RSD) of thermal-lens measurements of iron(II) tris(1,10-phenanthrolinate) (1 × 10⁻⁵ mol L−1) on the path length of the sample: ● is 10 mm, ○ is 20 mm ▾ is 30 mm and △ is 40 mm. Excitation power, 40 mW; excitation wavelength, 514.5 nm; other parameters are listed in Table 1.
With a tunable photothermal microscope, it is possible to get the whole spectrum of the absorbing substance in a multispectral mode of the instrument (Galanzha et al., 2009; Proskurnin et al., 2011). The results for iron(II) tris(1,10-phenanthrolinate) are shown in Fig. 4. It shows very good agreement between the data for thermal-lens and optical-absorption measurements.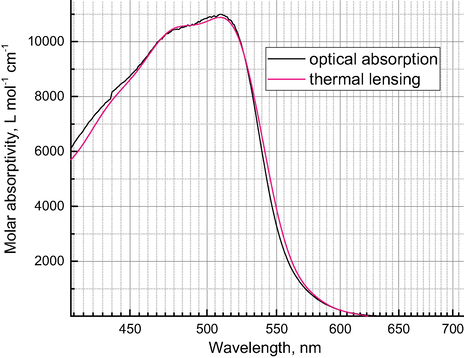
Absorption spectra of iron(II) tris(1,10-phenanthrolinate) (1.25 × 10⁻⁴ mol L−1) obtained from thermal lensing (red) and from optical-absorption measurements (black).
The results for these model systems allowed us to test the thermal-lens measurements on a number of novel ligands of substituted 2-thiohydantoins and their copper complexes (Table 3) as potent inhibitors of cancer-associated mutant isocitrate dehydrogenases (Wu et al., 2015) and potential anticonvulsant agents (Habib et al., 2015). Their use in biology and medicine requires the understanding of both the parameters of the absorption bands of these complexes and their photostability. Still, due to similar parameters of the absorption bands of ligands and complexes while rather different absorption parameters of various ligands, these substances can be used for verifying the measurements of the above-discussed model systems.
Table 3 shows the data obtained from thermal lensing and optical-absorption measurements for most promising complexes of this series: 3-phenyl-5-(pyridylmethylene)-2-thiohydantoin (Beloglazkina et al., 2005) and 3-allyl-5-(pyridylmethylene)-2-thiohydantoin and 3-(propen-2-yl)-5-(pyridine-2-ylmethylene)-3,5-dihydro-4H-4-oxoimidazol-2-yl)-thio]-ethane complexes (Beloglazkina et al., 2014; Majouga et al., 2014). For all the cases, the difference between the measurements is no more than 10%, which is the evidence of the stability of these complexes under the selected conditions.
Moreover, it is important than for absorptivities below 100 L mol−1 cm−1, thermal lensing provides values with higher precision or allows measuring the values that are beyond the precision limits of spectrophotometry (Table 3). It can be accounted for by the fact that thermal lensing is more advantageous for measuring low absorbances, as in this case the error of optical absorption measurements increases, while the error of thermal lensing remains low (Smirnova et al., 2008); see Fig. 2 for iron(II) concentrations within the range 2–10 μmol L−1.
Thus, tests of all of the above systems showed good accuracy and precision of measurements of molar absorptivities in all the tested modalities.
3.2 Heme protein stable species
As in cases aforesaid, the absorption-band parameters for hemoglobin (Hb) and cytochrome c (cyt c) species show insignificant differences from spectrophotometry (Table 4). The parameters Pe of 10–50 mW and doses of 10–100 mJ were selected to avoid overheating, which can result in either protein decomposition or signal amplification (Proskurnin et al., 2011, 2012). This fact can serve as a proof that no other ways of energy transfer occur in these proteins apart from thermal relaxation under the conditions of the experiment.
As TLS requires a much lower volume for the measurements compared to conventional spectrophotometry, it is possible to use significantly smaller amounts of the test substance for measurements. In these terms, the irradiated volume for the spectrometer used is 40 nL. From these data, we estimated the amounts of proteins providing the determination of molar absorptivities from thermal-lens measurements with enough precision as 0.1–0.2 pmol (1–2 ng).
Similar to the above-discussed chelates, the spectra of hemoglobin and cytochrome c (Fig. 5) under the same conditions for thermal lensing with a multi-wavelength (spectral) mode and optical-absorption measurements show negligible differences, which supports the findings for cw TLS that are summarized in Table 4 and agrees with our previous data (Proskurnin et al., 2011).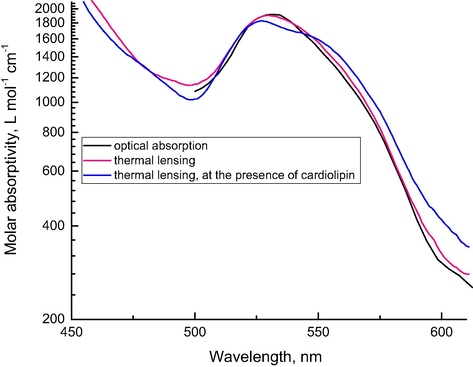
Absorption spectra of cytochrome c (1.1 × 10⁻⁵ mol L−1) obtained from thermal lensing (red and blue) and from optical-absorption measurements (black). Red and black spectra are obtained for cyt c in PBS 1X and blue is obtained by adding cardiolipin at a ratio of 1:40.
It is worth mentioning that multi-wavelength measurements make it possible to elucidate rather small changes in the spectra due to interaction of heme proteins. For instance, Fig. 5 shows a spectrum of cytochrome c upon adding cardiolipin at the ratio 1:40. This process results in the formation of the cyt c-cardiolipin complex, which, for high excess amounts of cardiolipin, forms spherical nanoparticles, in which the protein is surrounded by a monolayer of cardiolipin molecules (Vladimirov et al., 2013). Under the action of cooperative forces, the protein in the globule expands, and its conformation changes resulting in its action as a peroxidase (Vladimirov et al., 2013). Thermal-lens data show that it results in a slight change in the overall spectrum of cytochrome c in the complex.
Also, the peroxidase activity of cytochrome c is assessed using the minor absorption band at ca. 690 nm, which characterizes the break in the > Fe···S(Met80) coordinate bond leading to the appearance of peroxidase activity of cytochrome c (Vladimirov et al., 2006a,b). Upon the break of the bond, this band disappears. In this work, we tested the sensitivity and the accuracy of TLS of assessing the behavior of this spectral band by a model interaction of substances that mimic the cardiolipin action with cytochrome c at different concentrations. Sodium dodecyl sulfate (SDS) is often used as such an analogue of cardiolipin for modeling its interaction with the cytochrome c (Kagan et al., 2004). To do this, a series of solutions containing cytochrome c and SDS at various ratios were prepared similar to the study (Vladimirov et al., 2006b). The results (Fig. 6) show a very good correlation with existing data. However due to higher sensitivity, thermal lensing provides much smoother and well-defined spectra than previously reported for optical-absorption measurements (Vladimirov et al., 2006b).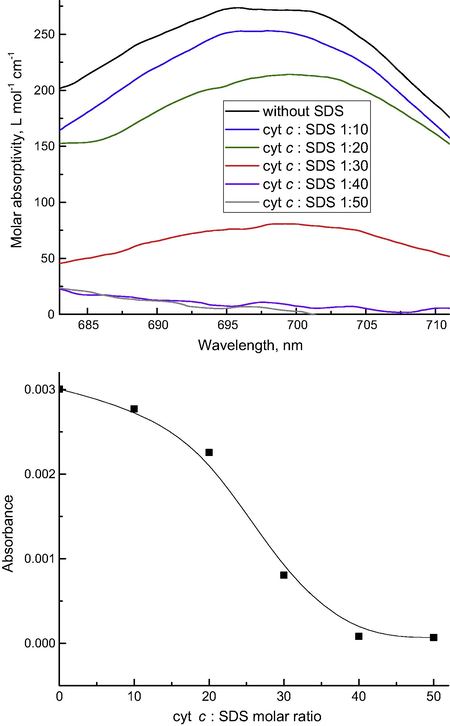
Changes in cytochrome c band at 695 nm (2.0 × 10⁻⁵ mol L−1) in the presence of sodium dodecyl sulfate (SDS) by thermal lensing. Above: absorptions spectra, the black curve shows the original spectrum of cytochrome c, and other spectra correspond to cytochrome c and SDS mixtures. The molar ratios of cytochrome c and SDS are 1:10 (blue); 1:20 (green); 1:30 (red); 1:40 (magenta); and 1:50 (gray). Below are the changes in absorbance calculated from TLS vs. the ratio of SDS and cyt c.
3.3 Nitrosyl cytochrome c complex
Cytochrome c-NO complex in the presence of an anionic lipid, cardiolipin, was selected for this part of the study as it is rather stable compared to the pure cyt c-nitrosyl complex (Vlasova et al., 2006). Also, a photochemical rather than a thermal nature of laser-irradiation impact on this moiety was proven (Osipov et al., 2007). This complex inhibits the peroxidase activity of cyt c-cardiolipin complex and blocks cardiolipin oxidation (Vlasova et al., 2006) and the knowledge of the photochemical processes in this system is of value for studies of the oxidative stress. In the absence of irradiation, the complex itself is stable and does not decompose over time, so the decomposition of the complex was proven to be due to the influence of the laser radiation only (Brusnichkin et al., 2008). The previously suggested mechanism of the photodegradation of this complex suggests the overall independence of its parameters from the excitation wavelength in the visible range (Osipov et al., 2007), which is also connected with the effects of laser therapy accounted for the action of this complex made for He–Cd (441.6 nm), argon (488.0 nm), He–Ne (632.8 nm), and ruby (694.3 nm) lasers (Karu, 1999). This makes it possible to estimate the quantum yield of this process from experiments at two different wavelengths.
In fact, in comparison with other species used in this study, the cyt c-nitrosyl complex shows much lower signal enhancement and molar absorptivities compared to thermal lensing of free cytochrome c (Table 4) even for short-term exposures (the chopper frequency 4 Hz, the total irradiation time 0.5 s). In addition, values of the enhancement factor E for two wavelengths are different, which cannot be accounted for by the nature of photothermal effects, provided no photodegradation occurs.
Taking into account that (i) the value of the thermooptical factor E0 is governed by physical parameters of the medium only; (ii) the system simultaneously has two light-absorbing components (cardiolipin-cyt c-NO complex and free cytochrome c); and (iii) free cytochrome c (III) is photochemically stable (Table 5), we can define the signal as follows:
Irradiation time, s
Quantum yield from thermal lensing
Percentage of free cyt c formed due to photodissociation at 532 nm (P = 0.95, n = 5)
Thermal lensing
Spectrophotometry
0.4
0.45
35 ± 5
n/a
1
0.44
40 ± 5
n/a
10
0.46
70 ± 5
67 ± 5
60
0.48
85 ± 5
82 ± 5
360
0.48
92 ± 5
90 ± 5
Under these conditions, the average quantum yield estimated from (6) is 0.46 ± 0.04 (P = 0.95; n = 5), see Table 5. The percentage of free cytochrome c formed from the initial concentration of the complex is (35 ± 5) %. The latter value was checked by photometric monitoring of this reaction under the same laser irradiation of the sample. The resulting values are in satisfactory agreement with the data of TLS measurements.
4 Conclusions
Thus, by the selection of model systems that are used in in vitro models in PTS and in vivo studies, we succeeded to show and verify that thermal-lens spectrometry provides a high accuracy of measurements of absorptivities both for highly absorbing chromophores (such as iron(II) tris(1,10-phenanthrolinate) or heme proteins) and for lowly absorbing compounds such as substituted 2-thiohydantoins. We believe that this is relevant for many applications of thermal-lens spectrometry and it is supported by the small changes in spectral images made using OPO-based thermal-lens microscopy. In our opinion, both techniques can be used together: a cw meso-scale modality for accurate measurements of absorptivities and multi-wavelength measurements for gathering the spectral images for the comparison with optical-absorption measurements. Also, the findings of this paper can be used together with recently introduced digital holographic thermal lensing (Clark and Kim, 2011), which can enrich the determination of absorption coefficients with high-recognition spatial patterns.
Secondly, we showed that the precision of thermal lensing in measuring absorptivities is suitable for direct estimations of quantum yields of the photodegradation of hemoprotein complexes. Contrary to the approach (Zhao et al., 2012), which provides relative results and requires a reference with a known quantum yield, the approach based on thermal-lens measurements is direct and can be used for simultaneous measurements of the reaction rate from the spectral data. We believe that such measurements should be made using overdetermined systems (multiple wavelengths) that are quite widespread in optical absorption measurements and were used previously in photothermal measurements (Dinc and Onur, 1997; Karpinska et al., 2009; Proskurnin et al., 2011). Certainly, the value of the quantum yield estimated in this study can be elucidated with more precision: this photochemical reaction is rather fast (Osipov et al., 2007; Brusnichkin et al., 2008), which leads to a decrease in the fraction of nitrosyl complex of cytochrome c even during the measurement without irradiation. Thus, the quantum yield obtained taking this into account should probably be higher than the estimation in this study. This problem can be solved by pulsed thermal-lens microspectroscopy (Nedosekin et al., 2014). In addition, fast photochemical processes were very successfully tested by transient thermal lensing (Astrath et al., 2009, 2010a,b). A combination of a steady-state thermal lensing modality with transient measurements could be a very valuable contribution for measuring fast photochemical reactions such as oxyhemoglobin species that were considered stable in this study due to a high rate of the recombination reactions.
Considering the effect of medium properties, especially upon the formation of dispersed systems and organized media, more rigorous accounting for the effects of the system components, in particular, cardiolipin, on the thermophysical parameters of the medium is needed. Therefore, the influence of the amplitude of photothermal measurements in complex systems on the accuracy of absorption-coefficient measurements is required to make the strategy more advantageous. This would be especially relevant for scanning variants of photothermal spectroscopy. Nevertheless, the results obtained show the suitability of this approach for the assessment of laser-induced changes of biologically active species.
Acknowledgments
We are very grateful to Prof. Yuri Vladimirov, a pioneer of biophysics, who inspired our interest in photothermal measurements of protein species and this work in particular. We are grateful to Agilent Technologies — Russia and its CEO, Dr. Konstantin Evdokimov, for Agilent equipment used in this study. The work is supported by The NUST «MISiS» Grant to support the invitation of world’s leading scientists for short-term joined research projects, Grant no. К3-2015-064 (M.A. P.).
References
- Astrath, N.G.C., Astrath, F.B.G., Shen, J., Zhou, J., Michaelian, K.H., Fairbridge, C., Malacarne, L.C., Pedreira, P.R.B., Baesso, M.L., 2010. Determination of photochemical reaction rates using thermal lens spectrometry. In: 15th International Conference on Photoacoustic and Photothermal Phenomena. C. Glorieux and J. Thoen. 214.
- Appl. Phys. Lett.. 2009;95(19)
- J. Appl. Phys.. 2010;107(8)
- Sensors Actuat. B. 2014;191:765-769.
- Polyhedron. 2014;76:45-50.
- Russ. Chem. Bull.. 2005;54(12):2771-2782.
- Photothermal Spectroscopy Methods for Chemical Analysis. New York: Wiley-Interscience; 1996.
- J. Biol. Chem.. 1997;272(27):16753-16760.
- Mosc. Univ. Chem. Bull.. 2008;63(6):338-342.
- Mosc. Univ. Chem. Bull.. 2009;64(1):45-54.
- J. Biophoton.. 2010;3(12):791-806.
- Electrophoresis. 2014;35(16):2279-2291.
- Chem. J. Chinese Univ.-Chinese. 2011;32(5):1001-1007.
- Appl. Opt.. 2011;50(12):1668-1672.
- Eur. Phys. J. Special Topics. 2008;153:59-64.
- Synth. Met.. 2013;163:38-41.
- Talanta. 2011;85(2):850-858.
- Opt. Lett.. 2009;34(12):1882-1884.
- J. Appl. Phys.. 2010;107(8)
- Analusis. 1997;25(3):55-59.
- Russ. J. Gen. Chem.. 2012;82(12):2146-2153.
- Opt. Express. 2013;21(15):18592-18601.
- Opt. Mater.. 1999;12(1):163-175.
- J. Anal. Chem. (Russ.). 1992;47(8):1038-1045.
- J. Anal. Chem. (Russ.). 1992;47(4):483-487.
- Anal. Chim. Acta. 1996;334(3):337-344.
- Spectrochim. Acta A. 1997;53(9):1419-1430.
- J. Biophoton.. 2009;2(12):725-735.
- Methods. 2012;57(3):280-296.
- Mosc. Univ. Chem. Bull.. 2010;65(2):91-97.
- Talanta. 1999;48(3):501-509.
- Appl. Spectrosc.. 2006;60(5):564-567.
- Biomed. Opt. Express.. 2014;5(7):2333-2340.
- Arch. Pharm. 2015
- Meas. Sci. Technol.. 2012;23(1):012001.
- J. Photochem. Photobiol. A-Chem.. 2000;134(1–2):77-85.
- ISO, 1994. ISO 5725:1994 (revised and confirmed in 2012): Accuracy (trueness and precision) of measurement methods and results, International Organization for Standardization.
- Appl. Spectrosc.. 2009;63(7):815-821.
- Free Radical Biol. Med.. 2004;37(12):1963-1985.
- Anal. Lett.. 2009;42(8):1203-1218.
- J. Photochem. Photobiol., B. 1999;49(1):1-17.
- Nanoscale. 2013;5(4):1529-1536.
- Int. J. Thermophys.. 2011;32(4):818-827.
- Photochem. Photobiol.. 2002;75(5):519-526.
- Int. J. Thermophys.. 2014;35(12):2178-2186.
- Crit. Rev. Anal. Chem.. 2014;44(4):328-353.
- Photonic Sens.. 2016;6(1):42-57.
- Tech. Phys.. 2000;45(11):1470-1474.
- Russ. Chem. Bull.. 2004;53(12):2850-2855.
- J. Med. Chem.. 2014;57(14):6252-6258.
- Appl. Spectrosc.. 2011;65(1):99-104.
- J. Opt. Soc. Am. B. 2011;28(2):281-287.
- J. Serb. Chem. Soc.. 2014;79:185-198.
- Small. 2014;10(1):135-142.
- J. Biophoton.. 2013;6(6–7):523-533.
- Appl. Spectrosc.. 2013;67(7):709-717.
- J. Biophoton. 2012:425-434.
- Opt. Mater.. 2000;15(1):33-39.
- Biochemistry (Moscow). 2007;72(13):1491-1504.
- J. Appl. Phys.. 2006;100(4)
- Chem. Phys. Lett.. 2004;396(4–6):221-225.
- Photothermal spectroscopy. In: Baudelet M., ed. Laser Spectroscopy for Sensing: Fundamentals, Techniques and Applications. Cambridge: Woodhead Publ Ltd; 2014. p. :313-361.
- [Google Scholar]
- J. Anal. Chem. (Russ.). 2010;65(7):713-725.
- J. Anal. Chem. (Russ.). 2004;59(9):818-827.
- Russ. Chem. Bull.. 2005;54(1):124-134.
- Anal. Bioanal. Chem.. 2003;375(8):1204-1211.
- J. Anal. Chem. (Russ.). 2015;70(3):249-276.
- Proskurnin, M.A., Volkov, D.S., Ryndina, E.S., Nedosekin, D.A., Zharov, V.P., 2012. Bern Open Publishing: Proceedings of the International Conference on Advanced Laser Technologies. 1(Laser diagnostics and spectroscopy). <https://bop.unibe.ch/ALT-Proceedings/article/view/82>.
- Cytometry A. 2011;79A(10):834-847.
- Phys. Sol. State. 2009;51(1):55-60.
- Appl. Phys. B. 2004;79(5):629-633.
- Spectrochim. Acta A. 2004;60(5):1077-1083.
- Anal. Sci.. 1999;15(7):641-645.
- Fresenius J. Anal. Chem.. 1998;360(7–8):795-797.
- Quant. Electron.. 2013;43(1):1-13.
- Electrophoresis. 2008;29(13):2741-2753.
- Electrophoresis. 2012;33(17):2748-2751.
- Phys. Chem. Chem. Phys.. 2004;6(6):1219-1226.
- Anal. Chem.. 2000;72(7):1711-1714.
- J. Anal. Chem. (Russ.). 2011;66(2):166-170.
- Biophotonics – Riga. 2013;9032:8.
- Vidovic, L., Milanic, M., Majaron, B., 2014. Optical interactions with tissue and cells Xxv; and Terahertz for Biomedical Applications. 8941.
- Biochemistry – Moscow. 2013;78(10):1086-1097.
- Biochemistry – Moscow. 2006;71(9):998-1005.
- Biochemistry – Moscow. 2006;71(9):989-997.
- J. Biol. Chem.. 2006;281(21):14554-14562.
- J. Anal. Chem. (Russ.). 2012;67(10):842-850.
- Science. 2012;335(6075):1458-1462.
- J. Med. Chem.. 2015;58(17):6899-6908.
- Opt. Eng.. 1997;36(1):251-262.
- Anal. Bioanal. Chem.. 2015;407(1):59-78.
- Phys. Chem. Chem. Phys.. 2001;3(24):5470-5474.
- Quantum yields in photolyses of mammalian carboxy-hemoglobin studied by pulsed laser pump-probe technique. In: Zhu E., Sambath S., eds. Information Technology and Agricultural Engineering. Vol vol. 134. Berlin Heidelberg: Springer; 2012. p. :849-856.
- [Google Scholar]
- J. Anal. Chem. (Russ.). 2010;65(6):596-601.


