

Translate this page into:
Nephroprotective and antioxidant activities of ethyl acetate fraction of Euphorbia geniculata Ortega family Euphorbiaceae
⁎Corresponding author. halyousef@ksu.edu.sa (Hanan M. Al-Yousef)
-
Received: ,
Accepted: ,
This article was originally published by Elsevier and was migrated to Scientific Scholar after the change of Publisher.
Peer review under responsibility of King Saud University.
Abstract
In continuation of our work on genus Euphorbia, the phytochemical investigation of ethyl acetate fraction of the aerial parts of Euphorbia geniculata Ortega (Eg) family Euphorbiaceae revealed the isolation and identification of eight polyphenolic compounds; gallic acid (1), ellagic acid (2), quercetin-3-O-rutinoside) (rutin) (3), quercetin-3-O-glucopyranoside-7-O-rhamnoside (4), quercetin-3-O-rhamnoside (5), quercetin-3-O-β-D- glucopyranoside (6), and quercetin-3-O-β-D-arabinoside (7) and quercetin (8) using spectrophotometric and physicochemical analysis. Quantitative estimation of total flavonoids and phenolics contents were carried out for total methanolic extract. Biological activities of ethyl acetate fraction including nephroprotective and antioxidant activities were evaluated for the first time. The nephroprotective potential of Eg was evaluated in male rats with thioacetamide induced kidney injury. Antioxidant activity was evaluated using DPPH method.
Results; Quantitative estimation of total phenolics and flavonoids content in the total methanolic extract of Eg revealed high phenolics content (285.4 mg GAE /gm extract) in comparison with flavonoids content (36.9 mg RE /gm extract). Isolation and characterization of eight polyphenolic compounds. The nephroprotictive activity was studied using thioacetamide as nephrotoxicant agent resulted in marked nephrotoxicity. While pretreatment of rats with ethyl acetate fraction of Eg significantly attenuated the nephrotoxicity through alteration of kidney biomarkers, improving the redox status of the tissue and so brought the serum biochemical parameters nearly toward the normal levels. The study revealed significant antioxidant activity of Eg in comparison with ascorbic acid. Conclusion; The results suggested that E. geniculata Ortega ethyl acetate fraction could be used in future therapy as nephroprotective and antioxidant drugs of natural source.
Keywords
Euphorbia geniculate Ortega
Polyphenolics
Nephroprotective and antioxidant

1 Introduction
The natural products are well known for their beneficial effects on health disorders (Panche et al., 2016). polyphenolics are now considered as an indispensable component in a variety of pharmaceutical, nutraceutical, medicinal and cosmetic applications; that is attributed for their anti-oxidative, anti- mutagenic anti-inflammatory and anti-carcinogenic activities accompanied with their ability in modulating key cellular enzyme function (Panche et al., 2016). Flavonoids belong to a class of plant secondary metabolites having a polyphenolic structure, have miscellaneous favorable biochemical and antioxidant effects associated with various diseases such as Alzheimer's disease, cancer, atherosclerosis, etc. (Panche et al., 2016, Zhou et al., 2007; Pereira et al., 2007). Kidney is very important organ in all vertebrates. The nephron is the structural and functional unit of the kidney. the management of kidney disease procedures include chemical and microscopic examination of the urine while the measurement of kidney function by calculating the estimated glomerular filtration rate using the serum creatinine; and kidney biopsy and CT scan to evaluate for abnormalities of kidney tissues anatomy (Mescher, 2016; Cotran et al., 2005). E. geniculata Ortega belongs to family Euphorbiaceae and is native plant to Mexico. Diterpenes, triterpenes and polyphenolic compounds were identified and /or isolated from the aerial parts of Eg from Egypt (Abdel Ghani et al., 2020b, 2020a; Alia et al., 2015; Refahy, 2011; Rizk et al., 1974) it is distributed as wild plant in Delta farms of Egypt. Current work, the ethyl acetate fraction of Eg was subjected to chromatographic investigation leading to the isolation of eight polyphenolic compounds. Total phenolic and flavonoids contents were estimated also for total methanolic extract of Eg. Nephroprotective and antioxidant activities were evaluated for the first time.
2 Materials and methods
2.1 General section
Evaporation (for solvents) was done using a Buchi rotary evaporator. U.V. lamp used for PC visualization U.V.P., GL-58 (λ max 254 and 366 nm). The circulating hot air oven; W.T-binder 7200, (Germany). The Shimadzu U.V.- 1700 spectrophotometer, Japan, for UV analysis, using different shift reagents in UV spectral analysis of flavonoids. IR spectral analysis was recorded in KBr disks on a Pye Unicam SP 3000 and IR spectrophotometer, Jasko, FT/IR- 460 plus. UPLC-ESI-MS/MS in negative mode was carried out on a XEVO - TQD triple quadruple instrument. Waters Corporation, Milford, MA01757 U.S.A, mass spectrometer; Column: ACQUITY UPLC-BEH C18 1.7 µm-2.1 × 50 mm, Column Flow rate: 0.2 ml\min, Ain Shams University, Cairo, Egypt. Quantitative estimations of total phenolics and flavonoids contents were carried out in the Regional Center for Mycology and Biotechnology (RCMB), Al-Azhar University, Cairo, Egypt. Polyamide 6 column and Sephadex LH-20 CC were used in fractionation and purifications of the compounds isolated from ethyl acetate fraction. Paper chromatography (PC) was carried out on sheets of (Whatmann No.1) for analytical PC and (Whatmann No.3) for PPC were used. NMR analysis experiments were performed on a Bruker AMX 400 MHZ for 1H NMR and with standard pulse sequences operating at 125 MHz for 13C NMR. While chemical shifts are given in δ values (ppm) by using tetramethylsilane (the internal standard), DMSO‑d6 (solvent at room temperature) were of spectroscopic grade for spectral analysis. solvent systems for PC; solvent system 1; 15% HOAc, solvent system 2; n‑butanol: acetic acid: water; BAW (4:1:5); (the upper layer) and solvent system 3; EtOAc:MeOH:H2O (30:5:4).
2.1.1 Plant material and extraction process
Aerial parts of E. geniculata Ortega Euphorbiaceae were collected in the flowering stage on August 2015, from roadsides and beside farms in the vicinity of Banha, Qalubya, Egypt. The identification was kindly verified by Dr. Ahmed Abdel-Razik; lecturer of Plant Taxonomy, Department of Botany Faculty of Science, Banha University, Egypt. The vouchers specimen (no. S304) was deposited in National Research Centre, Dokki, Egypt. The plant material was air dried and grounded by electric mill to moderately fine powder. The solvents used in this work were methylene chloride, ethyl acetate and methanol were of the analytical grade for chromatography and crystallization. The extraction of the air-dried powdered plant materials (2 kg) was by maceration in 70% methanol until complete exhaustion, then the methanolic extract was dried under reduced pressure at 45 °C revealing viscous greenish brown residue (358 gm) total methanolic extract which dissolved in least amount of MeOH/H2O (1:9), then subjected to fractionation by methylene chloride (defatting) and ethyl acetate to give ethyl acetate fraction (21 gm).
2.2 Quantitative estimation of the total phenolics and flavonoids
Quantitative determinations were done using Folin–Ciocalteu Method for total phenolic estimation and aluminum chloride colorimetric method for total flavonoids estimation as reported in (Ghasemzadeh et al., 2010).
2.3 Isolation of the compounds 1–8 from ethyl acetate fraction
The ethyl acetate fraction of Eg (10 g) was placed on the top of Polyamide 6 CC for fractionation. The column was eluted firstly with water and then polarity decreased gradually using methanol. About six fractions (500 ml) were collected, concentrated under reduced pressure and subjected to paper chromatography screening with solvents 1 and 2. The most promising fractions were applied on sephadex LH‑20 column. Eight compounds (1–8) were isolated from their fractions on the following sequence; compounds 1 & 2 (20% MeOH/H2O), compound 3 & 4 (40% MeOH/H2O), compound 4 & 6 (60% MeOH/H2O), compound 7 (80% MeOH/H2O) and compound 8 (100% MeOH).
Gallic acid (1) (17 mg): Isolated as faint yellow needles in visible light, with m.p. 260 °C, gave brown color with ammonia vapors, while spraying with FeCl3 gave blue color. Rf value was 0.78 (solvent system 1). UPLC-ESI- MS/MS (negative mode) show molecular ion peak at m/z 169 [M−H]+ and fragment ion at 125 amu [M−H−COO]+. The UV spectra of 1 revealed absorption bands at λmax 217 and 272. 1H NMR (400 MHz, DMSO–d6): shows δH at 6.98 (2H, s, H-2/H-6) and 9.17 (3H, s, –OH). 13C NMR (125 MHz, DMSO–d6) spectrum showed δc 167.61 (C-7), 145.51 (C-3/C-5), 138.12 (C-4), 120.62 (C-1) and 108.81 (C-2/6) (Smith, 1960, Mabry et al., 1970, Harborne, 1973).
Ellagic acid (2) (15 mg): Isolated as yellowish white needles in visible light and brown color after exposure to ammonia vapors while spraying with FeCl3 gave blue color, with m.p. 360 °C and Rf value 0.48 in solvent system 1. UPLC-ESI- MS/MS (negative mode) shows molecular ion peak at m/z 301 [M−H]+, fragment ion peak at 257 amu [M−COOH]+. The UV spectra of 2 show absorption bands at λmax 353 and 367. 1H NMR (400 MHz, DMSO–d6) spectrum shows δH at 7.42 (2H, s, H-5 & H-12), broad singlet at δH 10.62 (4H, s, H-3, H-4, H- 10 and H-11). 13C NMR (125 MHz, DMSO–d6) δc 159.6 (C-7 & C-14), 148.56 (C-4 & C-11), 140.02 (C-3 and C-10), 136.84 (C-2 & C-9), 112.77 (C-6 & C- 13), 110.7 (C-5 & C-12) and 108.13 (C-15 & C-16) (Mabry and Markham 1975, Nawwar et al., 1994).
Rutin (3) (15 mg); isolated as yellow powder, with Rf 0.37 (solvent system 2), with m.p. 242 °C, gave dark purple spot turned to yellow with ammonia vapor. UV λmax (MeOH) 256, 355, (MeOH + NaOMe) 268, 412, (MeOH + AlCl3) 273, 435, (MeOH + AlCl3 + HCl) 268, 402, (MeOH + NaOAc) 276, 394 (MeOH + NaOAc + H3BO3) 270, 396 nm. UPLC-ESI-MS/MS (negative mode) spectrum shows molecular ion peaks at m/z 609 [M−H]+, 463 [M−H−146]-, 301 [M−H- rutinosyl]+, and 151. 1H NMR (400 MHz, DMSO–d6): δH 7.62 (IH, s, H-2), 7.55 (1H, d, J = 8, H-6‘), 6.85 (1H, d, 8 Hz, H-5‘), 6.39 (1H, d, J = 2H-8), 6.20 (1H, d, J = 2.1, H-6), 5.34 (1H, d, 7.8 Hz, H-1), and 4.39 (1H, d, J = 2.0 Hz, H-1), while the rest of protons in the sugar moieties resonated between 1.10 and 3.83 ppm and 1.1 (CH3-6′'' of rhamnose , 3H, d, J = 6 Hz). 13C NMR (125 MHz, DMSO–d6) spectral data at δC 177.91 (C-4), 164.76 (C-7), 161.66 (C-5), 156.74 (C-2), 156.71 (C-9), 149.11 (C-4′), 145.45 (C-3′), 134.19 (C-3), 122.53 (C-1′), 121.36 (C-6′), 116.22 (C-5′), 115.83 (C-2′), 104.34 (C-10), 99.17 (C-6), 93.99 (C-8) and sugars moieties at 104.8 (C-1″), 73.1 (C-2‘‘), 73.65 (C-3′'), 72.6 (C- 4″), 74.41 (C-5), 60.75 (C-6), 71.38 (C- 2′''),71.63 (C-3), 73.9 (C-4), 68.38 (5), and 17.73 (C-6‘‘‘) (Hassan and Abdallah, 2017 and Abdel-Ghani et al., 2015).
Quercetin-3-O-glucopyranoside-7-α-L-rhamnoside (4); (7 mg) was isolated as yellow powder, m.p. 236 °C, with Rf 0.37 in solvent system 3, it gave dark purple fluorescent spot turned to yellow under UV365 with ammonia vapor and orange yellow with Naturstoff spray reagents. UV spectra show λmax (MeOH) 256, 358, (MeOH + NaOMe) 268, 395, (MeOH + AlCl3) 272, 438, (MeOH + AlCl3 + HCl) 270, 403, (MeOH + NaOAc) 262, 371 (MeOH + NaOAc + H3BO3) 261, 382 nm. UPLC-ESI-MS/MS spectrum (negative mode) shows molecular ion peaks at m/z 609 [M−H]+, 447 [M−H−162]+, 301 [M−H−146−162] + and 151.4. The 1H NMR spectrum showed the presence of five signals for aromatic protons at δH 7.63 (IH, s, H-2), 7.55 (1H, dd, J = 8, 2.1H-6), 6.84 (1H, d, 8 Hz, H-5), 6.40 (1H, d, J = 2.0H-8), 6.19 (1H, d, J = 2.5, H-6). 5.35 (1H, d, 10 Hz, H-1‘‘), and 4.41 (1H, d, J = 2.0 Hz, H-1‘‘‘), while the rest of protons in the sugar moieties resonated between 3.08 and 3.82 ppm.13C NMR (125 MHz, DMSO–d6) spectral data appeared at δC 177.97, 164.78, 161.67, 156.75, 156.72, 149.17, 145.46, 134.19, 122.54, 121.37, 116.22, 115.83, 104.34, 101.87, 99.17, 93.99 and sugars moieties at 104.61, 102.30, 74.31, 73.53, 73.46, 71.48, 60.75, 73.10, 71.63, 73.91, 68.29 and 17.63 ppm (Lilis et al., 2017 and Vedenskaya et al., 2004).
Quercetin 3-O-α-L-rhamnoside (5) (5 mg); Isolated as yellow powder, with m.p. 177–183 °C, Rf 0.84 (solvent system 3), gave yellow color with ammonia vapor. UV spectra show λmax (MeOH) 256, 365, (MeOH + NaOMe) 271, 394, (MeOH + AlCl3) 272, 424, (MeOH + AlCl3 + HCl) 268, 394, (MeOH + NaOAc) 275, 356, (MeOH + NaOAc + H3BO3) 274, 366 nm. UPLC-ESI-MS/MS (negative mode) show molecular ion peak at m/z 447 [M−H]+, 301 [M−H−rhamnosyl]+ and 151. 1H NMR (400 MHz, DMSO–d6): shows δH 7.76 (IH, s, H-2‘), 7.27 (1H, d, J = 8 Hz, H-6), 6.88 (1H, d, J = 8.5 Hz, H-5), 6.39 (1H, d, J = 2.1 Hz, H-8), 6.21 (1H, d, J = 2.4 Hz, H-6), 5.39 (1H, d, J = 9 Hz, H-1), 1.03 (3H, d, J = 6 Hz, CH3–6′'); while the rest of protons in the sugar moiety resonated between 3.15 and 3.98. 13C NMR (125 MHz, DMSO–d6): δ ppm 177.8 (C-4), 165.43 (C-7), 161.8 (C-5), 58.01 (C-2), 156.4 (C-9), 148.51 (C-4‘), 145.56 (C-3‘), 134.27 (C-3), 122.24 (C-6‘), 121.40 (C-1‘), 115.8 (C-5‘), 115.62 (C-2‘), 104.10 (C–10), 101.86 (C-1′'), 98.98 (C-6), 94.45 (C-8), 71.46 (C-4′'), 74.15 (C-4″), 70.55 (C- 2′'), 70.62 (C-3′') and 17.54 (C-6′') (Ahmadu, 2007 and Metwally et al., 2010).
Quercetin-3-O-β-D-glucopyranoside (6) (10 mg): Isolated as yellow amorphous powder, with m.p. 316 °C, gave dark purple spot turned to yellow with ammonia vapor, IR shows absorbtion frequencies at νmax cm−1: 3260–3320, 2876, 1661, 1608, 1563, 1514 and 1460. UV λmax (MeOH) 259, 359, (MeOH + NaOMe) 268, 418, (MeOH + AlCl3) 269, 427, (MeOH + AlCl3 + HCl) 268, 398, (MeOH + NaOAc) 274, 376 (MeOH + NaOAc + H3BO3) 273, 385 nm. UPLC-ESI-MS/MS (negative ion) shows molecular ion peak at m/z 463 [M−H] + and fragment ion at 301 amu, The 1H NMR (400 MHz, DMSO–d6) shows δH at 7.76 (1H, s, H-2׳); δ 7.53 (1H, d, J = 2 Hz, H-6׳); and 6.80 (1H, d, J = 8.6 Hz, H-5׳), 6.40 (1H, d, J = 2.1 Hz, H-8), 6.20 (1H, d, J = 1.8 Hz H-6), 5.37 (1H, d, J = 8 Hz, H-1″), 3.90–3.10 (6H, m, remaining sugar protons). 13C NMR (125 MHz, DMSO–d6): 177.7 (C4), 164.82 (C7), 161.62 (C5), 156.74 (C9), 156 (C2), 148.79 (C4′), 146.3 (C3′), 133.9 (C3), 122.34 (C6′), 121.51 (C1′), 116.4 (C5′), 115.54 (C2′), 104.26 (C10), 99.08 (C6), 93.93 (C8), and 101.2 (C1″) (Ahmadu, 2007 and Metwally et al., 2010).
Quercetin-3-O-β-D-arabinopyranoside (7) (10 mg): isolated as yellow amorphous powder, with m.p. 260 °C, gives dark purple spot turned to yellow with ammonia vapor. IR spectrum shows absorption frequencies at νmax cm−1 at: 3476, 3372, 3189, 2902, 1655, 1615, 1510 and 1469. UV spectra show λmax (MeOH) 265, 365, (MeOH + NaOMe) 261, 424 (MeOH + AlCl3) 273, 438, (MeOH + AlCl3 + HCl) 268, 394, (MeOH + NaOAc) 278, 376, (MeOH + NaOAc + H3BO3) 273, 387. UPLC-ESI-MS/MS (negative mode) shows molecular ion peak at m/z 433 [M- H]+, 301 [M−H−arabinosyl]+. 1H NMR (400 MHz, DMSO–d6): δ 7.67 (1H, s, 2′); δ 7.57 (1H, d, J = 8.6 Hz, H-6′), 6.83 (1H, d, J = 8.6 Hz, 5′), 6.43 (1H, d, J = 1.8 Hz, H-8), 6.20 (1H, d, J = 1.8 Hz, H-6) and 5.38 (1H, d, J = 8 Hz, H-1″), 13C NMR (125 MHz, DMSO–d6): δC 177.96 (C-4), 164.77 (C-7), 161.67 (C-5), 156.75 (C-2), 156.71 (C-9), 149.07 (C-4′), 145.45 (C-3′), 134.19 (C-3), 122.53 (C-1′), 121.36 (C-6′), 116.22 (C-5′), 115.83 (C-2′), 104.34 (C-10), 101.87 (C-1′'), 99.17 (C-6), 93.99 (C-8), 72.12 (C3″), 71.2 (C2″), 66.5 (C4″) and 64.8 (C5″) (Rashed et al., 2016, Vedenskaya et al., 2004).
Quercetin (8) (6 mg); Isolated as yellow amorphous powder, m.p. 316 °C, Rf 0.32 (solvent system 1). UV spectra show λmax (MeOH) 255, 372, (MeOH + NaOMe) 262, 427, (MeOH + AlCl3) 271, 458, (MeOH + AlCl3 + HCl) 265, 427, (MeOH + NaOAc) 268, 398 (MeOH + NaOAc + H3BO3) 262, 377 nm. ESI-MS/MS (negative mode) shows molecular ion peaks at 301 [M−H]+ and 151. The 1H- NMR (400 MHz, DMSO–d6) showed δH ppm 7.67 (1H, d, J = 8.8 Hz, H-6′), 7.53 (1H, s, H-2′), 6.92 (1H, d, J = 9.2 Hz, H-5′), 6.43 (1H, d, J = 2 Hz, H-8), 6.22 (1H, d, J = 2 Hz, H-6), 13C NMR (100 MHz, DMSO–d6) displayed 176.29 (C-4), 164.33 (C-7), 161.18 (C-5), 158.99 (C-9), 156.58 (C-2), 148.15 (C-4′), 145.51(C-3′), 136.49 (C-3),122.41, (C-1′), 120.49 (C-6′), 116.18 (C-5′),115.44 (C-2′), 103.46 (C-10), 98.63 (C-6) and 93.80 (C-8) (Rashed et al., 2016, Metwally et al., 2010 and Vedenskaya et al., 2004).
2.4 Nephroprotective materials
2.4.1 Animals
Sprague Dawley male rats (220 ± 6 gm weight) were purchased from Theodor Bilharz Institute (Giza, Egypt). The animals were housed in the animal facility of Faculty of Pharmacy (Boys), Al-Azhar University, Cairo, Egypt. They were fed with standard diet pellets (El-Nasr Company, Abou-Zabal, Cairo, Egypt), and free access of water were allowed. The animals were kept at room temperature (25 °C ± 2) and natural humidity (55 ± 6) with 12 h-light/12 h dark cycle. The experiments were conducted in accordance with the ethical guidelines for investigations in laboratory animals and comply with the guidelines for the care and use of laboratory animals. The approval committee was given by ZU-IACUC committee with approval number ZU- IACUC/3/F/145/2019.
2.4.2 Chemicals
Silymarin (Sil): yellow fine powder (dissolved in normal saline) was purchased from Sigma-Aldrich Chemical Company, St. Louis, MO, USA. Thioacetamide (TAA): with powder purity 98.1% (dissolved in normal saline) was purchased from Sigma-Aldrich Chemical Company, St. Louis, MO, USA.
2.4.3 Experimental design
Ethyl acetate fraction of Eg was dissolved in dist. water in the required doses, twenty-four rats were divided into four groups, six animals each, and the following schedule of treatment was adopted: Group 1 (Control group): the rats were given normal saline daily (2 ml/kg b.w., orally) for 4 consecutive weeks and served as control group (cont gp). Group 2 (TAA-gp): the rats were injected intra-peritoneal with TAA (100 mg/kg b.w.) dissolved in saline for once time (acute nephrotoxicity) (Ahmed, 2015 and Ahmad et al., 2018). Group 3 (Sil + TAA-gp): the rats were pretreated orally with sil (100 mg/kg b.w.) (Ahmed, 2015)] daily for 4 consecutive weeks, then with TAA for once time. Group 4 (Eg + TAA-gp): rats were pretreated orally with Eg ethyl acetate fraction (200 mg/kg b.w.) daily for 4 consecutive weeks then with TAA for once time. Eg EtOAc fraction and sil were given to the animals orally by gastric intubation along 4 weeks following the procedure of Ahmed (2015) and Nouri and Heidarian (2019).
2.4.4 Serum and tissue preparations
Blood Samples were collected from retro-orbital venous plexus of rats (after light ether anesthesia) in non-heparinized tubes and for measuring biochemical parameters; and the sera were separated. Then, the animals were weighted and sacrificed; kidneys were weighted then dissected, washed by saline, blotted between dry filter papers and kept until histopathological examinations.
2.4.5 Biochemical analysis
Sera separated from blood samples was used for the determination of kidney enzymes creatinine (CR), urea (UR), Part of Kidney tissue was homogenated and centrifuged at 5000 rpm for 10 min and the resulting supernatant was used for determination of oxidative enzymes; superoxide dismutase (SOD), catalase (CAT) activities, and reduced glutathione (GSH) (Balahoroğlu et al., 2008). All tests were carried out using colorimetric spectrum BiodiagnosticsTM and DiamondTM kits (Cairo, Egypt),
2.4.6 Histopathological examination
Histopathological assessment of kidney tissues was carried out as per the standard method (Banchroft et al., 1996) to evaluate the histopathological changes. Small pieces of kidney tissue from all groups were immediately transferred and fixed in 10% formalin for 24 h. The sections were (4–5 mm thick) of kidney tissues were prepared and properly stained using hematoxylin-eosin (H & E) and masson trichrome (MT) stain dyes. The microphotograph of stained sections of kidneys were taken and examined for expected pathological alterations in the tissues.
2.4.7 Statistical data analysis
The results of all data are presented as mean ± SEM. The one-way analysis of variance was used to calculate the total variation in a set of data. P < 0.05 value as statistically significant.
2.5 Evaluation of the antioxidant activity
The radical scavenging effects of Eg were determined using the DPPH assay
(Elaasser et al., 2011) for the first time for ethyl acetate fraction. The following formula: Radical scavenging % = [(Acontrol–Asample)/Acontrol]x100 was used (Carocho et al., 2014). The investigation was carried out in Regional Center for Mycology and Biotechnology, Al-Azhar University.
3 Results:
3.1 Quantitative estimation of the total phenolics and flavonoids
Quantitative estimation of the total phenolics and flavonoids contents was done using Folin–Ciocalteu Method for phenolic estimation expressed as gallic acid equivalent (GAE) and Aluminum Chloride Colorimetric Method for flavonoids expressed by rutin equivalent (RE) (Carocho et al., 2014). (Fig. 1) showed the total phenolic content is 36.9 mg GAE/gm and the total flavonoidal content is 285.4 mg RE /gm of the methanolic extract of Eg (see Fig. 2).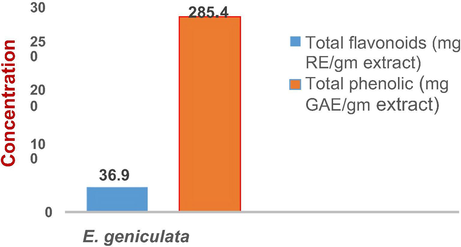
Total phenolic and flavonoid contents in mg GAE and mg RE/gm of the methanolic extract of the aerial parts of E. geniculata Ortega.
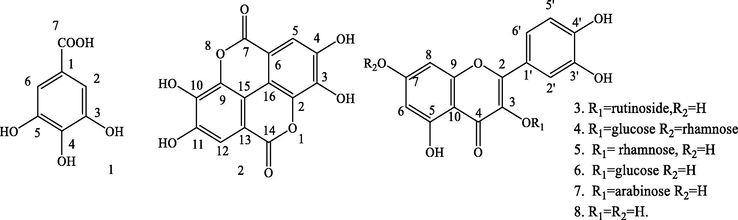
Chemical structures of compounds 1–8.
3.2 Chemical investigation
3.2.1 Nephroprotective
Thioacetamide is nephrotoxic agent known to induce acute or chronic kidney disease (fibrosis) in the experimental animal model by generating oxidative stress that leads to systematic apoptosis within the kidney (Balahoroğlu et al., 2008). In the present work, TAA is used as potent nephrotoxic agent in rats. A dose of 100 mg/kg ip TAA administration for once time is reported to be the cause of acute nephrotoxicity (Ahmed, 2015 and Ghosh et al., 2016).
3.2.2 Evaluation of kidney biochemical parameters
Once dose of (100 mg/kg ip) TAA was enough to cause acute nephrotoxicity (Ahmed, 2015 and Ghosh et al., 2016) resulted in significant (p ≤ 0.05) increase in the kidney enzymes (CR and UR) in serum, while significant decrease in TP, Alb, kidney weight/body weight ratio (Kid W/BW), GSH, CAT and SOD) (Balahoroğlu et al., 2008). Pretreatment with Eg EtOAc fraction attenuated the TAA-induced nephrotoxicity and restored the elevated and reduced levels of kidney biomarkers toward normality in comparison with Sil treated group as follow; Eg and Sil caused significant decrease in the kidney enzymes (CR and UR in serum) (Fig. 3), while significant increase in Alb, TP, Kid W/BW, GSH, CAT and SOD (Figs. 3–5). So, we can recommend Eg EtOAc fraction as strong nephronprotective drug as it could protect the kidney nephrons from damage caused by TAA injection and attenuated the toxic effect of such reagent and improve the kidney enzymes toward nearly the normal values as shown in Figs. 3–5.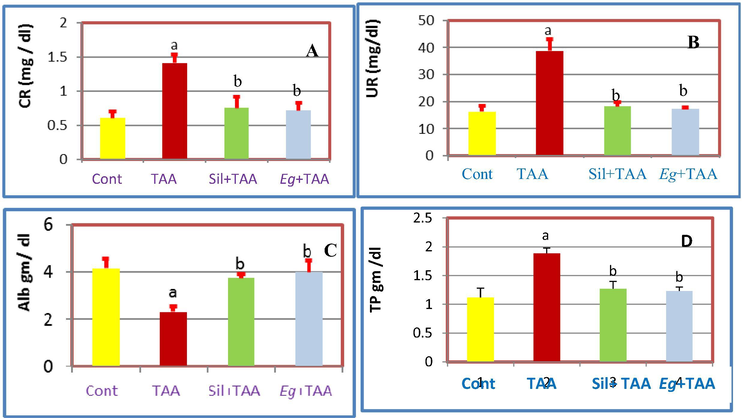
Effects of pretreatment with Eg and Sil, A: On serum CR of TAA-treated rats, B: On serum UR of TAA treated rats, C: On Alb of TAA-treated rats, D: On TP of TAA-treated rats.
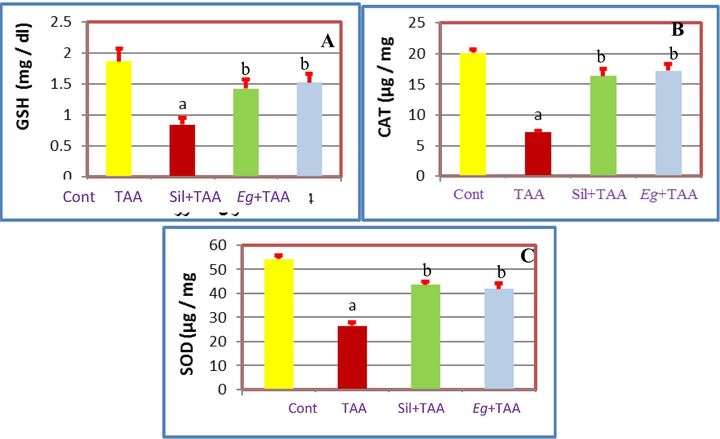
A: Effects of pretreatment with Eg and Sil A: on GSH of TAA treated rats, B: On CAT of TAA treated rats and C: On SOD of TAA treated rats.
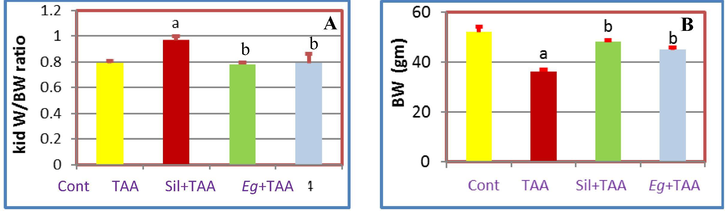
Effects of pretreatment with Eg and Sil, A: On Kid W/BW of TAA treated rats, B: On BW of TAA treated rats.
3.2.3 Histopathological results
Histopathological examinations of the sections of kidneys exposed to TAA showed glomerular and blood vessel congestions, epithelial desquamation tubular casts, in comparison to the kidneys of cont-gp rats. pre-treatment with Eg EtOAc showed average renal capsule, average glomeruli with average Bowman’s spaces, few proximal tubules showed partial loss of brush borders, dilated congested blood vessels, and renal medulla showed collecting tubules with edematous epithelial lining (Fig. 6), while in Masson trichrome stained kidney sections: showed average collagen in glomeruli and around tubules (Fig. 7).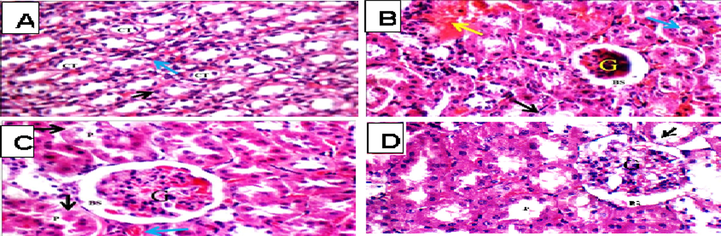
light photomicrograph (H&E X 400), A; (Cont gp): renal medulla showing average collecting tubules (CT) with average epithelial lining (black arrow) and average interstitium (blue arrow). B; (TAA gp): small-sized glomerulus (G) with widened Bowman’s space (BS), proximal tubules with edematous lining (black arrow) with intra- tubular debris (blue arrow), and areas of interstitial hemorrhage (yellow arrow). C; (Sil + TAA gp): showing congested edematous glomerulus (G), proximal tubules with edematous and apoptotic epithelial lining with partial loss of brush borders (black arrow), and congested blood vessels (blue arrow) D; (Eg + TAA gp) showing average glomerulus (G) with average Bowman’s spaces (BS), and few proximal tubules (P) showing partial loss brush borders (black arrow).
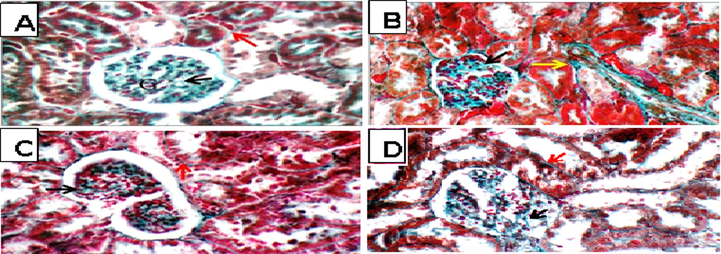
light photomicrograph (MT X 400), A; (Cont gp): average collagen distribution in glomeruli (black arrow) and around tubules (red arrow). B; (TAA gp): showing excess collagen in glomeruli (black arrow) and around tubules (yellow arrow). C; (Sil + TAA gp): showing average collagen distribution in glomeruli (black arrow) and around tubules (red arrow). D; (Eg + TAA gp): showing excess collagen in glomeruli (black arrow) and around tubules (red arrow).
3.2.4 Nephroprotective discussion
Current study revealed that TAA causes acute renal injury as a significant UR and CR elevations while decline in Alb, TP, CAT, SOD, GSH, Kid. w/BW and BW. Histological findings on kidney depicted that injection of TAA caused renal damage (Fig. 7A). In groups 3 and 4 TAA-induced nephrotoxicity attenuated by Sil and Eg treatments which are in agreement with prior investigations (Nouri and Heidarian, 2019). The renal protective effect of Eg may be due to high phenolic contents leading to high scavenging activity which makes stabilizing effect on plasma membrane and proteins against reactive oxygen species (Nouri and Heidarian, 2019, Abdel-Ghani et al., 2015).
3.3 DPPH radical scavenging activity
The total methanolic extract of Eg showed very high phenolic content and flavonoid content (Fig. 1), and so evaluation of the DPPH radical scavenging of Eg ethyl acetate fraction was carried out (Carocho et al., 2014). Series solutions of concentrations ranged from 10 to 1280 μg in methanol. The EtOAc fraction of Eg showed high antioxidant activity in comparison with ascorbic acid (positive standard). The SC50 values (the concentration required to scavenge DPPH by 50%) were 16.0 and 14.2%, for Eg EtOAc and Ascorbic acid, respectively as shown in (Fig. 8).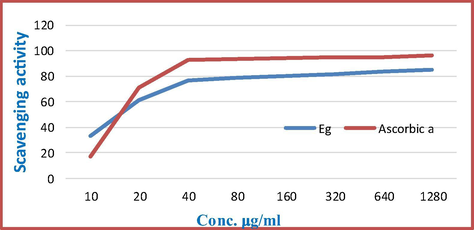
% Scavenging activity of ethyl acetate fraction of E. geniculata Ortega and Ascorbic acid.
4 Conclusions
The study revealed very high phenolics content of methanolic extract of the aerial parts of Eg. In addition to, the isolation of eight polyphenolic compounds from the ethyl acetate fraction of the Eg mainly tannins and flavonoid glycosides. Strong nephroprotective and antioxidant activities exhibited by the studied fraction were attributed to the high contents of these compounds. These findings need more follow up research for more investigation of biological activities through further set of experiments. From such point it was recommended to use the ethyl acetate fraction of Eg as nephroprotective and antioxidant drug of natural origin.
Acknowledgements
Authors are thankful to the Researchers Supporting Project number (RSP-2020/132), King Saud University, Riyadh, Saudi Arabia. The authors would like also to thank Prof. Dr. Ahmed Ibrahim Mansour Professor of Toxicology and Pharmacology, Department of Pharmacology, Faculty of Pharmacy (Boys), Al-Azhar University, Cairo, Egypt, for his greet efforts in carrying out nephroprotictive activity. The authors also, would like to thank Dr. Ahmed Abdel Razik respective lecturer of Plant Taxonomy, Department of Botany Faculty of Science, Banha University, Egypt; for plant identification and supply.
Declaration of Competing Interest
The authors declare that they have no known competing financial interests or personal relationships that could have appeared to influence the work reported in this paper.
References
- Chemical Profile and Hepatoprotective Activity of Ethyl Acetate Extracts of Euphorbia paralias and Euphorbia geniculata (Euphorbiaceae) from Egypt. Pharmacogn. J.. 2020;12(4)
- [Google Scholar]
- Diterpenoids Profile of E. paralias and E. geniculata using UPLC-ESI/MS Spectrometry. ejchem.. 2020;25113–2486 DOI: 10.21608
- [Google Scholar]
- Phytochemical and biological study of Albizia lebbeck stem bark. J. Ch. Pharm. Res.. 2015;7(5):29-43.
- [Google Scholar]
- Ameliorative Effect of Camel's Milk and Nigella Sativa Oil against Thioacetamide-induced Hepatorenal Damage in Rats. Pharmacogn. Mag.. 2018;14(53):27-35.
- [Google Scholar]
- Protective effects of antioxidants on the experimental liver and kidney toxicity in mice. Eur. J. Gen. Med.. 2008;5(3):157-164.
- [Google Scholar]
- Theory and practice of histological techniques (4th ed.). New York: Churchill Livingstone; 1996.
- Castanea sativa Mill. flowers amongst the most powerful antioxidant matrices: A phytochemical approach in decoctions and infusions. BioMed. Res. Inter.. 2014;7:7.
- [Google Scholar]
- Cotran, R.S.S., Kumar, Vinay, Fausto, Nelson, Robbins, Stanley L., Abbas, Abul K. Robbins, Cotran pathologic basis of disease. St. Louis, MO: Elsevier Saunders, (2005).
- Antioxidant, antimicrobial, antiviral and antitumor activities of pyranone derivative obtained from Aspergillus candidus. J. Microbiol. Biotech. Res.. 2011;1:5-17.
- [Google Scholar]
- Flavonoid Glycosides from Byrsocarpus coccineus Leaves. Schum and Thonn (Connaraceae) Afr. J. Trad. CAM.. 2007;4(3):257-260.
- [Google Scholar]
- EVALUATION OF ACUTE TOXICITY AND ANTI-INFLAMMATORY EFFECTS OF BACCHAROIDES SCHIMPERI (DC.) IN EXPERIMENTAL ANIMALS. Afr J Tradit Complement Altern Med.. 2015;12(1):99-103.
- [Google Scholar]
- Genicunolide A, B and C: three new triterpenoids from Euphorbia geniculata. Beilstein J. Org. Chem.. 2015;11:2707-2712.
- [Google Scholar]
- Antioxidant activities, total phenolics and flavonoids content in 2 varieties of Malaysia young ginger (Zingiber officinale Roscoe) Molecules. 2010;15:4324-4333.
- [Google Scholar]
- Silymarin Protects Mouse Liver and Kidney from Thioacetamide Induced Toxicity by Scavenging Reactive Oxygen Species and Activating PI3K-Akt Pathway. Front. Pharmacol.. 2016;7:481.
- [Google Scholar]
- Phytochemical Methods (2nd Ed). London: Chapman and Hall; 1973.
- UPLC-PDA-ESI-MS/MS Analysis, Isolation of Chemical Constituents, Cytotoxic, Antioxidant, Antiviral and Antimicrobial Activities of the Aerial Parts of Lycium Shawii Roem & Schult. EJPMR. 2017;4(9):18-29.
- [Google Scholar]
- Flavonoid Compounds from the Leaves of Kalanchoe prolifera and Their Cytotoxic Activity against P-388 Murine Leukimia Cells. Nat. Product Sci.. 2017;23(2):139-145.
- [Google Scholar]
- Mass Spectrometry of Flavonoids. In: Harborne J.B., Mabry T.J., Mabry H. (eds) The Flavonoids. Boston, MA: Springer; 1975.
- [Google Scholar]
- The systematic Identification of Flavonoids. New York, Heidelberg, Berlin: Springer-Verlage; 1970.
- Junqueira's Basic Histology (14th ed.). Lange; 2016. p. :393.
- Phytochemical investigation and antimicrobial activity of Psidium guajava L. leaves. Pharm. Mag.. 2010;6(23):212-218.
- [Google Scholar]
- NMR spectral analysis of polyphenols from Punica granatum. Phytoch.. 1994;36:793-798.
- [Google Scholar]
- Nephroprotective effect of silymarin against diclofenac-induced renal damage and oxidative stress in male rats. J. Herbmed. Pharmacol.. 2019;8(2):146-152.
- [Google Scholar]
- Phenolic compounds and antimicrobial activity of olive (Olea europaea L. cv. Cobrancosa) leaves. Molecules. 2007;12:1153-1162.
- [Google Scholar]
- Antimicrobial activity and chemical composition of Pistacia chinensis Bunge leaves. Int. Food Res. J.. 2016;23(1):316-321.
- [Google Scholar]
- Study on Flavonoids and Triterpenoids Content of some Euphorbiaceae Pl. J. Life S.. 2011;5:100-107.
- [Google Scholar]
- Triterpenoids and Related Substances of Euphorbia paralias. Pharm. S.. 1974;29:529-531.
- [Google Scholar]
- Chromatographic and electrophortic techniques. London: Hierman; 1960.
- Characterization of Flavonols in Cranberry (Vaccinium macrocarpon) Powder. J. Agric. Food Chem.. 2004;52:188-195.
- [Google Scholar]
- Antibacterial phenolic compounds from the spines of Gleditsia sinensis Lam. Nat. Prod. Res.. 2007;21:283-291.
- [Google Scholar]


