

Translate this page into:
New method of identifying morphine in urine samples using nanoparticle-dendrimer-enzyme hybrid system
⁎Corresponding author at: Department of Chemical Engineering, North Tehran Branch, Islamic Azad University, PO Box 19585/936, Tehran, Iran. akbaresmaeili@yahoo.com (Akbar Esmaeili) a_esmaeili@iau-tnb.ac.ir (Akbar Esmaeili)
-
Received: ,
Accepted: ,
This article was originally published by Elsevier and was migrated to Scientific Scholar after the change of Publisher.
Peer review under responsibility of King Saud University.
Abstract
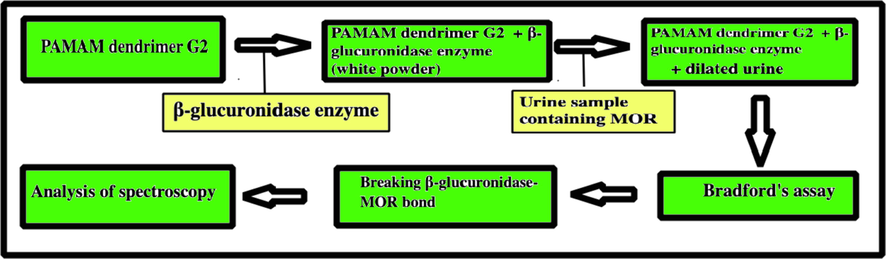
The incorporation of morphine (MOR) into the nanoparticle structure is a viable alternative to traditional enzyme usage. It has good biological potential to separate MOR from real urine samples. In this study, a new method of MOR identification in real urine samples was synthesized using the β-glucuronidase-dendrimer poly amidoamine (PAMAM) enzyme hybrid system. Replacing MOR in dendrimer cavities significantly reduces enzyme consumption. The replacement technique is done in dendrimer cavities in two stages as an alternative to β-glucuronidase enzyme and even MOR. In this paper, firstly, PAMAM dendrimer G2 was synthesized based on silica. The β-glucuronidase enzyme was replaced inside its dendrimer cavities and the compound was released into a real urine sample containing MOR. The enzyme was extracted from dendrimer cavities. The MOR- β-glucuronidase enzyme bond broke. In the next stage of the process, free MOR entered the PAMAM dendrimer G2 cavities. MOR was detected in real urine samples.
Keywords
Enzyme
Dendrimer
Morphine
Urine samples
Trap

1 Introduction
Polymers have certain advantages in terms of flexibility, high strength-to-weight ratio, availability, recyclability, and biomedicine (Dadashi and Esmaeili, 2021; Fereidouni Velasejerdi et al., 2021; Sohail et al., 2020). Dendrimer as a macromolecule which is characterized as having a branched three-dimensional structure, has adaptability and good surface performance features. The spherical structure of dendrimers, branching, and high molecular weight clearly make these desirable and unique nanocarriers ideal for medical applications such as tumor therapy, drug delivery, and gene transfer (Abdelghany et al., 2019; Baldissera et al., 2019; de Melo et al., 2019; Madhu et al., 2019; Subramanian et al., 2017). Dendrimer is a highly branched polymer with a monomeric unit, single-dispersed tree-like structure with molecular weights (Iqbal et al., 2019; Manikandan et al., 2018). PAMAM dendrimer, which is three-dimensional and branched, represents a new model of the functional group. The presence of high densities of oxygen and nitrogen enables the PAMAM dendrimer to bind to morphine (Cheng et al., 2019; Zhou et al., 2020). Dendrimers constitute a new class of polymers with branches that all originate from a single ring. Today, with the help of innovative drug delivery systems, including nano-carriers like nanocapsules, micelles, mesoporous nanoparticles, dendrimers, etc. (Serafín et al., 2021), diabetics’ insulin levels are kept constant at a certain level (Karacolak et al., 2021; Zou and He, 2021). MCM-41 is the most efficient member of Mesoporous materials and is given the generic name M41S (de Souza Magossi et al., 2021; Hormozi and Esmaeili, 2019).
We used the features of this material such as high specific surface area, surface suitable for functionalization with various functional groups and large voids (Siva et al., 2021), to load insulin into this structure. Esmaeili and Mousavi (Esmaeili and Mousavi, 2017) reported that the special behaviors of dendrimers have enabled them to be widely employed in biomedicine and other industries. MOR is a very powerful opioid and the most effective compound obtained from opium. The process of converting MOR to its metabolite state occurs in the liver, and this is known as the glucuronidation process (Gharibzahedi et al., 2012). Urine samples taken for drug testing include glucuronide and other opioids. To check for drug-assisted high-performance liquid chromatography (HPLC) with chromatography/mass spectroscopy (GC/MS), the glucuronide-drug bond must first be broken (Kececiler-Emir et al., 2021).
There are several ways to hydrolyze glucuronides. One is to utilize beta-glucuronidase enzyme. Oliveira et al. (Oliveira et al., 2021) reported a dendrimer system with a plant composition for trapping glucose encapsulated in silica nanoparticles. The results reveal that electrostatic changes in the silica-containing complex, including enzymes and dendrimers, cause a wide range of chemical and biological alterations. Song et al. (Song et al., 2014) examined the immobility of the enzyme β-glucuronidase-enzyme with the help of the enzyme lysozyme in the nanoparticles’ structure. They explained a new method for identifying MOR in a urine sample employing enzyme released from inside nanoparticle cavities. Polyamide bioamine binder and then enzyme replacement with MOR are provided within the nanoparticle cavities. Sologubov et al. (Sologubov et al., 2021) investigated protocols of analysis for a thermotical study of clenbuterol using the liquid chromatography method. The end product proved to be highly efficient and these authors concluded that the method was very advantageous. Amand and Esmaeili (Amand and Esmaeili, 2020) examined silica mesoporous for bone therapy as one aspect of cancer therapy. Nanoparticles were prepared for subsequent use on resistant cancers. In this study, the release conditions of the enzyme and method of trapping MOR in the nanoparticle structure were analyzed. MOR trapping was determined by measuring with ultraviolet–visible (UV–vis) spectroscopy (Varian Cary 100 Bio UV–vis, USA) absorption.
2 Materials and methods
2.1 Materials
TEOS and ethylene diamine were purchased from Merck Co., while β-glucosidase enzyme and lysozyme enzyme were sourced from Sigma Co. Other solvents such as methanol, deionized water, etc., were all provided by Merck Co.
2.2 Synthesis of PAMAM G2
2.2.1 Synthesis of PAMAM dendrimer G0.5
For the preparation of PAMAM G0.5, 7.37 mL of 3-amniopropyl triethoxy silane (APTES) and 100 mL of methanol were poured into a double-walled balloon and placed under N2 atmosphere. The sample was stirred and then 11.7 mL of methyl acrylate was added dropwise to the sample and stirred for 30 min. The solution was evaporated on a rotary shaker. At the end of this process a yellow viscous solution was obtained (Rajabi and Esmaeili, 2020).
2.2.2 Preparation of PAMAM dendrimer G1
85 mL of ethylene diamine and 100 mL of methanol were added into a double-walled balloon and placed under N2 atmosphere. 10 g of dendrimer G0.5 cell and 20 mL of methanol were added drop-by-drop for 30 min. The stirring process was continued for 72 h and then the solvent was evaporated with a rotary evaporator. Finally, a yellow viscous solution was produced.
2.2.3 Preparation of PAMAM dendrimer G1.5
13.5 mL of methyl acrylate and 20 mL of methanol were poured into a double-walled balloon and placed under N2 atmosphere. This was added to a mixture of 8 g of dendrimers G1. 20 mL of methanol was added drop-by-drop for 30 min and the stirring continued for 72 h. The solvent was evaporated using a rotary evaporator and eventually, a yellow viscous solution was obtained.
2.2.4 Preparation of PAMAM dendrimer G2
32.5 mL of ethylene diamine and 50 mL of methanol were poured into a double-walled balloon and placed under N2 atmosphere. A mixture of 3 g of dendrimer G1.5 and 10 mL of methanol was added drop-by-drop for 30 min and the stirring lasted for 96 h. The solvent was then evaporated with a rotary evaporator until a yellow viscous solution was obtained. The dendrimer G 0.5 and G1.5 were purified by silica gel column chromatography and G1 and G2 but did not require purification.
2.3 Replacement of β-glucuronidase in PAMAM dendrimer G2 with lysozyme enzyme
1 mL of Tris buffer (30 mmol L−1, pH = 7) was added to the 10 mg of lysozyme and 0.8 mg of β-glucuronidase. In this case, the concentration of lysozyme amounted to 10 mg mL−1 and the concentration of β-glucosidase was 0.8 mg mL−1. Adding lysozyme improved the functioning of the β-glucuronidase enzyme, but adding β-glucuronidase enzyme caused the MOR- β-glucuronidase enzyme bond to weaken (Song et al., 2014). To the above solution was added 2.5 mg of PAMAM dendrimer G2, which was synthesized in the previous stages, so that the concentration of dendrimer was 20 × 10−3. Following this, 7 mL of a pre-hydrolyzed solution of TEOS (diluted 40 times with deionized water) was added to this solution. Then it was incubated at room temperature for 24 h to obtain a white precipitate, and subsequently the solution was centrifuged at 3000 rpm for 5 min. The resulting precipitate was filtered off with a vacuum pump and washed three times with deionized water. Following this it was dried at room temperature.
2.4 Preparation of Tris for enzymatic environment
This phase was marked by dissolving 0.36 g of Tris salt in 50 mL of deionized water and the pH was adjusted to 7 with HCl (1 M). Then the solution was diluted to 100 mL.
2.5 Preparing a urine sample containing MOR
A urine sample was taken from a 38-year-old man with a history of daily consumption of opium syrup (1% opium or opium syrup, an herbal mixture derived from morphine and soluble in water and alcohol). This syrup is sold by the Faran Shimi Pharmaceutical Company and this substance has a concentration of 10 mg in a 250 mL bottle. It is used daily to reduce drug dependence and the prescribed dosage is 0.6 mL or 1 mL four times a day. The presence of MOR in this sample was confirmed by Thin layer chromatography (TLC). After examining the MOR urine strip, the urine sample was acid hydrolyzed and then extracted by the liquid-liquid extraction (LLE) method with the help of CHCl3 solvent: isopropanol (4: 1). After drying the organic phase with the help of a water bath, TLC was placed on a MN brand glass plate next to the opium standard and then the plate was washed with aqueous solvent. It was dried with the help of an acid iodoplatinate solution, spray plate and in this way the presence of morphine was confirmed. The urine sample was stored in a refrigerator at −4 °C until required for testing. For the experiment, a morphine-containing urine sample was diluted one thousand times with deionized water and the UV–vis uptake of free morphine was observed at 210 nm.
2.6 Release of β-glucuronidase enzyme from PAMAM dendrimer G2 to break the MOR - glucuronidase bond in a real urine sample
2 mL diluted urine sample was added to the 2 mg of enzyme trapped in dendrimer PAMAM dendrimer G2 generation. After dissolving, the sample was incubated for 24 h at 37 °C. UV–vis absorption of free MOR was observed at 210 nm.
2.7 Replacement of β-glucuronidase enzyme in the structure of PAMAM dendrimer G2
To the Tris buffer (1 mL) the following were added: HCl (pH 7, 30 mM L−1), lysosomes enzyme (10 mg) and 0.8 mg β-glucuronidase enzyme. After that, 7 mL of pre-hydrolyzed TEOS solution (40 times diluted with distilled water) was added. The mixture was incubated at room temperature until a white precipitate was formed. From the start of the reaction and for 4 h afterwards, a sample was taken from the reaction vessel every hour with a sampler. 100 μL of the sample was diluted 1:1 with Bradford solution and its absorbance was recorded at 595 nm.
2.8 Replacement of MOR in the structure of PAMAM dendrimer G2
Urine samples contained free MOR in PAMAM dendrimer G2. MOR was placed in dendrimer cavities at room temperature. Every 2 h, a sample was taken from the solution in the container with a sampler and its absorption was measured at 210 nm. Schematic 1 illustrates the preparation of PAMAM dendrimer for trapping MOR by enzyme.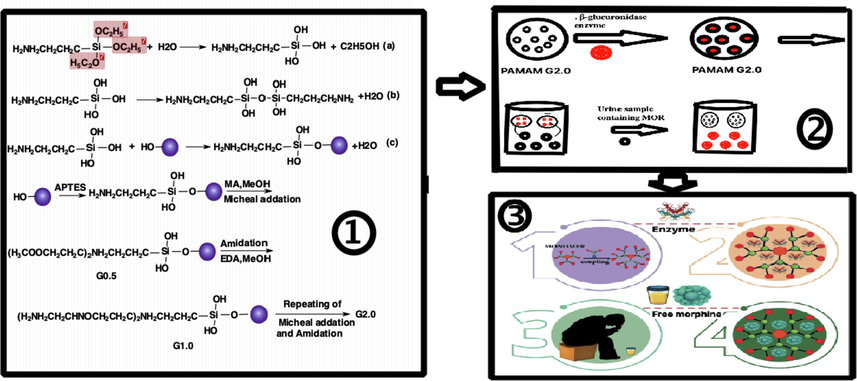
Schematic of synthesis of PAMAM dendrimer for trapping MOR by enzyme.
General procedure of synthesis of dendrimer for trapping MOR by β-glucuronidase.
2.9 Release of β-glucuronidase enzyme in the structure of PAMAM dendrimer G2
This study was conducted on a real urine sample containing MOR diluted with distilled water at a ratio of 1/1000. 2 mL of the sample and 2 mg of β-glucuronidase enzyme in the structure of PAMAM dendrimer G2 were added. Due to the complex and crowded matrix of urine, MOR peaks are not visible in real urine samples (UV–vis spectra). MOR absorption was observed when the urine was diluted 1/1000. There was no MOR in the water sample and therefore no absorption was evident. The measurement was done using a spectrophotometer with very high detection power, which was calibrated before it was put into operation. It has the advantage of being able to read low absorption values. The sample was incubated at 37 °C. From 0 to 4 h after the reaction every hour, a sample was taken from the reaction vessel with a sampler. 100 μL of the sample was diluted to a ratio of 1:1 with Bradford solution and its absorbance was recorded at 595 nm. This study was conducted on the urine sample of a 38-year-old man with a long history of heroin use but no history of any underlying disease. This person did have a history of quitting and restarting heroin use several times, and has for one month been using opium syrup. The daily dose is 2.5 mL.
3 Results and discussion
Establishing the exact amount of MOR in the urine sample is a task for the forensic laboratory. The limit of detection-free MOR urinary strips is 300 ng mL−1. Hawks and Chiang explained that in the urine sample, part of the morphine takes the form of β-glucuronidase MOR. Breaking the β-glucuronidase-MOR bond increases the concentration of free MOR, and as a result, smaller amounts of morphine can be detected and tracked. In this paper, after directing the β-glucuronidase enzyme into the pores of PAMAM dendrimer G2, this set was released inside a real urine sample containing β-glucuronidase-MOR and free MOR. The enzyme is released from the dendrimer cavities, the β-glucuronidase-MOR bond is broken, and finally the morphine is released. It is replaced inside the dendrimer cavities. Scheme 2 show general procedure of synthesis of dendrimer for trapping MOR by β-glucuronidase. Confirmation of the release and replacement of MOR was done using spectroscopy (Masoumi and Esmaeili, 2020).
3.1 Bradford's method for determining the amount of protein in a solution
Tris buffer is commonly used to extract proteins (Serafín et al., 2021). However, even a 0.1% sample has a significant effect on UV–vis absorbance compared to control samples (Rae and Jachimska, 2021). In this study, we demonstrated a new method for identifying morphine in urine samples using a nanoparticle-dendrimer-enzyme hybrid system for urine drop applications. Quantitative measurement of total protein value is of great importance in basic sciences and clinical research. Bradford's protein measurement is a colorimetric method, one which is used to measure the concentration of protein in solution. Bradford's law has an index for the values obtained by the variables. Important features are related to size and frequency and one recent approach chosen described the shape of Bradford-type curves (Rae and Jachimska, 2021). The Bradford assay is predominantly used in measuring clinical samples (Rae and Jachimska, 2021). Bradford's approach is based on the formation of a complex between the G-250 blue and proteins in the solution. During this phase there is a shift in maximum absorption from 465 nm to 595 nm. The formation of a complex between color and protein in an acidic solution leads to a change in color from red to blue.
Fig. 1A depicts the UV–vis of the standard of MOR and the urine containing free MOR. Fig. 1 depicts a decrease as shown in the UV–vis absorption diagram. UV–vis of Fig. 1A-E shows the standard of MOR, urine containing free MOR, urine with β-glucuronidase enzyme trapped in PAMAM dendrimer G2 (incubated for 24 h at 37 °C), urine consisting of β-glucuronidase enzyme trapped in PAMAM dendrimer G2 (incubated for 24 h at 24 °C), and urine that contains β-glucuronidase enzyme trapped in PAMAM dendrimer G2 (incubated for 48 h at 37 °C). Fig. 1B-E highlights a reduction in the UV–vis absorption, which suggests the replacement of MOR by the β-glucuronidase enzyme in the dendrimer cavities. Similar UV–vis spectra show that changes are observed for all the other systems. The peak of MOR at 210 nm remains unaltered while the reaction MOR with β-glucuronidase enzyme causes absorption intensity to decline at 210 nm, while a new peak at 220 nm appears (Fig. 1C–E). This peak is attributed to replacement of MOR by the β-glucuronidase enzyme (Esmaeili and Mousavi, 2017). In the 250 nm region, the connection between the donor groups and MOR reduces the peak. So over a long period of time this connection improves and the peak of this area is lost.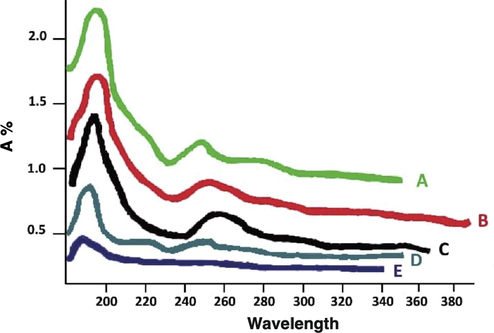
UV–vis of (A) standard of MOR; (B) Urine containing free MOR; (C) Urine with β-glucuronidase enzyme trapped in PAMAM dendrimer G2 (incubated for 24 hr at 37 °C); (D) Urine consisting of β-glucuronidase enzyme trapped in PAMAM dendrimer G2 (incubated for 24 hr at 24 °C); (E) Urine that contains β-glucuronidase enzyme trapped in PAMAM dendrimer G2 (incubated for 48 hr at 37 °C).
The measured absorption rate at 595 nm is proportional to the concentration of protein in the solution. The absorption rate in Bradford measurement varies depending on the individual reading to another. Bradford's method served to determine the amount of protein in the sample. As the standard concentration increases, the amount of absorbed by the microliter also increases at the same time.
The limit of detection (LOD) and the limit of quantification (LOQ) were calculated using Eqs. (1) and (2) which are written below:
Herein yB and sB denote the blank signal and standard deviations of the blank signal, respectively (Miller and Miller, 2018).
The LOD and LOQ values obtained were 0.027 and 0.073 mg mL−1, respectively.
The BSA calibration curve is shown in Table 1 (A-C) based on Table 2 data. The data are fed by linear regression whose line equation is y = 0.0277x + 0.056 and the value of R2 for the data is 0.8194. Y is equal to adsorption and x is the amount of protein in mg mL−1. From this equation and in a particular adsorption, the amount of protein can be calculated. The absorption values were recorded at 595 nm by spectrophotometer, and these values were, respectively, 0.059, 0.070, 0.065, 0.084, 0.089 and 0.09 μg mL−1. The values of protein concentration calculated using the curve line equation and the placement of these values instead of y were 0.108, 0.505, 0.394, 1.0108, 1.191 and 1.227 mg mL−1, respectively. Table 2 and Fig. 1 indicate that the average protein concentration employing this data amounts to 0.739 μg mL−1. Fig. 1 for MOR shows a maximum absorption of 289.0 nm (Amand and Esmaeili, 2020). The loaded nanoparticle has three peaks at 474, 333 and 235 nm (Esmaeili and Ghobadianpour, 2016). My own work makes a comparison to the source material.
A(factor/Level)
α-
−1
0
+1
+α
Enzyme(mg) X1
0.1
0.3
0.6
0.8
1.0
MOR concentration (ng Kg−1) X2
100
200
300
400
600
Time(hr) X3
0
12
24
36
Temperature (°C) X4
25
28
31
34
37
pH X5
4
5
6
7
8
B(Std)
Sum of Squares
df
Mean Square
F-Value
P-Value
X1
0.0094
1
0.0094
6.960
0.0132
X2
0.0267
1
0.0267
19.88
0.0001
X3
0.0215
1
0.0215
15.96
0.0004
X4
0.0016
1
0.0016
1.16
0.2913
X5
0.0016
1
0.0016
1.22
0.2791
X1X2
0.0087
1
0.0087
6.49
0.0164
X1X3
0.0101
1
0.0101
7.50
0.0104
X1X4
0.0017
1
0.0017
1.25
0.2729
X1X5
0.0017
1
0.0017
1.23
0.2770
X2X3
0.0189
1
0.0189
14.08
0.0008
X2X4
0.0011
1
0.0011
0.8374
0.3677
X2X5
0.0011
1
0.0011
0.8551
0.3627
X3X4
0.0018
1
0.0018
1.31
0.2610
X3X5
0.0017
1
0.0017
1.25
0.2729
X4X5
0.0012
1
0.0012
0.8911
0.3530
X12
0.0139
1
0.0139
10.32
0.0032
X22
0.0001
1
0.0001
0.1061
0.7469
X32
0.0263
1
0.0263
19.55
0.0001
X42
0.0010
1
0.0010
0.7429
0.3958
X52
0.0010
1
0.0010
0.7429
0.3958
C Source
Residual
0.0390
29
0.0013
Lack of Fit
0.0390
22
0.0018
Pure Error
0.0000
7
0.0000
R2
0.8328
Adj-R2
0.7175
Pred-R2
0.7735
No.
Standard volume (µL)
Dissimilation water volume (mL)
Concentration of protein (µl mL−1)
Absorption in 595 nm
1
2
998
2
0.059
2
4
996
4
0.070
3
6
994
6
0.065
4
8
992
8
0.084
5
10
990
10
0.089
6
14
986
14
0.090
3.2 Investigation of urinary pH and MOR concentration as a replacement of dendrimer cavities using SPSS analysis
Statistical analysis utilizing SPSS software was applied to determine the concentration of MOR and urine pH and their effects on the replacement of β-glucuronidase enzyme from PAMAM dendrimer cavities. The output data for the pH were obtained at 24 h according to MOR uptake and concentration. Zero assumption here is that pH changes in terms of adsorption affecting the MOR concentration. The dependent variable changes have been explained by the independent variables.
Table 3 shows the pH and concentration of MOR as established by ANOVA variance statistical analysis. The high F-value (2.423) in ANOVA data indicates that the deviation from the mean data occurred unexpectedly. In addition, the high value of the degree of significance (Sig.) actually reveals the value of p for the data. pH did change in terms of adsorption but does not have a significant effect on MOR concentration (rejection of the null hypothesis. High values of t are confirmed numerically in Table 4. The low standardized error rate confirms the accuracy of the data obtained. The hypothesis (null Hypothesis) for these calculations is that the MOR concentration does not diminish within 24 h. The value of the R2 was obtained 0.913 while the adjusted R2 value was 0.899 for these data. The values obtained confirm that the regression line was able to describe the data at 91.3%. The standard error value of 0.05885 is a good indication of the accuracy of the data that was generated. ANOVA data are summarized in Table 3. A high value of F = 52.419 represents that deviation from average data occurred unexpectedly. Data is more varied than average and furthermore a very small value of less than 0.05 for the degree of significance (Sig.) is the p-value for the data. It rejects the zero hypothesis so the existing model is reliable with 0.95% confidence and can describe the data. The coefficients (Table 4) confirm this fact with high values of t and a low level of importance. The low standardized error rate (Std. Error) confirms the accuracy of the data obtained. Unlike a previous study conducted in a pH environment, this present one comprised 3 environments and the results were different (Sakr et al., 2011).
Sum of squares
df
Mean square
F
Sig.a
1
2
1
2
1
2
1
2
1
2
Regression
Residual
Total0.000
0.000
0.0000.182
0.017
0.1991
3
41
5
90.000
0.0000.182
0.0032.423
52.419
0.01c
0.217
Model
Unstandardized coefficients
Standardized coefficients
t
Sig.
B
Std. Error
Beta
1
2
1
2
1
2
1
2
1
2
Constant
0.58
0.240
0.015
0.029
3.881
8.342
0.030
0.000
pH
−0.004
1.072
0.002
0.148
−0.668
0.955
−1.557
7.240
0.217
0.001
3.3 Fourier transform-infrared spectroscopy (FT-IR) spectra investigation of in PAMAM dendrimer G2
Michael addition is in organic chemistry one of the most widely used reactions to carbon-nitrogen bonding. Complete generations of PAMAM dendrimer G2 contain large amounts of amine 10 in the surface and amine 20 in the nucleus. The presence of these potent nucleophilic amines in the dendrimer can react with α-β unsaturated acrylate groups. Dendrimers can accurately control the size, shape, and placement of groups and they are suitable for many life sciences applications. Esmaeili and Mousavi (Esmaeili and Mousavi, 2017) have employed dendrimers to make the oral drug insulin, which is a silica nanoparticle coated with polymer amino acid dendrimer and replaced by chitosan medicine inside its cavities. FT-IR (Thermo Scientific Nicolet 8700, USA) data were consistent with the figures presented in this article. Fig. 2 and the spectrum of the FT-IR illustrate the depleted PAMAM dendrimer G2 of the synthesized. FT-IR spectra regarding PAMAM (Fig. 2A-a) dendrimer G0.5 (Fig. 2A-b), dendrimer G1 (Fig. 2A-c), dendrimer G1.5 (Fig. 2A-d) and dendrimer G2 are shown. As can be seen in Fig. 2A, the absorption at 1580 cm−1 is related to C⚌O (Esmaeili and Khodaei, 2018; Khodaei and Esmaeili, 2019).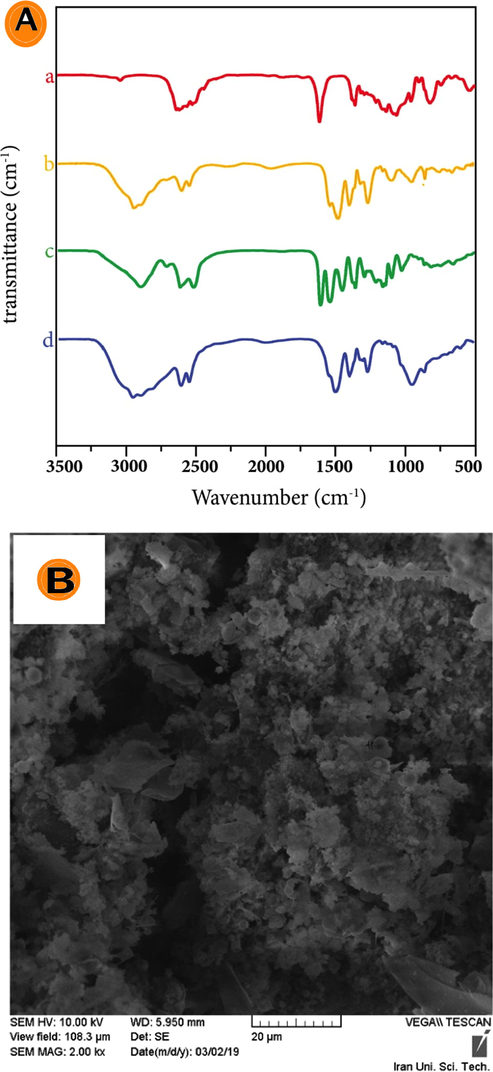
(A) FT-IR spectrum of PAMAM (a) dendrimer G0.5; (b) dendrimer G1; (c) dendrimer G1.5; (d) dendrimer G2; (B) SEM for β-glucuronidase enzyme trapped in PAMAM dendrimer G2.
The absorption peak at 1610 cm−1 in the FT-IR spectra of G0.5 and G2 shows ester terminated PAMAM dendrimers affirm the presence of —CO2CH3 groups. The absorption at 550 and 7500 cm−1 are assigned to the Si—O and O—Si—O vibration in the silica network, respectively. The observed peaks at 1100–1250 cm−1 show that Si—O—Si create the dominant peak. Stretching absorption for OH confirms the existence of the silanol and silanol water groups > 3000 cm−1 (Fig. 2A-a). Vibrations related to the OH group of water and silanol were observed at 3300 cm−1. Si—O absorption is in the 900 cm −1 range (Esmaeili and Mousavi, 2017). The absorption at 630 cm−1 is related to CH2 and CH3 bending vibration. The peak of 1220–1345 cm−1 is attributed to the C—N stretching vibration (Fig. 2A-b) while the bending of CH2 (vibration sweep) is related to 656 cm−1. C—N bonding is in the area of 1020 cm−1. The peaks at 1200 and 1230 cm−1 represent the stretching vibration of C—O (Fig. 2A-c). The bending vibration at 1442 cm−1 is linked to NH bending and the peak at 1545 cm−1 shows the C⚌O. The amide at 1600 cm−1 is related to C⚌O stretching vibration of ester in the region of 1610 cm−1 and has a strong absorption (Esmaeili and Rafiee, 2015) (Fig. 2A-d). Zhang et al. (Zhang et al., 2019) reported the absorption peak at 1655 cm−1 for the amide group.
The recent peak confirmed the existence of the amide group and what the literature says about it. Other factor groups were consistent with the factor groups reported in this paper. The peak that appears at 720 cm−1 is related to CH2 bending vibration sweep; the band in the range 1000–1350 cm−1 is linked to C—N stretching vibration. The strip of C—O stretching vibration can be seen in the 1000–1300 cm−1 range. Also evident were the swing bending vibration of warped CH2 band at 1257 cm−1, the CH2 scissors vibration at 1400 cm−1, and C⚌O stretching vibration of the ester group with a strong peak at 1735 cm−1. Moreover, symmetrical and asymmetrical CH2 stretching vibration peak can be seen at 2831 and 2954. These peaks are characteristic of the half generation polyamide amine (Esmaeili and Khoshnevisan, 2016). The absorption at 1330 cm−1 is related to the third type of amine. The absorptions at 3363 and 3281 cm−1 correspond to NH2 while the peaks at 1200 and 1161 cm−1 are related to the vibration of the first and third types of amine traction, respectively.
3.4 Scanning electron microscopy (SEM)
Establishing the morphology and size of nanoparticles containing β-glucuronidase enzyme from PAMAM dendrimer G2 was studied using SEM (model TESCAN, VEGA/XMU, Czech Republic). A drop of dendrimer-containing solution containing the synthesized enzyme was placed on a laboratory slide and dried. In vacuum conditions, the slide was coated with a layer of gold for further clarity and surface electron excretion and analyzed at a voltage of 20 kV. Fig. 2B shows the morphology of the SEM for β-glucuronidase enzyme trapped in PAMAM dendrimer G2. Miller et al. (Miller et al., 2006) explained that the amount of silica particles is directly related to the amount of enzyme. The results of this study show that the electrostatics of an enzyme silica complex and dendrimer have a wide range of chemical and biological activities to composite materials. Esmaeili and Khodaei (Esmaeili and Khodaei, 2018) investigated enzyme targeted magnetism for rifampin simultaneously. They showed that nanoparticles increased the amount of enzymes in the drug.
According to the histological study, drug injection can reduce damage done to the liver. Most NPs with a spherical morphology were dispersed on porous surfaces which is a benefit of higher absorption. The average nanoparticle size of MCM-41 for single dispersed particles is <100 nm. According to SEM information, the nanoparticles were spherical in shape but their surfaces were porous due to the presence of PAMAM dendrimer. In a study done on PAMAM dendrimers, the surface contained SEM micrograph enclosures within the structure of the PAMAM dendrimer (Cavalcanti et al., 2011). This supported our findings. Amand and Esmaeili (Amand and Esmaeili, 2020) analyzed the properties of NPs made from hybrid polymer containing anticoagulants. The morphology (average size of the spheres created) shows that the NCs produced were between 136 and 183 nm in diameter, the average being 176 nm. A comparison of current results with other research demonstrates that a plant extract is added to the NPs system and is not used in particles to recreate the force. Nugraheni et al. (2016) investigated PVA/CS/TiO2 NPs using the electrospinning method with a diameter of 112 nm.
3.5 Bradford protein assay
Protein quality was improved by adding 200 µL from Nadaford solution (1:4 diluted with ionized water) to 20 µL of dendrimer polyamide amine sample, which added to β-glucuronidase enzyme. The sample was subjected to room temperature for 10 min. The standard curve for different enzyme concentrations existed in the 0.2–1 µg mL−1 range. Enzymatic activity was initially observed in the prepared solution while the solution obtained from washing the dendrimer containing the enzyme was not observed. After the reaction lasting 24 h at 37 °C, the enzyme concentration of 0.0626 µg mL−1 was measured (Amand and Esmaeili, 2020).
3.6 Investigation of MOR replacement in PAMAM dendrimer G2
After diluting the actual urine sample by with ionized water, the UV–vis of the MOR uptake spectrum was obtained in the range of 200–380 nm. After the reaction and release of the enzyme from the dendrimer cavities in the urine sample, UV–vis spectra MOR was taken again. According to UV–vis spectra, MOR uptake increased at this stage and the urine sample was incubated at room temperature for 24 h. Following the replacement of free MOR within the dendrimer cavities of PAMAM dendrimer G2, a reduction was noticeable and finally, after 48 h of incubation at ambient temperature, the absorption of MOR reached zero.
Quality sample was reported to be good, Sd was suitable and a comparison-based recent study indicated high selectivity for the process. Ward et al. (Ward et al., 2013) evaluated the efficacy of the MOR formula with PAMAM dendrimer in vitro and in vivo. The release of MOR can play a useful part in a pharmaceutical strategy as part of the therapeutic process.
3.7 Investigating the effect of urine pH
Since the urine sample employed in this study had a normal pH = 6, it was adjusted using ammonia and diluted HCl in areas 4, 5, 7, and 8 to investigate its effect. The samples were then diluted to using deionized water. The preparation steps were completed according to the previous procedure and finally the protein concentration in urine samples containing β-glucuronidase enzyme trapped in PAMAM dendrimer G2 was measured using the Bradford method. As shown in Table 4, pH = 7 is the best pH for releasing MOR from the urine sample.
3.8 Optimizing the method and statistical study of the loaded enzyme using response surface methodology (RSM)
Optimization and a statistical study of the loaded enzyme using the RSM method is described here. The importance and impact of parallel parameters were evaluated. The accuracy of the experimental model and ANOVA results for the experimental parameters according to the Surface Methodology (RSM) model are documented in Table 1A. The high p-value in comparison with the F-value indicate the high response rate of the studied model. The higher the R2 value then the better the correlation model performed. The value of R2 obtained from this system is 0.8328. An acceptable result is a statistical response. According to ANOVA calculations and the model used in this quadratic test, the amount of P value is less than 0.05, which is very important for sample regression. The value of the correlation coefficient (R2) is 0.8328. The response level method of the quadratic equation shows well the relationships between the variables. The adjusted coefficient of determination (Adjusted R2) was 0.7175 and the regression line describes the data relatively well. The effective experimental variables are included in β-glucuronidase-enzyme (X1), MOR (X2), time (X3), temperature (X4), and pH (X5). After the experiments, ANOVA analysis was performed using quadratic and polynomial (Y) response model with Eqs. (1) and (2), respectively.
Eqs. (1) and (2) show the relationship between the variables defined in Table 1B. The Eq. (1) can be evaluated for the response for certain levels concerning each factor. By default, the low and high levels of factors are (+1 and −1). Comparing the coefficient of factors is useful for reorganizing the impact these factors make. ANOVA method for 3D surface is the statistical process required to measure MOR in this project (Fig. 3A). Furthermore, the ANOVA method helped to investigate the coefficient of different models, and the relationship between MOR and temperature as illustrated in Fig. 3B. Also, the relationship of MOR with time is presented in Fig. 3C. It shows a diminishment in time compared to temperature when all other factors are constant. The coefficient of RSM is expected to change per unit according to each factor’s value.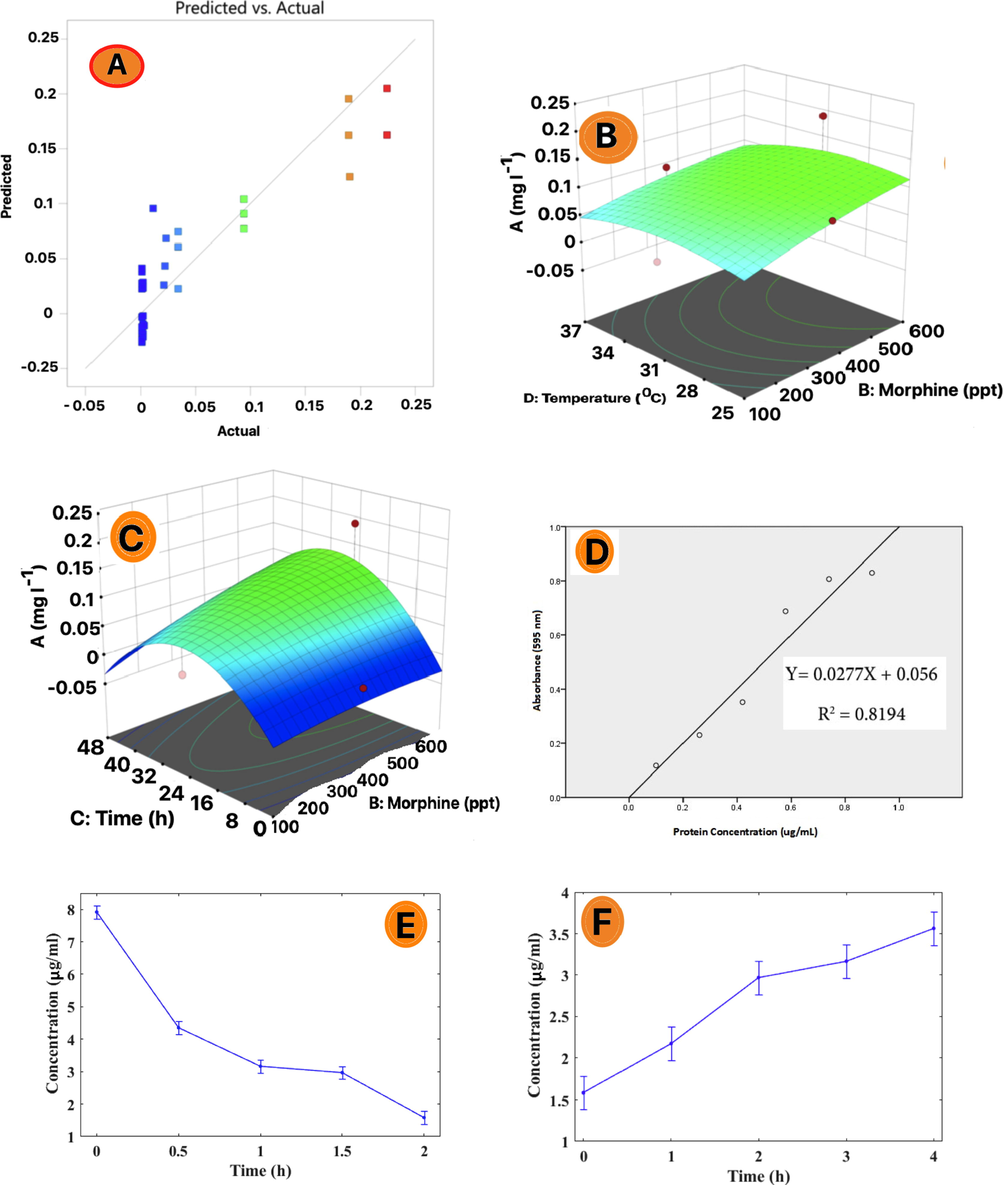
(A) Based distribution of RSM trapped β-glucuronidase enzyme trapped in PAMAM dendrimer G2; (B) ANOVA comparison of different standard concentrations of MOR with temperature changes in real urine samples; (C) ANOVA comparison of different standard concentrations of MOR with times changes in real urine samples; (D) BRAD FORD trapped β-glucuronidase enzyme trapped in PAMAM dendrimer G2; (E) Diagram BRAD FORD of loading trapped β-glucuronidase enzyme trapped in PAMAM dendrimer G2; (F) Diagram BRAD FORD of relaese trapped β-glucuronidase enzyme trapped in PAMAM dendrimer G2; (G) Diagram of UV–Vis uptake of free MOR in real urine samples after exposure to the released β-glucuronidase enzyme;
The coefficients are adjustments around that average based on the factor settings. When the factors are orthogonal the VIFs are (1); VIFs greater than (1) indicate multicollinearity. Hence, with higher VIF the correlation of factors will be more severe. As a general rule of thumb, VIFs less than 10 are tolerable. In this study, a change was noted in the percentage of polymers. In addition, the nanoparticles were exposed to nitrogen plasma under varying conditions of power and time. The most appropriate concentration of polymers for nanoparticles was obtained from 6% solution of polymers in formic acid. With reference to the p-value, a higher F-value means that the response level model is highly significant (Esmaeili and Singh, 2017). Positive values suggest a positive effect on enzyme release while negative values indicate the opposite effect on the enzyme release process.
The experiment design was based on the finding of ideal conditions and the results of the experimental variables included time, amount of nanoparticles and concentration of the drug (Tadayon et al., 2015). These equations prove there is a direct relationship between plasma and scaffold conditions. The experiment set out to discover the best conditions while the results of the experimental variables included time, amount of nanoparticles and concentration of vancomycin (Tadayon et al., 2016).
3.9 Loading of MOR in PAMAM dendrimer G2
The standard MOR sulfate powder is used in aqueous base. The solutions contained free MOR at 100, 200, 300, 400, 500, and 600 µg L−1 and then the solutions were diluted to . The above solutions of β-glucuronidase enzyme trapped in PAMAM dendrimer G2 were added. Fig. 3D shows Bradford trapped β-glucuronidase enzyme in PAMAM dendrimer G2. Afterward, the sample was incubated for 24 h at 37 °C and then incubated for 48 h at room temperature. Fig. 3E indicates the synthesis and replacement of β-glucuronidase enzyme trapped in PAMAM dendrimer G2 cavities. According to the Bradford method, it is observed that over time the amount of β-glucuronidase enzyme in the environment shrinks and replaced in PAMAM dendrimer G2 cavities. MOR uptake was measured with a conventional spectrophotometer, while the Bradford method serves to measure enzyme concentrations at 595 nm. Wei et al. (Wei et al., 2021) explained that the enzyme was replaced in the dendrimer cavities containing silica particles. In the current study, free morphine was replaced by β-glucuronidase enzyme in the PAMAM dendrimer G2 cavities containing silica particles. After 48 h, the concentration of free morphine in the real urinary tract shrank. Montalbo R, Marquez (Montalbo and Marquez, 2017) used the UV–vis test which compared white cell viability. 79% of the drug was released in the first 12 h.
3.10 Release and replacement of β-glucuronidase enzyme from PAMAM dendrimer G2
Fig. 3F and 3G show the replacement and release of β-glucuronidase enzyme and MOR investigated for PAMAM dendrimer G2. In Fig. 3F, the real urine sample contains MOR and diluted at a ratio of 1/1000. Over time, the β-glucuronidase enzyme escapes from the PAMAM dendrimer G2 cavities and breaks the MOR- β-glucuronidase enzyme bond in real urine. As the β-glucuronidase enzyme is released from the PAMAM dendrimer G2 cavities (Fig. 3F), the concentration of the β-glucuronidase enzyme in the real urine environment increases over time. The UV–vis absorption of free MOR after effect of the β-glucuronidase enzyme is shown in Fig. 3G. So, it breaks the MOR- β-glucuronidase enzyme bond. Free uptake of MOR wanes over time and this indicates the replacement of MOR in the PAMAM dendrimer G2 cavities.
The Bradford method of the supernatant in the first and second cases shows that its enzymatic activity diminishes over time. The enzyme in solution is replaced over time in the dendrimer cavities. The second stage was determined after replacing the enzyme inside the polyamide dendrimer cavities and the PAMAM dendrimer G2 in real and diluted urine samples containing MOR, under the influence of 37 °C. The enzyme was released from the dendrimer cavities over time and in this way, it entered the urine system. In the final stage, after the effect of the enzyme released from the dendrimer cavities, the MOR- β-glucuronidase enzyme bond was broken.
Subsequently, the free MOR concentration increased and the released MOR was then replaced inside the dendrimer cavities. The decline in UV–vis absorption of free MOR in the solution confirms this scenario. Esmaeili and Mousavi (Esmaeili and Mousavi, 2017) explained that the best release rate is closely linked to pH 7.4. In other studies, the maximum amount of drug release is 300 min after the start of the release process but drug release of the synthesized structure in our research is more controlled. This is due to loading the drug in a multiple layer structure that prevents rapid degradation (Sahu, 2013). In other research the maximum amount of the drug release is 300 min after the release process commences but drug release of synthesis structure in this study is more controlled. This is due to loading the drug in the multiple layer structure which prevents the rapid degradation (Sahu, 2013).
4 Conclusion
Drug users trying to hide their addiction, while identifying MOR in the courts and in examination of their cases is very important. MOR detection techniques include various screening and confirmation methods such as GC–MS, TLC, etc. It is generally an expensive verification technique. In this study, a new method for detecting MOR in urine samples using a nanoparticle, dendrimer, and enzyme hybrid system was designed. A very small urine sample requires very little β-glucuronidase enzyme. The pH range was examined in the 4–8 range and it emerged that the best pH level was 7. Enzyme concentration changes were investigated with different volumes of the enzyme being selected, and the best amount of enzyme was 0.8 g based on Bradford results. It was shown that 0.6 mg of enzyme can be loaded in dendrimer cavities of 0.104 μg mL−1. On the other hand, for the first time the replacement and exchange of β-glucuronidase enzyme with MOR in dendrimer cavities was proposed here, and it can be used in future research to design identification techniques.
5 Consent for publication
Not applicable.
Funding
This study was not funded by X.
Ethical approval
The project has not any animal test.
Declaration of Competing Interest
The authors declare that they have no known competing financial interests or personal relationships that could have appeared to influence the work reported in this paper.
References
- Synthesis and structural-biological correlation of PVC\PVAc polymer blends. J. Mate. Res. Tech.. 2019;8:3908-3916.
- [Google Scholar]
- Investigating the properties of electrospun nanofibers made of hybride polymer containing anticoagulant drugs. Carbohyd. Poly.. 2020;228:115397
- [Google Scholar]
- Polymeric organic coatings based on PANI-ES and PANI-ES/APP for fire protection. J. Mat. Res. Tech.. 2019;8:2832-2845.
- [Google Scholar]
- Non-thermal stabilization mechanisms of anthocyanins in model and food systems—An overview. Food Res. Int.. 2011;44:499-509.
- [Google Scholar]
- Thiol–yne click synthesis of polyamide–amine dendritic magnetic halloysite nanotubes for the efficient removal of Pb (II). ACS Sust. Chem. Eng.. 2019;8:771-781.
- [Google Scholar]
- Optimization, in-vitro release and in-vivo evaluation of bismuth-hyaluronic acid-melittin-chitosan modified with oleic acid nanoparticles computed imaging-guided radiotherapy of cancer tumor in eye cells. Mat. Sci. Eng.: B. 2021;270:115197
- [Google Scholar]
- Study of the reuse potential of the sisal fibers powder as a particulate material in polymer composites. J. Mat. Res. Tech.. 2019;8:4019-4025.
- [Google Scholar]
- Inorganofunctionalization of Ti (IV) and Zr (IV) on the MCM-41 Surface and its Interaction with a Mixed Valence Complex to use as Isoniazid Sensing. J. Inorg. Organomet. Poly. Mat. 2021:1-10.
- [Google Scholar]
- Vancomycin loaded superparamagnetic MnFe2O4 nanoparticles coated with PEGylated chitosan to enhance antibacterial activity. Int. J. Pharm.. 2016;501:326-330.
- [Google Scholar]
- Encapsulation of rifampin in a polymeric layer-by-layer structure for drug delivery. J. Biomed. Mat. Res. Part A. 2018;106:905-913.
- [Google Scholar]
- Optimization of process parameters for removal of heavy metals by biomass of Cu and Co-doped alginate-coated chitosan nanoparticles. Biores. Tech.. 2016;218:650-658.
- [Google Scholar]
- Synthesis of a novel structure for the oral delivery of insulin and the study of its effect on diabetic rats. Life Sci.. 2017;186:43-49.
- [Google Scholar]
- Preparation and biological activity of nanocapsulated Glycyrrhiza glabra L. var. glabra. Flavour and fragrance journal. 2015;30:113-119.
- [Google Scholar]
- Optimization of in vitro release of an anticonvulsant using nanocapsule-based thermogels. Eur. J. Pharm. Sci.. 2017;99:9-16.
- [Google Scholar]
- Investigation of enzymes and solvents in the production process of 6-ammonium penicillanic acid (6-APA) in industry to reduce costs and improve production conditions. Biop. Biosys. Eng.. 2021;44:2481-2489.
- [Google Scholar]
- Optimization and characterization of walnut beverage emulsions in relation to their composition and structure. Int. J. Biol. Macromol.. 2012;50:376-384.
- [Google Scholar]
- Synthesis and correction of albumin magnetic nanoparticles with organic compounds for absorbing and releasing doxorubicin hydrochloride. Coll. Surf. B: Biointerf.. 2019;182:110368
- [Google Scholar]
- Bioassays based on higher plants as excellent dosimeters for ecotoxicity monitoring: a review. Chem. Int.. 2019;5:1-80.
- [Google Scholar]
- Luminescent core–shell Ca2MoO5: Eu3+-MCM-41 structure for sustained drug release. Mat. Today Chem.. 2021;22:100581
- [Google Scholar]
- Synthesis of Resveratrol Loaded Hybrid Silica-PAMAM Dendrimer Nanoparticles With Emphases on Inducible Nitric Oxide Synthase and Cytotoxicity. Plant Foods Hum. Nut. 2021:1-7.
- [Google Scholar]
- New and Enzymatic Targeted Magnetic Macromolecular Nanodrug System Which Delivers Methadone and Rifampin Simultaneously. ACS Biomat. Sci. Engi.. 2019;6:246-255.
- [Google Scholar]
- Characterization of cellulosic fibre from Phoenix pusilla leaves as potential reinforcement for polymeric composites. J. Mat. Res. Tech.. 2019;8:2597-2604.
- [Google Scholar]
- Morphological, thermal, and blood-compatible properties of electrospun nanocomposites for tissue engineering application. Poly. Composit.. 2018;39:E132-E139.
- [Google Scholar]
- New method of creating hybrid of buprenorphine loaded rifampin/polyethylene glycol/alginate nanoparticles. Int. J. Biol. Macromol.. 2020;159:204-212.
- [Google Scholar]
- Rapid and efficient enzyme encapsulation in a dendrimer silica nanocomposite. Macromol. Biosci.. 2006;6:839-845.
- [Google Scholar]
- Polyaniline–Carrageenan-polyvinyl alcohol composite material synthesized via interfacial polymerization, its morphological characteristics and enhanced solubility in water. In: IOP Conference Series: Mat. Sci. Eng.. IOP Publishing; 2017.
- [Google Scholar]
- Study of thermal degradation of PVA/Chitosan/Gelatin electrospun nanofibers. AIP Conference Proceedings. AIP Publishing LLC 2016150017
- [Google Scholar]
- Modulation of inflammation by anti-TNF α mAb-dendrimer nanoparticles loaded in tyramine-modified gellan gum hydrogels in a cartilage-on-a-chip model. J. Mat. Chem. B. 2021;9:4211-4218.
- [Google Scholar]
- Analysis of dendrimer-protein interactions and their implications on potential applications of dendrimers in nanomedicine. Nanoscale. 2021;13:2703-2713.
- [Google Scholar]
- Preparation of three-phase nanocomposite antimicrobial scaffold BCP/Gelatin/45S5 glass with drug vancomycin and BMP-2 loading for bone regeneration. Coll. Surf. A: Physico. Eng. Asp.. 2020;606:125508
- [Google Scholar]
- Development and evaluation of insulin incorporated nanoparticles for oral administration. Int. Schol. Res. Not. 2013
- [Google Scholar]
- Effect of Kollidon® SR on the release of Albuterol Sulphate from matrix tablets. Saudi Pharm. J.. 2011;19:19-27.
- [Google Scholar]
- Disposable immunoplatforms for the simultaneous determination of biomarkers for neurodegenerative disorders using poly (amidoamine) dendrimer/gold nanoparticle nanocomposite. Anal. Bioanaly. Chem.. 2021;413:799-811.
- [Google Scholar]
- Dendrimer like mesoporous silica nano container (DMSN) based smart self healing coating for corrosion protection performance. Prog. Org. Coat.. 2021;154:106201
- [Google Scholar]
- Polyamidoamine (PAMAM) dendrimers synthesis, characterization and adsorptive removal of nickel ions from aqueous solution. J. Mat. Res. Tech.. 2020;9:498-506.
- [Google Scholar]
- Thermodynamic investigation of G2 and G4 siloxane dendrimers with trimethylsilyl terminal groups. J. Chem. Therm.. 2021;153:106318
- [Google Scholar]
- Immobilization of β-glucuronidase in lysozyme-induced biosilica particles to improve its stability. Front. Chem. Sci. Eng.. 2014;8:353-361.
- [Google Scholar]
- An insight into the putative role of victuals like honey and its polyphenols in breast cancer. Cur. Sci. 2017:1839-1854.
- [Google Scholar]
- Delivery of tissue plasminogen activator and streptokinase magnetic nanoparticles to target vascular diseases. Int. J. Pharm.. 2015;495:428-438.
- [Google Scholar]
- Targeted thrombolysis of tissue plasminogen activator and streptokinase with extracellular biosynthesis nanoparticles using optimized Streptococcus equi supernatant. Int. J. Pharm.. 2016;501:300-310.
- [Google Scholar]
- Sustained analgesia achieved through esterase-activated morphine prodrugs complexed with PAMAM dendrimer. Pharm. Res.. 2013;30:247-256.
- [Google Scholar]
- Highly Selective Entrapment of His-Tagged Enzymes on Superparamagnetic Zirconium-Based MOFs with Robust Renewability to Enhance pH and Thermal Stability. ACS Biomat. Sci. Eng.. 2021;7:3727-3736.
- [Google Scholar]
- Fabrication of Curcumin-Modified TiO2 Nanoarrays via Cyclodextrin Based Polymer Functional Coatings for Osteosarcoma Therapy. Adv. Health. Mat.. 2019;8:1901031.
- [Google Scholar]
- Fabrication of Schiff base decorated PAMAM dendrimer/magnetic Fe3O4 for selective removal of aqueous Hg (II) Chem. Eng. J.. 2020;398:125651
- [Google Scholar]
- Synthesis of a Hierarchically Branched Dendritic Polymer Possessing Multiple Dendrons on a Dendrimer-like Backbone. Macromol.. 2021;54:8143-8153.
- [Google Scholar]


