

Translate this page into:
Ni-doped ZnO nanoparticles derived by the sol–gel method: structural, optical, and magnetic characteristics
-
Received: ,
Accepted: ,
This article was originally published by Elsevier and was migrated to Scientific Scholar after the change of Publisher.
Abstract
A simple sol–gel route was used for preparation of Ni doped ZnO nanoparticles (Ni:ZnO) with 0, 3, 5, 7 and 9 wt% of Ni to Zn precursor salts. Structural, optical and room temperature magnetic properties were studied. The prevailing structural arrangement that observed in all the examined samples is the wurtzite structure of ZnO. Nevertheless. The orderly development of NiO rock-salt phase on at the surfaces of ZnO nanoparticles upon Ni doping is confirmed by Rietveld refinements. The ZnO wurtzite structure is dominant in all the samples as confirmed by both XRD and Raman results. The average crystallite size showed almost no change upon Ni doping. RTFM behavior is being exhibited for all Ni:ZnO nanoparticles that is demonstrating using of ZnO as the host structure allowed for the efficient formation of DMS. The Near-infrared solar reflectance ( ) and the visible solar reflectance ( ) values reduced with increasing of the Ni content as a result of the rising in density of trap states upon Ni doping of the samples. Kubelka-Munk method was used to determine the energy band gap (Eg) and band Urbach energy (EU) tails from diffused reflectance (DRS) results. The obtained energy gap values were very close in all studied samples with an average value of energy gap is 3.164 eV. The EU values raise from 123 to 173 meV upon increasing of Ni content in the samples in agreement with lower values of and and their effect on optical performance of the investigated samples in applications.
Keywords
Nickel-zinc oxide nanoparticles
Sol-gel route
Diffused reflectance spectroscopy (DRS)
Raman spectroscopy
Urbach energy
Kubelka-Munk (K-M)

1 Introduction
The diluted magnetic semiconductor (DMS) materials have showed a lot of considerable attentions recently owing to their potential applications in spin-optical switching, sensor, photocatalytic and spintronics devices such as spin diodes, spin-transistor, quantum computers (Pascariu et al., 2018; Ali et al., 2019); and near-infrared light emitting diodes (Elhamdi et al., 2022). As a matter of progress, the importance of DMS materials is coming from their inclusion of both semiconducting and magnetic properties which allowed their excellent electronic applications. DMS materials obtained by doping of semiconducting nanomaterials such as ZnO and TiO2 with the transition metals (TM) such as Ni, Co, and Fe with controlled additions (Pascariu et al., 2018; Ali et al., 2019; Elhamdi et al., 2022; Alhashem et al., 2021). DMS are specified by their strong electrons coupling in the conduction band of the magnetic ions and those in the valence band of the host semiconductor. Such coupling permits the influence of the magnetic ions on the magnetic field on the host semiconductor (Elhamdi et al., 2022).
Doping of ZnO with nickel (Ni) element is of more interest. Hence, both Ni and Zn have similar oxidation state that makes it easy in their replacements without variations in the ZnO structure. The incorporation Ni2+ ions allow varsities of applications for ZnO (Farha et al., 2020; Rauwel et al., 2016; Mihalache et al., 2019). In addition, Ni is losing its metallic nature very slowly that makes it a good conductor to heat and electricity (Ali et al., 2020). For instance, there are reports of many contradictory trends of a specific property as a result of the differences between the used synthesis methods (Farha et al., 2020).
In this work, a simple sol–gel route of synthesizing Ni-doped ZnO nanoparticles with 0, 3, 5, 7 and 9 wt% Ni doping was used. The formation of Ni doped ZnO nanoparticles in the current work was done via the sol–gel route by using the nickel acetates precursor instead of the nickel nitrates precursor as in other works e.g. (Elhamdi et al., 2022). It is worth to mention that, using of such weak acids (acetate) is resulting in a smaller number of nucleation sites which are the key factors to obtain DMS nanoparticles with a single phase structure and small particle size (Bindu and Thomas, 2014). The chosen of Ni for doping in this range is owing to the expected induced magnetic, structure and optical variations that are based on previously reported results (Farha et al., 2020; Dar et al., 2014; Fabbiyola et al., 2017). For instance, a shift in the optical band gap was observed for Ni:ZnO nanoparticles that were prepared by other works. Both red shift (Dar et al., 2014) and blue shift (Farha et al., 2020) in the optical band gap or even both of them (Fabbiyola et al., 2017) were reported upon Ni doping into ZnO in similar range. Such diversity may be due to the type of used preparation method and/or their specific preparation conditions in each method and also after preparation treatments if so.
In the current investigation, Ni-doped ZnO samples with Ni doping of 0, 3, 5, 7 and 9 wt% were prepared. The effect of Ni addition on the morphological, structural, optical and magnetic behavior of the samples was investigated. The structural of the samples was explored by using both X-ray diffraction (XRD), and Fourier transform infrared (FTIR) measurement. The morphology of the synthesized Ni:ZnO nanoparticles was examined using the field-emission scanning electron microscope (FE-SEM). The UV–VIS-NIR diffused reflectance spectroscopy (DRS) and the vibrating sample magnetometer (VSM) measurements were done to investigate both the optical and magnetic behaviors of the samples, respectively.
2 Materials and methods
2.1 Synthetization
Ni doped ZnO nanoparticles have been synthesized using a simple sol–gel method. The chemical reagents that were used in the synthesizing are including: zinc acetate-dihydrate [Zn(CH3COO)2·H2O Winlab, purity: 99.999 %], nickel acetate tetrahydrate [Ni(OCOCH3)2·4H2O, Sigma Aldrich, 99.995 %], isopropyl alcohol [ACS Grade, ≥ 99.5 %, LabChem™] and diethanolamine (DEA), [HN(CH2CH2OH)2, Thermo Scientific Chemicals, 99 %]. Isopropanol alcohol was utilized as a solvent and DEA was employed as a stabilizer. The molar ratio between DEA and Zn(CH3COO)2·2H2O was kept at 3:1. An undoped ZnO powder was created by dissolving zinc acetate dihydrate in 75 mL of isopropanol with a concentration of 0.4 M and stirring at 60 °C for 1 h. For the synthesis of Ni-doped ZnO samples, nickel acetate was dissolved in isopropanol at 60 °C for 10 min with stirring, followed by the addition of Zn(CH3COO)2·2H2O to the solution. The molar ratios of nickel salt to zinc salt ranged from 0 % to 9 %. The DEA was introduced into the solution and stirred for a further hour to produce a clear and uniform solution. The molar ratio of DEA to zinc acetate dihydrate was maintained at 3:1 for all the prepared samples. The gel was heated under reflux conditions at 140 °C for 1 h and thereafter subjected to calcination at 600 °C for 6 h to produce the nanocrystalline powder. The Ni-doped ZnO samples are denoted as NZ-0, NZ-3, NZ-5, NZ-7, and NZ-9, representing the different molarity concentrations of Ni acetate and zinc acetate-dihydrate used: 0 %, 3 %, 5 %, 7 %, and 9 %, respectively. Fig. 1 shows a schematic diagram of the synthesis stages for Ni:ZnO nanoparticles.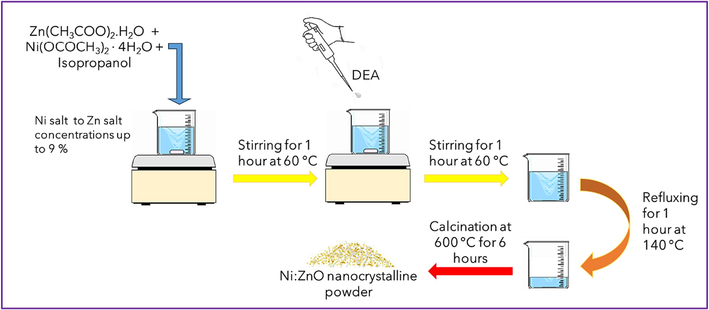
The schematic diagram of the synthetization steps for Ni:ZnO nanoparticles.
2.2 Characterizations
The crystal structure of the manufactured Ni-doped ZnO samples was investigated using X-ray diffraction (XRD). A CuK radiation source (λ = 1.5406 Å) was employed in the XR-Phillips X'pert (MPD 3040) diffractometer to conduct XRD measurements. The XRD patterns diffracted were acquired over the 2θ range of 20 − 80° with a step size of 0.03°. The Rietveld refinements of XRD data were obtained using FullProf suite software. The JASCO FT/IR-4100 spectrometer, was used for the FTIR measurements. The FTIR transmission spectra for the under investigation samples were captured in the wavenumbers range between 400 and 4000 cm−1. The field-emission gun, environmental scanning electron microscope (FEG-ESEM, ThermoFisher Quanta S), was used to check the morphology of the synthesized Ni-doped ZnO samples. The Miro- Raman spectra of the samples were obtained by using a Raman microscope (Horiba spectrometer, Labram HR Evolution) that equipped with a He-Ne laser excitation source (633 nm).
The diffuse reflectance spectroscopy (DRS) was performed using an integrating sphere attachment to the JASCO spectrophotometer (UV/Vis/NIR V570). The diffuse reflectance measurements were done over in the spectral range of 200 to 2500 nm with a 1 nm increments. A Lake Shore 7400 vibrating sample magnetometer (VSM) instrument was used to acquire the room temperature magnetic measurements. The external applied magnetic field was in a range from −5 kOe to 5 kOe.
3 Results and discussion
3.1 Structure characterization of Ni doped ZnO nanoparticles
Fig. 2 shows the X-ray diffraction patterns of the undoped, Fig. 2 (a) and Ni-doped ZnO, Fig. 2 (b - e) samples, with Rietveld refinement calculations. A very good refinements were obtained for all the samples according to the values of chi square factor as listed in Table 1. The Rietveld refinements confirmed that all the samples contain the ZnO wurtzite structure as a main structure which is in an agreement with the standard data of the wurtzite ZnO. In addition, all the samples showed a higher intensity in the (1 0 1) orientation comparing to all the other directions. The formation of a NiO phase upon the surface of ZnO nanoparticles is also confirmed in doped samples as shown in Fig. 2 (b - e). The NiO phase is according standard data of face-centered cubic (FCC) rock-salt structure the (JCPDS, card # 04–0835). The intensity NiO peaks are increasing with increasing of the Ni content in the samples which is reflecting the orderly development of the NiO phase. On the other hand, the ZnO wurtzite structure is still dominant in all the samples which is indicating the formation of NiO secondary phase is only at the surfaces of the nanoparticles (Farha et al., 2020). Since Ni ions are unstable oxides and have tendency to form Ni-rich oxides on the surface of the metal-oxide matrix as well as the mismatch between the ionic radii of Ni (0.69 Å) and Zn (0.74 Å) ions (Farha et al., 2020; Jlassi et al., 2014).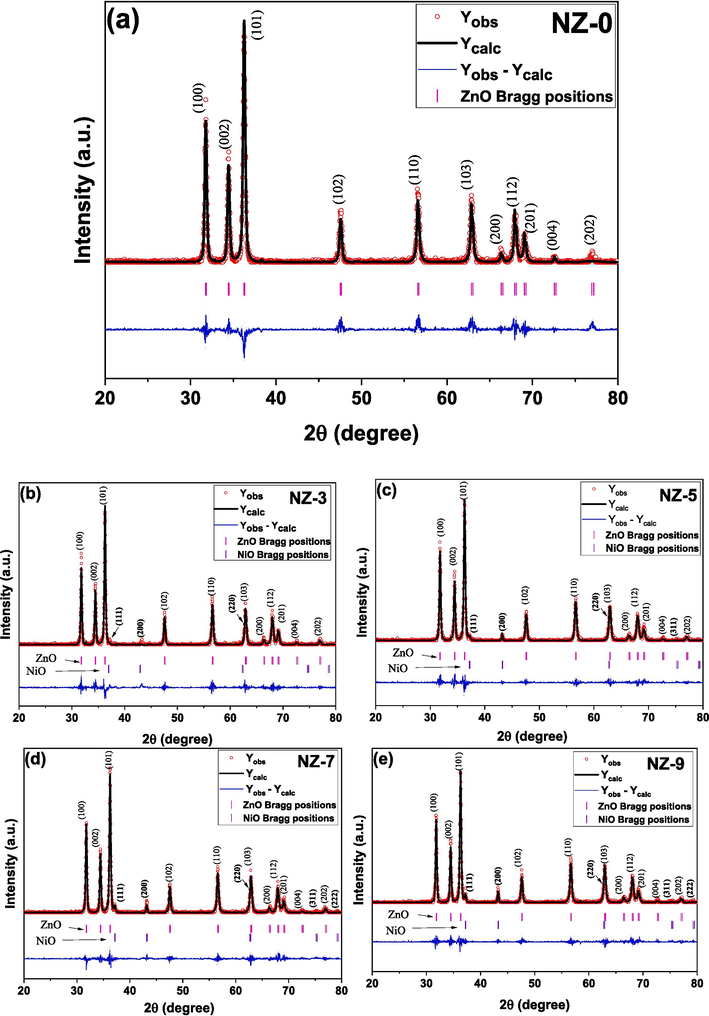
XRD patterns for the investigated Ni-doped ZnO nanoparticles (a) NZ-0, (b) NZ-3, (c) NZ-5, (d) NZ-7, and (e) NZ-9.
Sample
D, nm
ZnO wurtzite phase, %
NiO rock-salt phase, %
Strain, (ε)
a, Å
c, Å
cell volume, Å3
Chi2 factor
NZ-0
24.7
100.0(1.2)
0.0
−0.0009
3.2514
5.2073
47.674(0.004)
0.7523
NZ-3
39.6
98.4(3.5)
1.6(0.3)
0.0004
3.2505
5.2066
47.641(0.004)
0.6982
NZ-5
47.8
87.1(1.5)
12.9(1.0)
0.0015
3.2487
5.2044
47.568(0.004)
0.8981
NZ-7
40.7
92.6(2.1)
7.4(0.9)
0.0009
3.2514
5.2081
47.681(0.004)
0.774
NZ-9
35.5
91.4(2.5)
8.6(1.2)
0.0007
3.2480
5.2029
47.535(0.004)
0.652
The average crystallites size, D, was calculated based on the Williamson–Hall equation, , where, is the Bragg diffraction angle, λ is wavelength of used X-ray source (1.5406 Å), β is the FWHM of the selected XRD peaks and ε is the strain in the samples (Mazher et al., 2004; Farha et al., 2023; Mote et al., 2012). The average crystallite size, which was determined using the NiO peak (2 0 0) at 43 nm, was constant across all samples.
The average crystallites size, D, for Ni doped ZnO nanoparticles that are based on ZnO wurtzite are tabulated in Table 1. The Williamson-Hall plots of 4sinθ verses
result in a straight line for each sample of as shown in Fig. 3. The Williamson–Hall (WH) method gives an average crystallite size as presented in Table 1. The average crystallite size is almost close to 40 nm for doped samples such results could be due to the fact that Ni doping results in no change in the ZnO wurtzite peaks width. This indicates that the Ni addition dose not obstructing the crystal growth of the ZnO host matrix.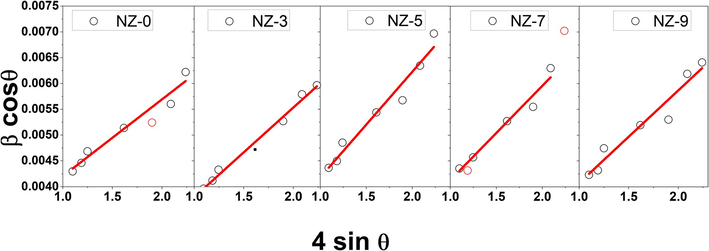
Williamson-Hall plots of 4sinθ verses
for investigated Ni-doped ZnO nanoparticles.
The lattice parameters and unit cell volume of wurtzite structure of Ni:ZnO samples were obtained from Rietveld refinement of XRD results. The lattice constants a and c are showing no or too little variations as Ni content increases as seen from Table 1. Since formation of the NiO phase on the surface the volume of the unit cell of wurtzite structure shows no much changes in all samples. The average crystallites size (D), lattice parameters (c and a), c/a, cell volume (V) and lattice strain (ε) of Ni:ZnO NPs are tabularized in Table 1. The obtained strain values are showing little change with increasing of the Ni content in the nanoparticles. No clear splitting in the XRD in the highest three peaks of ZnO wurtzite structure as Ni content is increasing. However, XRD peaks show shifts to lower 2θ with increasing of Ni demonstrating presence of lattice stress by Ni (Farha et al., 2020). Upon addition of Ni in the samples, the formation of NiO phase become more pronounced on the surface. The formation of NiO phase is confirmed from the increase of the XRD peaks of NiO phase (Farha et al., 2020; Mazher et al., 2004).
3.2 FTIR characterization
FTIR measurements were used for an additional investigation for the structure of Ni doped ZnO nanoparticles. Ni doped ZnO nanoparticles' FTIR spectra are displayed in Fig. 4. The samples' generated absorption peaks are seen in the FTIR spectra. Similar spectra were obtained for Ni doped and pure zinc oxide samples, as shown in Fig. 4. These results are in good agreement with the XRD findings, as the creation of wurtzite ZnO structures was observed in all of the samples. Identical results also have been reported for other ZnO doped systems (Mansour et al., 2021; Farha et al., 2016).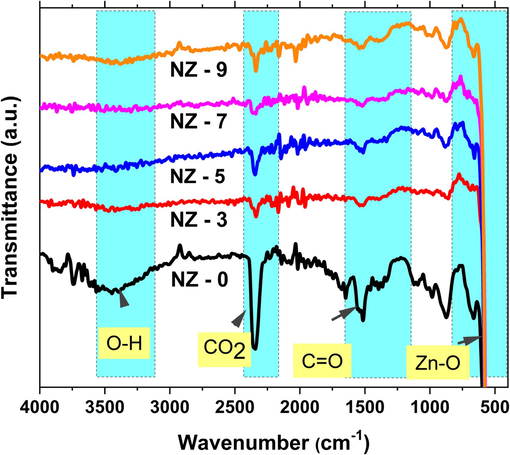
FTIR transmittance spectra of investigated Ni-doped ZnO nanoparticles.
Staring at high wave number values, the absorption band at 3700 cm−1 is representing the vibration mode of O–H group. Such absorption band is showing the highest intensity in the pure ZnO sample as shown in Fig. 4. This result is referring to the adsorption of OH on the surface of ZnO sample with large amounts comparing to that on Ni doped ZnO samples. Similar results have been reported for Co-doped ZnO nanoparticles prepared by other methods (Farha et al., 2016). Following that an absorption band at ∼ 2335 cm−1 is rising from CO2 group that desorbed from the atmosphere (Maensiri et al., 2006). This peak is relatively small that is referring to well crystalline structure. Also this band is higher in intensity for ZnO sample comparing to doped samples. In addition, an absorption band at 1600 cm−1 is presenting stretching for bonding of C = O group from zinc acetate salt (Djaja et al., 2013). The last absorption band at about 450 cm−1 is presenting in all the studied samples is assigned to the ZnO stretching mode, with no shift upon Ni- doping of the samples. Such results of the fixed position of ZnO peak in all samples are in good agreements with unchanging in the lattice constant with Ni-doping that obtained from XRD results (Ahmed et al., 2012; Senthilkumaar et al., 2008; Li et al., 2004).
Raman measurements are acquired to inspect the crystalline quality of prepared Ni:ZnO nanostructures. In addition, for the current study Raman spectra can be analyzed to investigate the role of Ni doping in ZnO wurtzite structure. Room temperature Raman spectra of the prepared Ni:ZnO nanostructures are presented in Fig. 5. The spectra consist of several peaks in which the sharpest and strongest are centred around 99 cm−1 and 438 cm−1. These two peaks are associated with the low and high frequency modes of non-polar optical phonons;
and
respectively (Farha et al., 2020).
modes are corresponding to vibrations of weighty zinc sub-lattice, and
modes are corresponding to vibrations of oxygen sub-lattice. Therefore, these modes are characteristic for the formation of the ZnO wurtzite structure (Rana et al., 2017). These modes are presented in all the samples, however, there is a weakness in the
mode with the incorporation of Ni ions into the host lattice of ZnO. Such reult indicates that an increase of the structural defects in the samples and the presence of surface local distortion are induced by the increase of Ni content. Also, it can be observed from Raman spectrum of ZnO sample (black line in Fig. 5) that there is a peak centred at around 332 cm−1. This peak is associated with
phonon modes which are belonging to the ZnO wurtzite structure. This peak is not appearing in Raman spectra of Ni doped ZnO samples which indicates an obvious effect of Ni doping on ZnO. Moreover, other vibration modes are detected which are assigned to a peak centred around 380 cm−1. This peak is associated with A1(TO); transvers optical polar phonon modes which are corresponding to ZnO wurtzite structure. A1(TO) modes show the polar lattice strength of ZnO crystal structure (Yang et al., 2004). These modes are not existing in Ni:ZnO spectra as well. All observed peaks are resulted from the first order phonon scattering (George and Anandhan, 2014; Mironova-Ulmane et al., 2019).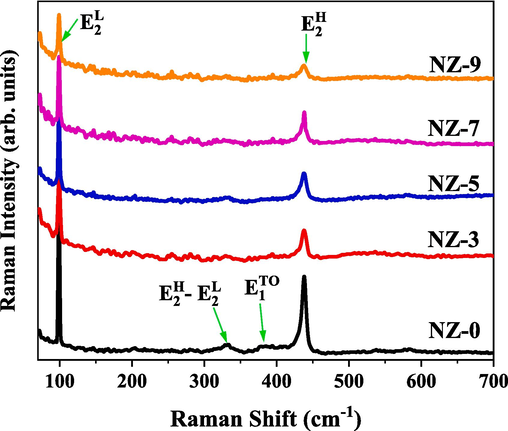
Room temperature Raman spectra of investigated Ni-doped ZnO nanoparticles.
The examined Ni:ZnO nanoparticles' FE-SEM micrographs are shown in Fig. 6. As observed from Fig. 6, the particles that are produced in all of the under investigation samples have a somewhat consistent spherical shape with high degrees of agglomerations. These micrographs also show the formation of nano-sized particles with highly agglomerated properties that combine to form relatively homogeneous microspheres. In fact, because of their high surface area and higher surface to volume ratio the small nano-sized particles tend to agglomerate. The resulting nanoparticle size forms are very similar to variations with Ni content supporting the preservation of host structure of the samples studied.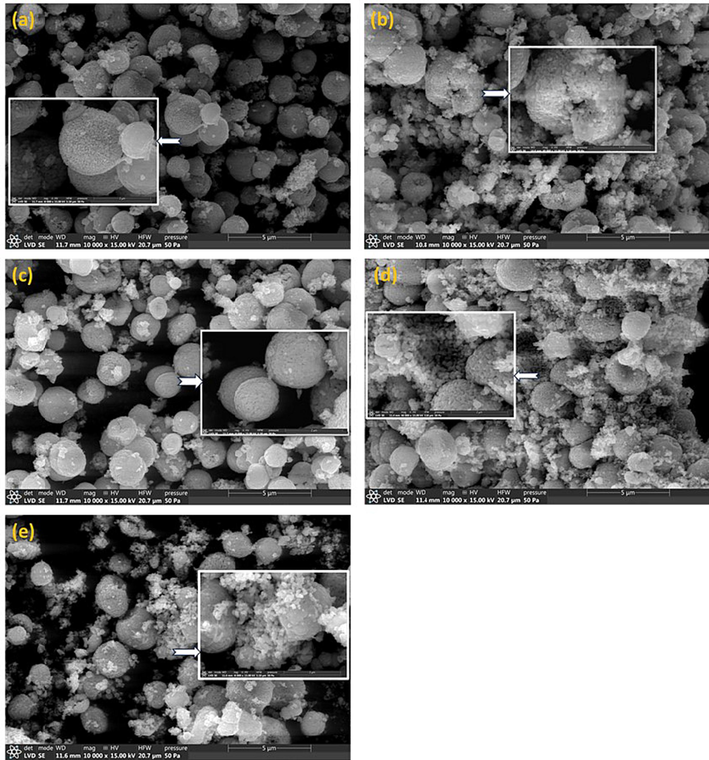
FE-SEM micrographs of investigated Ni-doped ZnO nanoparticles. (a) NZ-0, (b) NZ-3, (c) NZ-5, (d) NZ-7, and (e) NZ-9. The inset micrograph in each figure shows the selected zones with higher magnification.
Nevertheless, the diameter distribution in Fig. 7 indicates that the pure sample, NZ-0, has a more homogeneous size distribution centered around the most often observed diameter, in contrast to the doped samples. This could be referred to as a passive effect of doping by Ni due to the close range of the obtained particle. While the most frequently observed diameters for all samples are similar. It is important to acknowledge that there is a significant discrepancy between the values of the most frequently observed particles from SEM and the crystallite sizes acquired from XRD for all the samples under investigation. The observed variance can be explained by the presence of many crystallites within the particle, which may result in the particle size is bigger than the size of individual crystalline domains. Consequently, the particle size and crystallite size often differ due to the formation of polycrystalline aggregates (Mansour et al., 2023).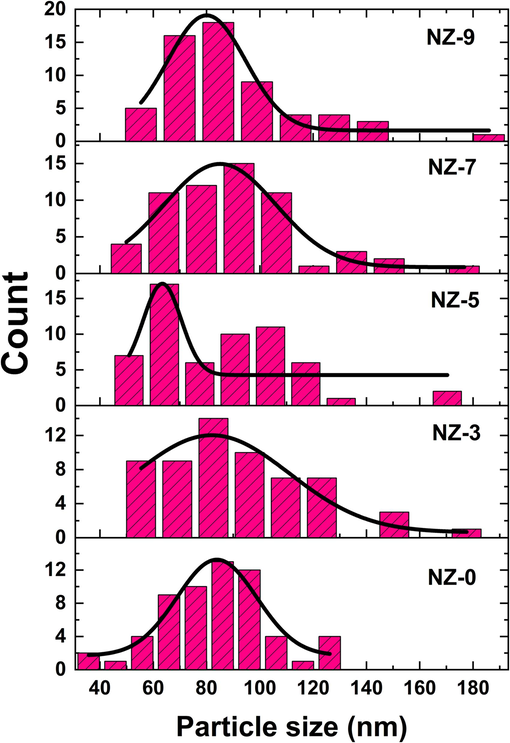
particles' size distributions of investigated Ni-doped ZnO nanoparticles.
3.3 Optical characterization
The UV–Vis-NIR diffuse reflectance spectra (DRS) of Ni-doped ZnO nanoparticles are displayed in Fig. 8. Such figure demonstrates a robust absorption band at wavelengths below 370 nm in all the samples. This strong absorption band is originating from the transitions over the optical energy gap (Smith, 1978). The pristine ZnO sample shows the highest reflectance (R) value of 82.5 %, at a wavelength of 728 nm. The reflectance values of a pristine ZnO sample exhibit a plateau that is ranging between 78 and 82.5 % in the wavelength range 546–––1354 nm. However, as one can see from Fig. 8, R values of the Ni-doped ZnO nanoparticles are considerably lower than these of pristine ZnO sample. The reflectance from the doped samples sharply decreased at 722 and 1166 nm over the relevant wavelength range, (546–––1354 nm), this may be due to the increase of the absorption upon the formation of the additional NiO phase. Such formation presented and/or as trap levels that were created because of the addition of Ni ions.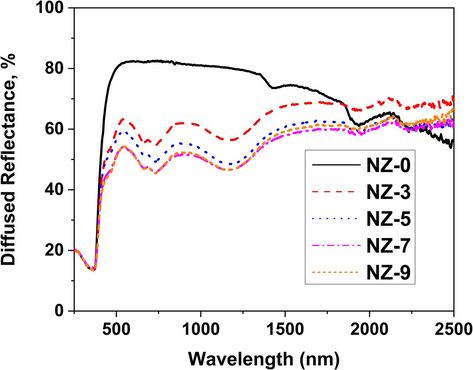
UV–Vis-NIR diffuse reflectance spectra of investigated Ni-doped ZnO nanoparticles.
To study the effect of Ni- doping on the reflectance capability of the nanoparticles DRS measurements in NIR and Vis ranges were done. In order to compare the reflectance ability of the synthesized nanoparticles throughout both the NIR and Vis ranges. Whereas, the NIR solar reflectance (
) in a range from 700 to 2500 nm and the visible solar reflectance (
) in a range from 390 to 700 nm, were evaluated using the following equations: Eq. (1) and Eq. (2), (Jose et al., 2014; Baneshi et al., 2009):
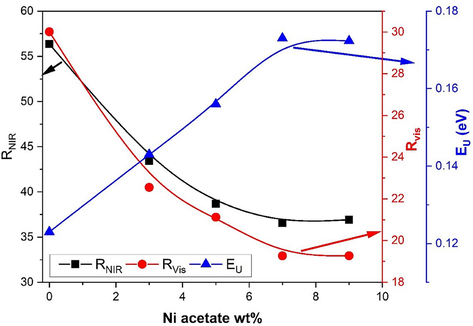
The variations of
,
and
for the investigated Ni-doped ZnO nanoparticles as a function of Ni acetate molarity weight percentage.
Using Kubelka-Munk (K-M) method, the energy band gap (Eg) is determined for powdered materials from DRS findings. As a result, the following formula was used to assess the K-M function F(R) (Kortüm, xxxx):
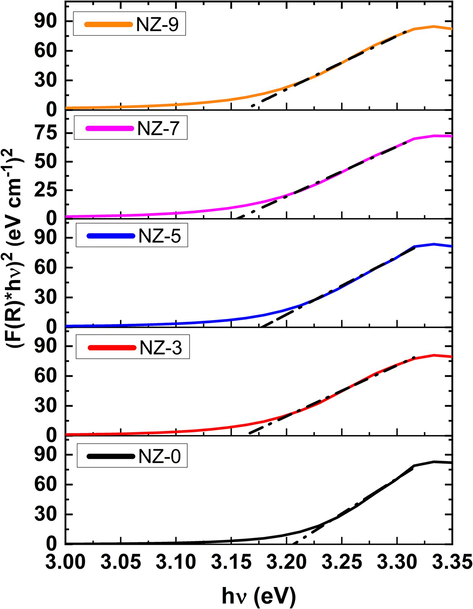
Plots of
versus hν of investigated Ni-doped ZnO nanoparticles.
Sample
Eg, (eV)
EU, (eV)
NZ-0
3.208
0.123
NZ-3
3.163
0.143
NZ-5
3.178
0.156
NZ-7
3.157
0.173
NZ-9
3.164
0.172
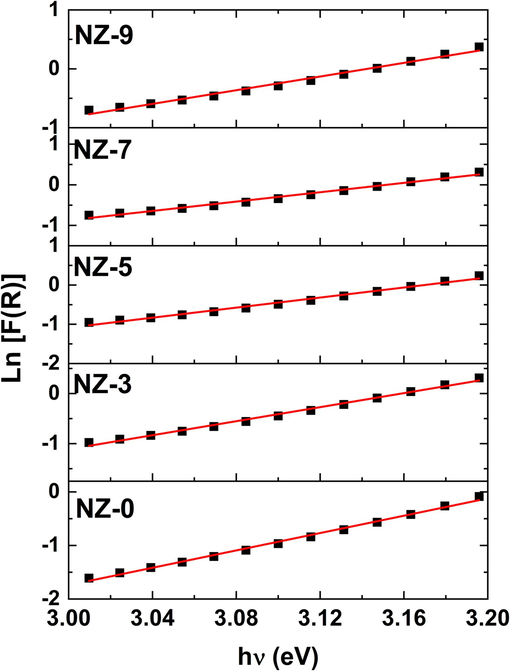
Plots of
versus
of investigated Ni-doped ZnO nanoparticles.
3.4 Magnetization analysis
Fig. 12 displays the magnetization (M) against magnetic field (H) curves for the Ni:ZnO nanoparticles. The hysteresis loops that have been observed indicate that the room temperature ferromagnetic (RTFM) behavior is being exhibited by both the undoped and Ni doped nanoparticles. This demonstrated that employing ZnO as the host crystal allowed for the efficient production of DMS. Due to the high likelihood of defects generation, the reported hysteresis loop for ZnO pristine sample confirms the predicted RTFM for ZnO nanoparticles. According to discussions in the literatures, flaws that could trap electrons are promoting FM ordering (Santara et al., 2014). In fact, the existed of oxygen vacancies and/or Zn defects sites are causing the RTFM behavior in ZnO. Such results had been observed in numerous research works, including (Mansour et al., 2021; Hong et al., 2007; Xu et al., 2008). According to Athinarayanan and Rao (Sundaresan and Rao, 2009), RTFM behavior has been proposed as an inherent characteristic of inorganic nanoparticles and is restricted to the surface of the nanoparticles. Due to the competing combined actions between the transition metals as well as oxygen vacancy, the FM characteristic parameters including the coercive field, saturation magnetization, retentivity, and squareness showed non-monotonic variations with Ni concentration. Such non-monotonic change is noticeably perceived from the enlargement inset of Fig. 12. It is important to note that FM behavior of DMS-NPs is ascribed to the free delocalized charge carriers, which are essentially resulting from oxygen vacancy defects, and d-spins of Ni ions. On the other hand, the competing of FM and antiferromagnetic (AFM) interactions could cause such a non-monotonic variations in of magnetic performances of the current samples. The AFM behavior is commonly predominate when the concentration of the magnetic ion increases, that causes the formation of magnetic ions clusters (Mansour et al., 2021). This closely matches the measured saturation magnetization of NZ-9 sample (0.035 emu/g), which is lower than the NZ-7 sample's saturation magnetization of 0.08 emu/g.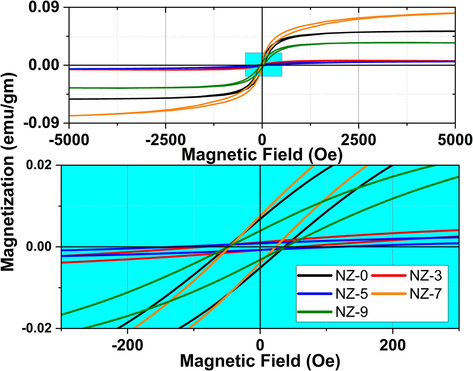
Room temperature magnetization-field curves of investigated Ni-doped ZnO nanoparticles.
4 Conclusion
Ni-doped ZnO nanoparticles with molarity concentration ratios of 0, 3, 5, 7, and 9 % between Ni and Zn salts were successfully produced using a simple sol–gel method. All Ni:ZnO nanoparticles had a ZnO wurtzite structure and a NiO rock-salt phase on at their surfaces as confirmed by samples' XRD and Raman spectra. Rietveld refinements showed the formation of both phases with no much changes in the average crystallite size and particles size upon Ni doping of the samples. Increasing the Ni concentration in the samples causes a rise in the density of traps, which results in a reduction in the samples' (RNIR) and (RVIS) solar reflectance. Weakness in the mode of Raman data is also verified the formation of structural defects in the samples with the incorporation of Ni into of ZnO lattice. Additionally, a peak linked to the ZnO wurtzite structure with phonon modes was detected in the Raman spectrum of ZnO. The energy band gap (Eg) of the samples showed an average value 3.164 eV. The band tails Urbach energy (EU) raises from 123 to 173 meV upon increasing of Ni content in the samples in agreement with increasing of the traps density upon doping. The RTFM in all Ni:ZnO samples is another phenomenon that is connected to the density of traps. Such FM behavior is attributed to d-spins of Ni ions and oxygen vacancy defects.
Author Contributions: Author has read and agreed to the published version of the manuscript.
Funding
This research received no external funding.
Institutional Review Board Statement: Not applicable.
Conflicts of Interest: The author declares no conflict of interest.
Declaration of competing interest
The author declares that she has no known competing financial interests or personal relationships that could have appeared to influence the work reported in this paper.
References
- Doping effects of Co2+ ions on structural and magnetic properties of ZnO nanoparticles. Microelectron. Eng.. 2012;89:129-132.
- [Google Scholar]
- Structural and magnetic properties study of Fe2O3/NiO/Ni2FeO4 nanocomposites. Crystals. 2021;11(6):613.
- [Google Scholar]
- Effect of Ni doping on structure, morphology and opto-transport properties of spray pyrolised ZnO nano-fiber. Heliyon. 2020;6(3):e03588.
- [Google Scholar]
- Preparation of Co and Ni doped ZnO nanoparticles served as encouraging nano-catalytic application. Mater. Res. Express. 2019;6(12):1250d5
- [Google Scholar]
- Structural and diffuse reflectance study of Cr-Doped ZnO nanorod-pigments prepared via facile thermal decomposition technique. J. Inorg. Organomet. Polym Mater.. 2019;29(3):792-798.
- [Google Scholar]
- The effects of using some common white pigments on thermal and aesthetic performances of pigmented coatings. Journal of Thermal Science and Technology - J Therm Sci Technol. 2009;4:131-145.
- [Google Scholar]
- Estimation of lattice strain in ZnO nanoparticles: X-ray peak profile analysis. J. Theor. Appl. Phys.. 2014;8(4):123-134.
- [Google Scholar]
- A physical explanation to the controversial Urbach tailing universality. The European Physical Journal plus. 2011;126(1):10.
- [Google Scholar]
- Defect generation, d-d transition, and band gap reduction in Cu-doped TiO2 nanoparticles. International Nano Letters. 2013;3(25)
- [Google Scholar]
- Valence and conduction band offset measurements in Ni0.07Zn0.93O/ZnO heterostructure. Curr. Appl Phys.. 2014;14(2):171-175.
- [Google Scholar]
- Comprehensive investigation of structural, morphologic, optical, dielectric and electrical of Ni0.3Cd0.7Cr2O4 chromite to optoelectronic application. J. Inorg. Organomet. Polym Mater.. 2023;33(12):3984-4000.
- [Google Scholar]
- The effect of co incorporation into ZnO nanoparticles. Advances in Materials Physics and Chemistry. 2013;3:33-41.
- [Google Scholar]
- Experimental and modeling study of ZnO: Ni nanoparticles for near-infrared light emitting diodes. RSC Adv.. 2022;12(21):13074-13086.
- [Google Scholar]
- Escobedo Morales, A.; Sánchez Mora, E.; Pal, U., Use of Diffuse Reflectance Spectroscopy for Optical Characterization of Un-Supported Nanostructures. Revista Mexicana De Física 2007, 53(5), 18–22.
- Optical and magnetic properties of Ni-doped ZnO nanoparticles. J. Alloy. Compd.. 2017;694:522-531.
- [Google Scholar]
- Structural, optical, and magnetic study of dilute magnetic semiconducting Co-doped ZnO nanocrystals synthesized using polymer-pyrolysis route. J. Mater. Sci.. 2016;51(21):9855-9864.
- [Google Scholar]
- Ga-Doped ZnO nanostructured powder for cool-nanopigment in environment applications. Materials. 2020;13(22):5152.
- [Google Scholar]
- Structural and optical characteristics of highly UV-blue luminescent ZnNiO nanoparticles prepared by sol-gel method. Materials. 2020;13(4):879.
- [Google Scholar]
- Cost-effective and efficient cool nanopigments based on oleic-acid-surface-modified ZnO nanostructured. Materials. 2023;16(6):2159.
- [Google Scholar]
- Synthesis and characterisation of nickel oxide nanofibre webs with alcohol sensing characteristics. RSC Adv.. 2014;4(107):62009-62020.
- [Google Scholar]
- Can undoped semiconducting oxides be ferromagnetic? Physica Status Solidi (c). 2007;4:4461-4466.
- [Google Scholar]
- Effect of nickel doping on physical properties of zinc oxide thin films prepared by the spray pyrolysis method. Appl Surf Sci. 2014;301:216-224.
- [Google Scholar]
- Green colored nano-pigments derived from Y2BaCuO5: NIR reflective coatings. Dyes Pigm.. 2014;107:118-126.
- [Google Scholar]
- Kortüm, G. Reflectance spectroscopy Principles, methods, applications. Springer Berlin Heidelberg, 1969. http://dx.doi.org/10.1007/978-3-642-88071-1.
- Sol–gel preparation of transparent zinc oxide films with highly preferential crystal orientation. Vacuum. 2004;77(1):57-62.
- [Google Scholar]
- A simple synthesis and magnetic behavior of nanocrystalline Zn0.9Co0.1O powders by using Zn and Co acetates and polyvinyl pyrrolidone as precursors. J. Magn. Magn. Mater.. 2006;305(2):381-387.
- [Google Scholar]
- Novel magnetic polyaniline nanocomposites based on as-synthesized and surface modified Co-doped ZnO diluted magnetic oxide (DMO) nanoparticles. Mater. Sci. Eng. B. 2021;265:115032
- [Google Scholar]
- Nanosized amorphous and nanocrystalline titania doped by Cr as novel, efficient, and cost-effective cool-colored nanopigments. Ceram. Int.. 2023;49(20):33089-33098.
- [Google Scholar]
- Strained ZnSe nanostructures investigated by x-ray diffraction, atomic force microscopy, transmission electron microscopy and optical absorption and luminescence spectroscopy. Nanotechnology. 2004;15(5):572-580.
- [Google Scholar]
- Effect of dilute doping and non-equilibrium synthesis on the structural, luminescent and magnetic properties of nanocrystalline Zn1-xNixO (x= 0.0025–0.03) Mater Res Bull. 2019;115:37-48.
- [Google Scholar]
- Magnon and phonon excitations in nanosized NiO. Latv. J. Phys. Tech. Sci.. 2019;56:61-72.
- [Google Scholar]
- Williamson-Hall analysis in estimation of lattice strain in nanometer-sized ZnO particles. J. Theor. Appl. Phys.. 2012;6(1):6.
- [Google Scholar]
- Preparation and characterization of Ni, Co doped ZnO nanoparticles for photocatalytic applications. Appl. Surf. Sci.. 2018;448:481-488.
- [Google Scholar]
- Investigation studies of structural, electrical, dielectric, and optical of DyTi0.5 Mn0.5O3 multiferroic for optoelectronics applications. J. Mater. Sci. Mater. Electron.. 2022;33(27):21890-21912.
- [Google Scholar]
- Search for origin of room temperature ferromagnetism properties in Ni-Doped ZnO nanostructure. ACS Appl. Mater. Interfaces. 2017;9(8):7691-7700.
- [Google Scholar]
- A review of the synthesis and photoluminescence properties of hybrid ZnO and carbon nanomaterials. J Nanomater. 2016;2016:19.
- [Google Scholar]
- Oxygen vacancy-mediated enhanced ferromagnetism in undoped and Fe-doped TiO2 nanoribbons. J. Phys. D Appl. Phys.. 2014;47, (23):235304
- [Google Scholar]
- Influence of Mn doping on the microstructure and optical property of ZnO. Mater. Sci. Semicond. Process.. 2008;11(1):6-12.
- [Google Scholar]
- Smith, R. A., Semiconductors, . Cambridge University Press, Cambridge; New York: 1978.
- The electronic structure of mesoscopic NiO particles. Chem. Phys. Lett.. 1993;208(5):460-464.
- [Google Scholar]
- Detailed investigation of structural, morphology, magnetic, electical and optical properties of the half-doped perovsikteNd0.5Ba0.5FeO3. J. Inorg. Organomet. Polym Mater.. 2022;32(12):4515-4531.
- [Google Scholar]
- Ferromagnetism as a universal feature of inorganic nanoparticles. Nano Today. 2009;4(1):96-106.
- [Google Scholar]
- Room temperature ferromagnetism in ZnO films due to defects. Appl. Phys. Lett.. 2008;92:082508.
- [Google Scholar]
- Effects of substrate temperature on nanostructure and band structure of sputtered Co3O4 thin films. J. Appl. Phys.. 2003;93:4158-4162.
- [Google Scholar]
- In situ synthesis of Mn-doped ZnO multileg nanostructures and Mn-related Raman vibration. J. Appl. Phys.. 2004;97:(1).
- [Google Scholar]


