

Translate this page into:
Nickel sulphide-reduced graphene oxide composites as counter electrode for dye-sensitized solar cells: Influence of nickel chloride concentration
⁎Corresponding author. mohd.yusri@ukm.edu.my (M.Y.A. Rahman)
-
Received: ,
Accepted: ,
This article was originally published by Elsevier and was migrated to Scientific Scholar after the change of Publisher.
Peer review under responsibility of King Saud University.
Abstract
Nickel sulphide-reduced graphene oxide (NiS-rGO) composite films have been prepared via modified Hummers’s method assisted with spin coating technique. The NiS-rGO samples were then employed as counter electrode in a dye-sensitized solar cell (DSSC). The main aim of this work is to investigate the relationship between the concentrations of NiCl2 with the properties of NiS-rGO and performance parameters of the device. The dominant rGO and minor NiS phase exist in the composite. The morphology of the composite is white strips rGO and NiS agglomerate particle. The element of C, O, Ni and S present in the composite. The highest η of 1.04% and Jsc of 7.39 mA cm−2 were obtained from the device with 0.06 M NiCl2 resulted from the longest carrier lifetime. The photovoltaic parameters results reveal that NiS-rGO composite has potential to become as a free platinum counter electrode of DSSC.
Keywords
Counter electrode
Dye-sensitized solar cells
Nickel sulphide
Reduced graphene oxide

1 Introduction
Cathode is one of the most important components in dye-sensitized solar cell (DSSC). Its role is to accept electrons from external circuit to be passed to redox mediator species for reduction process. The performance of the device is strongly influenced by the electrical and catalytic property of its cathode. High electronic conductivity and catalytic activity of cathode will result in high power conversion efficiency of the device. Platinum becomes as a popular material for cathode of the device since it has good electrical property, high catalytic activity and high corrosion resistance against redox mediator in the electrolyte. The highest power efficiency of the DSSC utilizing TiO2 photoanode, Pt counter electrode and N719 sensitizer is 14%. However, the major problem with platinum is that its price is very expensive and making it unsuitable for practical application. Several groups have utilized several types of materials such as carbon-based materials, ternary compound material, conducting polymer, ternary chalcogenides and graphene-based materials as free-platinum counter electrode in DSSC (Huang et al., 2007; Nam et al., 2010; Ramalingam et al., 2016; Gulen et al., 2018; Tas et al., 2017; Özel et al., 2016; Roy-Mayhew et al., 2010).
Reduced graphene oxide (rGO) is also an alternative material as free-platinum cathode in order to produce the comparable efficiency to that of the device with platinum as it also possesses high conductivity and catalytic activity (Wang et al., 2014; Wang et al., 2016; Wei et al., 2018). In our previous work, rGO was utilized as cathode in DSSC but performed a low efficiency that was 0.09% (Rahman et al., 2017). To increase the efficiency, Au-rGO sample was then used as cathode of the device. As a result, the efficiency was improved to 0.175% (Rahman et al., 2018). However, when the device utilized Ag-rGO as cathode, the efficiency was further improved to 0.746% (Mustaffa et al., 2018). Apart from utilizing metal doped rGO as cathode of DSSC, rGO composite was also used as cathode of the device. For example, rGO-NiCo2S4 composite has been employed as counter electrode in DSSC and achieved high power conversion efficiency (Lu et al., 2016; Anuratha et al., 2017). The effect of rGO content on the performance of the DSSC utilizing reduced graphene oxide nano-flakes in a nickel cobalt sulfide has been studied (Lu et al., 2016). While, the influence of GO content on the performance of the device employing RGO-NiCo2S4 has been investigated (Anuratha et al., 2017).
In Shin et al. (2020), MoFe alloy-rGO composite has been utilized as cathode of the device. Au nanopartice/graphene composite was utilized as counter electrode of the device (Dao et al., 2015). Graphene-NiO nanohybrid was employed as cathode of DSSC (Dao et al., 2014). Pt nanoparticle/graphene‐coated counter electrode was used as counter electrode of the device (Dao et al., 2013). Graphene-Ag nanowire was utilized as cathode of DSSC (Trung et al., 2017). NiO nanosheets hybridized with PEDOT:PSS, Cdot and Pt nanoparticles have been utilized as counter electrodes of DSSC (Dao et al., 2020).
We have prepared NiS-rGO films composites and employed as cathode of the device in this work. NiS has been chosen as it is expected to improve the electronic conductivity of rGO when it is prepared in composite form and improves the efficiency of the device utilizing NiS-rGO as cathode. The new idea of this work is the preparation of NiS-rGO composite films with the source of NiS is NiCl2 and thiourea. The source of nickel and sulphur are NiCl2 and thiourea, respectively. The goal of this work is to correlate the preparation parameter of NiS-rGO that is NiCl2 concentration on the properties of NiS-rGO and the photovoltaic parameters of the device utilizing NiS-rGO composite as cathode.
2 Materials and methods
2.1 Materials
The required materials are ITO substrate, acetone, NiCl2 powder, thiourea powder, deionized water, titanium (IV) oxide, poly(ethylenglycol), triton-x, absolute ethanol, N719 dye powder, ethanol, iodolyte electrolyte and GO sheet.
2.2 NiS-rGO preparation and characterization
At first, GO sheet was synthesized via modified Hummer’s method, following the procedures described in Umar et al. (2016). 0.1 g GO sheet was dissolved in 10 ml deionized water and stirred ultrasonically for 1 h. 0.01 M NiCl2 was put into 5 ml deionized water and the solution was then added to the GO solution. 1 M thiourea was then added into the mixture solution, sonicated for 30 mins and stirred for 3 h. The solution was deposited on ITO substrate 3 times in order to obtain the NiS-GO film films with sufficient thickness by spin coating technique at 1500 rpm for 30 s with pre-heating at 100 °C for 10 min. The NiS-GO sample was then annealed at 350 °C in argon atmosphere for 1 h in order to reduce to NiS-GO to NiS-rGO composite film. These procedures were repeated to prepare the composites with various NiCl2 concentrations, namely, 0.02, 0.03, 0.04, 0.05 and 0.06 M. The pure rGO was prepared with the same method without adding NiCl2 and thiourea.
The phase structure of the pure rGO and Nis-rGO composites with various concentrations of NiCl2 was determined by XRD. The transmittance of these samples was determined by UV–Vis spectrometer. The morphology of the samples was studied by FESEM. The elemental analysis on the composite samples was carried out by EDX spectroscopy.
2.3 Device fabrication
TiO2 films which serves as a photoanode of the device was prepared via doctor blade technique. 1 g of titanium (IV) oxide mixed with 0.2 ml poly(ethylenglycol) (PEG) and 2 ml triton-x were added into 1 ml absolute ethanol. After that, the mixture was stirred with speed of 1200 rpm for 1 h. The mixture was then turned into white slurry of paste. Few drops of TiO2 paste were then dropped on the conductive side of ITO substrate and spread evenly on the substrate surface. The formed TiO2 films were preheated at 100 °C for 15 min using a hot plate. Subsequently, the films were annealed in a furnace (model Thermcraft) for 1 h at 400 °C to burn out the organics material. The N719 dye powder was then dissolved into ethanol to prepare 0.5 mM N719 dye solution. Then, the TiO2 films were immersed in the dye solution in order to improve its optical absorption in visible region of light spectrum. The immersion was carried out for 24 h at room temperature. The prepared NiS-rGO composite with various NiCl2 concentrations were used as cathode of the device. The iodolyte electrolyte solution was injected in between the photoanode and the cathode. The illuminated area of the device under illumination of 100 mW cm−2 light from tungsten halogen lamp was 0.23 cm2. The performance study of the device in air was carried out by measuring current and voltage with Keithley 2401 instrument in dark and under illumination of 100 mW cm−2 light. The J-V measurement for each device sample was measured 3 times. The photovoltaic measurement of the device with Pt counter electrode was also carried out as comparison with that of the device utilizing NiS-rGO cathode samples. The bulk and charge transfer resistance at the interface of NiS-rGO/electrolyte as well as carrier lifetime were determined by electrochemical impedance analysis (EIS) also under illumination of 100 mW cm−2 light.
3 Results and discussion
Fig. 1 shows the XRD patterns of NiS-rGO composite with various NiCl2 concentrations and that of pure rGO which is without NiS. The peak positions for rGO are at 26.47 and 42.01°. The rGO peak intensity at 26.47° decreases once the NiCl2 concentration is increased to 0.02 M. The peak intensity of rGO is quite similar at the other concentrations. Also, the peak width becomes smaller when the concentration is increased to 0.02 M and higher concentrations. However, the peak intensity of rGO at 42.01° is found to be smaller than that at 26.47°. The NiS peaks are identified at 46.09° and 56.30° but with relatively smaller intensity than that rGO at 26.47 and 42.01°. While, the ITO are identified to exhibit the diffraction peaks at 30.80, 35.8, 51.20 and 61.03°. It is noticed that the peak intensity for ITO at 30.80 and 51.20°decreases as the concentration of NiCl2 is increased until 0.06 M. However, the ITO peak intensity at 35.8° is found to increase with the concentration of NiCl2 and then re-increases at 0.06 M. The peak intensity of ITO at 61.03° is quite similar for all samples including the pure rGO. The XRD result of GO is reported in Anuratha et al. (2017).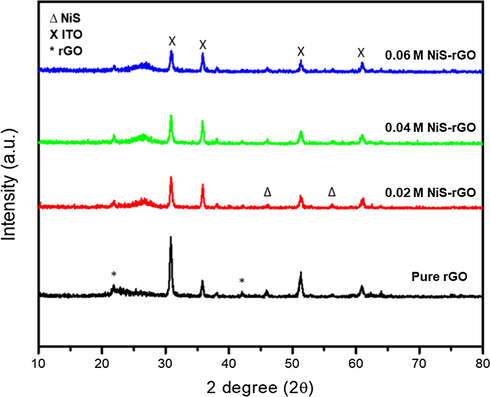
XRD patterns of NiS-rGO film with various NiCl2 concentrations.
Fig. 2 depicts the optical transmission spectra of NiS-rGO composite with various NiCl2 concentrations and that of pure rGO. It is noticeable that the optical transmittance varies significantly with the concentration of NiCl2. It is worth noting that the transmittance decreases with the concentration of NiCl2 in the range 0.2–0.6 M. The highest transmittance which is 85% belongs to 0.10 M sample, followed by 0.12, 0.08, 0.14, 0.02, 0.04. 0.06 and pure rGO samples in the descending order. The transmittance of 0.12, 0.08, 0.14, 0.02, 0.04. 0.06 and pure rGO samples are 81, 80, 75, 59, 53, 50 and 46%, respectively.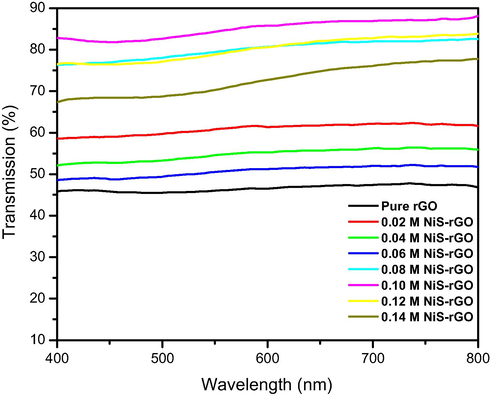
UV–Vis transmission spectra of NiS-rGO film with various NiCl2 concentrations.
Fig. 3 depicts the FESEM images of NiS-rGO composite with various NiCl2 concentrations and that of pure rGO. The pure rGO shows white strips and dark region. The morphology of white strips are also observed in Au doped rGO (Rahman et al., 2017). From the images, it shows that white strips appeared for all samples indicating that rGO present in the samples. As NiS was introduced, the agglomerate particles were distributed to some part of the samples. The number of agglomerate particles started to increase as the concentration of NiCl2 increased while the white strips size started to decrease. The agglomerate particles belong to NiS.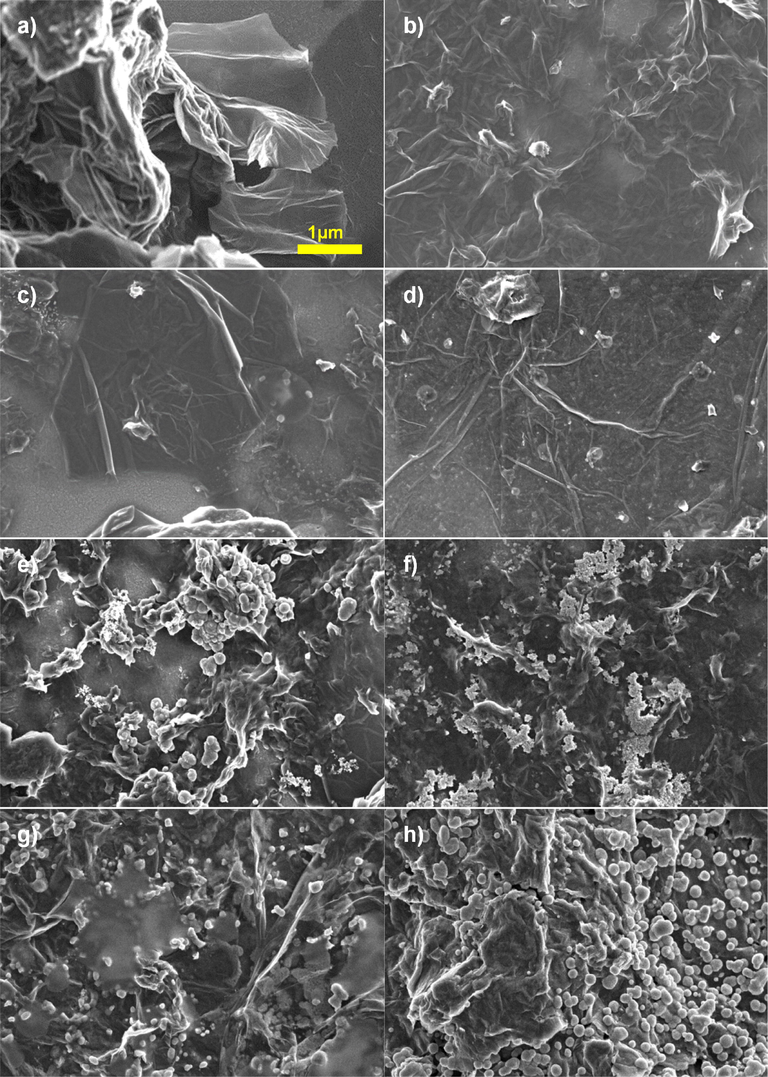
FESEM images of (a) pure rGO and NiS-rGO prepared at various NiCl2 concentrations, (b) 0.02, (c) 0.04, (d) 0.06, (e) 0.08, (f) 0.10, (g) 0.12 and (h) 0.14 M at × 10,000 magnifications.
Fig. 4 illustrates the EDX spectra of pure rGO and NiS-rGO composite with various NiCl2 concentrations. It is noticeable that the element of C and O present in pure rGO sample. The element of C, O, Ni and S exist in NiS-rGO composite samples. The wt.% for all elements with various NiCl2 concentrations are presented in Table 1. According to Table 1, the wt.% of Ni increases with the concentration of NiCl2 up to 0.10 M and then decreases. The wt.% of S follows the trend of that of Ni.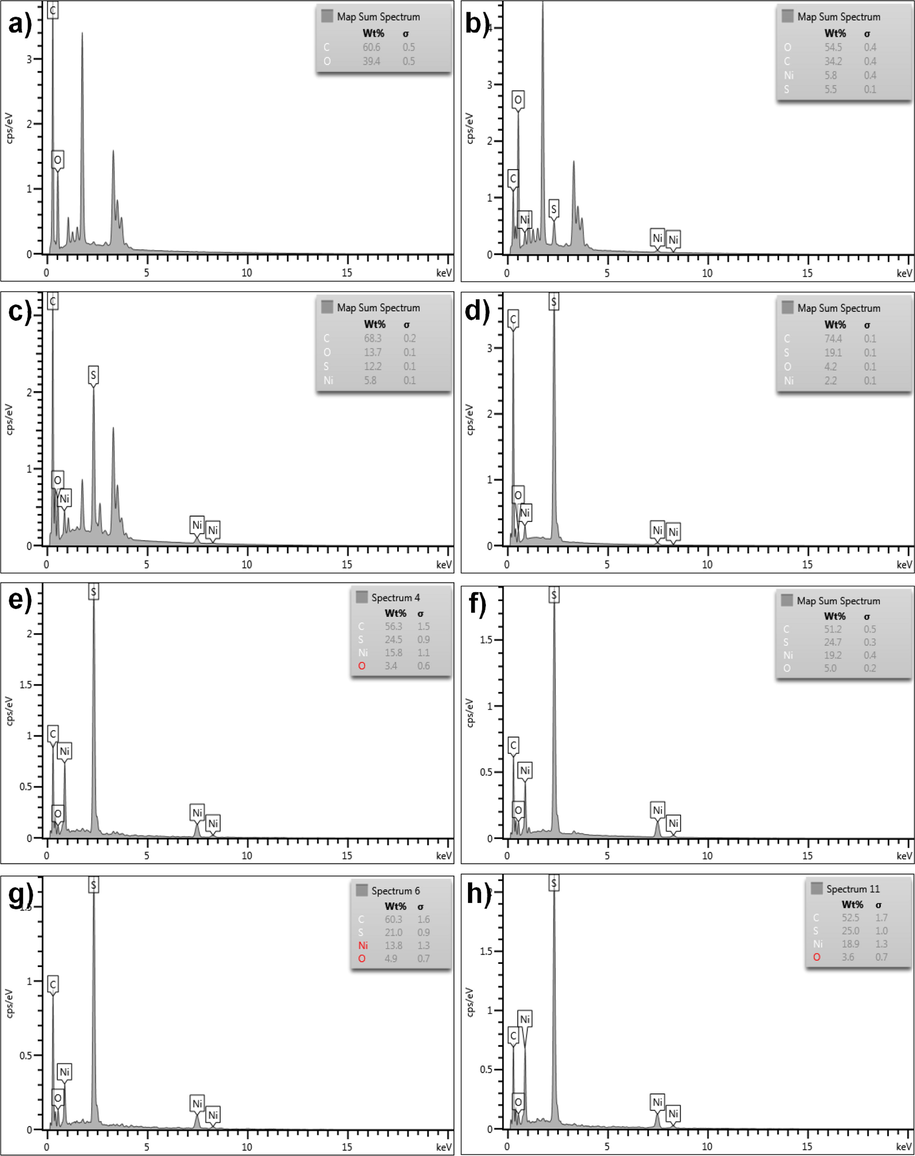
EDX spectra of (a) pure rGO and NiS-rGO at various concentrations of NiCl2 (b) 0.02 M, (c) 0.04 M, (d) 0.06 M, (e) 0.08 M, (f) 0.10 M, (g) 0.12 M and (h) 0.14 M.
Concentration (M)
C (wt.%)
O (wt.%)
Ni (wt.%)
S (wt.%)
rGO
60.6
39.4
–
–
0.02
34.2
54.5
5.8
5.5
0.04
68.3
13.7
5.8
12.2
0.06
74.4
4.2
2.2
19.1
0.08
56.3
3.4
15.8
24.5
0.10
51.2
5.0
19.2
24.7
0.12
60.3
4.9
13.8
21.0
0.14
52.5
3.6
18.9
25.0
Fig. 5 illustrates the current-voltage curves in dark of the device using NiS-rGO films as cathode with various concentrations of NiCl2. According to Fig. 4, it is found that the concentration of NiCl2 influences the dark current. The device with 0.02 M sample possesses the highest dark current, followed by 0.06, 0.04, 0.08, pure rGO, 0.12, 0.14 and 0.10 M samples in the descending order. Generally, the magnitude of the dark current is quite high which will lead to high photocurrent in the devices (Sulaiman et al., 2018). In other words, high leak current leads to the small photocurrent and consequently the small output power was generated in the device (Sulaiman et al., 2018).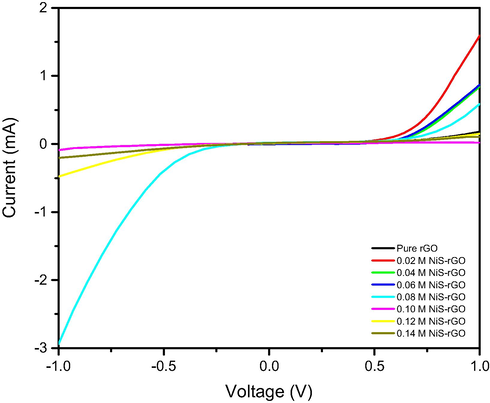
I-V curves in dark for the devices with various NiCl2 concentrations.
Fig. 6 depicts the J-V curves under illumination of the device with various NiCl2 concentrations. It is found that the shape of the J-V curves for the device utilizing NiS-rGO composites do not follow the ideal shape of the J-V curves (Anuratha et al., 2017; Sulaiman et al., 2018; Wang et al., 2014; Wang et al., 2016). The shape of the curve of all devices except the device with 0.02 M sample is similar to that of the device utilizing Au-rGO counter electrode (Rahman et al., 2017; Rahman et al., 2018). The slope of the curve for the device with 0.06 and 0.04 M samples are high signifying high internal resistance in the devices. However, the slope of the curve of the devices utilizing other samples is smaller than that of the device with 0.06 and 0.04 samples. The photovoltaic parameters are extracted from Fig. 6 and illustrated in Table 2.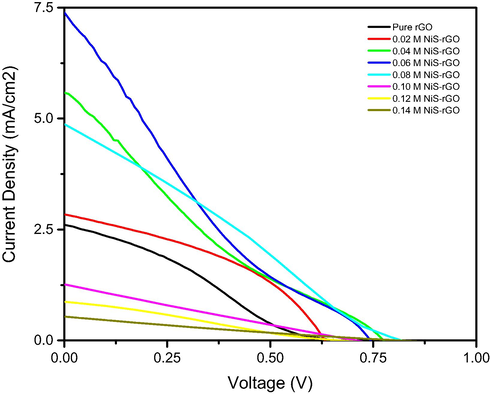
J-V curves of the devices with various NiCl2 concentrations under illumination of 100 mW/cm2 light.
Concentration (M)
Jsc (mA/cm2)
Voc (V)
FF
ŋ (%)
Pt
1.46
0.70
0.44
0.45
Pure rGO
2.61 ± 0.03
0.66 ± 0.02
0.28
0.48 ± 0.01
0.02
2.84 ± 0.08
0.63 ± 0.03
0.40
0.72 ± 0.01
0.04
5.58 ± 0.15
0.78 ± 0.03
0.19
0.83 ± 0.01
0.06
7.39 ± 0.08
0.74 ± 0.06
0.19
1.04 ± 0.01
0.08
4.52 ± 0.07
0.75 ± 0.03
0.26
0.88 ± 0.01
0.10
1.26 ± 0.03
0.71 ± 0.04
0.24
0.21 ± 0.01
0.12
0.81 ± 0.03
0.60 ± 0.06
0.24
0.12 ± 0.01
0.14
0.48 ± 0.02
0.74 ± 0.01
0.22
0.08 ± 0.01
According to Table 2, it is observed that the photovoltaic parameters are significantly influenced by the concentration of NiCl2. It is found that the devices utilizing NiS-rGO composites performs higher Jsc and ŋ than the device using pure rGO except the device with 0.10, 0.12 and 0.14 M NiCl2. The devices utilizing NiS-rGO composites performs higher Voc than the device using pure rGO except the device with 0.02 M NiCl2. However, the device with 0.01 and 0.05 M NiCl2 shares the same Voc with the device with pure rGO. The device with 0.06 M NiCl2 demonstrates the highest Jsc, Voc and ŋ. By further increasing the concentration of NiCl2, the Jsc and ŋ have been found to decrease according to Table 2. Nevertheless, this device possesses the lowest FF due to the leak of the highest amount of electrolyte during the photovoltaic measurement. The highest η that is 1.04% is found to be higher than that utilized Pt counter electrode. It is also higher than those reported in Rahman et al. (2018), Mustaffa et al. (2018) for which the DSSC utilized Au-rGO and Ag-rGO counter electrode, respectively. However, it is lower than that of the device utilizing the rGO-NiCo2S4 (Lu et al., 2016; Anuratha et al., 2017). It is slightly lower than that of the device utilizing Ag-rGO reported in our work for which the efficiency was 1.30% (Mustaffa et al., 2020). It is lower than that of the device employing MoFe alloy-rGO composite. The efficiency of this device was 5.44% (Shin et al., 2020). It is due to the charge transfer resistance of cathode/electrolyte of this work is higher than that reported in Mustaffa et al. (2020) but much higher than that reported in Shin et al. (2020). It is also lower than that of the device utilizing non-metal doped rGO counter electrode (Wang et al., 2016; Wang et al., 2014). However, the best efficiency of this work can be further improved by looking for the optimum concentration of thiourea which is source of sulphur.
Fig. 7 illustrates the Nyquist plots of the devices with various concentrations of NiS precursor. The plots shows a semi-circle representing charge transfer resistance at the NiS-rGO/electrolyte interface (Rct). The bulk resistance (Rb) is represented by a straight line from origin to the starting point of each plot. The Rb is computed from the Nyquist plots shown in Fig. 7 and tabulated in Table 3 together with Rct. According to Table 3, the device with 0.04 M sample. The device with 0.12 M sample possesses the lowest Rct. According to Table 2, the device using the 0.06 M sample yields the highest Jsc, and ŋ. This is due to this device owns the longest carrier lifetime. By having the longest carrier lifetime, the device produces the photocurrent and consequently the power conversion efficiency.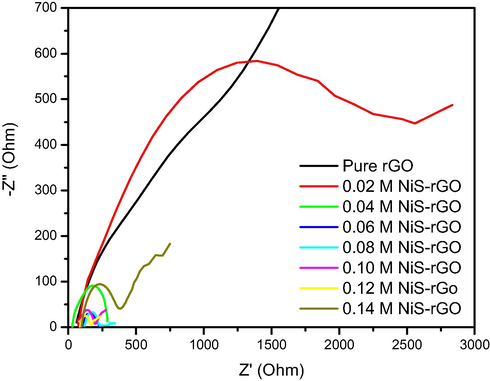
Nyquist plots of the devices utilizing the samples with (a) 0.01, 0.03, 0.04 and 0.06 M (b) pure rGO, 0.02 and 0.05 M of nickel chloride.
Concentration (M)
Rb (Ω)
Rct (Ω)
τ (ms)
Pure rGO
60
3993
1.21
0.02
80
2933
2.68
0.04
29
267
2.12
0.06
106
124
4.94
0.08
117
112
1.00
0.10
85
110
0.52
0.12
86
79
1.00
0.14
95
302
3.73
Fig. 8 depicts the Bode plots of the devices with various concentrations of NiS precursor. The device with pure NiS-rGO sample shows two peaks. However, the devices with various concentrations of NiCl2 only display one peak that was then used to compute the carrier lifetime. For, the device with pure NiS-rGO sample, its carrier lifetime was determined from the highest peak. The carrier lifetime corresponding with various NiCl2 concentrations are also illustrated in Table 3. It is found that the device with 0.06 M sample has the longest carrier lifetime.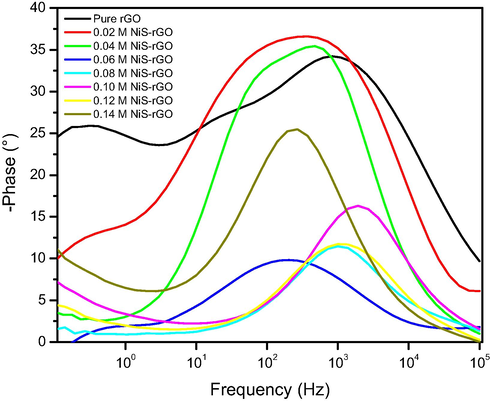
Bode plots of the devices with various nickel sulphide contents.
4 Conclusions
NiS-rGO composites films were successfully prepared via modified Hummers method assisted with spin coating cycle and employed as cathode in DSSC. The composite contains the dominant rGO and minor NiS phase. The morphological shape of the composite is white strips representing rGO and agglomerate particles representing NiS. The element of C, O, Ni and S exist in the NiS-rGO sample. The highest η of 1.04% and Jsc of 7.39 mA cm−2 were obtained from the device with 0.06 M NiCl2 which is due to the longest carrier lifetime. The work opens up the avenue of replacing costly platinum with NiS-rGO composite as counter electrode of the device.
Acknowledgments
This work was funded by Universiti Kebangsaan Malaysia (UKM) under research grant FRGS/1/2019/STG02/UKM/02/1 and GUP-2018-081.
Declaration of Competing Interest
The authors declare that they have no known competing financial interests or personal relationships that could have appeared to influence the work reported in this paper.
References
- Ceram. Int.. 2017;43:10174-10182.
- ChemSusChem. 2013;6:1316-1319.
- Nanoscale. 2014;6:477-482.
- Electrochim. Acta. 2015;156:138-146.
- Sol. Energy. 2020;197:546-552.
- Electrochim. Acta. 2018;269:119-127.
- Electrochem. Commun.. 2007;9:596-598.
- J. Power Sources. 2016;332:281-289.
- Ionics. 2018;24:3665-3671.
- Arabian J. Chem.. 2020;13:3383-3390.
- Scr. Mater.. 2010;62:148-150.
- Sci. Rep.. 2016;6:29207.
- J. Mater. Sci.: Mater. Electron.. 2017;28:1674-1678.
- J. New Mater. Electrochem. Syst.. 2018;21:113-117.
- Chem. Select. 2016;1:4814-4822.
- ACS Nano. 2010;4:6203-6211.
- Arabian J. Chem.. 2020;13:2414-2424.
- Russian J. Electrochem.. 2018;54:56-61.
- IEEE J. Photovolt.. 2017;7:792-801.
- ACS Appl. Mater. Interfaces. 2017;9:21406-21412.
- Mater. Lett.. 2016;106:200-203.
- J. Power Sources. 2014;263:246-251.
- RSC Adv.. 2016;6:15080-15086.
- J. Nanopart. Res.. 2018;20:110.


