

Translate this page into:
Nitrogen doped fluorescent carbon dots from Delonix regia for Fe(III) and cysteine sensing, DNA binding and bioimaging
⁎Corresponding authors. sheeb.che@voccollege.ac.in (Seth Sheeba Thavamani), peteramaladhas@gmail.com (Thomas Peter Amaladhas)
-
Received: ,
Accepted: ,
This article was originally published by Elsevier and was migrated to Scientific Scholar after the change of Publisher.
Abstract
The current work primarily deals with the synthesis of nitrogen rich carbon dots from Delonix regia along with characterisation using several analytical techniques for fluorescent sensing of Fe(III) and cysteine, electrochemical sensing of hydrogen peroxide and DNA binding. The average particle size of the spherical N-CDs is calculated to be 2.23 nm with a quantum yield of 33.5%. The SAED pattern from HR-TEM confirms the slight graphitisation of the N-CDs along with the amorphous carbon core. The synthesised N-CDs served as an efficient turn off sensor for Fe(III) with a detection limit of 5.76 × 10⁻⁷ M and turn on sensor for L-Cysteine with a detection limit of 3.76 × 10⁻⁴ M. The nature and extent of binding of the N-CDs with ctDNA was evaluated and the binding constant from the Benesi Hildebrand plot is calculated to be 6.49 (mg/mL)-1. The limit of detection was found to be 71 µM for electrochemical sensing of hydrogen peroxide. The less cytotoxic and excellent biocompatible nature of the N-CDs have been taken advantage to image L6 cells and SKMEL cells.
Keywords
Fluorescent carbon dots
Turn on–off sensors
H2O2 sensors
DNA binding
Biomarkers

1 Introduction
Carbon dots belong to a class of carbon nanomaterials with characteristic optical properties. The synthetic routes and the choice of carbon precursors play a vital role in the determination of the structure of the carbon nanomaterials along with the degree of carbonisation and reaction time. Dopants such as nitrogen, sulphur, fluorine, phosphorus and transition metals effectively alter the electronic structure and energy levels of carbon dots which directly enhance the photoluminescence intensity and quantum yield. Versatile carbon dots find applications in wider fields that are of much practical importance and industrial relevance such as in-vivo and in-vitro imaging of biological cells, photocatalysts for water splitting, energy conservation solar cells, drug designing, drug delivery, fluorescent sensors for the detection of heavy metals, metals that are of biological significance, amino acids and food adulterants (Ai et al., 2021; Al-Hashimi et al., 2020; Wang et al., 2022; Liu et al., 2021). The carbon precursor Delonix regia seeds are a storehouse of fatty acids such as linoleic acid, malvalic acid, sterculic acid, palmitic acid, myristic acid, oleic acid, stearic acid, amino acids such as γ-methyleneglutamine, trans-3-hydroxy-L-proline, γ-methyleneglutamic acid, sterols such as phytol, sitosterol, carbohydrates such as galactomannan and tannins such as propelargonidin and procyanidin (Modi et al., 2016). These constituents in the seeds of Delonix regia make it an ideal carbon precursor for the current study.
Iron is an essential for the optimal functioning of the human body. Iron serves as a cofactor in multiple heme proteins and non-heme iron-containing proteins in the human body. Heme proteins involve in oxygen binding and transport, oxygen metabolism, mitochondrial respiration and electron transport whereas non-heme proteins involve in steroid and DNA synthesis, cell proliferation, drug metabolism and gene regulation. The deficiency or excess of iron levels result in physiological disorders. Thus, it is necessary to monitor the iron levels in the human body. Fluorescent detection owing to advantages over other analytical techniques such as high sensitivity, quick response time, and simple sample preparation methods has gained popularity with time (Han et al., 2016; Yiannikourides and Latunde-Dada, 2019).
The study of interaction between DNA and target drug molecules holds primary importance for diagnostic purposes and for the design of drugs. An efficient DNA binding drug must have high binding constant (Li et al., 2022). The interaction of DNA with target molecules may involve external electrostatic binding, intercalation and groove binding. The binding interactions are studied by analysing the change in absorbance with respect to the change in concentration of carbon dots or the concentration of ctDNA with the help of UV–Visible spectrophotometer (Gracia et al., 2023).
Hydrogen peroxide holds primary significance as it is of prime importance in many food processing and clinical industries. Certain reports also claim the cytotoxic nature of hydrogen peroxide and demand the systematic removal by action of enzymes such as thioredoxin, peroxidase and catalase. Another aspect of caution is that hydrogen peroxide easily forms hydroxyl radicals on exposure to UV light thereby leading to oxidative stress, atherosclerosis, myocardial infarction, Alzheimer’s disease and DNA damage. Thus, selective and sensitive detection of hydrogen peroxide holds much relevance. High sensitivity, fast response time, and simple operational procedures draw huge research interests for the design of electrochemical sensors (Ma et al., 2020; Rahmati et al., 2020; Mohammad et al., 2020; Gowthaman et al., 2019).
The current work mainly focuses on the synthesis of N-CDs from the seeds of Delonix regia via hydrothermal treatment and systematic characterisation with different analytical techniques. The potential applications of the synthesised N-CDs as fluorescent sensors to detect Fe(III) and L-cysteine, as DNA binding agents, as electrochemical sensors for the detection of hydrogen peroxide and as biomarkers for biological cells are explored.
2 Experimental
2.1 Materials and methods
(NH4)2Fe(SO4)2·6H2O (SRL Chem, 99.9%), CoCl2·6H2O (SRL Chem, 99.0%), ZnCl2 (E. Merck, ≥95.0%), Cd(NO3)2·4H2O (Spectrum chemicals, 99.0%), NiCl2·6H2O (SRL chem, 99.0%), anhydrous FeCl3 (≥99.9%), anhydrous CrCl3 (99.9%), HgCl2 (≥99.5%), CuSO4·6H2O (≥98.0%), and Pb(NO3)2 (≥99.0%) were procured from Sigma Aldrich and used without further purification for metal sensing studies. Quinine sulphate (99.0%) for quantum yield measurement was obtained from Sigma Aldrich. Nitrogen dopant, ethylene diamine (99.5%) was purchased from SRL Chem and ctDNA for DNA binding studies was purchased from Sigma Aldrich and used without further purification. Disodium hydrogen phosphate (≥99.0%) and sodium dihydrogen phosphate (≥99.0%) were purchased from Sigma Aldrich for the preparation of phosphate buffer. Hydrogen peroxide (30%, Emparta grade), sodium chloride (Emparta grade, 99.0%) and Tris HCl (99.0%) were procured from Merck and used as received. HCl (0.1 M) and NaOH (0.1 M) solutions were used for pH adjustments. The entire course of the work was carried out with double distilled water.
2.2 Synthesis of N-CDs
The synthesis of N-CDs was carried out as follows; the seeds of Delonix regia were collected in bulk from the same tree from a local area in Tuticorin, Tamilnadu, India and finely powdered. The powder (0.4 g) along with 0.5 mL of ethylene diamine to a total volume of 30 mL was taken in a Teflon lined stainless steel autoclave of 50 mL capacity and the reaction was carried out at 180 °C for 6 h (Xu et al., 2015). The contents of the autoclave once naturally cooled were filtered with a Whatman filter paper No.1 (11 µm pore size). Cellulose nitrate membrane filter of 0.22 µm pore size was used for further purification and the resultant N-CDs were stored at 4 °C for further studies.
2.3 Characterisation of N-CDs
The optical and electronic properties of the synthesised N-CDs were analysed with the help of JASCO V-650 spectrophotometer and JASCO FP-8300 spectrofluorometer. Shimadzu FT-IR spectrophotometer in the range 400–4000 cm−1 was used to record the ATR-FTIR spectrum of the N-CDs. A drop of the synthesised N-CDs coated on the copper grid was let to air dry and HR-TEM analysis was carried out with Tecnai G2, F30 at an acceleration voltage of 200 kV. The elemental constituents of the N-CDs were analysed with the help of Bruker Nano, GmbH, D-12489 at an accelerating voltage of 30 kV. Electrochemical measurements were carried out with CHI 650C electrochemical workstation. Horiba scientific XploRa PLUS Raman microscope was used to record the Raman spectrum of the synthesised N-CDs. Cytotoxic studies were proceeded with the aid of a Labomed TCM-400 tissue culture microscope.
2.4 Calculation of quantum yield
For the calculation of quantum yield, quinine sulphate in 0.1 M H2SO4 was chosen as a standard. The quantum yield of quinine sulphate at 360 nm was reported to be 0.54 (n = 1.33) (Atchudan et al., 2018). The absorbance at wavelength 360 nm was kept under 0.1 for the concentrations studied, to minimise the interference of reabsorption. The quantum yield was calculated using Eq.1 (Hoan et al., 2019):
2.5 Fluorescence sensing of Fe(III)
The surface functional groups on the N-CDs exhibit certain degree of coordination towards different transition metal ions. The extent of coordination varies with different metal ions and this is observed to have a direct impact on the emission intensity of N-CDs. The selective coordination of different metal ions such as Cu(II), Zn(II), Cd(II), Cr(III), Fe(II), Fe(III), Co(II), Ni(II), Hg(II) and Pb(II) towards the surface functional groups of the synthesised N-CDs and its impact on the emission intensity was monitored. The metal ions at concentration of 8 × 10⁻⁴ M were added to the synthesised N-CDs in the ratio 4:1. The total volume was maintained at 1 mL and the spectra were recorded at 360 nm excitation wavelength after 2 min. The spectral measurements were recorded at pH 7, as the maximum emission of the synthesised N-CDs was observed at neutral pH.
2.6 Turn on fluorescence sensing of L-cysteine
The fluorescence revival studies were carried out in the presence of different amino acids such as L-arginine, L-cysteine, L-glycine, L-isoleucine, L-tyrosine and L-valine. The reaction mixture contained the synthesised N-CDs along with Fe(III) and amino acids in the volume ratio of 1:4:4 to a total volume of 2 mL. Of the studied amino acids, L-cysteine enhanced the emission intensity to a comparatively higher extent and therefore a turn on fluorescent sensor for L-cysteine was developed. The same procedure was repeated for different concentrations of L-cysteine and the limit of detection was calculated from Stern Volmer plot.
2.7 ctDNA binding studies
The extent of interaction between ctDNA and the synthesised N-CDs was studied with the help of UV–Visible spectrophotometer. The DNA solution was prepared by sonicating 10 mg of ctDNA along with 10 mL of 5 mM TrisHCl and 50 mM NaCl for 1 min. 30 such cycles were carried out for homogeneity (Gracia et al., 2022). The ratio of absorbance at 260 nm and 280 nm A260/A280 was 1.86, which indicated that the prepared DNA solution was free from other impurities (Jhonsi et al., 2018). For future use, the DNA stock solution was kept in a refrigerator.
The absorption measurements were done with constant ctDNA concentration and varied concentrations of the synthesised N-CDs to a total volume of 1 mL. pH 7 was maintained throughout the experiment. The absorption spectra were recorded after a uniform mixing period of 30 s. The binding constant was calculated from Benesi Hildebrand plot.
2.8 Electrochemical sensing of hydrogen peroxide
2.8.1 Fabrication of the N-CDs onto the GCE
The glassy carbon electrode was first cleaned thoroughly with emery paper and rinsed with double distilled water. The N-CDs modified glassy carbon electrode was fabricated by self-assembling the N-CDs for three hours which served as a working electrode. Michael’s addition of amine groups to the double bonds on the glassy carbon electrode is responsible for the attachment of N-CDs to the GCE (Gowthaman et al., 2017). Platinum wire served as the counter electrode whereas KCl saturated Ag/AgCl served as the reference electrode. The electrocatalytic activity of the synthesised N-CDs was first monitored with CV at a scan rate of 0.05 V/s. The modified glassy carbon electrode was then used for the sensing of hydrogen peroxide (Zhang et al., 2016).
2.8.2 Hydrogen peroxide sensing
For the electrochemical sensing of hydrogen peroxide, various concentrations of hydrogen peroxide were added to 5 mL phosphate buffer of pH 7.2. The change in current was recorded in Differential Pulse Voltammetry (DPV). The DPV measurements were done with a pulse width, amplitude, sampling width and pulse period of 0.06 s, 0.05 V, 0.02 s and 0.5 s respectively.
2.9 Cell viability assay
The synthesised N-CDs were first prepared in DMEM media (100 mg/mL) for the evaluation of their cytotoxic effects on the SKMEL cell line (Human Skin Cancer) and L6 cell line (Rat Skeletal Muscle). Further dilutions were carried out and seeds were sown into the wells containing the cultivated cells at final concentrations of 6.25 µg, 12.5 µg, 25 µg, 50 µg, and 100 µg. With untreated wells acting as the control, the absorbance at 570 nm was measured.
2.10 Bio-imaging
The characteristic tendency of the synthesised N-CDs to exhibit fluorescence was extended to image SKMEL and L6 cell lines. The cells were grown in Dulbecco's Modified Eagles Medium (DMEM-Himedia), which was enhanced with a 10% heat inactivated Fetal Bovine Serum (FBS) containing Penicillin (100 µg/mL), Amphotericin B (2.5 µg/mL) and Streptomycin (100 µg/mL) and a 1% antibiotic cocktail. Fluorescence microscopy was used to image the synthesised N-CDs after an hour of incubation with the pre-treated cells at 550 nm excitation wavelength.
3 Results and discussions
3.1 Characterisation of the synthesised N-CDs
The optical and electronic properties of the synthesized N-CDs were characterized with the help of UV–Visible spectroscopy and fluorescence spectroscopy. The absorption peaks are strongly dependent on the synthetic procedure and the surface functional groups of the N-CDs. Fig. 1a represents the UV–Visible spectrum of the synthesized N-CDs. The peaks at 274 nm and 338 nm correspond to π-π* and n-π* electronic transitions respectively (Kaur and Verma, 2022). The π-π* transition is ascribed to the aromatic sp2 domains and the n-π* transition arises due to the presence of heteroatom rich functional groups on the surface of the synthesized N-CDs. The synthesis of carbon dots involves carbonization, dehydration and polymerization steps that occur during the course of the hydrothermal treatment leading to the formation of a carbon core with surface functional groups that are responsible for the π-π* and n-π* electronic transitions. Photoluminescence is a characteristic trait of the carbon dots and the synthesized N-CDs exhibit excitation dependent emission as represented in Fig. 1b. On variation of excitation wavelength from 300 to 360 nm, a gradual increase in emission intensity is observed, which is further followed by a mild decrease in intensity accompanied by a slight red shift. The maximum excitation wavelength corresponds to 360 nm with the emission maximum corresponding to 444 nm. The exact mechanism of the photoluminescence is still ambiguous due to the diverse and complex structure of the carbon dots (Zhi et al., 2019). However, presence of different particle sizes, surface energy states, defects, band gap transitions related to conjugated π domains, quantum size effect and energy transfer are all attributed to the excitation dependent emission nature of the synthesized N-CDs (Zhu et al., 2015; Shen et al., 2018; Nair et al., 2020). The emissive properties of N-CDs from each batch of synthesis showed the same intensity within an error of 2%. Quantum yield is another parameter that quantifies efficiency of the carbon dots. Doping with heteroatoms in particular is found to enhance the quantum yield and overall efficiency of the carbon dots. Nitrogen with similar size to that of carbon is found to be an effective dopant among the other dopants such as sulphur, phosphorus, boron and other metals. The fluorescence intensity of N-CDs is 84% higher than that of undoped CDs. Also, the quantum yield of N-CDs is calculated to be 33.5% whereas the quantum yield of undoped carbon dots is 12.9% (Atchudan et al., 2021). Thus the overall efficiency of the CDs enhances on nitrogen doping.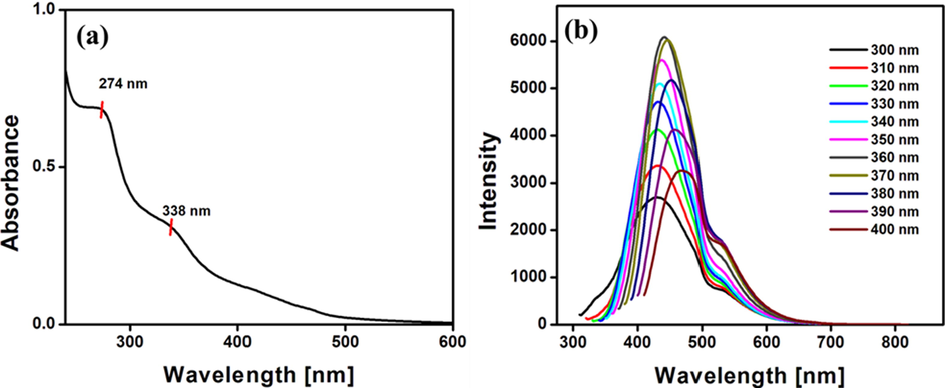
(a) Absorption spectrum of N-CDs and (b) Fluorescence spectra of the N-CDs at various excitation wavelengths.
Fig. 2 represents the FT-IR spectrum of the synthesised N-CDs. The spectrum reveals the presence of abundant polar surface functional groups, which enhance the hydrophilic nature of the synthesised N-CDs. The vibrational bands at 3478 cm−1 and 1640 cm−1 correspond to –OH stretching and C = O stretching respectively. Bands at 2306 cm−1, 1384 cm−1 and 1143 cm−1 correspond to C–H stretching, C-N/N–H stretching and C-O stretching vibrations respectively. The bands observed at 1086 cm−1 and 611 cm−1 are associated with C–H bending (Zulfajri et al., 2019; Han et al., 2019; Edison et al., 2020).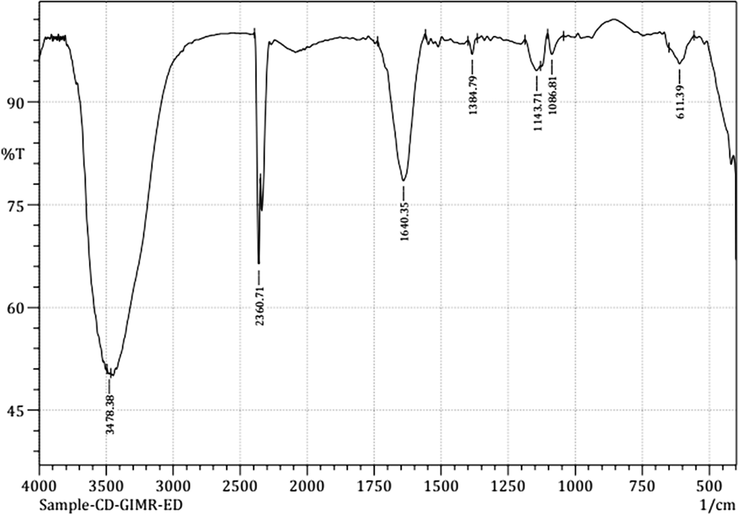
FT-IR spectrum of the synthesised N-CDs.
The morphology and particle size of the synthesised N-CDs are analysed with the help of HR-TEM. The HR-TEM images of the synthesised N-CDs are represented in Fig. 3. The synthesised N-CDs are spherical with an average particle size of about 2.23 nm. Lattice fringes are visible clearly as in Fig. 3b. The SAED pattern confirms the slight crystalline nature of the synthesised N-CDs (Liu et al., 2017; Pal et al., 2018).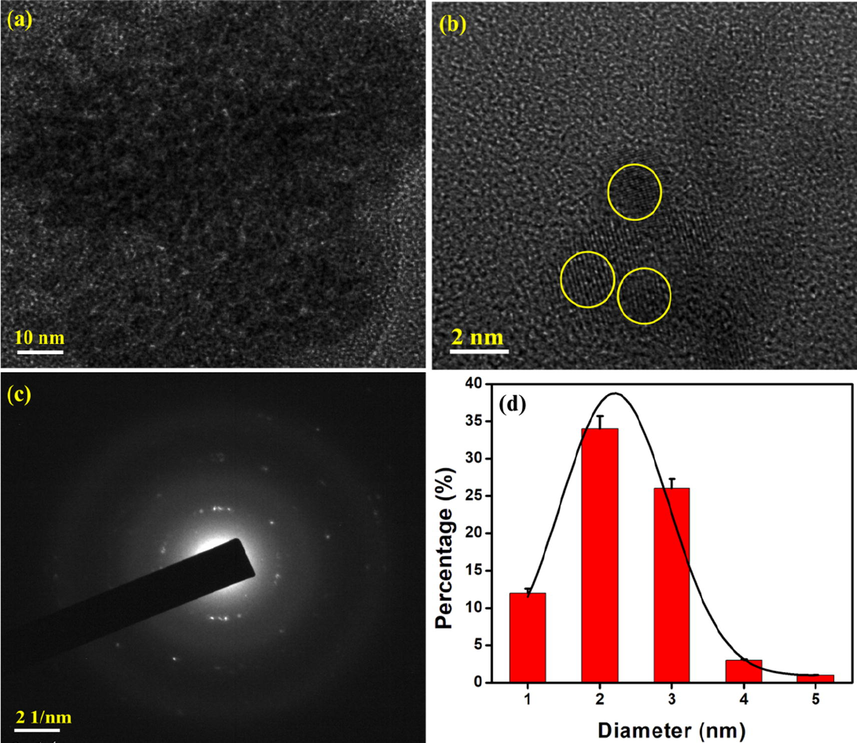
HR-TEM analysis of N-CDs (a-b) HR-TEM images (c) SAED pattern and (d) particle size distribution.
Fig. 4 represents the EDX spectrum of the synthesised NCDs. Energy dispersive X-ray Analysis (EDX) aids in confirming the constituent elements of the synthesised NCDs. The elemental constituents of NCDs are carbon (44.57%), nitrogen (27.43%) and oxygen (28.00%). This confirms the successful doping of nitrogen into the carbon dots that accounts for the increased efficiency of the NCDs.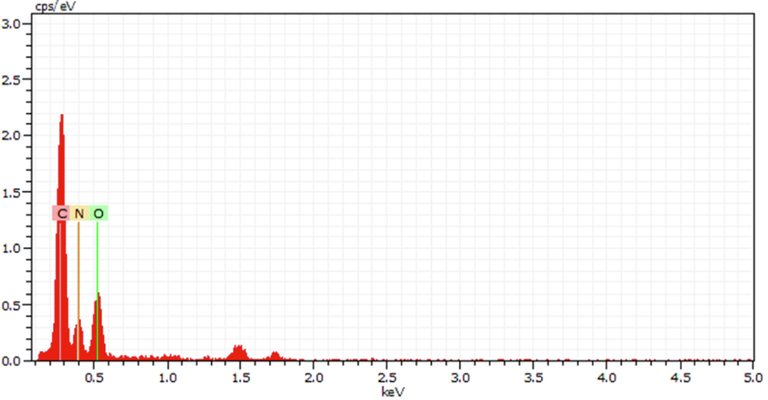
EDX spectrum of the synthesised NCDs.
Raman studies provide vital information with respect to the composition and structure of compounds. Fig. 5 represents the Raman spectrum of the synthesised NCDs. Bands at 1342 cm−1 and 1544 cm−1 correspond to D band and G band respectively. The broad peak at 1438 cm−1 corresponds to the amorphous carbon present on the surface of the synthesised N-CDs (Shimodaira and Masui, 2002; Li et al., 2020; Ye et al., 2019). The surface defects on the synthesised N-CDs are the result of nitrogen doping (Wu et al., 2018). The G band contributes to the in-plane vibrations of sp2 hybridisation of the synthesised N-CDs and the D band corresponds to the sp3 hybridised carbon. The ratio of ID/IG corresponds to the sp3/sp2 carbon ratio and it is calculated to be 0.68. The decrease in ratio indicates coexistence of both sp3 and sp2 carbon atoms with slight graphitic nature (Chandrasekaran et al., 2020). This substantiates the existence of amorphous nature of the carbon dots with slight graphitisation from HR-TEM.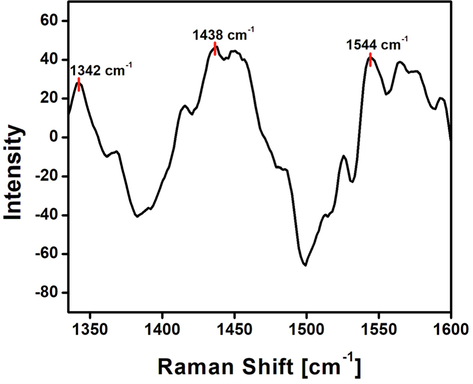
Raman spectrum of the synthesised NCDs.
The emission intensity of the synthesised N-CDs at different pH were analysed as represented in Fig. 6a. It is observed that the synthesised N-CDs are sensitive to pH and maximum fluorescence intensity is observed at neutral pH. The protonation and deprotonation of the functional groups are the reasons for the change in emission intensity at both acidic and basic conditions. At lower pH values, protonation of functional groups occurs which results in intramolecular hydrogen bonding. This leads to the aggregation of N-CDs accompanied by the loss of fluorescence intensity. The negative charges from the deprotonated functional groups at higher pH result in the formation of an anionic layer on the surface of the synthesised N-CDs. This disrupts the origin of fluorescence thereby decreasing its emission intensity. The maximum and stable emission intensity over the neutral pH range makes the synthesised N-CDs potential probes for imaging and other biological applications.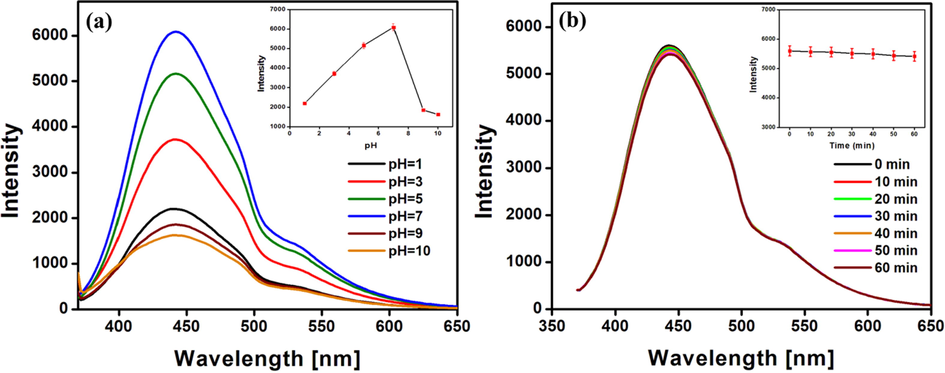
Effect of (a) pH and (b) time on the fluorescence intensity of N-CDs.
On continuous irradiation with Xenon lamp for about 60 min, the emission intensity of the synthesised N-CDs is found to remain constant with no evident change as depicted in Fig. 6b. The synthesised N-CDs exhibited excellent stability and resistance to photobleaching for a period of six months without any decrease in the emission intensity when stored at 4 °C.
3.2 Turn off fluorescent sensor
Surface functionalization of carbon dots results in highly selective binding sites that are very specific to different analytes. The emission intensity of carbon dots is either quenched or enhanced as a result of their interaction with the analytes. The specific interaction between carbon dots and the desired analyte chosen for the study helps in the design of highly sensitive fluorescent sensors. A range of transition metals were chosen to analyse the selectivity of the synthesised N-CDs towards specific metal ions as shown in Fig. 7a. Among the metal ions chosen for the study, Fe(III) is found to quench the emission intensity of the synthesised N-CDs to a greater extent, indicating a stronger affinity of the surface functional groups of NCDs towards Fe(III) (Shah et al., 2019; Deng et al., 2021). The resultant NCD- Fe(III) complex results in the transfer of electrons from N-CDs to the empty orbitals of Fe(III) complex. This leads to the decrease in the emission intensity (Chen et al., 2017). Also, with the increase in concentration of the Fe(III), the emission intensity of the synthesised N-CDs kept gradually decreasing as shown in Fig. 7c. Linearity in the concentration range of 8 × 10⁻⁷ M to 80 × 10-7 M is observed from the Stern Volmer plot with a regression coefficient of 0.99 as shown in Fig. 7d. The detection limit calculated from Eq. (2) is found to be 5.76 × 10⁻⁷ M. The detection limit is comparable to existing reports (Atchudan et al., 2018).
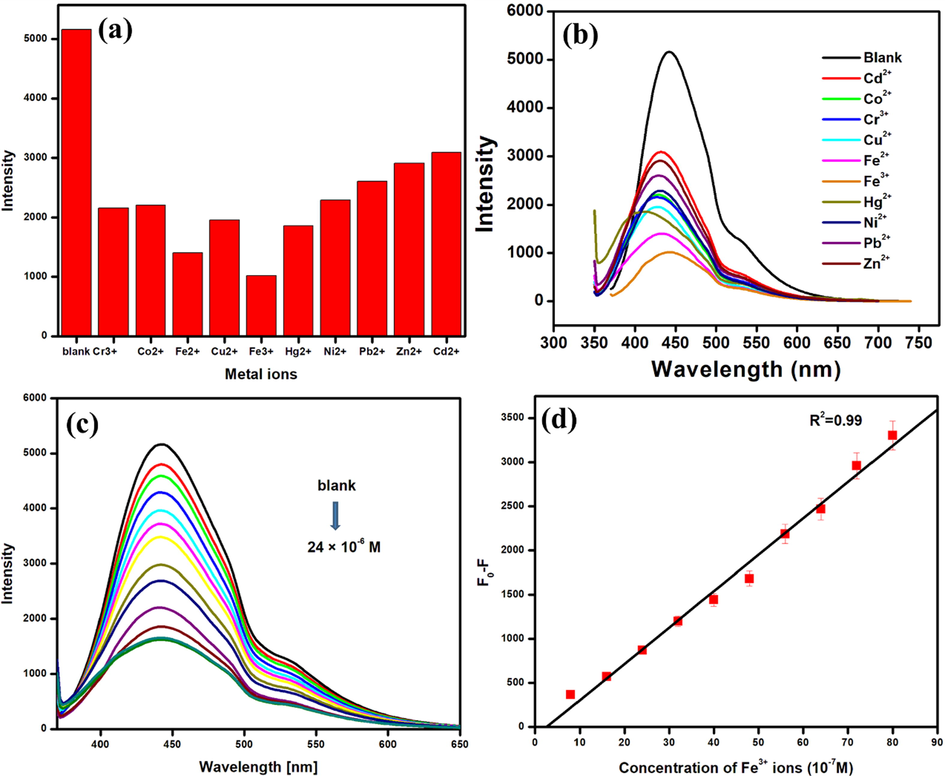
(a) A bar plot of the emission intensity N-CDs Vs various metal ions at 8 × 10⁻⁴ M concentration, (b) Emission spectrum of N-CDs in the presence of different metal ions (c) Fluorescence spectra of the N-CDs with Fe(III) ions in the concentration range 8 × 10⁻⁸ M to 2.4 × 10⁻⁵ M, and (d) The Stern-Volmer plot of F0-F Vs the concentration of Fe(III) ions.
FT-IR is used to confirm the coordination between the synthesised NCDs and Fe(III) as given in ESI S1. The interaction between surface functional groups of N-CDs and Fe(III) is suggested by the clear modifications observed in the vibrational bands of N-CDs and the NCD- Fe(III) complex. A slight shift in the wavenumbers corresponding to hydroxyl and carbonyl functional groups suggests a possible coordination of Fe(III) with them. The FT-IR spectrum of NCD- Fe(III) complex exhibited additional vibrational bands at 1510 cm−1, 1214 cm−1, 989 cm−1, 868 cm−1, 696 cm−1 and 517 cm−1 which correspond to symmetrical C-O stretching, –COOH, Fe-O bending vibration (indicating the substitution of hydroxyl groups), Fe-O stretching vibration, Fe-C and NH2 modes (Rath et al., 2000; Gladysz et al., 1979; Kurtikyan and Ford, 2008; Boffi et al., 1997; Carabante et al., 2009; Kamnev et al., 1999). Thus, FT-IR bands confirm the stronger coordination of Fe(III) to the surface functional groups resulting in the quenching of emission intensity. The mechanism of quenching can be predicted with the help of UV–Visible spectroscopy. No significant shift in absorbance peaks is observed for both NCDs and NCD- Fe(III) complex as given in ESI S2. This suggests that a nonfluorescent complex forms in the ground state when the N-CDs and Fe(III) interact, thereby resulting in static quenching. Thus, the strong interaction of Fe(III) with the surface functional groups of NCDs and the formation of a complex at the ground state are responsible for the quenching of the emission intensity (Zu et al., 2017).
3.3 Turn on fluorescent sensor
The favourable redox reaction between the thiol group of L-cysteine and Fe(III) ions were taken advantage of to design a turn on fluorescent sensor for L-cysteine. The emission intensity of the NCD- Fe(III) complex in presence of L-cysteine is observed to be directly proportional to the concentration of L-cysteine (Gracia et al., 2023). The concentration variations were made between 8 × 10⁻⁸ M to 2.8 × 10⁻⁴ M as in Fig. 8a. Linearity is observed in the range 8.0 × 10⁻⁸ M to 4.0 × 10⁻⁵ M with a regression coefficient of 0.99 as in Fig. 8b and the limit of detection is calculated to be 3.76 × 10⁻⁴ M.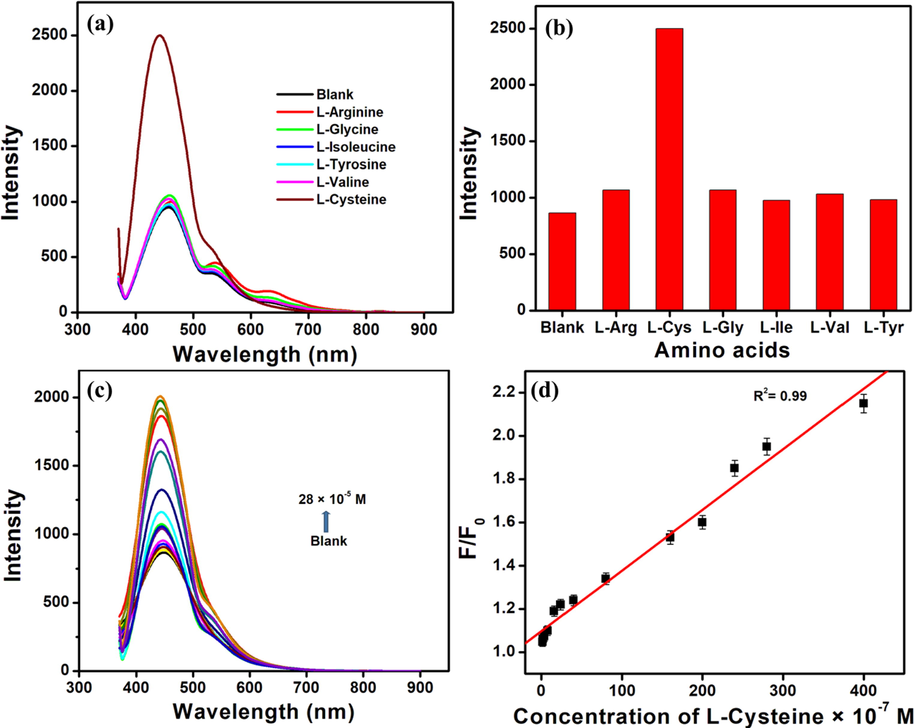
(a) The emission spectra of NCD - Fe(III) complex in the presence of different amino acids (b) The bar plot of intensity Vs the NCD - Fe(III) complex in the presence of different amino acids (c) The emission spectra of NCD - Fe(III) complex in the presence of varying concentrations of L-Cysteine (d) The Stern-Volmer plot of F/F0 Vs the concentration of L-Cysteine.
The redox reaction between the L-cysteine and Fe(III) results in the reduction of Fe(III) to Fe(II) with the oxidation of L-cysteine (Gracia et al., 2023). The FT-IR spectrum of NCD-Fe(III)-cysteine is given in ESI S3. The vibrational bands at 2886 cm−1, 1510 cm−1, 1363 cm−1, 1201 cm−1, 703 cm−1 and 518 cm−1 correspond to CH2-S asymmetric stretching vibration, symmetric vibration of COO– group, C–C stretching vibration, CH2 wagging, C-S stretching vibration and S-S stretching vibration respectively. (Manivannan et al., 2018; Chandran et al., 2015; Selvaraju et al., 2007). S-S stretching vibration corresponding to cystine confirms the oxidation of cysteine to cystine.
3.4 DNA binding
Drug interactions with DNA are crucial for both therapeutic and diagnostic purposes. Design and usage of drugs primarily depend on the binding mechanism, kinetics of binding, and rate of association and dissociation. Molecules interact with DNA via non-covalent interactions such as intercalation, groove binding, covalent binding and external electrostatic binding (Oliveira et al., 2019). Also intercalative binding results in hyperchromic or hypochromic effects (Jhonsi et al., 2018).
From Fig. 9a, it is evident that an increase in absorbance is observed with the increase in the concentration of the synthesised N-CDs. The extent of interaction between ctDNA and N-CDs is calculated in terms of binding constant from the Benesi-Hildebrand equation as shown in Fig. 9b. It is calculated to be 6.49 (mg/mL)-1 which is comparable with the existing reports (Jhonsi et al., 2018; Gracia et al., 2023). The hyperchromic effect and slight red shift indicate an intercalative interaction between ctDNA and N-CDs (Zu et al., 2017; Velammal et al., 2016).
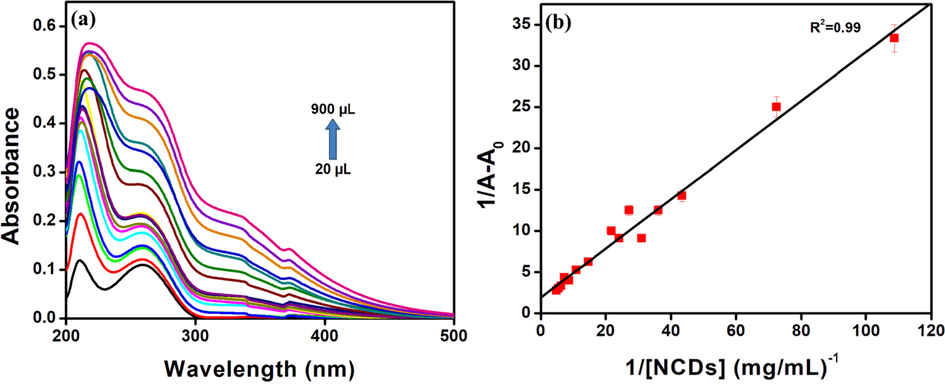
(a) Absorption spectra of ct-DNA with the synthesised N-CDs and (b) Benesi-Hildebrand plot for ct-DNA with N-CDs.
3.5 Cyclic voltammetry
After self-assembling the synthesised N-CDs [N-CDs/GCE] for three hours, the CV scans were run in a phosphate buffer at pH 7. The CV profile of GCE shows a cathodic peak at −0.75 V with −1.42 × 10⁻⁵ A whereas N-CDs/GCE exhibits a cathodic peak at −0.78 V with −8.8 × 10⁻⁶ A as shown in Fig. 10. The increase in current for the N-CDs/GCE confirms the successful attachment of the N-CDs on the GCE and their potential electrochemical activity (Bai et al., 2016). The enhanced current is also attributed to the surface defects present on the synthesised N-CDs (Ye et al., 2019).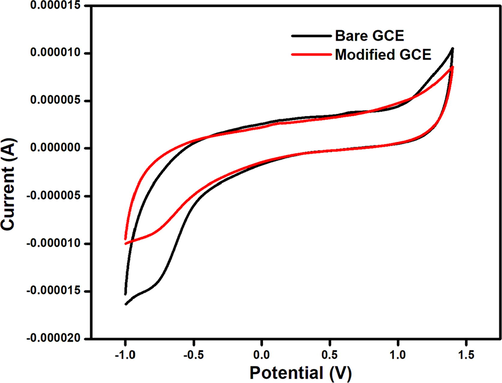
Cyclic Voltammetry profile of bare GCE and N-CDs/GCE.
3.5.1 Electrochemical sensing of hydrogen peroxide
The surface functional groups on the surface of the N-CDs are responsible for the effective reduction reactions of hydrogen peroxide as they increase the adsorption energy of hydrogen peroxide (Fu et al., 2018). Fig. 11a shows the DPV curves of N-CDs/GCE at different concentrations of hydrogen peroxide. The current is observed to increase with the increase in concentration of hydrogen peroxide in the range 9.99 µM to 49.8 µM with a regression coefficient of 0.98 as shown in Fig. 11b. The limit of detection is calculated to be 71 µM which is comparable with existing reports (Sheng et al., 2017; Gowthaman et al., 2016). The reduction of hydrogen peroxide with N-CDs/GCE adopts an adsorption mechanism as given in scheme 1 (Gu et al., 2020).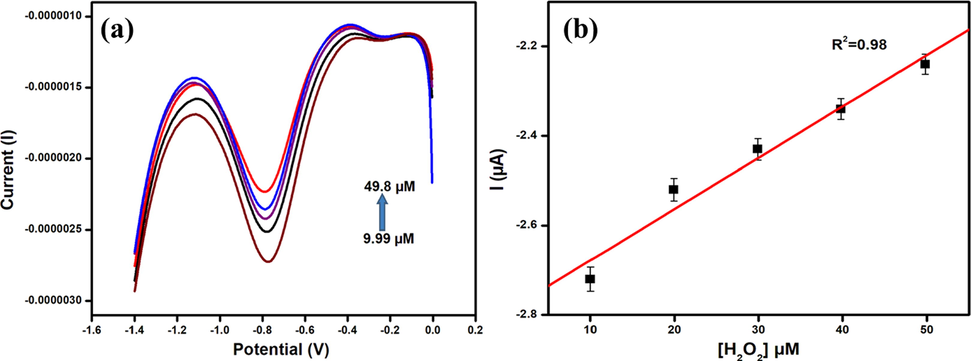
(a) DPV curves of N-CDs/GCE in the presence of different concentrations of hydrogen peroxide (b) Plot of hydrogen peroxide reduction peak current Vs the concentration of hydrogen peroxide.
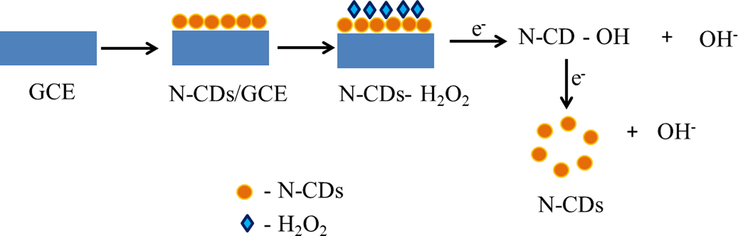
Schematic representation of the mechanism of electrochemical reduction of hydrogen peroxide with N-CDs/GCE.
The reduction of hydrogen peroxide involves the (i) adsorption of hydrogen peroxide on the N-CDs/GCE (ii) single electron transfer in two stages resulting in the formation of two hydroxyl ions as represented in scheme 1.
3.6 Cytotoxicity
Cytotoxicity is a vital parameter that is to be taken into consideration for in vivo studies as it has direct impact on the diseased as well as normal cells. Cell damage may occur through a number of ways such as cell membrane destruction, protein synthesis prevention, inhibition of polydeoxynucleotide elongation and irreversible binding to receptors. To identify the extent of cell damage, it is necessary for a cheap, ideal and reliable cytotoxicity assay. The cytotoxicity assays are based on a number of functions of the cells such as cell membrane permeability, ATP production, nucleotide uptake activity and enzyme activity. Of all the cytotoxicity assays known till date, MTT assay is superior as it is safe and highly reproducible (Aslantürk et al., 2018). An ideal biological probe must be less toxic with excellent biocompatibility towards normal cells. Rat skeletal muscle L6 cell lines and human skin cancer SKMEL cell lines are chosen to evaluate the cytotoxic effects of the synthesized N-CDs. From the results, it is evident that the synthesized N-CDs are found to exhibit excellent biocompatibility with normal L6 cells with cell viability of about 98% whereas the synthesized N-CDs inhibit the SKMEL cells to an extent of 49.77% as given in Fig. 12. The excellent biocompatible nature of the synthesized N-CDs enables them to be suitable probes for their extension as biomarkers.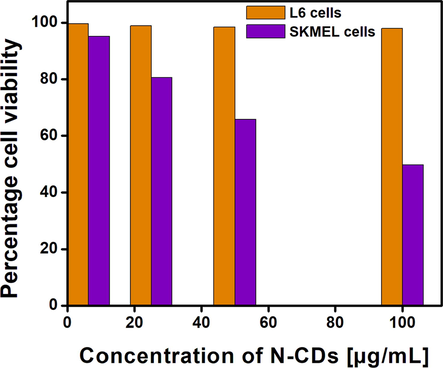
Cytotoxicity evaluation of N-CDs by MTT assay.
3.7 Bioimaging
Carbon dots serve as an excellent fluorescent probe to image cells in comparison to other fluorescent organic dyes as the later post hazardous effect on the biological cells. The synthesized N-CDs exhibit bright green fluorescence when incubated with L6 cells and SKMEL cells for 24 h at 460 nm excitation wavelength. Excitation wavelength dependent emission is held responsible for the multicolour emission.
No evident distortion in the morphology and cell death is observed on internalization of the synthesized N-CDs with L6 cells as given in Fig. 13b. In case of SKMEL cells, the synthesized N-CDs penetrate much deeper in comparison to the L6 cells as given in Fig. 13d. The capacity of N-CDs for targeted imaging, resistance to photobleaching, lack of toxicity to healthy cells and unique affinity for various cellular structures increases their potential as biosensors and in the field of targeted drug delivery (Wang et al., 2020; Jorns and Pappas, 2021).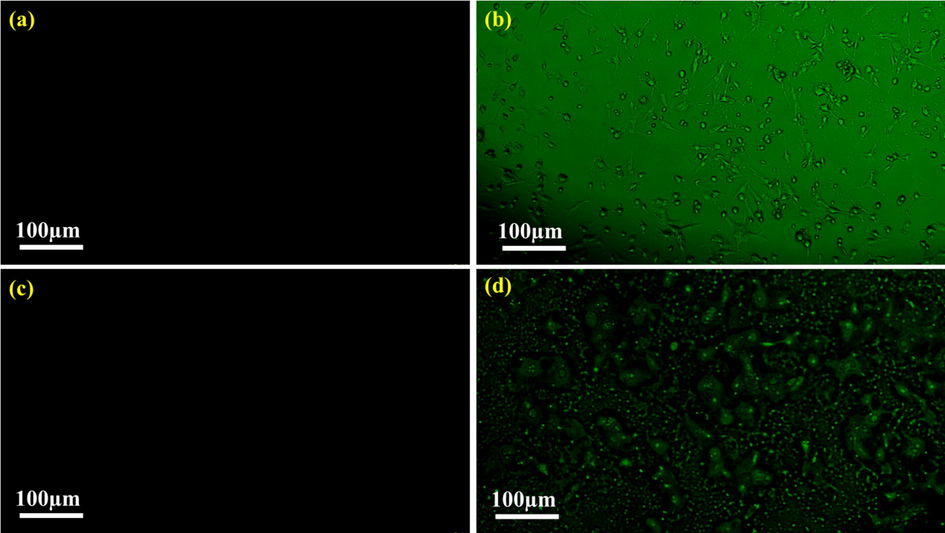
Fluorescence microscope images (a) L6 cells in the absence of N-CDs, (b) L6 cells in the presence of N-CDs, (c) SKMEL cells in the absence of N-CDs and (d) SKMEL cells in the presence of N-CDs.
4 Conclusions
This work highlights a simple, economic and eco-friendly synthesis of N-CDs from Delonix regia seeds via hydrothermal treatment. Enhanced optical and electronic properties on nitrogen doping, morphological attributes and bonding nature of the N-CDs were confirmed with analytical techniques. Besides, the synthesised N-CDs turned out to be efficient turn off and turn on fluorescent sensors for Fe(III) and cysteine with appreciable detection limit. The N-CDs also exhibited intercalative interaction with ctDNA and functioned as electrochemical sensors for the detection of hydrogen peroxide, biomarkers to image L6 and SKMEL cells. Thus, the reported work holds significant practical relevance and can be extended to real life analysis.
Acknowledgement
The authors express their sincere appreciation to the Researchers Supporting Project Number (RSP2023R398) King Saud University, Riyadh, Saudi Arabia. The authors acknowledge IIT Bombay SAIF for HR-TEM analysis and The Gandhigram Rural Institute - Deemed to be University for the EDX analysis.
Declaration of Competing Interest
The authors declare that they have no known competing financial interests or personal relationships that could have appeared to influence the work reported in this paper.
References
- Insights into photoluminescence mechanisms of carbon dots: advances and perspectives. Sci. Bull.. 2021;66:839-856.
- [CrossRef] [Google Scholar]
- Inner filter effect (IFE) as a simple and selective sensing platform for detection of tetracycline using milk-based nitrogen-doped carbon nanodots as fluorescence probe. Arab. J. Chem.. 2020;13:5151-5159.
- [CrossRef] [Google Scholar]
- Aslantürk, Ö.S., Larramendy, M., Soloneski, S., 2018. S.Soloneski, Genotoxicity—A predictable risk to our actual world. In Vitro Cytotoxicity and Cell Viability Assays: Principles, Advantages, and Disadvantages. 1-19. doi: 10.5772/intechopen.71923.
- Hydrothermal conversion of Magnolia liliiflora into nitrogen-doped carbon dots as an effective turn-off fluorescence sensing, multi-colour cell imaging and fluorescent ink. Colloids Surf. B. 2018;169:321-328.
- [CrossRef] [Google Scholar]
- Leftover kiwi fruit peel-derived carbon dots as a highly selective fluorescent sensor for detection of ferric ion. Chemosensors. 2021;9:166.
- [CrossRef] [Google Scholar]
- Carbon dots-decorated multiwalled carbon nanotubes nanocomposites as a high-performance electrochemical sensor for detection of H2O2 in living cells. Anal. Bioanal. Chem.. 2016;408:4705-4714.
- [CrossRef] [Google Scholar]
- Stereochemistry of the Fe (II)− and Fe (III)− cyanide complexes of the homodimeric Scapharca inaequivalvis hemoglobin. A resonance raman and FTIR study. Biochemistry. 1997;36:4505-4509.
- [CrossRef] [Google Scholar]
- Adsorption of As (V) on iron oxide nanoparticle films studied by in situ ATR-FTIR spectroscopy. Colloids Surf. A Physicochem. Eng. Asp.. 2009;346:106-113.
- [CrossRef] [Google Scholar]
- Crystal growth, spectral, optical, laser damage, photoconductivity and dielectric properties of semiorganic l-cystine hydrochloride single crystal. Spectrochim. Acta A Mol. Biomol. Spectrosc.. 2015;151:432-437.
- [CrossRef] [Google Scholar]
- Ecofriendly synthesis of fluorescent nitrogen-doped carbon dots from Coccinia grandis and its efficient catalytic application in the reduction of methyl orange. J. Fluoresc.. 2020;30:103-112.
- [CrossRef] [Google Scholar]
- Red-emissive carbon dots for fingerprints detection by spray method: coffee ring effect and unquenched fluorescence in drying process. ACS Appl. Mater. Interfaces. 2017;9:18429-18433.
- [CrossRef] [Google Scholar]
- Eco friendly synthesis of fluorescent carbon dots for the sensitive detection of ferric ions and cell imaging. Arab. J. Chem.. 2021;14:103195
- [CrossRef] [Google Scholar]
- Facile hydrothermal synthesis of nitrogen rich blue fluorescent carbon dots for cell bio-imaging of Candida albicans. Process Biochem.. 2020;88:113-119.
- [CrossRef] [Google Scholar]
- A glassy carbon electrode modified with N-doped carbon dots for improved detection of hydrogen peroxide and paracetamol. Microchim. Acta. 2018;185:1-7.
- [CrossRef] [Google Scholar]
- Adduct formation and further reactivity of iron carbonyl complexes introduced into a zeolite matrix. Inorg. Chem.. 1979;18:553-558.
- [CrossRef] [Google Scholar]
- Tuning the composition of gold–silver bimetallic nanoparticles for the electrochemical reduction of hydrogen peroxide and nitrobenzene. RSC Adv.. 2016;6:63433-63444.
- [CrossRef] [Google Scholar]
- Fabrication of nitrogen-doped carbon dots for screening the purine metabolic disorder in human fluids. Biosens. Bioelectron.. 2017;94:30-38.
- [CrossRef] [Google Scholar]
- Free-standing Au-Ag nanoparticles on carbon cloth: A non-enzymatic flexible electrochemical sensor for the biomarker of oxidative stress. Appl. Surf. Sci.. 2019;495:143550
- [CrossRef] [Google Scholar]
- Valorisation of bio-derived fluorescent carbon dots for metal sensing, DNA binding and bioimaging. Chemosphere. 2022;298:134128
- [CrossRef] [Google Scholar]
- Bio-derived fluorescent carbon dots for metal sensing and DNA binding applications. ChemistrySelect. 2023;8:e202204583.
- [CrossRef] [Google Scholar]
- Non-enzymatic electrochemical detection of hydrogen peroxide on highly amidized graphene quantum dot electrodes. Appl. Surf. Sci.. 2020;528:146936
- [CrossRef] [Google Scholar]
- Highly fluorescent carbon dots as selective and sensitive “on-off-on” probes for iron(III) ion and apoferritin detection and imaging in living cells. Biosens. Bioelectron.. 2016;83:229-236.
- [CrossRef] [Google Scholar]
- One-pot hydrothermal synthesis of nitrogen and sulfur co-doped carbon dots and their application for sensitive detection of curcumin and temperature. Microchem. J.. 2019;146:300-308.
- [CrossRef] [Google Scholar]
- Green synthesis of highly luminescent carbon quantum dots from lemon juice. J. Nanotechnol.. 2019;2019
- [CrossRef] [Google Scholar]
- Antimicrobial activity, cytotoxicity and DNA binding studies of carbon dots. Spectrochim. Acta A Mol. Biomol. Spectrosc.. 2018;196:295-302.
- [CrossRef] [Google Scholar]
- A review of fluorescent carbon dots, their synthesis, physical and chemical characteristics, and applications. Nanomaterials. 2021;11:1448.
- [CrossRef] [Google Scholar]
- Mössbauer and FTIR spectroscopic studies of iron anthranilates: coordination, structure and some ecological aspects of iron complexation. J. Mol. Struct.. 1999;482:703-711.
- [CrossRef] [Google Scholar]
- Converting fruit waste into carbon dots for bioimaging applications. Mater. Today Sustain.. 2022;18:100137
- [CrossRef] [Google Scholar]
- FTIR and optical spectroscopic studies of the reactions of heme models with nitric oxide and other NOx in porous layered solids. Coord. Chem. Rev.. 2008;252:1486-1496.
- [CrossRef] [Google Scholar]
- Constructing Fe-MOF-derived Z-scheme photocatalysts with enhanced charge transport: nanointerface and carbon sheath synergistic effect. ACS Appl. Mater. Interfaces. 2020;12:25494-25502.
- [CrossRef] [Google Scholar]
- Mn, B, N co-doped graphene quantum dots for fluorescence sensing and biological imaging. Arab. J. Chem.. 2022;15:103856
- [CrossRef] [Google Scholar]
- Highly crystalline carbon dots from fresh tomato: UV emission and quantum confinement. Nanotechnology. 2017;28:485705
- [CrossRef] [Google Scholar]
- Carbon dots-oriented synthesis of fungus-like CoP microspheres as a bifunctional electrocatalyst for efficient overall water splitting. Carbon. 2021;182:327-334.
- [CrossRef] [Google Scholar]
- Amplified electrochemical hydrogen peroxide sensing based on Cu-porphyrin metal–organic framework nanofilm and G-quadruplex-hemin DNAzyme. ACS Appl. Mater. Interfaces. 2020;12:58105-58112.
- [CrossRef] [Google Scholar]
- Studies on L-cystine hydrobromide single crystals for nonlinear optical applications. J. Taibah Univ. Sci.. 2018;12:64-68.
- [CrossRef] [Google Scholar]
- Delonix regia: historic perspectives and modern phytochemical and pharmacological researches. Chin. J. Nat. Med.. 2016;14:31-39.
- [CrossRef] [Google Scholar]
- Na, O-co-doped-graphitic-carbon nitride (Na, Og-C3N4) for nonenzymatic electrochemical sensing of hydrogen peroxide. Appl. Surf. Sci.. 2020;525:146353
- [CrossRef] [Google Scholar]
- Natural carbon-based quantum dots and their applications in drug delivery: A review. Biomed. Pharmacother.. 2020;132:110834
- [CrossRef] [Google Scholar]
- New voltammetric and spectroscopic studies to quinacrine-DNA-Cdots interaction. Electrochim. Acta. 2019;306:122-131.
- [CrossRef] [Google Scholar]
- Facile and green synthesis of multicolor fluorescence carbon dots from curcumin: in vitro and in vivo bioimaging and other applications. ACS Omega. 2018;3:831-843.
- [CrossRef] [Google Scholar]
- Hierarchical hollow sea-urchin-like Ni–Co diselenide encapsulated in N-doped carbon networks as an advanced core-shell bifunctional electrocatalyst for fabrication of nonenzymatic glucose and hydrogen peroxide sensors. Sens. Actuators B Chem.. 2020;324:128730
- [CrossRef] [Google Scholar]
- Surface chemical studies on pyrite in the presence of polysaccharide-based flotation depressants. J. Colloid Interface Sci.. 2000;229:82-91.
- [CrossRef] [Google Scholar]
- L-Cystine hydrochloride: a novel semi-organic nonlinear optical material for optical devices. Opt. Commun.. 2007;269:230-234.
- [CrossRef] [Google Scholar]
- Single precursor-based luminescent nitrogen-doped carbon dots and their application for iron (III) sensing. Arab. J. Chem.. 2019;12:1083-1091.
- [CrossRef] [Google Scholar]
- Organelle-targeting surface-enhanced Raman scattering (SERS) nanosensors for subcellular pH sensing. Nanoscale. 2018;10:1622-1630.
- [CrossRef] [Google Scholar]
- Ni doped Ag@ C core–shell nanomaterials and their application in electrochemical H2O2 sensing. Anal. Methods. 2017;9:163-169.
- [CrossRef] [Google Scholar]
- Raman spectroscopic investigations of activated carbon materials. J. Appl. Phys.. 2002;92:902-909.
- [CrossRef] [Google Scholar]
- Antioxidant, antimicrobial and cytotoxic activities of silver and gold nanoparticles synthesized using Plumbago zeylanica bark. J. Nanostruct. Chem.. 2016;6:247-260.
- [CrossRef] [Google Scholar]
- Enhanced-fluorescent imaging and targeted therapy of liver cancer using highly luminescent carbon dots-conjugated foliate. Mater. Sci. Eng. C. 2020;116:111233
- [CrossRef] [Google Scholar]
- Charge relays via dual carbon-actions on nanostructured BiVO4 for high performance photoelectrochemical water splitting. Adv. Funct. Mater.. 2022;32:2112738.
- [CrossRef] [Google Scholar]
- Investigation of the microstructures of graphene quantum dots (GQDs) by surface-enhanced Raman spectroscopy. Nanomaterials. 2018;8:864.
- [CrossRef] [Google Scholar]
- Enhancing the luminescence of carbon dots by doping nitrogen element and its application in the detection of Fe(III) J. Mater. Sci.. 2015;50:2571-2576.
- [CrossRef] [Google Scholar]
- An overview of advanced methods for the characterization of oxygen vacancies in materials. Trends Anal. Chem.. 2019;116:102-108.
- [CrossRef] [Google Scholar]
- An ultrathin carbon layer activated CeO2 heterojunction nanorods for photocatalytic degradation of organic pollutants. Appl. Catal. B. 2019;259:118085
- [CrossRef] [Google Scholar]
- A short review of iron metabolism and pathophysiology of iron disorders. Medicines. 2019;6:85.
- [CrossRef] [Google Scholar]
- KOH etched graphite felt with improved wettability and activity for vanadium flow batteries. Electrochim. Acta. 2016;218:15-23.
- [CrossRef] [Google Scholar]
- Synthesis, applications and potential photoluminescence mechanism of spectrally tunable carbon dots. Nanoscale. 2019;11:20411-20428.
- [CrossRef] [Google Scholar]
- The photoluminescence mechanism in carbon dots (graphene quantum dots, carbon nanodots, and polymer dots): current state and future perspective. Nano Res.. 2015;8:355-381.
- [CrossRef] [Google Scholar]
- The quenching of the fluorescence of carbon dots: a review on mechanisms and applications. Microchim. Acta. 2017;184:1899-1914.
- [CrossRef] [Google Scholar]
- Cranberry beans derived carbon dots as a potential fluorescence sensor for selective detection of Fe3+ ions in aqueous solution. ACS Omega. 2019;4:15382-15392.
- [CrossRef] [Google Scholar]
Appendix A
Supplementary material
Supplementary data to this article can be found online at https://doi.org/10.1016/j.arabjc.2023.105109.
Appendix A
Supplementary material
The following are the Supplementary data to this article:Supplementary data 1
Supplementary data 1


