

Translate this page into:
Noninvasive PCA3 detection for screening prostate diseases using a graphene oxide-based method
⁎Corresponding authors at: State Key Laboratory of Southwestern Chinese Medicine Resources, College of Medical Technology, Chengdu University of Traditional Chinese Medicine, Chengdu, Sichuan 611137, China. And The Second Affiliated Hospital of Chengdu Medical College, China National Nuclear Corporation 416 Hospital, Chengdu, Sichuan 610051, China. nature_shibo@163.com (Bo Shi), heyang@cdutcm.edu.cn (Yang He)
-
Received: ,
Accepted: ,
This article was originally published by Elsevier and was migrated to Scientific Scholar after the change of Publisher.
Abstract
Abstract
Prostate Cancer Associated 3 (PCA3) as a promising biomarker to replace serum prostate-specific antigen (PSA) for differential diagnosis of benign and malignant prostate diseases. However, the detection of PCA3 in urine requires the collection of digital rectal examination (DRE) urine, which limits the application of PCA3 in screening prostate diseases. In the present study, a new reverse transcription quantitative real-time polymerase chain reaction (qRT-PCR) method was developed for PCA3 detection in non-DRE urine. The method uses the nanomaterial Graphene oxide (GO) to effectively prevent nonspecific amplification in qRT-PCR. GO-based qRT-PCR produced no nonspecific amplification. Receiver operating characteristic curve (ROC) results showed that the area under curve (AUC) of PCA3 to discriminate normal control subjects from prostate cancer (PCa) was 0.869 (95% confidence interval [CI], 0.689–1.000), and using 2.711 as the cutoff value of PCA3, the sensitivity was 81.8% and the specificity was as high as 88.9%. For prostatitis (PTIS) and PCa, the AUC value of PCA3 to distinguish them was 0.636 (95% CI, 0.396–0.877), with 81.8% sensitivity and 58.3% specificity. Compared with the 8.3% specificity of PAS, the specificity of PCA3 was improved by 50%, which suggested that PCA3, in non-DRE urine, has a significant potential application in the differential diagnosis of prostate diseases.
Keywords
Graphene oxide
qRT-PCR
Prostate Cancer Associated 3
Noninvasive
Prostate diseases

1 Introduction
The prostate gland, as an important component of the male reproductive system, plays a crucial role in male fertility. Several benign and malignant prostate diseases, including prostatitis (PTIS) and prostate cancer (PCa), can not only lead to impaired male fertility but also threaten the life and health of men. PTIS, the most common urological disease among men aged < 50 years, is considered the most significant factor of infertility (Wagenlehner et al., 2013). By contrast, PCa, a malignant tumor that develops in the prostate epithelium, is one of the most common malignant tumors of the male reproductive system. Although PTIS is benign, PCa is malignant and poses a serious threat. At present, they are primarily screened based on abnormal serum prostate-specific antigen (PSA) levels (Vickers et al., 2013), and final diagnosis is made via a puncture biopsy of the prostate. However, both PTIS and PCa result in elevated PSA levels (Robles et al., 1988). The positive diagnostic rate of a puncture biopsy for prostate cancer is approximately 21 % based on a PSA threshold of 4 ng mL−1, suggesting that negative biopsies are as high as 60 %–75 % (Attard et al., 2016; Matlaga et al., 2003). Thus, an inessential puncture biopsy, which is an invasive procedure, increases pain and risk of infection in patients. Therefore, there is an urgent clinical need for new biomarkers that are more tumor-specific and suitable for the mass screening of prostate diseases to reduce unnecessary puncture biopsies. Because of the location of the prostate gland, tumor cells are shed and their associated tumor biomarkers are excreted in the urine (Mengual et al., 2016), offering the possibility of noninvasive mass screening.
Prostate Cancer Associated 3 (PCA3) is a long-stranded noncoding RNA. It is present in 95 % of PCa tissues and significantly overexpressed in malignant cancerous tissues. Previous analyses found that PCA3 levels were 10- to 100-fold higher in PCa than in nonmalignant prostate tissues and that PCA3 was not detected in any other normal human tissues (Hessels et al., 2003). Moreover, PCA3 expression does not appear to be greatly affected by patient age, inflammation, trauma, or prostate volume (Truong et al., 2013), suggesting that it is a possible marker for the differential diagnosis of prostate diseases. Based on the exponential amplification capability of polymerase chain reaction (PCR), trace amounts of nucleic acid markers can generate a large number of copies for analysis. However, when it is present in urine at a concentration of < 10 copies, it is undetectable, yielding a false-negative result (Huskova et al., 2020; Hendriks et al., 2016). At present, to improve the sensitivity of PCA3 detection, urine is usually collected after digital rectal examination (DRE) (Hessels et al., 2003). DRE varies according to the clinicians’ procedure maneuvers and causes discomfort to the patient, restricting the clinical application of PCA3.
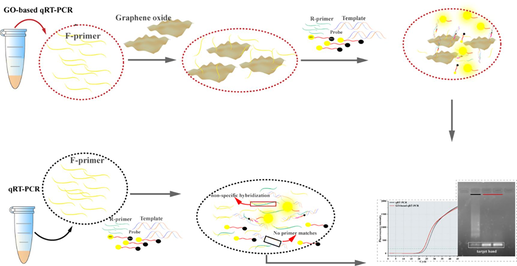
Graphene oxide (GO) is a carbon nanomaterial with a two-dimensional structure that has the ability to adsorb nucleic acids via the π-π stacking effect (Novoselov et al., 2004; He et al., 2022), enabling it to serve as a good nucleotide carrier (Lei et al., 2011; Hsieh et al., 2015). GO has been reported to protect nucleotides from degradation (Lu et al., 2010). As a derivative of graphene, GO has a large specific surface area and more oxygen-containing functional groups, such as the hydroxyl, carboxyl, and epoxy groups, compared with graphene (Dreyer et al., 2010; Hummers and Offeman, 1958). These groups can interact with positively charged species such as metal ions and polymers (Mishra and Ramaprabhu, 2011; Yang et al., 2010), making them common in drug delivery (Zhang et al., 2010), biodetection (Choi et al., 2014; Sun et al., 2008), bioimaging (Sun et al., 2008), sensors (Lin et al., 2012), antimicrobial compounds, and pathogenic bacteria detection (Abdelhamid and Wu, 2013; Shahnawaz et al., 2015). Oxygen-containing functional groups also make GO significantly more hydrophilic, forming stable aqueous colloids in aqueous solutions (Dreyer et al., 2010). The present study used GO prepared via the modified Hummers’ method with improved water solubility and larger sp2 size (Hummers and Offeman, 1958). Therefore, in this study, a GO-based qRT-PCR system was developed to detect PCA3 expression in non-DRE urine for prostate disease screening. Moreover, the role of GO in this method was evaluated, which may contribute to the application of carbon nanomaterials in diagnostics in the future.
2 Materials and methods
2.1 Materials
Graphite (crystalline powder, 100 mesh) was purchased from Qingdao Laixi Colloidal Graphite Factory (Qingdao, China). potassium nitrate (KNO3), Potassium permanganate (KMnO4), 98 %sulfuric acid (H2SO4), and 30 % hydrogen peroxide (H2O2) were afforded by Chengdu Kelong Chemical Reagent Factory (Chengdu, China). The 3500 Da dialysis bag was purchased from Shanghai Yuanye Biological Science & Technology Company (Shanghai, China). Trizol™ Reagent was purchased from Thermo (USA). TransScript® First-Strand cDNA Synthesis SuperMix and Perfect Start™ II probe qPCR SuperMixUDG were afforded by TransGen Biotech (Beijing, China). All primers, probes, and ssDNA templates were synthesized by Shanghai Sangon Biological Science & Technology Company (Shanghai, China). The ultrapure water (≥18 MΩ × cm resistivities at 25 °C) was used to prepare all aqueous solutions. All the reagents used in this study were of analytical reagent grade.
2.2 Synthesis and characterization of GO
Using an analytical balance, one part of 3.000 g KMnO4, one part of 0.5000 g graphite powder, and two parts of 0.5000 g NaNO3 were weighed. First, NaNO3 was separately stirred with 98 % H2SO4 in two beakers (A and B) at 25 °C. Second, KMnO4 was slowly added to beaker A and stirred well at 25 °C to prepare MnO3+ solution. At the same time, graphite powder was added to beaker B and stirred well. Finally, the MnO3+ solution was slowly added into beaker B to obtain the manganese-embedded graphite. GO stock solution was obtained by adding 30 % H2O2 to the manganese-embedded graphite. The ratio of sp2 to sp3, which is related to the adsorption and hydrophilicity of GO, was adjusted using the volume of H2O2.
The GO stock solution was used for transmission electron microscopy (TEM) (Tecnai G2 F30, FEI, USA), atomic force microscopy (AFM) (Dimension Lcon, Bruker, Germany), and ultraviolet–visible (UV–vis) absorption spectra analysis (MAPADA UV6300 UV–visible spectrophotometer, Mapada, China). The freeze-dried GO powder was subjected to Raman spectroscopy (Renishaw in Via, Renishaw, UK), X-ray photoelectron spectroscopy (XPS) (Escalab 250XI, Thermo, USA), and Fourier transform infrared spectroscopy (FT-IR) spectra analyses (iS10 FT-IR spectrometer, Nicorette, USA).
2.3 Establishment of GO-based qRT-PCR system
The TaqMan probe real-time fluorescence quantitative PCR was used for experiments (TL 988, Shaanxi, China). Probes were designed using Primer Express 3.0.1 software and assessed via NCBI Blast. Primers were designed from previous studies (Htoo et al., 2019). All primers, probes, and ssDNA templates were synthesized by Shanghai Sangon Biological Science & Technology Company (Shanghai, China). The primer sequences are shown in Table 1. The 25-µL GO-based qRT-PCR system comprised 12.5 μL Perfect Start™ II probe qPCR SuperMix UDG, 0.5 µL 10 µM probe, 0.5 µL 10 µM R-primer, 1 µL F-primer mixture, 1 µL cDNA, and 9.5 µL ddH2O. First, the 10 µM F-primer and diluted GO were incubated at a ratio of 1:1 (control group used ddH2O instead of diluted GO) at 58 °C for 40 min. Second, the mixture was centrifuged at 13,400 × g for 5 min to remove the upper GO layer that did not adsorb the primer (1/2 of total volume of the mixture). Finally, 1 µL of the mixed substrate mixture was collected and added into qRT-PCR with the following reaction sequence: denaturation at 94 °C for 30 s, followed by 45 cycles of 94 °C for 5 s and 58 °C for 30 s.
Name
Sequence (5′ → 3′)
PCA3 F-primer
GCTGACTTTACCATCTGAGG
PCA3 R-primer
GATCTCTGTGCTTCCTTTTG
PCA3 Probe
HEX-AATTAACATCACTAGAAACAGCAAG-BHQ1
GAPDH F-primer
CAGCCTCAAGATCATCAGCA
GAPDH R-primer
TGTGGTCATGAGTCCTTCCA
GAPDH Probe
HEX-ATACCAAAGTTGTCATGGATGACCT-BHQ1
After development, the GO-based qRT-PCR system was optimized. First, the sheet size of GO was adjusted by subjecting the GO stock solution to different ultrasound time periods (5, 10, 15, 30, and 60 min). After determining the optimum ultrasonic time of GO, the GO concentration–absorbance standard curve was established and the optimum working concentration of GO was screened using a series of stock solution dilutions to obtain different concentrations (4.01, 5.33, 6.67, 16.00, and 80 µg mL−1).
2.4 The specificity and sensitivity of GO-based qPCR
To test the sensitivity and specificity of the GO-based qRT-PCR system, synthetic ssDNA was diluted into several concentration gradients, which were then detected using conventional qRT-PCR and GO-based qRT-PCR. The cDNA synthesized via reverse transcription from the urine of patient with PCa was used as a template for qRT-PCR reaction, and the products were analyzed using 1.5 % agarose gel electrophoresis.
2.5 Go-based qRT-PCR assay using non-DRE urine
Random urine (50 mL) was collected from patients after obtaining their written informed consent at the 416th Nuclear Industrial Hospital (Chengdu, China) from April 2023 to September 2023. The inclusion criteria of subjects were as follows: abnormalities detected via DRE; serum PSA level of > 10 ng mL -1, 4 ∼ 10 ng mL−1 with free to total PSA (f/t PSA) of < 0.16, or PSAD of > 0.15 ng mL−1; and diagnosis confirmed using puncture biopsy. The exclusion criteria included patients with any previous history of prostate electrosurgery, recent prostate drug treatment, or other serious systemic diseases. All patients were Chinese.
The collected urine was centrifuged at 13,400 × g for 20 min at 4 °C. The supernatant was discarded, and 1 mL of Trizol™ reagent was added to the urinary sediment, followed by storage at − 80 °C until RNA extraction. The above thawed mixture was transferred to a 1.5 mL EP tube, incubated for 5 min at 25 °C. Next, 0.2 mL of chloroform was added, securely capped the tube, then thoroughly mixed by shook for 15 s and incubated at 25 °C for 5 min. Followed by centrifuged at 13,400 × g at 4 °C for 15 min. Transferred 0.4 mL of the aqueous phase to a new 1.5 mL EP tube. Then, added 0.4 mL of isopropanol and incubated at −20 °C for 20 min before centrifuged at 13,400 × g at 4 °C for 10 min. Discarded the supernatant and washed the sedimentation with 1 mL of 75 % ethanol, vortex the sample briefly, then centrifuged for 10 min at 7500 × g at 4 °C. Finally, discard the supernatant and air dried the RNA pellet for 5 min. Resuspended the pellet in 20 µL of RNase-free water.
ND5000 ultra-micro UV–vis spectrophotometer was used to evaluate the extracted RNA. The validated RNA was reverse-transcribed to cDNA using TransScript® First-Strand cDNA Synthesis SuperMix. cDNA was used in the subsequent qRT-PCR reaction. GAPDH, as the internal reference gene, was used in clinical samples to normalise the test for the number of prostate cells in the urine sediment. whereas ddH2O and synthetic ssDNA were used as the template for the negative and positive controls, respectively. This optimized GO-based qRT-PCR was used to detect the relative expression of PCA3 non-DRE urine.
2.6 Function of GO in qRT-PCR
The F-primer was mixed with the high (80 µg mL−1) and optimal concentrations (6.67 µg mL−1) of GO at a ratio of 1:1 and incubated at 58 °C for 40 min; the control contained ddH2O instead of GO. The mixture was then centrifuged at 13,400 × g for 5 min. The supernatant (1/2 of the total volume) was aspirated for detecting primer concentration by ND5000 ultra-micro UV–vis spectrophotometer. The lower part of the mixture was used for qRT-PCR. Moreover, the products of conventional qRT-PCR and GO-based qRT-PCR were analyzed using 1.5 % agarose gel electrophoresis.
2.7 Data analysis
Data are presented as mean ± standard deviation. The relative expression of PCA3 was analyzed via 2−ΔΔCt, and differences in the relative expression of PCA3 among normal subjects, patients with PTIS, and those with PCa were analyzed using one-way analysis of variance. Biomarker diagnostic sensitivity, specificity, accuracy, and area under the receiver operating characteristic (ROC) curve (AUC) were calculated via the ROC curve. Maximization using the Jordon’s index (specificity + sensitivity − 1) was used to calculate the cutoff value of PCA3. All data were analyzed using the SPSS statistical package (Version 23.0; IBM Company, Chicago, IL, USA).
3 Results
3.1 Characterization of GO
AFM indicated that the size of the synthesized GO was approximately 2 × 1.2 ∼ 3.07 × 2.13 µm and the thickness was about 0.5 ∼ 1.7 nm (Fig. 1A). The internal structure of GO was detected using HR-TEM (Fig. 1B): the regular lattice dark regions were the functional sp2 regions and the disordered bright regions were the sp3 regions. The sp2 region lattice spacing was approximately 0.23 nm, which is consistent with a previous report (Hu et al., 2021). The UV–vis spectra demonstrated a main absorption peak at 230 nm, which is caused by the characteristic π-π* conjugated system structure (C = C) of GO. The n-π* leaps of carbonyl (C = O) or carboxyl (–COOH) group produced a shoulder peak at 303 nm (Fig. 1C). According to FT-IR (Fig. 1D), the vibrational absorption peak caused by the hydroxyl group (–OH) and the deformation absorption peak were detected at 3396.76 cm−1 and 1384.45 cm−1, respectively. The vibrational absorption peak detected at 2339.98 cm−1 was caused by the carbonyl group (C = O) and the epoxy group at 1278.62 cm−1 (C-O). The stretching vibration peak detected at 1089.65 cm−1 was caused by the alkoxy group (C-O), and the vibration absorption peak detected at 1627.01 cm−1 was caused by (C = C). Finally, the peak at 1627.01 cm−1 was the deformation vibration peak of adsorbed water molecules, and these oxygen-containing groups made GO extremely water soluble. Raman spectroscopy showed that the synthesized GO contained the characteristic peaks D and G at 1349.16 cm−1 and 1605.60 cm−1, respectively, and that the ID/IG (used to characterize the sp3/sp2 bond ratio) was approximately 0.82 (Fig. 1E). The XPS of GO showed that C1s comprised five peaks located at 289.08 (O = C-O), 287.88 (C = O), 287.08 (C-O), 285.48 (C–C), and 284.68 (C = C) (Fig. 1F).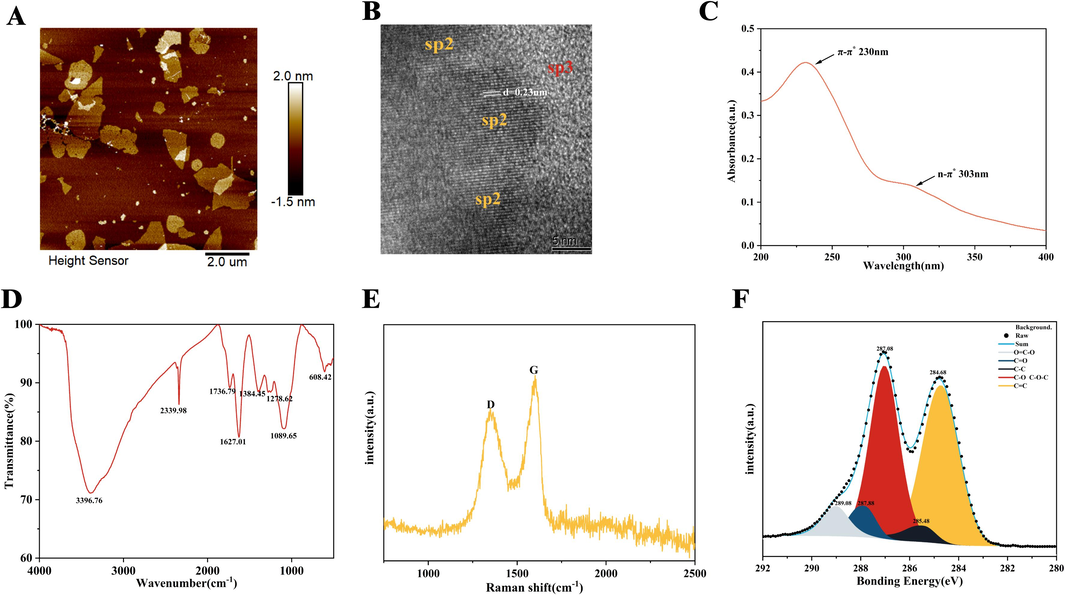
Characterization of GO. (A) AFM image. (B) TEM image. (C) UV − vis absorption spectrum. (D) FT-IR spectra. (E) Raman spectrum. (F) High-resolution XPS C1s spectra.
3.2 Establishment and optimization of GO-based qRT-PCR system
The volume of added H2O2 was adjusted (5 or 10 mL) to prepare two types of GO (GO5 mL and GO 10mL). GO5 mL was found to reduce Ct value more effectively (Fig. 2C). TEM revealed that GO5 mL had a large sp2 area (Fig. 2A). Meanwhile, the Raman image showed that GO5 mL had a D peak of 1527.72 a.u. and an ID/IG of 0.82, whereas GO10 mL had a D peak of 1508.22 a.u. and an ID/IG of 0.69 (Fig. 2B). These results indicated more oxidized groups on the surface of GO5 mL. Second, the results of the GO lamellar size exploration showed that the best effect of GO lamellar size was observed under sonication for 15 min (Fig. 2D). Finally, the results of several GO dilutions showed its optimal working concentration at 6.67 µg mL−1 (Fig. 2E). The optimized GO-based qRT-PCR could reduce the Ct value by approximately 1.5 relative to conventional RT-PCR (Fig. 2F).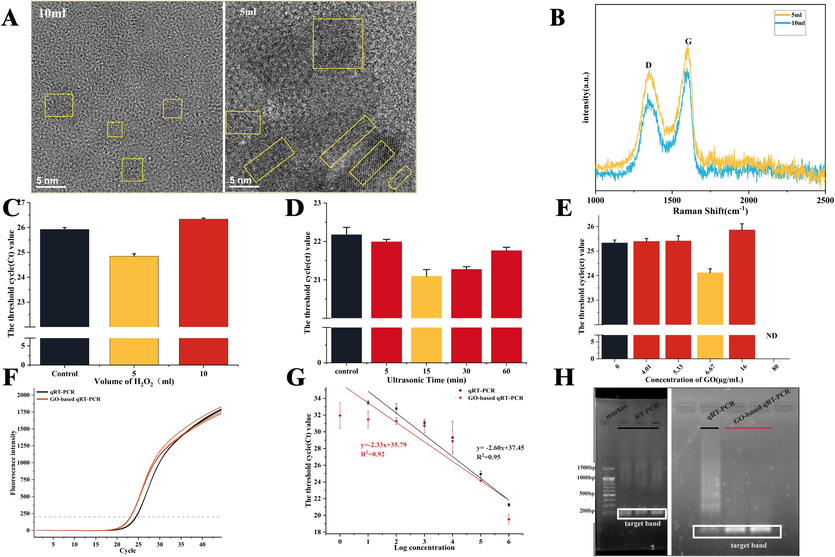
Optimization and sensitivity and specificity of GO-based qRT-PCR. (A) TEM image of GO prepared using 5 and 10 mL of H2O2. (B) Raman spectrum of GO prepared using 5 and 10 mL of H2O2. (C) Effect on the Ct value of GO prepared using 5 and 10 mL of H2O2. (D) Effect on the Ct value of GO lamellar size by different ultrasonication time. (E) The effect of different concentrations of GO on the qRT-PCR. (F) Amplification curves of GO-based qRT-PCR and conventional qRT-PCR. (G) Comparison of the sensitivity of GO-based qRT-PCR and conventional qRT-PCR. (H) Agarose gel electrophoresis images of classical RT-PCR, GO-based qRT-PCR and conventional qRT-PCR. Notes: ND, not detected.
The results of conventional qRT-PCR and GO-based qRT-PCR for the different concentrations of ssDNA showed that the detection range of conventional qRT-PCR was 106 ∼ 101 copies µL−1, with a linear relationship within 106 ∼ 101 copies µL−1; the coefficient of determination was 0.95. By contrast, the detection range of GO-based qRT-PCR could reach 106 ∼ 100 copies µL−1; the coefficient of determination was 0.92. (Fig. 2G). Agarose gel electrophoresis confirmed that GO-based qRT-PCR produced no nonspecific amplification, whereas conventional qRT-PCR generated apparent nonspecific amplification (Fig. 2H).
The designed PCA3 primers detected the PCR amplification product of 167 bp PCA3 only in LNCaP and VCaP cell lines, whereas no amplification was observed in RWPE-1, K562, and MDA-MB-436 cell lines (Htoo et al., 2019; Yamkamon et al., 2020).
3.3 Relative expression of PCA3 in different prostate diseases
A small sample volume (n NC = 1, n PTIS = 1, n PCa = 1; Notes: NC, normal control.) was used to perform a preliminary investigation into the relative expression differences of PCA3 in non-DRE urine. A patient underwent puncture biopsy as their plasma PSA level was > 4 ng mL−1. The HE staining of the biopsy revealed abnormal structures and CK positivity, suggesting intact basal cells of the glandular follicles and PTIS (Fig. 3A-C). The GO-based qRT-PCR results demonstrated a 46-fold relative expression of PCA3 compared with NC (Fig. 3I). HE staining in the tissue of a patient with PCa revealed anisotropic cells and an abnormal alveolar structure. PSA positivity confirmed the tissue as prostate, Ki67 positivity indicated cellular proliferation, and CK negativity suggested the absence of basal cells, which led to the diagnosis of PCa (Fig. 3D-H). The relative expression of PCA3 in this case was 58-fold higher than that of NC (Fig. 3I). To better assess the efficacy of PCA3 in random urine for the differential diagnosis of PTIS versus PCa, the sample size was increased.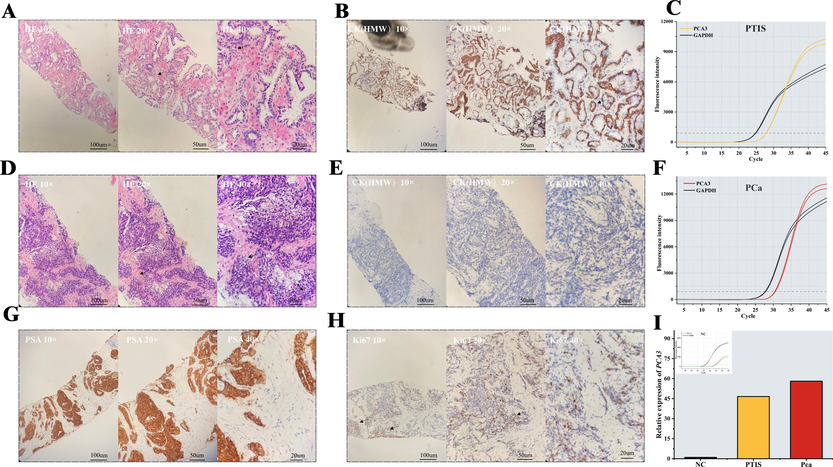
Histopathologic images of the prostate tissue and qRT-PCR assay. (A) HE-stained pathological images of prostate tissue with PTIS. (B) Immunohistochemical staining of CK (HMW) of prostate tissue with PTIS. (C) Amplification curves of PCA3 and GAPDH genes in PTIS urinary sediment by GO-based qRT-PCR (D) HE-stained pathological images of prostate tissue with PCa. (E) Immunohistochemical staining of CK(HMW) of prostate tissue with PCa. (F) Amplification curves of PCA3 and GAPDH genes in PCa urinary sediment by GO-based qRT-PCR. Immunohistochemical staining of PSA (G) and Ki67 (H) of prostate tissue with PCa. (I) Relative expression of PCA3 in Nor-DER urine of different subjects (n NC = 1, n PTIS = 1, n PCa = 1; Notes: NC, normal control.).
GO-based qRT-PCR was used to detect the relative expression levels of PCA3 in NC (n = 9), PTIS (n = 12), and PCa (n = 11). The characteristics of the Subjects were presented in Table 2. The results revealed that PCA3 was differentially expressed in the three types of subjects (P < 0.05) (Fig. 4A). ROC curves were used to assess the diagnostic value of PCA3 in non-DRE urine. The results demonstrated that the AUC value of PCA3 for the differential diagnosis of NC versus PCa was 0.869 (95 % confidence interval [CI], 0.689–1.000; sensitivity, 81.8 %; specificity, 88.9 %) (Fig. 4D). The AUC value of PCA3 for the differential diagnosis of NC versus PTIS was 0.713 (95 % CI, 0.491–0.935; sensitivity, 50.0 %; specificity, 88.8 %) (Fig. 4C) and the AUC value of PCA3 for the differential diagnosis of PTIS with PCa was 0.636 (95 % CI, 0.396–0.877; sensitivity, 81.8 %; specificity, 58.3 %) (Fig. 4E). Considering the clinical diagnostic criterion of TPSA > 4 ng mL−1, the specificity of PSA to discriminate PTIS and PCa was only 8.3 % (1/12) in the included study subjects (Fig. 4B), resulting in 91.7 % of patients with inflammation experiencing unnecessary biopsy.
Characteristics
PCa (n = 11)
PTIS (n = 12)
NC (n = 9)
Age
Mean ± SD
75 ± 9
66 ± 10
48 ± 25
Gleason Score
6
2
7
6
8
1
9
1
10
1
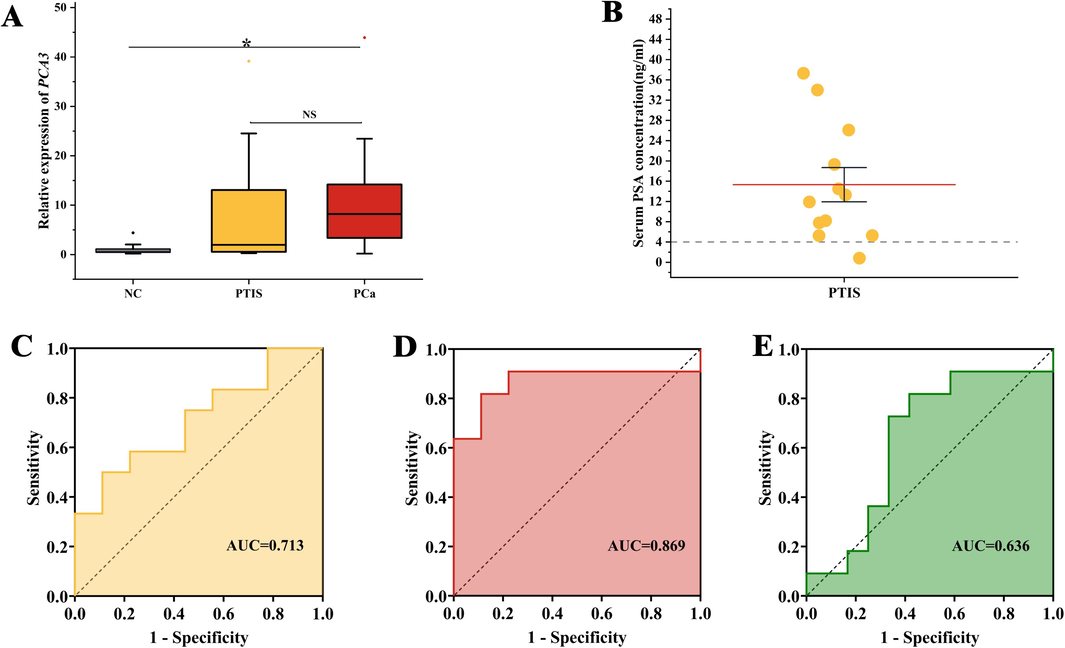
Evaluation of diagnostic efficacy of PA3 in Nor-DER urine as detected by GO-based qRT-PCR assay. (A) Relative expression of PCA3 in Nor-DER urine of different subjects (nNC = 9, nPTIS = 12, nPCa = 11; Notes: NC, normal control, *P < 0.05, NS, not significant.) The p-value is measured by a two-sided ANOVA analysis. (B) Serum PSA concentration of patient with PTIS. (C) ROC curve of PCA3 in Nor-DER urine in distinguishing PTIS from NC. (D) ROC curve of PCA3 in Nor-DER urine in distinguishing PCa from NC. (E) ROC curve of PCA3 in Nor-DER urine in distinguishing PCa from PTIS.
3.4 Chain reaction of GO to improve sensitivity and specificity of qRT-PCR
GO-based qRT-PCR improved the detection sensitivity and specificity because of a combination of various factors. When the F-primer is incubated with GO, the nucleobase of the primer that contains a benzene ring is adsorbed perpendicularly on the surface of GO through π-π stacking with the benzene ring in GO (Fig. 5A), which was confirmed by the F-primer concentration in the supernatant of mix being inversely proportional to GO concentration (Fig. 5E). The F-primer, thus adsorbed on the surface of GO, becomes less likely to hybridize nonspecifically with the R-primer, increasing the propensity of the template binding to the primer and triggering the amplification reaction (Fig. 5B). However, overabundant GO may occupy the template binding site of primer, making the primer ineffective and preventing amplification (Fig. 5C). Moreover, high GO concentration is more likely to collide with the reporter dye, quenching its fluorescence (Fig. 5D). The combined effect of these factors prevents the fluorescence signal in a system with high GO concentration (Fig. 5F). In the conventional qRT-PCR system, nonspecific hybridization between the primers results, in part, because primers do not bind to the template, preventing amplification (Fig. 5G). Based on appropriate GO concentration, GO-based qRT-PCR decreased the Ct value by approximately 1.5 compared with the conventional qRT-PCR. Moreover, 1.5 % agarose gel electrophoresis of the PCR product revealed clearer target bands in GO-based qRT-PCR without nonspecific amplification (Fig. 5H).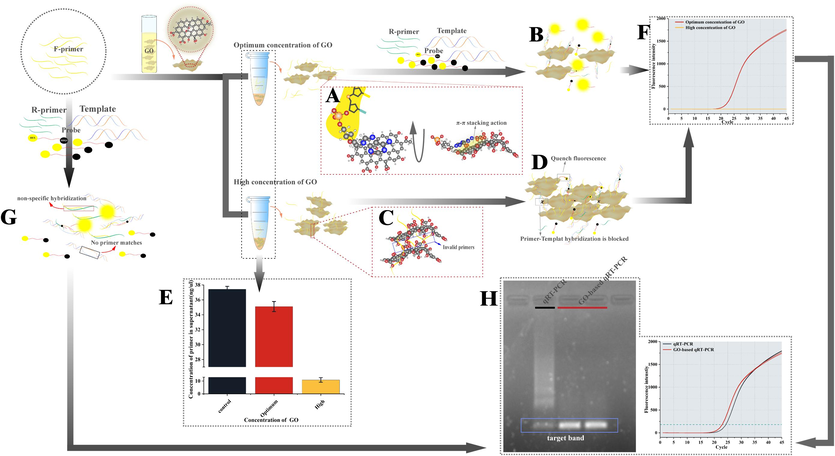
Chain reaction of GO to improve sensitivity and specificity of qRT-PCR. (A) Primers adsorbed to GO surface by π-π stacking action between Nucleobase and benzene ring. (B) Amplification reactions for GO-based qRT-PCR with optimum concentration of GO. (C) High concentrations of GO invalidate the primer by occupying the functional site where the primer binds to the template. (D) Amplification reactions for GO-based qRT-PCR with high concentration of GO. (E) F-primers concentration in supernatant after F-primers and GO incubated at 58 °C for 40 min, centrifuged at 13,400 × g for 5 min. (F) Amplification curves of GO-based qRT-PCR with different concentration of GO. (G) Amplification reactions for conventional qRT-PCR. (H) Amplification curves and agarose gel electrophoresis of GO-based qRT-PCR and conventional qRT-PCR.
4 Discussion
Previous reports have revealed that ssDNA can be strongly adsorbed on the GO surface based on the strong π-π stacking effect between the bases of ssDNA and sp2 atoms of GO (Novoselov et al., 2004; Lei et al., 2011). During GO preparation, the added H2O2 adds abundant carboxyl, hydroxyl, and epoxy groups to the surface of GO lamellae by consuming the sp2 region, but these groups increase the solubility of GO in water (Lu et al., 2010; Dreyer et al., 2010). Therefore, the volume of H2O2 added is critical to balance the adsorption and hydrophilicity of GO. The study results showed that GO prepared by adding 5 mL H2O2 could balance the two properties.
One critical factor for this method is the layer thickness of GO. The study results revealed that the synthesized GO monolayer had a thickness of 1 ∼ 2 nm and that it was well dispersed in the aqueous phase (Stankovich et al., 2006; Li et al., 2008). Next, the optimum concentration of GO can adsorb the primer without occupying the binding site of the primer and template. The appropriate concentration at which GO maximized primer adsorption without quenching the fluorescence of the reporter group in the system was 6.67 µg mL−1.
A preliminary exploration of the role of GO in qRT-PCR revealed that its role can be mainly attributed to its adsorption of F-primers, which attenuated the competitive inhibition of primers against low template concentrations. From the amplification process, it was concluded that the F-primers preadsorbed on the GO surface has a better dispersal in the system and that each GO layer adsorbed with the primer is equivalent to an independent reaction system. The adsorbed GO layer pairs with the added templates as well as the R-primer and reduces mutual interference. At the later stage of the amplification reaction, because of complementary pairing, the nucleobases are encapsulated within the double helix and their interaction with GO is weakened (Park et al., 2014), thereby detaching from the GO surface. The detached dsDNA will subsequently be used again as the template for the next round of amplification reaction.
In addition to the above mechanism, there are other roles of GO in qRT-PCR. It is well known that in each round of amplification reaction, deoxyribonucleotide triphosphates (dNTPs) in the reaction system are added to the 3′ end of the primer under the action of DNA polymerase and other by-products, such as pyrophosphates (PPis), are released at the same time. The adsorption property of GO may enable the promotion of synthesis reaction in the positive direction through the adsorption of PPis and other by-products. Moreover, it is possible that GO works by adsorption and by bringing DNA polymerase, dNTPs, and other reaction components closer to each other. However, as the qRT-PCR reaction is a continuous and closed process, relevant evidence to prove these aforementioned conjectures is lacking and will be investigated in a future study.
5 Conclusions
The current study provided a new method to solve the problem of nonspecific hybridization of primers in qRT-PCR and optimized the qRT-PCR system. The GO-based qRT-PCR was used for the detection of PCA3 in non-DRE urine. The ROC results showed that the AUC of PCA3 to discriminate NC from PCa was 0.869 (95 % CI, 0.689–1.000), and using 2.711 as the cutoff value of PCA3, the sensitivity was 81.8 % and the specificity was as high as 88.9 %. For PTIS and PCa, which are currently difficult to identify from serum PSA, the AUC value of PCA3 to distinguish them was 0.636 (95 % CI, 0.396–0.877), with 81.8 % sensitivity and 58.3 % specificity. Compared with the 8.3 % specificity of PSA, the specificity of PCA3 was improved by 50 %. All these results suggest that PCA3, in non-DRE urine, has a significant potential application in the differential diagnosis of prostate diseases.
CRediT authorship contribution statement
Hong Chen: Conceptualization, Data curation, Formal analysis, Methodology, Validation, Visualization, Writing – original draft. Jichun Shao: Formal analysis, Investigation, Methodology, Visualization. Zhongzhu Yang: Formal analysis, Methodology, Resources. Zhen Song: Data curation, Resources. Bo Shi: Conceptualization, Funding acquisition, Investigation, Project administration, Supervision. Yang He: Conceptualization, Data curation, Funding acquisition, Methodology, Project administration, Resources, Supervision, Writing – review & editing.
Acknowledgements
This study was supported by Innovation Team and Talents Cultivation Program of National Administration of Traditional Chinese Medicine (ZYYCXTD-D-202209), the Scientific Research Fund of Chengdu Health Commission (No. 2021023), and Natural Science Foundation of Sichuan Province, China (2023NSFSC0740).
Declaration of competing interest
The authors declare that they have no known competing financial interests or personal relationships that could have appeared to influence the work reported in this paper.
References
- Multifunctional graphene magnetic nanosheet decorated with chitosan for. highly sensitive detection of pathogenic bacteria. J Mater Chem b.. 2013;1:3950-3961.
- [CrossRef] [Google Scholar]
- Electrochemical thrombin detection based on the direct interaction of target proteins and graphene oxide as an indicator. Analyst. 2014;139:1331-1333.
- [CrossRef] [Google Scholar]
- Multifunctional carbon nanomaterials for diagnostic applications in infectious diseases and tumors. Mater Today Bio.. 2022;14:100231
- [CrossRef] [Google Scholar]
- Comparative analysis of prostate cancer specific biomarkers PCA3 and ERG in whole urine, urinary sediments and exosomes. Clin Chem Lab Med.. 2016;54:483-492.
- [CrossRef] [Google Scholar]
- DD3PCA3-based molecular urine analysis for the diagnosis of prostate cancer. Eur Urol.. 2003;44:8-16.
- [CrossRef] [Google Scholar]
- Graphene oxide based nanocarrier combined with a pH-sensitive tracer: A vehicle for concurrent pH sensing and pH-responsive oligonucleotide delivery. ACS Appl Mater Interfaces.. 2015;7:11467-11475.
- [CrossRef] [Google Scholar]
- Colorimetric detection of PCA3 in urine for prostate cancer diagnosis using thiol-labeled PCR primer and unmodified gold nanoparticles. Clin Chim Acta.. 2019;488:40-49.
- [CrossRef] [Google Scholar]
- Graphene oxide-based qRT-PCR assay enables the sensitive and specific detection of miRNAs for the screening of ovarian cancer. Anal Chim Acta.. 2021;1174:338715
- [CrossRef] [Google Scholar]
- The Percentage of Free PSA and Urinary Markers Distinguish Prostate Cancer from Benign Hyperplasia and Contribute to a More Accurate Indication for Prostate Biopsy. Biomedicines. 2020;8(6):173.
- [CrossRef] [Google Scholar]
- Adsorption of double-stranded DNA to graphene. oxide preventing enzymatic digestion. Nanoscale. 2011;3:3888-3892.
- [CrossRef] [Google Scholar]
- Processable aqueous dispersions of graphene nanosheets. Nat Nanotechnol.. 2008;3:101-105.
- [CrossRef] [Google Scholar]
- Triple signal amplification of graphene film, polybead carried gold nanoparticles as tracing tag and silver deposition for ultrasensitive electrochemical immunosensing. Anal Chem.. 2012;84:3662-3668.
- [CrossRef] [Google Scholar]
- Using graphene to protect DNA from cleavage. during cellular delivery. Chem Commun.. 2010;46:3116-3118.
- [CrossRef] [Google Scholar]
- Using gene expression from urine sediment to diagnose prostate cancer: Development of a new multiplex mRNA urine test and validation of current biomarkers. BMC Cancer. 2016;16:76.
- [CrossRef] [Google Scholar]
- Removal of metals from aqueous solution and sea water by functionalized. graphite nanoplatelets based electrodes. J Hazard Mater.. 2011;185:322-328.
- [CrossRef] [Google Scholar]
- Electric Field Effect in Atomically Thin Carbon Films. Science. 2004;306:666-669.
- [CrossRef] [Google Scholar]
- Mechanism of DNA adsorption and desorption on graphene oxide. Langmuir. 2014;30:12587-12595.
- [CrossRef] [Google Scholar]
- Clinical Behavior of Prostatic Specific Antigen and Prostatic Acid Phosphatase: A Comparative Study. Eur Urol.. 1988;14:360-366.
- [CrossRef] [Google Scholar]
- Near infrared (NIR) laser mediated surface activation. of graphene oxide nanoflakes for efficient antibacterial, antifungal and wound healing treatment. Colloids Surf b.. 2015;127:281-291.
- [CrossRef] [Google Scholar]
- Nano-graphene oxide for cellular imaging and drug delivery. Nano Res.. 2008;1(3):203-212.
- [CrossRef] [Google Scholar]
- Toward the detection of prostate cancer in urine: A critical analysis. J Urol.. 2013;198:422-429.
- [CrossRef] [Google Scholar]
- Vickers AJ., Ulmert D., Sjoberg DD., Bennetteet CJ., Björk T., Gerdtsson A., et al., 2013. Strategy for. detection of prostate cancer based on relation between prostate specific antigen at age 40-55 and long term risk of metastasis: Case-control study. BMJ. 346, f2023. DOI: 10.1136/bmj.f 2023.
- Urinary PCA3 detection in prostate cancer by magnetic nanoparticles coupled with colorimetric enzyme-linked oligonucleotide assay. Excli J.. 2020;19:501-513.
- [CrossRef] [Google Scholar]
- Folding/aggregation of graphene oxide and its application in Cu2+ removal. J Colloid Interface Sci.. 2010;351:122-127.
- [CrossRef] [Google Scholar]
- Functional graphene oxide as a nanocarrier for controlled loading and targeted delivery of mixed anticancer drugs. Small. 2010;6:537-544.
- [CrossRef] [Google Scholar]


