

Translate this page into:
Novel electrosynthesis of CdS/FeS nanocomposite-modified poly(o-phenylenediamine) with views to their use as a biosensor for Escherichia coli
⁎Corresponding author. loreto.hernandez@uv.cl (Loreto. A. Hernández)
-
Received: ,
Accepted: ,
This article was originally published by Elsevier and was migrated to Scientific Scholar after the change of Publisher.
Peer review under responsibility of King Saud University.
Abstract
This article proposes a new electrochemical sensor for Escherichia coli (E. Coli) composed of poly(o-phenylenediamine) (PoPD) and CdS/FeS nanocomposites (PoPD|CdS/FeS). The preparation of the modified electrodes used for this purpose and their subsequent use as a sensor comprise a simple, fast and reproducible technique. The characterization of the CdS/FeS nanocomposites and their subsequent inclusion on PoPD was performed by X-ray diffraction (XRD), Raman, field emission scanning electron microscopy (FESEM), high-resolution transmission electron microscopy (HR-TEM) and computational methods; For the nanocomposites an average size of 100 nm was obtained after applying a reduction potential for 5 s over the polymeric matrix. The electrochemical characterizations confirmed that the inclusion of the nanocomposites improved the amperometric response, allowing the developed material to be used as an electrochemical sensor for E. Coli. The figures obtained gave the linear equation j = -6.89 × 10⁻¹⁴ × CFU + 5.64 × 10⁻⁵, with an R2 of 0.995, for 10 replicates. Furthermore, the limit of detection (LOD) was 6.1 × 10⁵ CFU/mL, and the limit of quantification (LOQ) was 6.1 × 10⁶ CFU/mL.
Keywords
Polymers
Poly(o-phenylenediamine)
Nanocomposites
CdS
FeS
Escherichia coli

1 Introduction
Foodborne illnesses caused by bacterial pathogenic microorganisms and/or their toxins have become a serious global public health problem. Among pathogenic organisms, bacteria exist widely in foodstuffs (De Jesús et al., 2004; Işık et al., 2020; Martin and Beutin, 2011). As one of the most harmful bacteria related to foodborne diseases, Escherichia coli (E. coli) lives within the digestive tracts of humans and poultry and is well known to cause infection and disease when present in contaminated foods, such as unpasteurized milk, beef, green leafy vegetables, and water (Baraketi et al., 2020; Das et al., 2020; Senkbeil et al., 2019; Tozzoli et al., 2019).
Sensitive detection of E. coli is an effective method to prevent disease and guarantee food quality for human health. The most common methods used to detect the presence of E. coli are based on conventional microbiological culturing methods but often require 48 h to obtain a confirmed result.
Recent research has worked on fluorescence techniques to measure the presence of E. Coli quantitatively. J. Li et al. has shown LOD close to 265 CFU/mL with this technique. Other fluorescence techniques that report obtaining sensors for E. Coli are those shown by Song et al. with LOD of 106 cell/mL. Both of these novel techniques involve a large number of synthesis steps (J. Li et al., 2019; Li et al., 2020a).
Electrochemical biosensors have a tremendous potential to become cheap and fast analytical tools (Abdelrasoul et al., 2020; He et al., 1994; Zhao et al., 2020). Electrodeposition is a relatively convenient, simple, and economical approach for the preparation of modified electrodes for this purpose. New metal composites can be easily controlled by adjusting the electrodeposition conditions, such as the applied potential and metal ion concentration (Chen et al., 2016; Rochelet et al., 2015; Wang et al., 2019; Zhu et al., 2018).
The use of semiconductor nanoparticles (NPs) in applications such as biosensors, dye-sensitized solar cells (DSSCs) (Shashanka et al., 2020), field effect transistors (FETs) (Danielson et al., 2020; Lee et al., 2018), electricity generation and light-emitting diodes (LEDs) (Chakraborty et al., 2020; Danielson et al., 2020; Ning et al., 2019) has received enormous attention. Among inorganic semiconductors, cadmium sulfide (CdS) has been found to be an excellent photoactive and charge transport material in optoelectronic devices, and its direct band gap of 2.4 eV is appropriate for use as an acceptor in hybrid photovoltaic devices. It has been demonstrated that the surface chemistry of hexagonal nanostructured CdS films is responsible for their LED, photovoltaic, sensor and electrical properties (Faraz et al., 2018; Lee et al., 2019; Rahman, 2020).
In addition to CdS, iron sulfides (FeS) have received great attention in the field of biosensors because they are used to improve electron transport in enzymatic electrodes ex vivo due to their electron mediation properties (enabling cyclic reduction and oxidation between Fe2+/Fe3+) (Mahadevan and Fernando, 2017; Mahadevan et al., 2016). Furthermore, FeS NPs have been used in magnetic resonance, targeted drug delivery and magnetic separation of biological components. Currently, chemical reduction of metal ions and metal complexes in solution is the most thoroughly developed and popular method for the synthesis of metallic NPs (M−NPs). For example, Ni-NPs have been prepared using a number of different reducing agents, such as NiCl2·6H2O, ethylene glycol, and N-vinyl pyrrolidone (PVP) (Hernández et al., 2019).
The electroreduction of metal ions is widely used for M−NP preparation on an electrode surface but is rarely used for electrosynthesis in bulk solution. Nevertheless, many researchers have developed methods to obtain M−NPs from bulk solution, such as by adding surfactants such as PVP to keep the nanostructures separate when a potential is applied.
Here, we introduce a novel in situ anodic electrosynthesis platform for the preparation of CdS/FeS nanocomposites inside of poly-o-phenylenediamine, starting with a mixture of FeSO4 and CdSO4 in ethylene glycol as the solvent and PVP as the surfactant. The results of X-ray diffraction (XRD), field emission scanning electron microscopy (FESEM), and high-resolution transmission electron microscopy (HR-TEM) proved that the electrosynthesized CdS/FeS nanocomposites are 100 nm in size. These CdS/FeS nanocomposites showed great sensitivity to the presence/absence of E. coli (Fig. 1).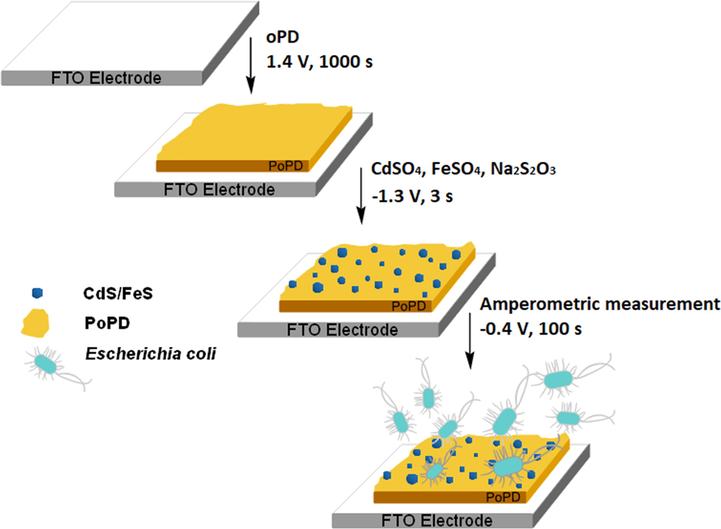
Graphical abstract of E. Coli biosensor.
The new modified electrode is carried out by an easy, economical and fast methodology, which only involves electrochemical techniques, allowing to obtain reproducible electrodes in a short electrosynthesis time, as well as facilitating the rapid measurement of the E. Coli concentration in various samples.
2 Materials and methods
2.1 Reagents
Lithium perchlorate (LiClO4), N-vinyl pyrrolidone (PVP), ethylene glycol, phosphoric acid (H3PO4), HPLC-grade acetonitrile (99.8%, CH3CN), tetrabutylammonium hexafluorophosphate (TBAPF6), o-phenylenediamine (oPD), sulphuric acid (H2SO4, 98%), cadmium sulfate (CdSO4), ferrous sulfate heptahydrate (FeSO4) and hydrazine were commercially provided by Aldrich.
Sodium thiosulfate (Na2S2O3), ethylene glycol, peptone, yeast extract, sodium chloride (NaCl), potassium phosphate dibasic (K2HPO4) and potassium dihydrogen phosphate (KH2PO4) were commercially provided by Merck.
2.2 Electrosynthesis of PoPD
All solutions were prepared with fresh Milli-Q grade deionized water obtained from a Synergy deionizer. All experiments were performed at room temperature (20 °C) under argon atmosphere in an anchor-type three-compartment cell. Fluorine-doped tin oxide (FTO) with a geometric area of 1 cm2 was used as the working electrode, and a platinum wire coil with a large geometric area was used as the counter electrode. Ag/AgCl was used as the reference electrode. All potentials quoted in this work are thus referred to Ag/AgCl.
Poly(o-phenylenediamine) (PoPD) was synthesized by cyclic voltammetry (CV) using the optimal potential window, i.e., between 0.350 and 1.400 V, on FTO. A mixture solution of 2 M H2SO4 (98%, Aldrich)/(CH3CN 99.8%, Aldrich) in a 1:4 ratio (% v/v) was prepared. The optimum starting unit concentration was 0.01 M oPD to obtain the corresponding polymer, namely, PoPD. CV profiles of PoPD were used to determine the appropriate potential for the potentiostatic technique. It was found that the best oxidation potential for the preparation of PoPD was 1.4 V. The electrochemical response was surveyed in solutions containing 0.1 M TBAPF6 in CH3CN as part of the electrochemical characterization of this material for future applications.
2.3 Chemical and electrochemical synthesis of CdS/FeS nanocomposites
A total of 0.295 g of PVP was added to a solution of 0.01 M CdSO4, 0.01 M FeSO4, and 0.01 M Na2S2O3 in 30 mL of ethylene glycol, and the mixture was stirred until the total dissolution of PVP was achieved. The resulting solution was heated to 130 °C with continues stirring for 2.5 h. Then, 500 µL of this mixture was added to 25 mL of Milli-Q grade H2O with 0.1 M LiClO4 as the electrolyte. Electrosynthesis of all CdS/FeS nanocomposites was conducted at room temperature (20 °C) under a high-purity argon atmosphere in a three-compartment anchor-type electrochemical cell. A three-electrode arrangement was used consisting of FTO (1.0 cm2 geometric area) as the working electrode, and a platinum wire coil with a large geometric area was used as the counter electrode. Ag|AgCl, KCl (sat’d) was used as the reference electrode. All the potentials in this study are referred to this reference electrode.
CdS/FeS nanocomposite was synthesized by cyclic voltammetry (CV) using the optimal potential window, i.e., between −1.4 and 0.3 V, on FTO.
The electrosynthesis of FTO|PoPD-FeS/CdS was synthesized in two steps. In the first modification step, FTO was coated with 10 cycles of PoPD, and then this modified electrode was used with a working electrode in the same reaction mixture mentioned above. By applying a reduction potential at −1.3 V for 5 s.
2.4 E. Coli cultivation and electrochemical measurements
E. coli (ATCC 25922) was obtained from Sigma Aldrich and regrown regularly on nutrient agar plates to ensure its viability. The cultures were grown by aerobic cultivation at 37 °C in a 25 mL flask filled with 5 mL of medium for 72 h. The growth medium contained 10 g L−1 peptone, 5 g L−1 yeast extract, and 5 g L−1 NaCl. To prepare the E. coli solution, 100 µL of the E. coli suspension was mixed with 100 mL of phosphate buffer (1.1 g L−1 K2HPO4, 0.32 g L−1 KH2PO4 and 8.5 g L−1 NaCl, pH 7.4). Calibration curves and figures of merit (limit of detection –LOD- and limit of quantification –LOQ-) were obtained using 100 mL of phosphate buffer supplemented with 100 µL of E. coli at an applied potential step of −0.4 V because this value is the maximum sensitivity of the working electrode. The LOD and LOQ were determined from sensitivity curves and blank measurements.
2.5 Instruments and characterization
All electrochemical measurements were performed on a CH Instruments electrochemical workstation potentiostat. HR-TEM images were recorded on a Talos F200X-FEI high-resolution transmission electron microscope operating at 200 kV. FESEM images were obtained by using a HITACHI SU 3500 electron microscope. The atomic composition of the samples was determined through energy dispersive X-ray spectroscopy (EDX) by employing an energy dispersive X-ray analyser (Bruker, XFlash detector 410-M) coupled to the SEM system. Structural characterization of the CdS and FeS samples was examined by X-ray diffraction (XRD) by using a Philips PW1840 diffractometer (30 kV, 40 mA, Cu Kα radiation with λ 1⁄4 1.5406 Å).
2.6 Binding free energy computational details
All DFT calculations reported in this study were performed with the NWChem computational chemistry package (v6.6) (Valiev et al., 2010). The geometries of the complexes were optimized without any constraints with BLYP (Becke, 1988; Lee et al., 1988) and B3LYP (Becke, 1993; Lee et al., 1988) functionals, both in vaccum and solvent phase. Dispersion energy was considered using Grimme’s scheme plus BJ-damping (Grimme et al., 2011). For C, N and H atoms, the 6-31G** basis set was used (Hariharan and Pople, 1973; Hehre et al., 1972). For Cd and Fe atoms, LANL2DZ basis set was adopted, which included the Hay and Wadt effective core potential and a double-valence basis set (Hay and Wadt, 1985). Ethylene glycol (dielectric constant is 40.25 at 298.15 K), was considered implicitly using the Conductor-like Screening Model (COSMO) method (Klamt and Schüürmann, 1993).
Geometry optimizations and frequency calculations were performed at the same level of theory. No imaginary frequencies were obtained, confirming that the optimized structures were at a minimum of the corresponding potential energy surface. Binding free energies (
) were calculated employing the rigid-rotor-harmonic-oscillator approximation at 298.15 K according to:
where , and , are the free energies of the complex, ligand (monomer or oligomer) and metal cation, respectively.
3 Results and discussion
3.1 Novel synthesis of CdS/FeS nanocomposites
3.1.1 Comparison of CdS/FeS nanocomposites prepared by chemical and electrochemical methods
Fig. 2(A) and (B) show FESEM images comparing the composites produced by the chemical and electrochemical methods. It is important to emphasize that both forms of production have not been published before and could provide a method applicable to metal sulfides that have adequate reduction potentials. Although both sulfides were successfully produced after the addition of hydrazine as a reducing agent, a homogeneous mixture was not entirely formed (Fig. 2-(C)), and different agglomerations of one or the other sulfide in the resulting powder were obtained after filtration of the product. In addition, the powder’s morphology is not uniform, comprising spherical shapes, rods and blocks, which would hinder the inclusion of the powder in polymer matrices obtained by electrochemical methods due to the regular occurrence of growths and the form of deposition.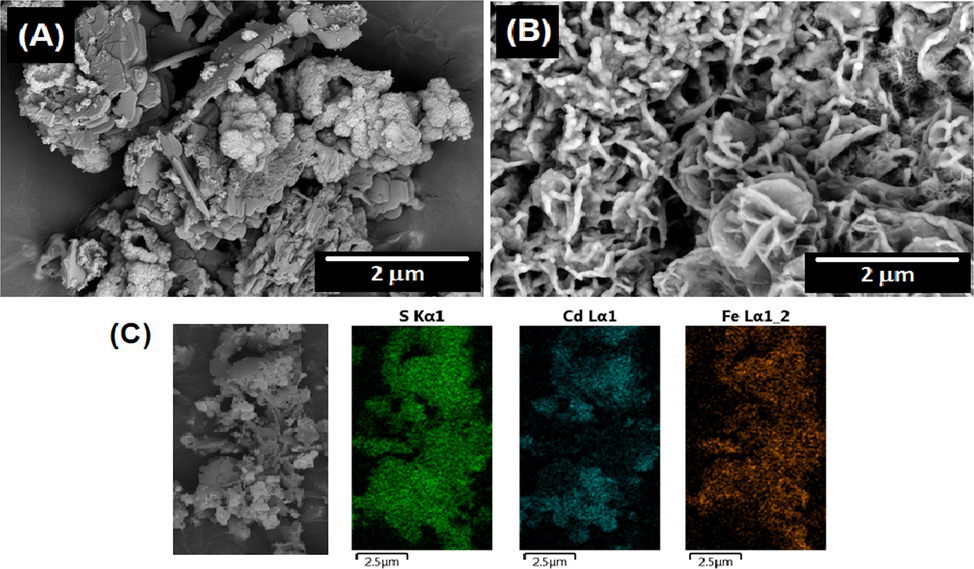
FESEM images comparing the composites produced by the chemical -(A)- and electrochemical -(B)- methods. (C) FESEM-EDS analysis of the composite Fig. 2(A) for sulphur (green dots), cadmium (blue dots) and ferrous (orange dots) elements. (For interpretation of the references to colour in this figure legend, the reader is referred to the web version of this article.)
In contrast, electrochemical reduction performed on an FTO electrode using the same reaction mixture diluted 1:5 in Milli-Q water resulted in homogenous rod-like growth on the surface of the electrode (Fig. 2-(B)). The coating obtained by potentiodynamic and potentiostatic methods is uniform over the entire electroactive surface, dark green in colour, and resistant to environmental conditions and exposure to different solvents, such as Milli-Q water, acetonitrile, ethyl alcohol and acetone.
Comparing both methods, the electrochemical method for producing composites is the more economical alternative and can achieve direct modification by using different working electrodes in very short electrosynthesis times (3-s pulses) and at low reduction potentials (-1.3 V).
3.1.2 Characterization of CdS/FeS prepared by the electrochemical method
Fig. 3-(A) shows Raman spectra obtained in a range between 100 and 1200 cm−1. The two synthesis pathways are compared: the spectrum of the sample obtained via the chemical method is shown in black, and the spectrum of the sample obtained by the electrochemical method is shown in blue.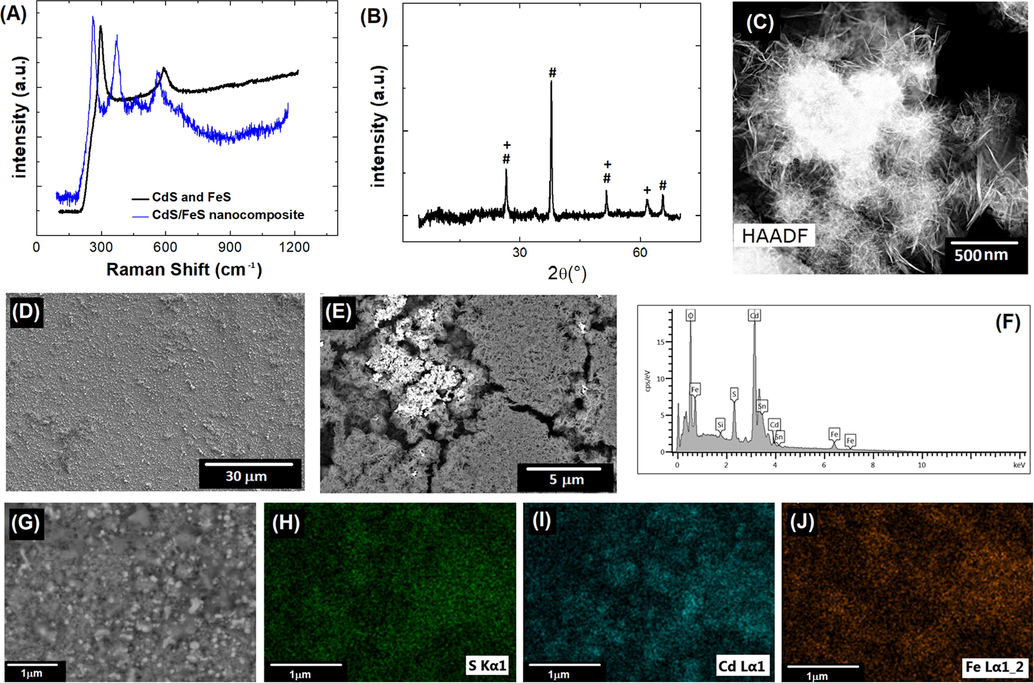
(A) Raman spectra, (B) XRD patterns of CdS/FeS nancomposite, CdS (#) and FeS (+), (C) HR-TEM CdS/FeS nanocomposite, (D), (E) FESEM images with different magnification scales of CdS/FeS, (F)-(J) FESEM-EDS analysis of CdS/FeS for: (H)sulphur (green dots), (I) cadmium (blue dots) and (J) ferrous (orange dots) elements.
The spectrum of the sample prepared by the chemical method shows two signals at 290 and 600 cm−1, corresponding to FeS and CdS, respectively (Genchev and Erbe, 2016; Haridas et al., 2019; Hellwig et al., 2000). Both signals are well defined, possibly due to the weak interaction between the substrates, showing that reduction by chemical means does not yield a composite.
The spectrum of the sample prepared by the electrochemical method (blue line) presents a shift in the aforementioned signals and the appearance of two new signals located at 389 cm−1 and 400 cm−1. These signals can be attributed to the production of FeS and S, respectively. The spectrum for the composite (blue line) shows a large amount of noise, possibly due to the high homogeneity of the composite, which was initially corroborated by FESEM images of the electrode surface (Fig. 3-(D) and (E)) and by the FESEM-EDS images, which are shown in Fig. 3-(G), (H), (I), and (J), where S, Cd and Fe atoms are shown with different colours to visualize their highly homogeneous surface distribution. To verify that the obtained composite was effectively composed of CdS and FeS, XRD characterizations were performed. The corresponding XRD pattern of the CdS/FeS nanocomposite are shown in the Fig. 3-(b). XRD analysis shows two sets of diffraction peaks, indicating that the electro-synthesized products are composite materials with good crystallinity. Those marked with “#” can be indexed to CdS, while the others marked with “+” can be indexed to FeS (JCPDS 23–1123) (Aghazadeh, 2018; Feng et al., 2018; Liao et al., 2009; Sonker et al., 2020). Finally, the composite has a mostly nanowire architecture, as indicated by the HR-TEM characterization (Fig. 3-(C)). In addition to producing a homogeneous material, the chemical method also produced nanostructured sulfides, which is why nanocomposites and not composites are discussed.
3.1.3 DFT binding free energies
In order to know prior to modification, if the electro-obtaining of the CdS / FeS composite is possible on PoPD, the possible interactions of the metal cations of Fe+ 2 and Cd+ 2 have been computationally modulated, in order to corroborate that there will be no competition between cations and it will be possible to obtain a stable composition on the polymer.
The free energy of binding is used to examine the thermodynamic stability of the polymeric-M2+ complex prior to electrochemical reduction, which allows the reduction of the metal and the formation of its respective sulfide.
Although the formation of FeS predominates over that of CdS, as seen in Fig. 2-(C), there is no incompatibility for both species to be present on the polymeric matrix; These approximations have been carried out using small oligomer chains, projecting their results for the polymer, since it is computationally impossible to quantum mechanically describe a single polymer chain (too many electrons), we calculate the free binding energies for both metal ions that interact with a, two, three and six monomer units (section 2.4).
Table 1 shows
in vacuum and implicit solvent (ethylene glycol). Regardless of the number of monomers, Fe2+ binds to o-phenylenediamine more strongly than Cd2+, which does not imply that this species is not present or does not reduce on the polymer. Since, one may argue that the interaction between a cation and a polymer chain cannot be successfully described using small oligomers, it is worth noting that
bind tends to converge to approximately −20 kcal/mol. Therefore, it should hold at this level of theory even if a larger number of monomers are considered.
Monomeric units
Vacuum
Solvent
1
−81.2
−72.0
2
−39.7
−54.0
3
–33.1
−37.1
6
–22.8
–
3.2 PoPD synthesis and electrochemical modification with FeS/CdS
Voltammetric profiles recorded by CV corresponding to the electrosynthesis of PoPD on FTO are shown in Fig. 4A. After several optimization attempts, it was established that the appropriate window for electropolymerization in the electrolytic medium employed was in the range of 0.35–1.400 V. Electrodeposition of PoPD showed that the current density increased from cycle 1 to 10, which means that the formation of polymeric deposits occurred without electrode surface passivation due to the conductive nature of the material. In addition, CV profiles corresponding to the electrosynthesis of CdS/FeS on FTO in a way similar to that on PoPD are shown in Fig. 4-(B). After several optimization attempts with varying salt concentrations, potential windows, solvents, etc. it was established that the appropriate window for the electrosynthesis of nanocomposites in the electrolytic medium employed was in the range of −1.4–0.3 V using 0.01 M of the mixture of salts in LiClO3 0.1 M. Electrosynthesis of CdS/FeS showed two reduction peaks located at −0.88 V and −1.09 V, corresponding to FeS and CdS, respectively.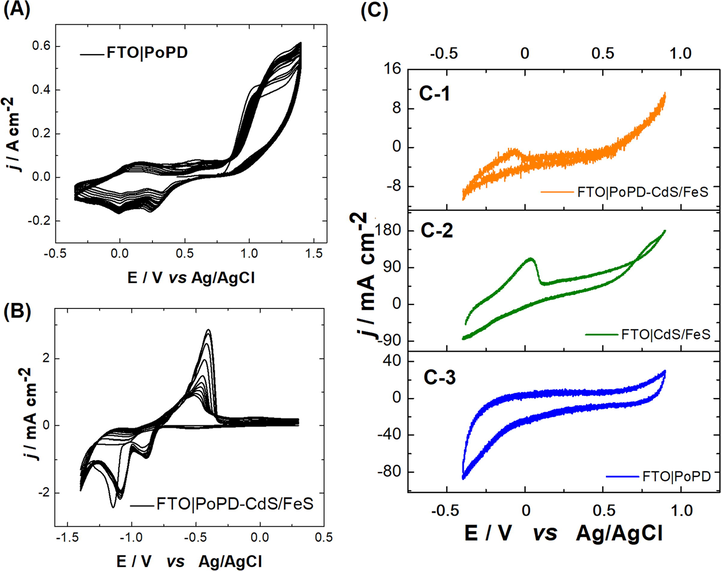
(A) Voltammetric profiles of PoPD. Interfaces: FTO|0.01 M oPD + 2 M H2SO4 /CH3CN (1:4 ratio % v/v) mixture, ν = 50 mV s−1. (B) Voltammetric profiles during CdS/FeS electro-obtainment on PoPD. Interfaces: FTO-PoPD|25 mL (salt dissolution) in 100 mL H2O milli-Q, ν = 50 mV s−1. (C) PoPD-CdS/FeS (C-1), CdS/FeS (C-2) and PoPD (C-3) responses in 0.01 M TBA PF6 in CH3CN. ν = 100 mV s−1.
The electrosynthesis of FTO|PoPD-FeS/CdS was finally performed in two steps. In the first modification step, FTO was coated with 10 cycles of PoPD, and then this modified electrode was used with a working electrode in the reaction mixture with the Cd and Fe salts mentioned in the Materials and methods. By applying a reduction potential at −1.3 V for 5 s, the PoPD could be modified with homogenously distributed nanospheres, which were characterized by FESEM and which can be observed in Fig. 6-(D) and (E). This modification was initially corroborated through the electrochemical responses for each of the deposits obtained under the same working conditions and windows. Thus, Fig. 4-(C) displays the independent responses of PoPD and CdS/FeS and the synergy that occurs when both composites are present on the electrode surface, in which the sum of both independent responses in a single voltammogram is apparent.
3.3 Reproducibility and stability of FTO|PoPD-CdS/FeS electrode
Reproducibility of the FTO|PoPD-CdS/FeS electrode was evaluated in a Phosphate buffer solution with E. Coli (6.2x10⁷ CFU/mL). As shown in Fig. 5-(A), standard deviations (s) of oxidation (Pox) and reduction (Pred) peaks (n = 8), exhibit low variability with respect to the mean. The calculated s values for Pox and Pred were 3.8 × 10⁻⁶ and 4.2 × 10⁻⁶, respectively. These results demonstrated, the good reproducibility in the obtainment of the modified electrodes, showing a good electrochemical response in E. Coli solutions.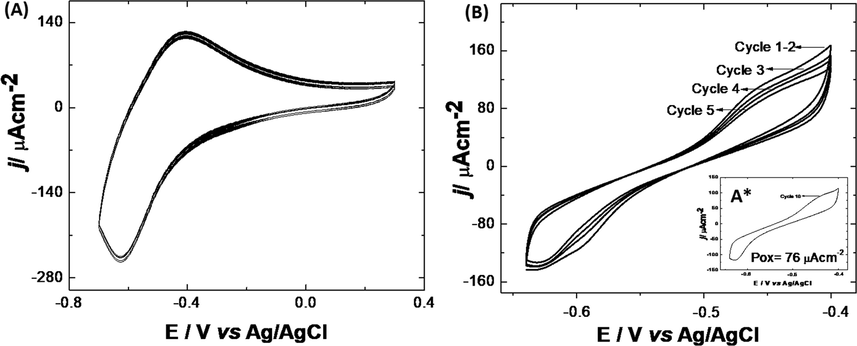
(a) Electrochemical response of FTO|PoPD-CdS/FeS (n = 8) in E. Coli solution; (b) stability of the FTO|PoPD-CdS/FeS electrode in phosphate buffer solution.
The stability of the electrodes was evaluated in the same solution without E. Coli. In Fig. 5-(B), FTO|PoPD-CdS/FeS show a regular stability in phosphate buffer solutions until the fifth cycle, exhibiting an average response, measured at 0.4 mV, of 104 μA cm−2 with s 9.32. From cycle number 6 onwards, a significant decrease in the oxidation peak begins, with a variation rate of ca. 25%.
However, it is important to note, that the low-cost of fabrication, by using just electrochemical techniques, allows perceiving its use as a disposable electrode.
3.4 Interaction of FTO|PoPD-CdS/FeS with E. Coli
Fig. 6-(A) shows the electrochemical response of all modified electrodes in the presence of a solution of E. coli dissolved in physiological phosphate buffer. Of all the responses, the best electrochemical response was obtained from the electrode modified with PoPD-CdS/FeS, presenting oxidation and reduction peaks at higher current densities, which would make this electrode suitable as a sensor for E. coli. Although the electrode modified with only CdS/FeS also presented a good response, the high concentration of metals could result in the death of bacteria, making it impossible to detect the real concentration and leading to a greater variability in responses with consecutive use of the same electrode. This reason highlights the importance of mixing PoPD with these composites since the matrix, which has an organic component and is environmentally stable in the dissolution mixture, does not kill bacteria, producing robust responses when used consecutively in solutions of E. coli.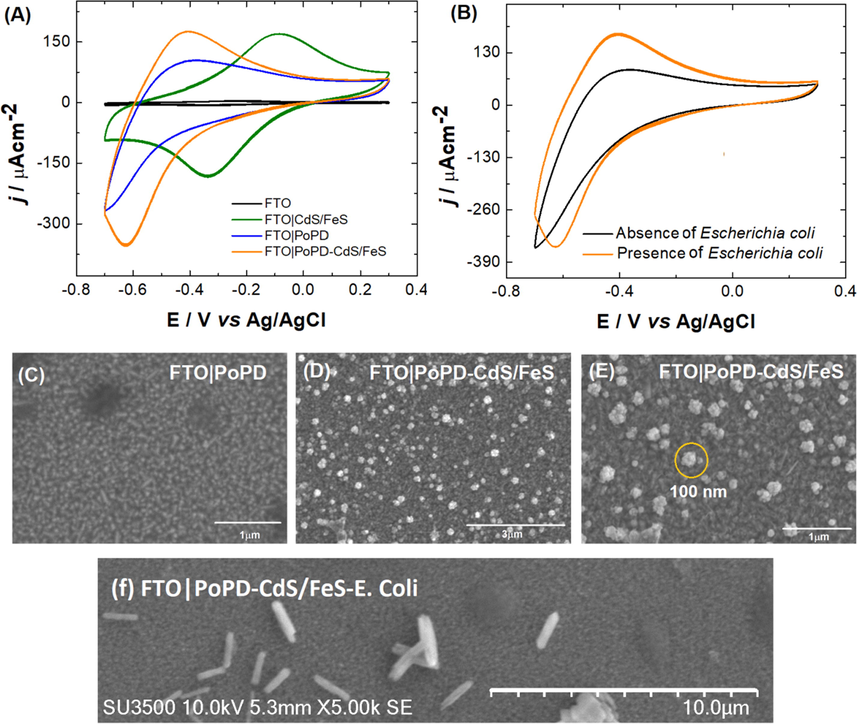
(A) Electrochemical response from different stages of modification of FTO in presence of a solution of E. coli dissolved in physiological phosphate buffer. Interfaces: FTO; FTO|CdS/FeS; FTO|PoPD, FTO|PoPD-CdS/FeS. ν = 100 mV s-1. (B) Electrochemical response of FTO|PoPD-CdS/FeS in absence and presence of E. coli physiological phosphate buffer. ν = 100 mV s−1. (C) SEM image of FTO|PoPD; (D) and (E) SEM images with different magnification scales of FTO|PoPD-CdS/FeS. (F) FTO|PoPD-FeS/CdS SEM images after E. Coli measurement.
When evaluating this electrode in the absence and presence of the target analyte (Fig. 6-(B)), we noticed a significant difference in the response density, showing that the electrode is also sensitive to the presence of bacteria. As has been corroborated in the literature and as discussed above, small concentrations of CdS and FeS have already been tested in other chemical matrices to increase the interaction of bacteria with modified electrodes. High concentrations of these compounds could destroy these bacteria, but since CdS and FeS are nanostructured and exist in low percentages compared to the polymer, they seem to be beneficial; one electrode can be consecutively used for 10 measurements without consequent passivation of the surface or death of the target analyte.
Fig. 6-(C), (D) and (E) compare the images obtained by FESEM of the modified surfaces at 2 different magnifications (3 µm and 1 µm). The images show the homogeneous surface and low surface roughness of PoPD, and the final image of the modified electrode clearly shows nanocomposites with an average size of 100 nm homogeneously distributed over the electrode after modification with CdS/FeS.
The PoPD-FeS/CdS electrode was analyzed with SEM after measurement of E. Coli, to check for the presence of bacteria cells on the modified electrode. Fig. 6-(F) shows the e. coli on the electrode surface, demonstrating that the inclusion of FeS/CdS nanocomposite on PoPD, provided a compatible surface area for the promotion of contact between the microbes and the conducting polymer.
3.5 FTO|PoPD-CdS/FeS as a biosensor for E. Coli
The voltammetric responses to different concentrations of E. coli can be found in Fig. 7-(A). The current density increases linearly with increasing concentration of the bacteria. To prepare the calibration curve, 12 samples with concentrations of 1.7 × 10⁷–1.7 × 10⁸ CFU/mL were measured. From the linear regression of each of the measured points, the equation j = -6.89 × 10⁻¹⁴ × CFU + 5.64 × 10⁻⁵ with a correlation coefficient (R2) of 0.995 was obtained for 10 replicates. The LOD was 6.1 × 10⁵ CFU/mL, and the LOQ was 6.1 × 10⁶ CFU/mL. To evaluate the repeatability of the E. coli sensor, 6 electrodes were prepared, which were used to measure the same concentration of bacteria, and a relative standard deviation of 6.2 × 10⁷ CFU/mL, corresponding to a value of 4.8%, was obtained, which shows low variability in measurements obtained for the same concentration.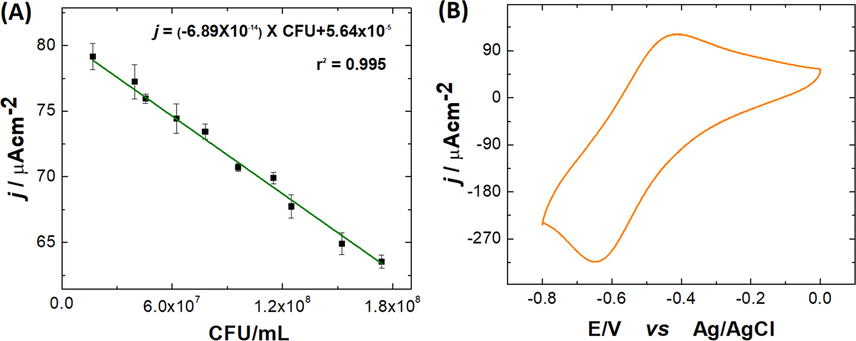
Calibration plot for current responses generated by the FTO|PoPD-CdS/FeS biosensor as a function of E. Coli concentration. (1.7 × 10⁷–1.7 × 10⁸ CFU/mL). (B) Example of the electrochemical response of the biosensor in presence of E. Coli.
4 Conclusion
A new method of electrosynthesis for the formation of CdS/FeS nanocomposites on PoPD was realized. The homogeneous distribution of these nanocomposites was observed using different techniques, such as FESEM-EDS, HR-TEM, XRD and Raman, corroborating the advantages of electrochemical processes that can be used to modify the design of new matrices to obtain electrodes that can detect E. coli. For PoPD, a low surface roughness and compact morphology were observed, facilitating the electrochemical collection of nanocomposites with an average size of approximately 100 nm on its surface. Subsequent electrochemical analyses demonstrated that the synergy involved in the process of obtaining composites by electrochemical methods alone improves the electrode response in the presence of the analyte, in addition to allowing a rapid, simple and reproducible pathway for electrode generation and the performance of measurements.
The good reproducibility in obtaining the modified electrodes has been evidenced against its redox couple in phosphate buffer solution, yielding s values of 3.8 × 10⁻⁶ and 4.2 × 10⁻⁶, for Pox and Pred, respectively.
The modified electrode displayed good stability, with a variation of approximately 10% during the first 5 cycles. Thereafter, current decrease begins to be more noticeable, reaching a decay of about 25% between cycle 6 and 10.
The E. coli sensor gave a linear equation of j = −6.89 × 10⁻¹⁴ × CFU + 5.64 × 10⁻⁵ with an R2 of 0.995 for 10 replicates. The LOD was 6.1 × 10⁵ CFU/mL, and the LOQ was 6.1 × 10⁶ CFU/mL.
Acknowledgements
The authors are grateful to FONDECYT N°11180600, PAI n°79170110 and FONDECYT N°11171043.
References
- DNA aptamer-based non-faradaic impedance biosensor for detecting E. coli. Anal. Chim. Acta. 2020;1107:135-144.
- [Google Scholar]
- One-step cathodic electrosynthesis of surface capped Fe3O4 ultra-fine nanoparticles from ethanol medium without using coating agent. Mater. Lett.. 2018;211:225-229.
- [Google Scholar]
- Novel spider web trap approach based on chitosan/cellulose nanocrystals/glycerol membrane for the detection of Escherichia coli O157:H7 on food surfaces. Int. J. Biol. Macromol.. 2020;146:1009-1014.
- [Google Scholar]
- Density-functional exchange-energy approximation with correct asymptotic behavior. Phys. Rev. A. 1988;38(6):3098-3100.
- [Google Scholar]
- Density-functional thermochemistry. III. The role of exact exchange. J. Chem. Phys.. 1993;98(7):5648-5652.
- [Google Scholar]
- Surface-modification of Cu2O nanoparticles towards band-optimized hole-injection layers in CsPbBr 3 perovskite light-emitting diodes. J. Solid State Chem.. 2020;281:121021.
- [Google Scholar]
- A novel fluorescence immunoassay for the sensitive detection of Escherichia coli O157:H7 in milk based on catalase-mediated fluorescence quenching of CdTe quantum dots. Anal. Chim. Acta. 2016;947:50-57.
- [Google Scholar]
- Graphene Based Field-Effect Transistor Biosensors Functionalized Using Gas-Phase Synthesized Gold Nanoparticles. Sens. Actuat. B-Chem.. 2020;128432
- [Google Scholar]
- Aptamer-NanoZyme mediated sensing platform for the rapid detection of Escherichia coli in fruit juice. Sens. BioSens. Res.. 2020;27:100313.
- [Google Scholar]
- Quantitative contamination and transfer of Escherichia coli from foods by houseflies, Musca domestica L. (Diptera: Muscidae) Int. J. Food Microbiol.. 2004;93(2):259-262.
- [Google Scholar]
- Polyindole/cadmium sulphide nanocomposite based turn-on, multi-ion fluorescence sensor for detection of Cr3+, Fe3+ and Sn2+ ions. Sens. Actuat. B-Chem.. 2018;269:195-202.
- [Google Scholar]
- Ultra-fast responding and recovering ethanol sensors based on CdS nanospheres doped with graphene. Appl. Surf. Sci.. 2018;453:513-519.
- [Google Scholar]
- Raman Spectroscopy of Mackinawite FeS in Anodic Iron Sulfide Corrosion Products. J. Electrochem. Soc.. 2016;163(6):C333-C338.
- [Google Scholar]
- Effect of the damping function in dispersion corrected density functional theory. J. Comput. Chem.. 2011;32(7):1456-1465.
- [Google Scholar]
- Boosting High Energy Density Lithium-Ion Storage via the Rational Design of an FeS-Incorporated Sulfurized Polyacrylonitrile Fiber Hybrid Cathode. ACS Appl. Mater. Interfaces. 2019;11(33):29924-29933.
- [Google Scholar]
- The influence of polarization functions on molecular orbital hydrogenation energies. Theor. Chim. Acta. 1973;28(3):213-222.
- [Google Scholar]
- Ab initio effective core potentials for molecular calculations. Potentials for the transition metal atoms Sc to Hg. J. Chem. Phys.. 1985;82(1):270-283.
- [Google Scholar]
- Rapid detection of Escherichia coli using a separated electrode piezoelectric crystal sensor. Anal. Chim. Acta. 1994;289(3):313-319.
- [Google Scholar]
- Self-consistent molecular orbital methods. XII. Further extensions of gaussian-type basis sets for use in molecular orbital studies of organic molecules. J. Chem. Phys.. 1972;56(5):2257-2261.
- [Google Scholar]
- FT-IR Spectroscopic Characterization of NADH: Ubiquinone Oxidoreductase (Complex I) from Escherichia coli: Oxidation of FeS Cluster N2 is Coupled with the Protonation of an Aspartate or Glutamate Side Chain. Biochemistry. 2000;39(35):10884-10891.
- [Google Scholar]
- PEDOT/graphene/nickel-nanoparticles composites as electrodes for microbial fuel cells. J. Mater. Sci.-Mater. El. 2019
- [Google Scholar]
- Generic and Shiga toxin-producing Escherichia coli (O157:H7) contamination of lettuce and radish microgreens grown in peat moss and perlite. Food Control. 2020;111:107079.
- [Google Scholar]
- COSMO: a new approach to dielectric screening in solvents with explicit expressions for the screening energy and its gradient. J. Chem. Soc., Perkin Trans.. 1993;2(5):799-805.
- [Google Scholar]
- Development of high-sensitivity ambient light sensor based on cadmium sulfide-deposited surface acoustic wave sensor. Sens. Actuat. A-Phys.. 2019;293:145-149.
- [Google Scholar]
- Electrochemical functionalization of single-walled carbon nanotubes with amine-terminated dendrimers encapsulating Pt nanoparticles: Toward facile field-effect transistor-based sensing platforms. Sens. Actuat. B-Chem.. 2018;275:367-372.
- [Google Scholar]
- Development of the Colle-Salvetti correlation-energy formula into a functional of the electron density. Phys. Rev. B. 1988;37(2):785-789.
- [Google Scholar]
- Designing an aptamer based magnetic and upconversion nanoparticles conjugated fluorescence sensor for screening Escherichia coli in food. Food Control. 2020;107:106761-106768.
- [Google Scholar]
- one-step synthesis of mannose-modified polyethyleneimine copolymer particles as fluorescent probes for the detection of escherichia coli. Sens. Actuat. B-Chem.. 2019;280:171-176.
- [Google Scholar]
- In-Situ Growing CdS Single-Crystal Nanorods via P3HT Polymer as a Soft Template for Enhancing Photovoltaic Performance. Macromolecules. 2009;42(17):6558-6563.
- [Google Scholar]
- An improved glycerol biosensor with an Au-FeS-NAD-glycerol-dehydrogenase anode. Biosens. Bioelectron.. 2017;92:417-424.
- [Google Scholar]
- Iron–sulfur-based single molecular wires for enhancing charge transport in enzyme-based bioelectronic systems. Biosens. Bioelectron.. 2016;78:477-482.
- [Google Scholar]
- Characteristics of Shiga toxin-producing Escherichia coli from meat and milk products of different origins and association with food producing animals as main contamination sources. Int. J. Food Microbiol.. 2011;146(1):99-104.
- [Google Scholar]
- Dye doped concentric shell nanoparticles for enhanced photophysical performance of downconverting light emitting diodes. J. Colloid Interf. Sci.. 2019;556:753-760.
- [Google Scholar]
- In-situ preparation of cadmium sulphide nanostructure decorated CNT composite materials for the development of selective benzaldehyde chemical sensor probe to remove the water contaminant by electrochemical method for environmental remediation. Mater. Chem. Phys.. 2020;245:122788.
- [Google Scholar]
- Rapid amperometric detection of Escherichia coli in wastewater by measuring β-D glucuronidase activity with disposable carbon sensors. Anal. Chim. Acta. 2015;892:160-166.
- [Google Scholar]
- Use of Escherichia coli genes associated with human sewage to track fecal contamination source in subtropical waters. Sci. Total Environ.. 2019;686:1069-1075.
- [Google Scholar]
- Fabrication and characterization of green synthesized ZnO nanoparticle based dye-sensitized solar cells. J. Sci.: Adv. Mater. Dev.. 2020;5:185-191.
- [Google Scholar]
- Synthesis of CdS nanoparticle by sol-gel method as low temperature NO2 sensor. Mater. Chem. Phys.. 2020;239:121975.
- [Google Scholar]
- Validation on milk and sprouts of EN ISO 16654:2001 - Microbiology of food and animal feeding stuffs - Horizontal method for the detection of Escherichia coli O157. Int. J. Food Microbiol.. 2019;288:53-57.
- [Google Scholar]
- NWChem: A comprehensive and scalable open-source solution for large scale molecular simulations. Comput. Phys. Commun.. 2010;181(9):1477-1489.
- [Google Scholar]
- A bioelectronic taste sensor based on bioengineered Escherichia coli cells combined with ITO-constructed electrochemical sensors. Anal. Chim. Acta. 2019;1079:73-78.
- [Google Scholar]
- Monolayer graphene chemiresistive biosensor for rapid bacteria detection in a microchannel. Sens. Act. Repor.. 2020;2(1):100004.
- [Google Scholar]
- Core-shell red silica nanoparticles based immunochromatographic assay for detection of Escherichia coli O157:H7. Anal. Chim. Acta. 2018;1038:97-104.
- [Google Scholar]


