

Translate this page into:
Novel visible-light-driven photocatalyst of NiO/Cd/g-C3N4 for enhanced degradation of methylene blue
⁎Corresponding author. m_karimi@pnu.ac.ir (Mohammad Ali Karimi)
-
Received: ,
Accepted: ,
This article was originally published by Elsevier and was migrated to Scientific Scholar after the change of Publisher.
Peer review under responsibility of King Saud University.
Abstract
Novel NiO/Cd/g-C3N4 photocatalysts were synthesized using a green and straightforward microwave-assisted method and characterized by X-ray diffraction (XRD), Fourier-transform infrared spectroscopy (FT-IR), the Brunauer–Emmett–Teller (BET) method, transmission electron microscopy (TEM), scanning electron microscopy (SEM), energy-dispersive X-ray spectroscopy (EDS), and ultraviolet–visible spectroscopy (UV–Vis). The ternary NiO/Cd/g-C3N4 nanocomposites were evaluated for the degradation of methylene blue (MB) at room temperature under the visible light irradiation. Experimental results revealed that the weight percent of cadmium had a remarkable effect on the photodegradation efficiency. The NiO/Cd/g-C3N4 (0.1%) sample exhibited superior activity in the degradation reaction. The activity of this nanocomposite was about 4.5 and 3.25 fold higher than those of the pure g-C3N4 and NiO/g-C3N4 samples in the degradation of MB, respectively. The enhanced photocatalytic activity was attributed to the low energy gap, increased absorption capacity of the visible light, and efficient suppression of the recombination of photogenerated electron-hole pairs. A detailed photocatalytic mechanism over the nanocomposite of NiO/Cd/g-C3N4 (0.1%) was proposed with superoxide radical anion •O2– as the main reactive species. The stability of the nanocomposite was confirmed after four consecutive runs as well.
Keywords
NiO/Cd/g-C3N4 ternary nanocomposites
Microwave-assisted synthesis
Methylene blue
UV/Vis spectroscopy

1 Introduction
Among various kinds of environmental purifying treatments, nanocomposite-based photocatalysis is a green, biocompatible, and low-cost technology that successfully eliminates the threatens to human health and ecological security (Nezar et al., 2018; Jeejamol et al., 2018; Mella et al., 2017). Today many studies are done to find visible-light-driven photocatalysts for degradation of organic pollutants (Babu et al., 2019). Graphitic carbon nitride (g-C3N4) has captured much attention in this regard (Allahresani et al., 2017). It is a polymeric semiconductor that has been widely used in the decomposition of organic contaminants (Nayak and Parida, 2019), hydrogen production (Patnaik et al., 2018), CO2 photo-reduction (Wang et al., 2015), and water splitting (Mousavi et al., 2018). Metal-free g-C3N4 is a pale yellow powder, composed of carbon and nitrogen with a theoretical ratio of 0.75 (Yin et al., 2015). It is easily synthesized by abundant nitrogen-rich precursors such as urea, thiourea, melamine, cyanamide, and dicyandiamide (Martha et al., 2013; Wu et al., 2018). It enjoys excellent properties such as thermal and chemical stability (Das et al., 2020), extreme hardness (Mousavi and Habibi-Yangjeh, 2018), nontoxicity (Yan et al., 2009), biocompatibility (Su et al., 2016), unique 2D structure (Xu et al., 2015), and narrow bandgap of 2.7 eV (Akhundi and Habibi-Yangjeh, 2017). However, due to the rapid recombination of photoinduced electron-hole pairs (Patnaik et al., 2018), low visible-light absorption capacity (Cui et al., 2016), and insufficient surface active sites (Lu et al., 2019), the pure g-C3N4 suffers from the slow reaction kinetics in photocatalysis (Bian et al., 2012; Zhou et al., 2018). So different measures for modification of g-C3N4 are proposed to overcome the above drawbacks. One of these is coupling g-C3N4 with semiconductors, metal oxides, metal sulfides, metal-free components, noble metals, halides, and composite oxides that have proper energy levels in their bandgap (Akhundi and Habibi-Yangjeh, 2015; Lai et al., 2018; Allahresani et al., 2018). Dopants have direct effects on increasing visible-light harvesting ability, enlarging the specific surface area, and suppressing the recombination of photogenerated electron-hole pairs (Deng et al., 2018; Babu et al., 2018). They maximize the lifetime of charge carriers and improve the stability and activity of g-C3N4-based photocatalysts (Lu et al., 2017; Nayak and Parida, 2018). The correlation between the amount of light absorption and/or surface area with the photocatalytic efficiency is proportional, the larger amount of light absorption and/or more active surface area, the higher photocatalytic efficiency is expected (Wen et al., 2017). In recent years, many investigations have been carried out about combining g-C3N4 with different dopants like NiO and Cd compounds. Wang et al. prepared g-C3N4/NiO p–n heterojunction materials with ball-flower morphology and showed the enhanced photocatalytic performance for the removal of tetracycline and Cr6+ pollutants (Wang et al., 2019). Zhang et al reported ultrasound exfoliation of g-C3N4 with the assistance of cadmium ions with efficient photocatalytic activity for the degradation of methyl orange (Zhang et al., 2016). Moreover, Lu et al. synthesized atomic layer g-C3N4/CdS heterojunctions with the enhanced visible-light photocatalytic activity (Lu et al., 2014).
Herein, we report the fabrication of visible-light-driven photocatalyst by introducing of nickel oxide and cadmium into the pristine g-C3N4 to prepare the ternary NiO/Cd/g-C3N4 photocatalyst. Due to synergistic effects, found within the heterogeneous structures of the ternary photocatalysts, remarkable enhancement in the photoactivity is observed (Wen et al., 2017; Zhou et al., 2017). To the best of our knowledge, this is the first study to describe the ternary NiO/Cd/g-C3N4 co-catalysts. We benefited a lot from the microwave absorption properties of g-C3N4 (Green et al., 2018) and followed the facile, low temperature, short time, and energy-saving microwave-assisted synthesis method. The structure, morphology and physicochemical properties of the samples were characterized by XRD, FT-IR, BET, TEM, SEM, EDS, and UV–Vis analytical techniques. As expected, doping with a metal oxide (NiO) and a metal element (Cd) enhanced the visible-light responsive photocatalytic activity of the g-C3N4 through making the desired band structure and promoting electron transfer rate. In the present work, the influence of weight percent of cadmium on the photodegradation efficiency was also investigated, and a possible mechanism for the superior photocatalytic performance was proposed. Finally, the stability of the NiO/Cd/g-C3N4 photocatalyst was tested for four successive runs.
2 Experimental
2.1 Materials
Melamine, nickel(II) nitrate hexahydrate, sodium hydroxide, ethanol, glucose, methylene blue hydrate, cadmium acetate dehydrate were employed without further purification. Deionized (DI) water was used in all of the experiments.
2.2 Instruments
The XRD analysis patterns were obtained on PHILIPS X’PERT PRO X-ray diffractometer using Cu-Kα radiation (λ = 1.5406 Å, 2θ = 10–80°) to study the crystalline structure of the samples. The FT-IR chemical analysis spectra were recorded on SHIMADZU IRPRESTIGE-21 IR spectrophotometer using KBr method in the range of 400–4000 cm−1. The N2 adsorption–desorption isotherms were measured by BELSORP MINI II apparatus at 196 °C. Before the analysis, the BEL PREP VAC II degassed the samples at 120 °C for 15 h. The data of specific surface areas were calculated with the Brunauer–Emmett–Teller (BET) method. The TEM structural morphologies were investigated by PHILIPS CM 120 apparatus. The SEM surface morphologies and EDS elemental mapping micrographs were collected by MIRA III VEGA-TESCAN-XMU instrument. Before the analysis, samples were mounted on aluminum stubs using double-sided adhesive tapes and coated with a thin layer of gold. The UV–Vis spectra were achieved on GBC CINTRA 20 apparatus in the wavelength range of 200–800 nm.
2.3 Preparation of photocatalysts
Melamine (5 g) as the precursor of g-C3N4 was put in a covered alumina crucible and calcined at 550 °C for four hours; then, it cooled down to room temperature. The pale yellow g-C3N4 solid was ground into the light powder and collected for further use. Afterward, nickel nitrate (0.22 g) as the precursor and sodium hydroxide (0.44 g) as the precipitating agent were dissolved in DI water (100 ml) and heated at 60 °C for 45 min to form NiO solution. Then cadmium acetate (300 mg) as the precursor of cadmium (0.05, 0.1, 0.2, 0.4, and 0.5 wt%) was obtained. When air annealing, acetate totally or partially decomposed and produced volatile compounds and traces of carbon, so no impure substance influenced the photocatalytic efficiency.
For fabrication of the NiO/Cd/g-C3N4 photocatalyst, g-C3N4 (300 mg) and glucose (90 mmol) as the natural nanoparticles stabilizer were dispersed in ethanol/DI water 1:1 (10 ml) and heated at 60 °C for 30 min using a magnetic stirrer. Then NiO solution and cadmium acetate were slowly added to the mixture. The obtained suspension was refluxed at 60 °C for 60 min, treated with ultrasound for 45 min and refluxed again at 60 °C for three hours (Ostwald ripening precipitation). After adjusting pH to eight and centrifugal separation, the precipitate was put in a microwave. It was exposed to MW radiation (600 W) for 5 min as 2 min on and 1 min off and finally cooled at room temperature. Then, the NiO/Cd/g-C3N4 precipitate was rinsed with ethanol and DI water several times and dried at 60 °C for 24 h. The as-prepared photocatalysts were labeled as NiO/Cd/g-C3N4 (X%), where X represents the weight percent of cadmium. Meanwhile, the NiO/g-C3N4 sample was synthesized under the same conditions. The whole mechanism of the experimental synthesis is documented in Scheme 1.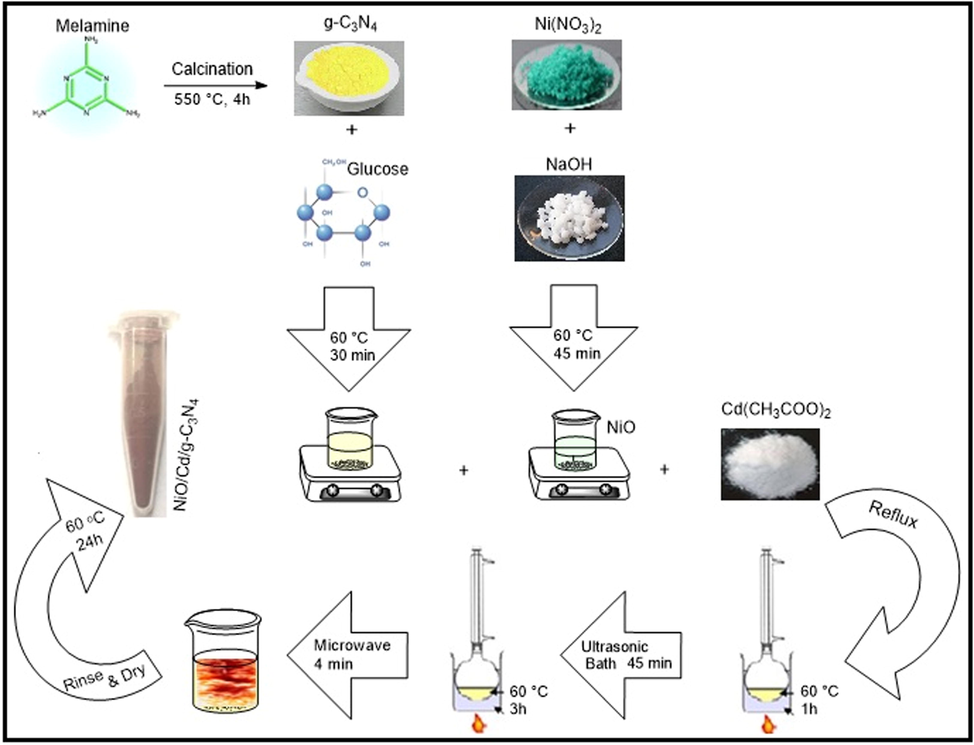
The schematic diagram for the preparation of the NiO/Cd/g-C3N4 nanocomposites.
2.4 Photocatalysis experiments
The photocatalytic activity of the as-synthesized nanocomposites was evaluated by the degradation of MB as a model cationic dye under the visible light irradiation. The experiments were done inside the enclosed wooden reactor system. It was equipped with a 50 W LED lamp to supply the visible illumination, a small air ventilator to supply oxygen, a water jacket to keep the temperature of the system at room temperature, and a Pyrex glassware reactor to contain MB aqueous solution. Before illumination, the nanocomposite (0.1 g) was dispersed into an MB solution (100 ml, 3 × 10⁻⁵ M). The suspension was mechanically stirred for 30 min to reach the adsorption–desorption equilibrium in the dark. The first sample (2 ml) was afterward taken and called “sample at zero times of illumination”; then, the reaction solution was placed under the visible light irradiation, and samples were taken every 10 min for 90 min. The samples were finally centrifuged at 4000 rpm for 4 min to get the precipitate out. The absorbance of the samples was measured at 664 nm (λmax of MB) with a UV–Vis spectrophotometer. The photodegradation rate (η) of MB was calculated as follows:
2.5 Reactive species trapping experiments
The radical trapping experiments determined the active species during the photocatalytic reaction. The •O2– and •OH radicals plus the holes were scavenged by benzoquinone (BQ), isopropanol (2-PrOH) and potassium iodide (KI), respectively.
3 Results and discussion
3.1 Photocatalysts characterization
The XRD patterns of the g-C3N4, NiO/g-C3N4, and NiO/Cd/g-C3N4 (0.1%) nanocomposites are shown in Fig. 1. Typically, two distinct diffraction peaks at 13.1° and 27.4° correspond to the (1 0 0) and (0 0 2) lattice planes of the g-C3N4, respectively (JCPDS 87-1526). The diffraction of the (1 0 0) plane matches the tri-s-triazine unit structure, the precursor of melamine. The ring structure of the tri-s-triazine reduces the bond reaction barrier between carbon and nitrogen to enhance the crystalline characteristic of the graphitic nanostructure layers. The diffraction of the (0 0 2) plane corresponds to the interlayer accumulation of conjugated aromatic compounds, representing the graphitic structure. The XRD patterns of the NiO/g-C3N4 and NiO/Cd/g-C3N4 (0.1%) samples exhibit similar peak positions to that of the g-C3N4. They confirm that doping with NiO and Cd species do not change the lattice structure of g-C3N4, but reduce the crystallinity by decreasing diffraction intensity. The characteristic peaks of NiO and Cd particles are observed. Compared with the XRD pattern of the NiO/g-C3N4, a shift is seen on the two peaks at about 55° and 67° in that of the NiO/Cd/g-C3N4 sample. It might be due to various factors such as crystallite size, orientation, shape, stress, and thermal annealing. The absence of additional peaks confirms the formation of the photocatalyst without any impurity.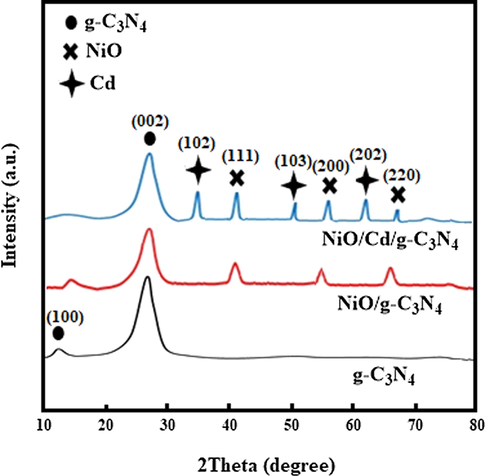
The XRD patterns of the g-C3N4, NiO/g-C3N4, and NiO/Cd/g-C3N4 (0.1%) nanocomposites.
The FT-IR spectra of the g-C3N4, NiO/g-C3N4, and NiO/Cd/g-C3N4 (0.1%) nanocomposites are presented in Fig. 2. The broad absorption bands around 3400 cm−1 are corresponding to the O—H stretching vibration of water molecules adsorbed on the surface of nanocomposites (Karimi et al., 2015). The absorption peaks at about 2900 cm−1 are assigned to the stretching vibration of the C—H bond (Li et al., 2015). The C—N heterocycles stretching vibrations are observed at around 1600 cm−1 (Li et al., 2018), and the C—O stretching vibrations are located at 1050 cm−1 (Habibi and Rahmati, 2014). Two weak and broad peaks around 684 and 1394 cm−1 are ascribed to the presence of Cd (Peng et al., 2016). The absorption peak at 570 cm−1 originates from the stretching vibration of the Ni-O bond (Dharmaraj et al., 2006). The results confirm that NiO and Cd particles successfully interact with the pure g-C3N4 to form binary and ternary nanocomposites.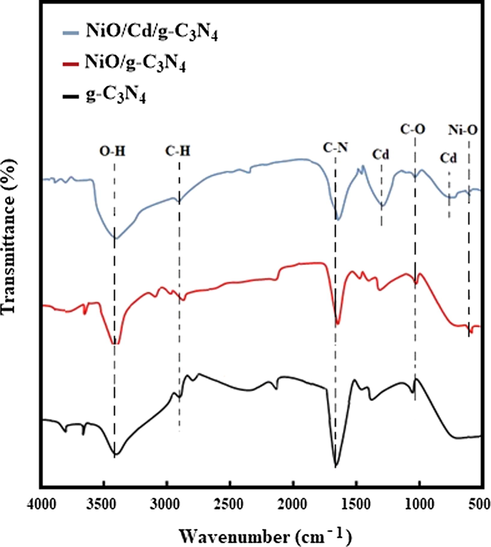
The FT-IR spectra of the g-C3N4, NiO/g-C3N4, and NiO/Cd/g-C3N4 (0.1%) nanocomposites.
The N2 adsorption–desorption isotherms analyses of the samples are shown in Fig. 3. The specific surface areas calculated by the BET method are 15, 35 and 27 m2 g−1 for the g-C3N4, NiO/g-C3N4, and NiO/Cd/g-C3N4 (0.1%) nanocomposites, respectively. The increase in the specific surface area of the NiO/g-C3N4 sample might be due to the hierarchical structure formed by NiO on the g-C3N4, similar to many studies about the synthesis of the pure g-C3N4 (Kumaresan et al., 2020). However, by the decoration of Cd particles on the nanocomposite of NiO/g-C3N4, the specific surface area decreases to some extent. This decrease might be related to filling or blocking some of the active sites at the surface of the NiO/g-C3N4 by Cd species. These data verify that the specific surface area (SSA) of ternary nanocomposite photocatalysts do not play a major role in the enhancement of the photocatalytic activity (Nagajyothi et al., 2017).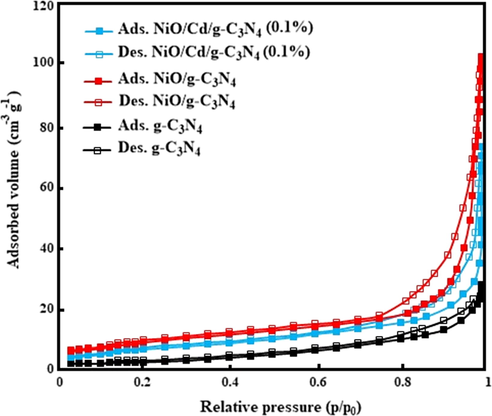
The nitrogen adsorption–desorption data for the g-C3N4, NiO/g-C3N4, and NiO/Cd/g-C3N4 (0.1%) nanocomposites.
The surface morphologies and microstructures of the g-C3N4, NiO/g-C3N4, and NiO/Cd/g-C3N4 (0.1%) nanocomposites are presented in Fig. 4. SEM images (Fig. 4a–d) show the porous surface of the nanocomposites that act as adsorbents for dye molecules. As can be seen in TEM images (Fig. 4e and f), the nanosheets of g-C3N4 are thin and transparent to the electron beam. The observations confirm the successful decoration of NiO and Cd species over the surface of the g-C3N4.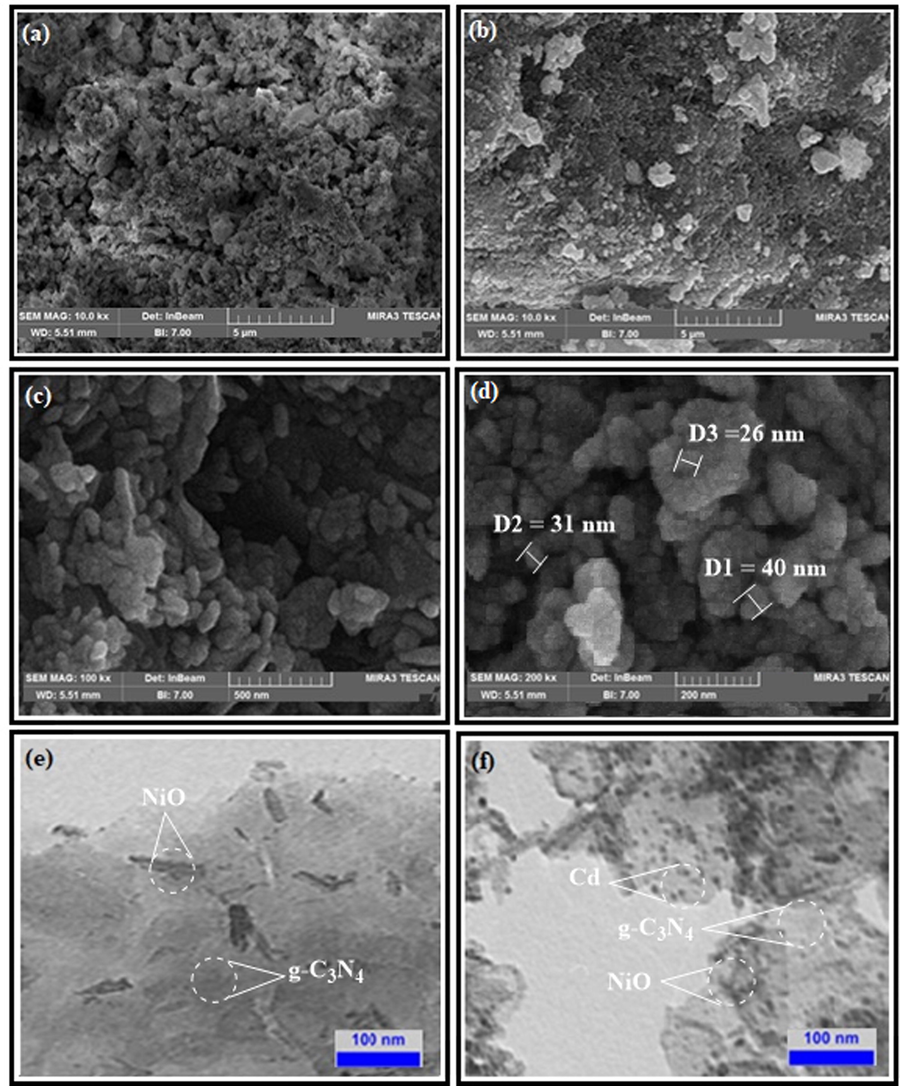
The SEM images of the (a) g-C3N4, (b) NiO/g-C3N4, (c) and (d) NiO/Cd/g-C3N4 (0.1%) nanocomposites. The TEM images of the (e) NiO/g-C3N4, and (f) NiO/Cd/g-C3N4 (0.1%) nanocomposites.
The identification and elemental mapping of the NiO/g-C3N4 and NiO/Cd/g-C3N4 (0.1%) nanocomposites confirmed by the EDS spectra are shown in Fig. 5. The peaks are ascribed to C, N, O, Ni, and Cd elements and detected at their proper level of energy. The results are in good harmony with other investigations and confirm the deposition of NiO and Cd species on the g-C3N4.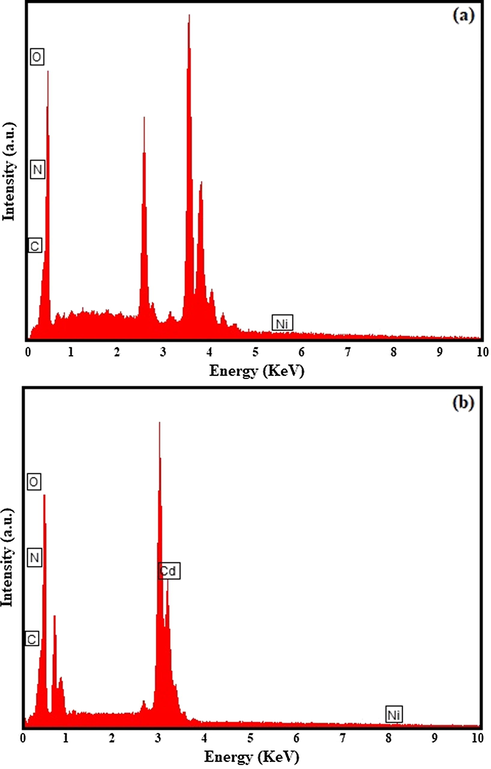
The EDS spectra of the (a) NiO/g-C3N4 and (b) NiO/Cd/g-C3N4 (0.1%) nanocomposites.
Methylene blue was selected as a common organic pollutant to evaluate the photocatalytic performance of the as-fabricated samples under visible light irradiation. Fig. 6 shows plots of the absorbance versus wavelength at different irradiation times for photodegradation of MB over binary NiO/g-C3N4 and ternary NiO/Cd/g-C3N4 (0.1%) nanocomposites. It is clear that the intensity of the absorption peaks at 664 nm gradually decreases without any changes in the positions. The highest photocatalytic activity is considered for ternary NiO/Cd/g-C3N4 (0.1%) nanocomposite; MB degradation efficiency accomplishes 81.8% within 90 min photocatalytic reaction.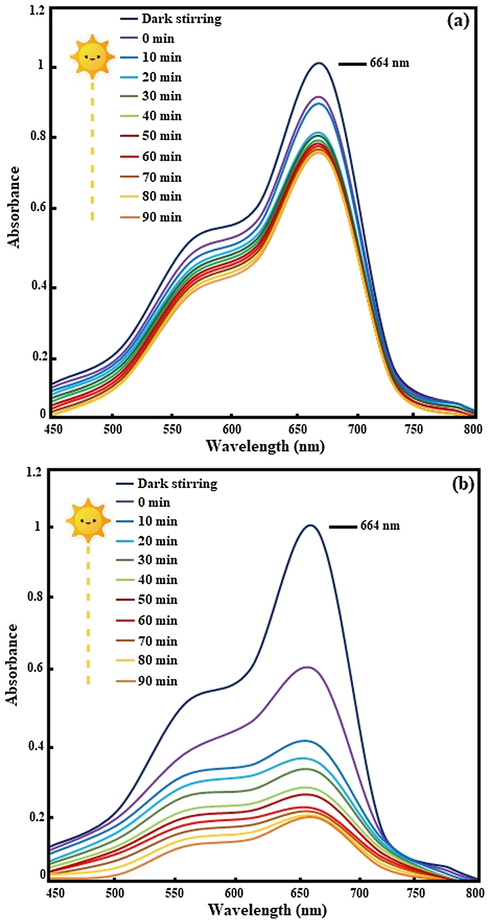
The UV/Vis spectra for degradation of MB under the visible light irradiation over the (a) NiO/g-C3N4 and (b) NiO/Cd/g-C3N4 (0.1%) nanocomposites.
3.2 Photocatalytic activity
Plots of the absorbance of MB versus different irradiation times over the as-synthesized nanocomposites, as shown in Fig. 7a, reveal the photocatalytic activity of each sample. The behavior of the photocatalysts in the dark was also displayed to show the influence of the surface adsorption on the photocatalytic activity. As can be seen, after 30 min stirring in the light off and 90 min in the light on, the g-C3N4 exhibited a weak performance; just 18.2% of MB molecules were photodegraded. The low photocatalytic efficiency was attributed to the rapid recombination of photogenerated electron-hole pairs and the participation of a small fraction of charge carriers in the photocatalytic reactions (Huang et al., 2017). Due to the effect of metal oxide doping on promoting separation and migration of electrons, the nanocomposite of NiO/g-C3N4 showed a better photocatalytic activity; 25.2% of dye molecules were degraded. Active sites on the p-type NiO, governed by the polarity of MB cationic dye, prevented linking the dye chromophores to the surface of the catalyst, resulting in low degradation efficiency (Kumar et al., 2017). The photocatalytic performance of ternary NiO/Cd/g-C3N4 nanocomposites considerably depended on cadmium weight percent. Cd ions modified the nanocomposites to show improved photocatalytic efficiency. The photocatalytic activity of the nanocomposite of NiO/Cd/g-C3N4 (0.05%) proceeded slowly and reached 28.2%. It revealed that Cd weight percent was not enough to eliminate the repulsive forces that existed between Ni on the surface of the photocatalyst and MB dye molecules. The optimum photocatalytic activity found to be for the NiO/Cd/g-C3N4 (0.1%) nanocomposite. MB degradation efficiency as 81.8% was about 4.5 and 3.25 fold higher than those of the pure g-C3N4 and NiO/g-C3N4 samples, respectively. It was mainly ascribed to the Cd sufficient weight percent. Cd species acted as trapping sites of charge carriers, suppressed the electron-hole recombination rate, and caused more adsorption of dye molecules on the surface of the photocatalyst. However, by increasing Cd weight percent, the photocatalytic activity descended. Nearly 60, 55, and 52% of MB molecules were photodegraded over the NiO/Cd/g-C3N4 (0.2%), NiO/Cd/g-C3N4 (0.4%), and NiO/Cd/g-C3N4 (0.5%) nanocomposites, respectively. It followed that cadmium-rich active sites on the surface of the nanocomposites were not chemically beneficial to absorb more visible light and degrade dye molecules. As seen, the lower photocatalytic activity was ascribed to the sample with the highest cadmium content (0.5%) (Wang et al., 2015).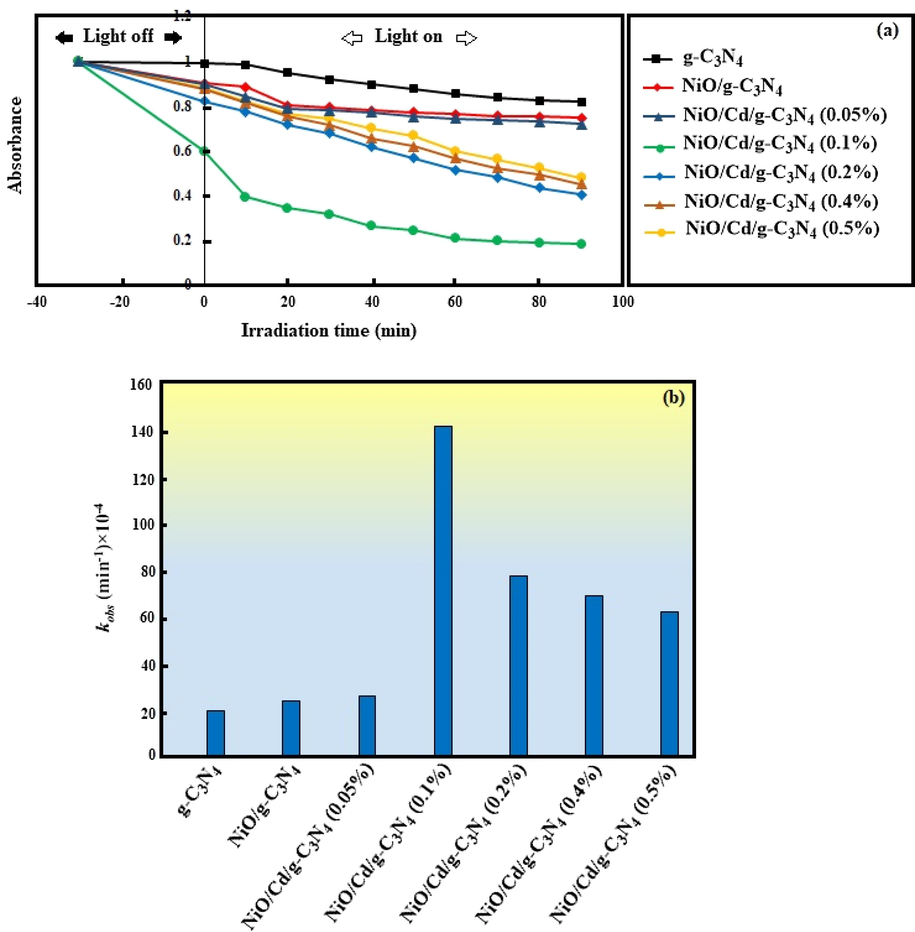
(a) The photocatalytic degradation of MB over the g-C3N4, NiO/g-C3N4, and NiO/Cd/g-C3N4 nanocomposites with different weight percent of Cd. (b) The kinetic constant of MB degradation reaction over the different nanocomposites.
Concerning the Langmuir–Hinshelwood kinetic model, photocatalytic Degradation of MB over the photocatalysts was expressed by pseudo-first-order equation at low concentrations:
In which [MB] and [MB]0 are concentrations of MB at time of t, and zero, respectively and kobst (min−1) is the pseudo-first-order kinetic constant estimated from the slope of the linear relationship of ln (C0/Ct) versus t (Pirhashemi and Habibi-Yangjeh, 2013). The results of kobst calculation are shown in Fig. 7b. It appears that the weight percent of Cd greatly exerts influence on kinetic constant for photodegradation of MB. The k value for degradation of MB over the g-C3N4, NiO/g-C3N4 and NiO/Cd/g-C3N4 (0.05%) nanocomposites are 20 × 10−4, 24 × 10−4, and 26 × 10−4 min−1, respectively. By further rising Cd weight percent, the degradation kinetic constant considerably increases and then decreases. The k value of MB degradation over the NiO/Cd/g-C3N4 (0.1%), NiO/Cd/g-C3N4 (0.2%), NiO/Cd/g-C3N4 (0.4%), and NiO/Cd/g-C3N4 (0.5%) samples are 141 × 10−4, 77 × 10−4, 69 × 10−4, and 62 × 10−4 min−1, respectively. The nanocomposite with 0.1 wt% Cd exhibits the enhanced kinetic constant for photodegradation of MB, which is 7 and 5.8 times greater than those of the pure g-C3N4 and NiO/g-C3N4 samples, respectively. It is concluded that adding an adequate amount of Cd content might increase the number of active sites, enhance the light absorption capacity, and suppress the recombination of electron-hole pairs. Besides, adding an extra amount of Cd species might fill and block some of the active sites on the surface of the nanocomposites, resulting in the reduction of photocatalytic activity.
3.3 Photocatalytic mechanism
The reasonable mechanism for degradation of MB over the NiO/Cd/g-C3N4 (0.1%) nanocomposite under the visible light irradiation is depicted in Fig. 8a. Photons with energy equal to or greater than the bandgaps of the semiconductor counterparts of the nanocomposite generate electron-hole pairs (Yang et al., 2016). As the photogenerated electrons transit from the valence band (VB) to the conduction band (CB), leave behind them empty spaces called the holes (Chang et al., 2014). Free electrons and holes make a negative mass on CB and a positive mass on VB, respectively, and take part in the chemical redox reactions at the surface of the nanocomposite (Han et al., 2015).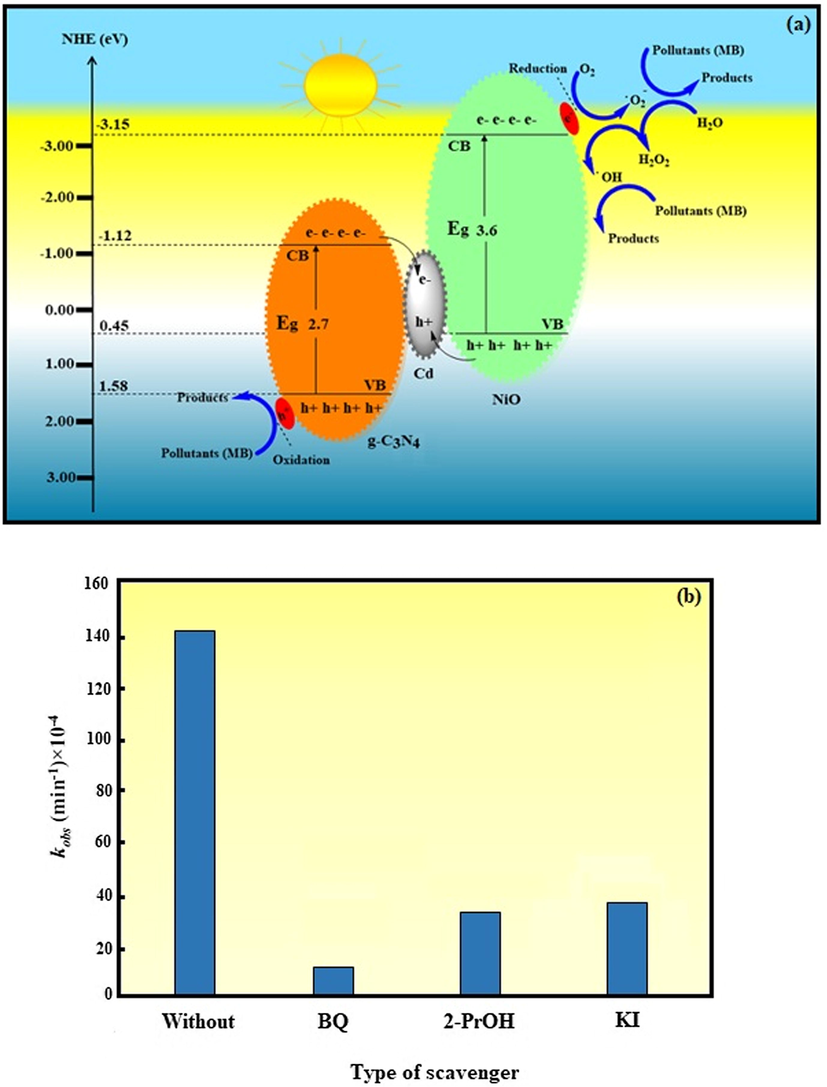
(a) The schematic illustration for the possible mechanism of MB degradation over the NiO/Cd/g-C3N4 (0.1%) nanocomposite. (b) The degradation kinetic constant of MB over the NiO/Cd/g-C3N4 (0.1%) nanocomposite in the presence of different scavengers.
Concerning Butler and Ginley model, electron transfer mode depends on CB and VB energies of the semiconductors at the point of zero charges, calculated by the following equations:
The CB and VB energies of g-C3N4 and NiO were calculated −1.12, 1.58 eV, and −3.15, 0.45 eV, respectively. Under the visible light irradiation, electrons from the VB transit to the CB of g-C3N4 and NiO counterparts of the NiO/Cd/g-C3N4 nanocomposite, owing to their low Eg values, 2.7 and 3.6 eV, respectively. As illustrated in Fig. 8a, the numerical value of the CB and VB energies of g-C3N4 are greater than those of NiO, so the transfer mode of electrons and holes may be consistent with the Z-scheme-based system (ZBS), a broader redox mechanism which represents more positive VB and more negative CB potentials (Mishra et al., 2019; Patnaik et al., 2018; Acharya et al., 2017). Due to the more negative potential of the CB of NiO compared with that of g-C3N4, some of the photogenerated electrons easily transfer from the CB of NiO to the CB of g-C3N4. Furthermore, a number of the electrons react with the adsorbed O2 molecules to produce •O2–, because the potential of O2/•O2– (−0.33 eV) is more positive than the potentials of the CB of the semiconductors (Tian et al., 2019). On the other hand, the potential of O2/H2O2 (0.69 eV) is more positive than the CB potentials of g-C3N4 and NiO. Hence, the electrons on the CB can reduce O2 to H2O2 and form •OH radicals by capturing electrons (Jiang et al., 2012). Besides, some of the accumulated electrons on the CB of g-C3N4 transfer to cadmium-rich sites. Cd ions effectively promote the separation of electron-hole pairs, prolong the lifetime of photoinduced charge carriers and enhance the photocatalytic efficiency. From the thermodynamic point of view, the electrons and holes immigrate in the opposition direction. The VB potential of g-C3N4 is more positive than that of NiO. As a consequence, the photogenerated holes transfer from the VB of g-C3N4 to the VB of NiO. Since the potentials of •OH/H2O (2.72 eV) and •OH/–OH (2.38 eV) is higher than the VB potentials of the semiconductors, the photogenerated holes cannot react with the adsorbed H2O and –OH to produce •OH radicals (He et al., 2013). The superoxide radical anion •O2–, hydroxyl radical •OH, and the holes are known as the reactive species that decompose methylene blue molecules to CO2, H2O, and final degradation products (inorganic salts) without any secondary pollutants.
A series of scavengers were added to the system to reveal the major reactive species in the degradation of MB. Fig. 8b shows the plot of the degradation kinetic constant (k) in the presence of BQ (scavenger of •O2–), 2-PrOH (scavenger of •OH), and KI (scavenger of the holes) (Mousavi and Habibi-Yangjeh, 2015). As can be seen, the k value without using any scavenger decreased from 141 × 10−4 to 12 × 10−4, 32 × 10−4, and 38 × 10−4 min−1 in the presence of BQ, 2-PrOH, and KI, respectively. The decrease of k value in the presence of BQ is much higher than those of 2-PrOH and KI scavengers. As a result, •O2– plays a significant role in the degradation of MB over the NiO/Cd/g-C3N4 (0.1%) nanocomposite.
3.4 Reusability test
From the viewpoint of economic efficiency, stability and lifetime of photocatalysts are essential factors. In this study, the photodegradation experiments were carried out four times under the same conditions to show the reusability of the NiO/Cd/g-C3N4 (0.1%) nanocomposite. In each recycling run, the catalyst was collected by centrifugation, washed with ethanol/DI water, and calcined at 550 °C for two hours. As shown in Fig. 9, after four repeated runs, no remarkable decrease in the photocatalytic activity occurred. MB molecules were successfully degraded at the rate of 81.8, 81.5, 80.6, and 80.1% in the 1st, 2nd, 3rd, and 4th runs, respectively. It means that the NiO/Cd/g-C3N4 (0.1%) nanocomposite has a useful life and can be suitable for practical applications.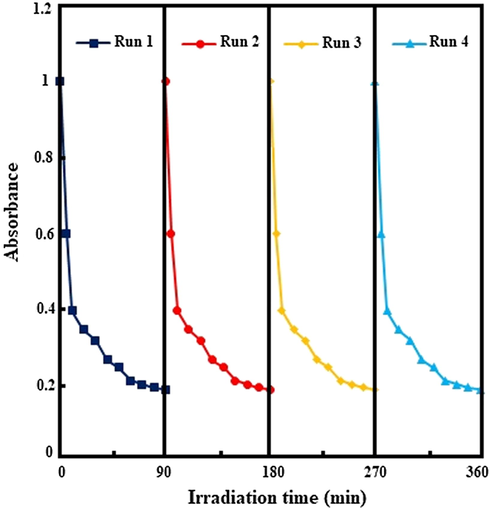
Reusability of the NiO/Cd/g-C3N4 (0.1%) nanocomposite for four successive runs.
4 Conclusions
Briefly, we successfully prepared a series of novel NiO/Cd/g-C3N4 nanocomposites with different weight percent of cadmium using the green and straightforward microwave-assisted method. The as-synthesized nanocomposites were characterized by XRD, FT-IR, BET, SEM, TEM, EDS, and UV–Vis analytical techniques. Photocatalytic activity of the visible-light-driven photocatalysts was evaluated by the degradation of MB aqueous solution at room temperature. The results demonstrated that the weight percent of cadmium had a remarkable influence on the degradation reaction. The enhanced photocatalytic activity of the nanocomposite with 0.1 wt% Cd was attributed to the Z-scheme charge transfer mode, resulting in a more effective separation of photogenerated electron-hole pairs. Then •O2– radicals were recognized as the main active species during the reaction by the radical trapping experiments. Finally, the reusability of the nanocomposite was confirmed after four consecutive runs.
Acknowledgment
The Iran National Science Foundation (INSF), Iran and Payame Noor University are gratefully acknowledged for financial support of this work (Grant No. 95006259), Iran.
Declaration of Competing Interest
The authors declare that they have no known competing financial interests or personal relationships that could have appeared to influence the work reported in this paper.
References
- Inorg. Chem. Front.. 2017;4(6):1022-1032.
- Ceram. Int.. 2015;41:5634-5643.
- J. Colloid Interface Sci.. 2017;504:697-710.
- Res. Chem. Intermed.. 2017;43:6367-6378.
- Res. Chem. Intermed.. 2018;44:1173-1188.
- ACS Appl. Energy Mater.. 2018;1(11):5936-5947.
- Inorg. Chem.. 2019;58(18):12480-12491.
- Chem. Sci.. 2012;3:370-379.
- ACS Appl. Mater. Interfaces.. 2014;6:5083-5093.
- Appl. Catal. B.. 2016;181:413-419.
- J. Colloid Interf. Sci.. 2020;561:551-567.
- J. Hazard. Mater.. 2018;344:758-769.
- Mater. Sci. Eng. B.. 2006;128:111-114.
- Mater. Today Phys.. 2018;5:78-86.
- Spectrochim. Acta. A.. 2014;133:13-18.
- Chin. J. Catal.. 2018;39:831-840.
- Nano Res.. 2015;8:1199-1209.
- J. Phys. Chem. C.. 2013;118:389-398.
- J. Mater. Chem. A.. 2017;5:17452-17463.
- J. Mater. Sci. Mater. Electron.. 2018;29:97-116.
- Chem. Eur. J.. 2012;18:6360-6369.
- Res. Chem. Intermed.. 2015;41:6157-6168.
- J. Mater. Sci. Mater. Electron.. 2017;28:9024-9031.
- Arab. J. Chem.. 2020;13:2826-2843.
- J. Mater. Sci. Mater. Electron.. 2018;29:4509-4516.
- J. Macromol. Sci. A.. 2018;55:408-413.
- J. Hazard. Mater.. 2015;283:371-381.
- Phys. Chem. Chem. Phys.. 2014;16:21280-21288.
- Appl. Catal. B.. 2019;252:250-259.
- Appl. Catal. B.. 2017;202:489-499.
- J. Mater. Chem. A. 2013;1. 26:7816-7824.
- Ozone Sci. Eng.. 2017;40:133-140.
- Nanoscale Adv.. 2019;1. 5:1864-1879.
- Mater. Chem. Phys.. 2015;163:421-430.
- J. Mater. Sci. Mater. Electron.. 2018;29:1719-1747.
- J. Mater. Sci.. 2018;53:9046-9063.
- Sep. Purif. Technol.. 2017;188:228-237.
- ACS Omega. 2018;3(7):7324-7343.
- Sci. Rep.. 2019;9(1):1-23.
- Arab. J. Chem.. 2018;01:1-10.
- Catal. Today. 2018;315:52-66.
- Renew. Sust. Energ. Rev.. 2018;82:1297-1312.
- Nanoscale. 2018;10. 13:5950-5964.
- RSC Adv.. 2016;6:77760-77767.
- Appl. Surf. Sci.. 2013;283:1080-1088.
- Chem. Cat. Chem.. 2016;8:3527-3535.
- J. Mater. Chem. A. 2019;7:11584-11612.
- Appl. Catal. B.. 2015;176:44-52.
- J. Mater. Sci.. 2019;54:11417-11434.
- J. Alloy. Compd.. 2015;637:127-132.
- ACS Appl. Mater. Interfaces.. 2017;9:14031-14042.
- ACS Sust. Chem. Eng.. 2017;5:2224-2236.
- Catal. Lett.. 2018;148:2179-2189.
- RSC Adv.. 2015;5:95727-95735.
- Langmuir.. 2009;25:10397-10401.
- RSC Adv.. 2016;6:40664-40675.
- Catal. Sci. Technol.. 2015;5:5048-5061.
- J. Taiwan Inst. Chem. E.. 2016;60:643-650.
- Sust. Energy Fuels.. 2017;1:317-323.
- Part. Part. Syst. Char.. 2018;35:1700038-1700046.


