

Translate this page into:
Occurrence and spatial distribution of statins, fibrates and their metabolites in aquatic environments
⁎Corresponding author. msagatam@unisa.ac.za (Titus A.M. Msagati)
-
Received: ,
Accepted: ,
This article was originally published by Elsevier and was migrated to Scientific Scholar after the change of Publisher.
Peer review under responsibility of King Saud University.
Abstract
Due to widespread occurrence of lipid lowering drugs such as statins, fibrates and their metabolites in the aquatic environments, there is a worldwide growing concern in their role in water quality and aquatic biota. However, this concern is limited by ability to address their occurrence, distribution, fate and eco-toxicological effects. This study focuses on the quantification of the levels of statins, fibrates and their metabolites in the aquatic environments using Ultra-High Performance Liquid Chromatography coupled to high resolution quadrupole time-of-flight mass spectrometry (UHPLC-QTOF-MS). The developed UHPLC–QTOF–MS based method was successfully applied to the analysis of statins, fibrates and metabolites in real water samples collected from Daspoort WWWs influent and effluent and Apies River. A series of statin compounds (mevastatin, simvastatin, pravastatin, rosuvastatin, fluvastatin, atorvastatin), fibrates (gemfibrozil, fenofibrate) and the corresponding metabolites (clofibric and fenofibric acids) were detected and quantified in the range of 0.56–19.90 µg/L in both waste and River water samples. In general, the results of the present study are an indication of pollution hazards from wastewater treatment processes and these levels poses a huge risk to the growth and reproduction of aquatic organisms. Thus, regulating the limit levels of statins, fibrates and metabolites in any type of water is paramount as it will provide the vital information on the toxic risks associated with organic pollutants of pharmaceutical origin.
Keywords
Aquatic ecosystem
Cholesterol/lipid lowering drugs
UHPLC-QTOF-MS
Eco-toxicological
Spatial distribution

1 Introduction
The occurrence of pharmaceutical drugs in aquatic systems is largely attributed to the fact that drugs have become more important and an indispensable element of our modern life. The high demand of these products around the world has increased concern with respect to their rising concentrations in the environment (Dietrich et al., 2002). Lipid lowering drugs have been encountered in natural waters because of high human consumption (Hernando et al., 2007) and their persistence against biological treatment plants (Fabbri and Franzellitti, 2016). This class of drugs is comprised of a wide range of synthetic and natural organic compounds, which include omega-3 fatty acids, nicotinic acid, cholesterol absorption inhibitor or ezetimibe, bile acid sequestrates, 3-hydroxy-3-methylglutaryl coenzyme A (HMG-CoA) reductase inhibitors or statins and fibrates (Rodea-Palomares et al., 2010). Statins and fibrates are the main administered cholesterol and lipid lowering agents for regulating the levels of cholesterol, triglycerides and other type of lipids metabolism disorders in human body (Nirogi et al., 2006).
To a various extent, ingested statins and fibrates drugs are excreted with urine and faeces as either active substances or metabolites. About 70% of excreted compounds occur in urine while 30% in faeces. Besides human excretions, additional sources include disposed pharmaceuticals and related waste from the manufacturing process (Hlavinek et al., 2007). Large quantities of pharmaceutical drugs which enter the wastewater treatment systems are not completely eliminated during the treatment processes (Dietrich et al., 2002). Thus, they are released into surface waters, where they potentially cause environmental harm depending on the effluent characteristics (discharge, chemical and biological composition) as well as on the receiving characteristics of the water body such as the type, magnitude, and hydraulic conditions including mixing (Hlavinek et al., 2007). Statins, fibrates and their metabolites as well as some of their breakdown products, have the potential to cause adverse effects such as endocrine dysfunctions in fish, abnormal heart morphogenesis and pericardial edema, reduction in the ability of nutrients and hormones to pass through the circulatory system in invertebrates and birds (Isidori et al., 2007; Wanda et al., 2017).
Among statins and fibrates, simvastatin was found to strongly affect the growth, gonad maturation, and reproduction of the amphipod Gammarus locusta chronically exposed at 0.064–8 µg/L for 45 days (Neuparth et al., 2014). In addition, Raldua et al. (2013) demonstrated that clofibrate was able to induce and decrease the growth of zebrafish Danio rerio embryos treated with 500–1000 µg/L of this particular drug clofibrate (Raldua et al., 2013). Other lipid lowering drugs, such as atorvastatin, fluvastatin, rosuvastatin, gemfibrozil, bezafibrate, and fenofibrate present in surface water have frequently been reported. Due to similar chemical structures to simvastatin and clofibrate, they pose a very potent cholesterol and lipid-lowering effects (Fent et al., 2006). These compounds have the potential to be taken up from water and bio-concentrated in aquatic biota to a large extent that may affect the growth, reproduction and the development of aquatic organisms as reported in Table 1.
Organism tested
Compound
Toxicological effect
Exposed Conc. (µg/L)
Reference
Fish Gambusia holbrooki
Clofibric acid
Respiratory inhibition
0.032–5.0
La Farre et al. (2008)
Amphipod (Gammarus locusta)
Simvastatin
Growth and reproduction decrease significantly
0.064–8.00
Santos et al. (2016)
Fish (Danio rerio)
Atorvastatin
Abnormalities, morphological defects and also pericardial edema in zebrafish embryos
0.004
Santos et al. (2016)
Golfish (Carassius auratus)
Gemfibrozil
Reduces testosterone
0.01–1.5
Mimeault et al. (2005)
Fish (Danio rerio)
Bezafibrate
Induce the peroxisome proliferation and peroxisomal beta-oxidation enzymes in salmon hepatocytes
500–1000
Fent et al. (2006)
Rainbow trout (Oncorhynchus mykiss)
Clofibric acid
Redox activity in liver Microsomes
1.0–100
La Farre et al. (2008)
Fish (Gambusia holbrooki)
Clofibric Acid
Oxidative stress
0.5–10.0
La Farre et al. (2008)
Fish (Danio rerio)
Clofibrate
Induce the peroxisome proliferation and peroxisomal beta-oxidation enzymes in fish hepatocytes
500–1000
Fent et al. (2006)
Recent studies have reported the detection levels of statins and fibrates in rivers and lakes that are the threshold to induce toxicity to aquatic organisms (Buser et al., 1998). In the study conducted by Agunbiade and Moodley (2014), bezafibrate was detected up to 10 μg/L in sewage water collected in Kwazulu Natal. In addition, gemfibrozil and fenofibrate were found at concentrations of up to 4.8 μg/L and 0.2 μg/L respectively in the effluents from WWTPs (Andreozzi et al., 2003). Furthermore, clofibric acid was found at concentrations of 0.3 µg/L in drinking water (Heberer, 2002), 0.6 μg/L in surface waters in the lakes from Switzerland (Buser et al., 1998), 1.6 μg/L in the sewage treatment plant effluents (Ternes, 1998), 5.0 ng/L in effluents of Greek sewage treatment plants (Koutsouba et al., 2003), 18 ng/L in the estuary of the River, and 0.3– 1.4 ng/L in Sea water (Weigel et al., 2002). Lovastatin and simvastatin were found at concentration levels ranging from 1 to 49 ng/L in the effluent of sewage treatment plant (STP) and surface water respectively (Miao and Metcalfe, 2003). Atorvastatin and pravastatin at concentrations ranging from 42 to 209 ng/L were quantified in surface and effluent water samples from Spanish Mediterranean area (Miao and Metcalfe, 2003). The high human consumption of pharmaceutical drugs around the world has increased concern with respect to their rising concentrations in the environment (Dietrich et al., 2002) and the environmental fate which is mostly unknown to most of them (Raldua et al., 2013). In general, few studies have reported and uncovered the effects of metabolites and degradation products of statins and fibrates to aquatic biota, which is expected that at some point, the degradation products or metabolites will exceed the concentrations of the parent compounds and then become more environmentally relevant than the parent compounds (Ferrer and Thurman, 2003). Metabolites may pose high risks to aquatic organisms at very low environmental concentrations as they may be more bioactive than the parent pharmaceutical itself (Ferrer and Thurman, 2003). Eguchi et al. (2004), have demonstrated that inhibition of the algae Selenastrum capricornutum and Chlorella vulgaris growth in the presence of the Sulpha drug metabolites was enhanced, ECs50 of sulfamethoxazole, sulfadiazine, and sulfadimethoxine were 1.5, 2.2 and 2.3 mg/L, respectively, but ampicillin and cefazolin did not inhibit growth at ECs50 > 1000 mg/L (Luo et al., 2014). The ultimate fate of pharmaceutical drugs is formation of metabolites in the aquatic environment that may show potential impacts on organisms and could be used as a biomarker of environmental exposure (Eguchi et al., 2004).
Due to widespread occurrence of statins, fibrates and their metabolites in the aquatic environments, a selective multi-residue analytical method was developed using UHPLC–QTOF–MS for determination of these pharmaceutical drugs in the aquatic environment. The main objective of this study is to assess the occurrence, distribution and final destination of lipid lowering drug namely atorvastatin (ATORV), simvastatin (SIM), pravastatin (PRAV), mevastatin (MEV), lovastatin (LOV) and fluvastatin (FLUV) and fibrates such as gemfibrozil (GEMF), fenofibrate (FENOF), fenofibric acid (FENOF. Ac), clofibrate (CLOF) and clofibric acid (CLOF. Ac) in the aquatic environment. This study is a promising contribution for the assessment of the potential effects that these contaminants may induce in the environment.
2 Experimental section
2.1 Materials and reagents
Certified reference standards of simvastatin, atorvastatin calcium, fluvastatin calcium, lovastatin, pravastatin sodium, gemfibrozil, fenofibrate, clofibrate, clofibric acid were supplied by Sigma Aldrich (Modderfontein, South Africa). Fenofibric-d6 acid were purchased from LGC Industrial Analytical (Johannesburg, South Africa).
Acetonitrile (LC-MS CHROMASOLV® grade), methanol (LC-MS CHROMASOLV® grade), sodium hydroxide, isopropanol and formic acid were purchased from Sigma Aldrich. All solvents and reagents used in this project were of high purity (HPLC/LC-MS grade, >99%) and were purchased from Sigma-Aldrich (South Africa) and/or Merck (South Africa). Solid-phase extraction (SPE) disks, (Atlantic HLB-H 47 mm) were supplied by Microsep (Pty) Ltd, SA. Glass microfibers GF/F Filters (0.45 µm) microfibers were purchased from Sigma-Aldrich South Africa. Ultra-high Pure (UHP) water from Milli Q Process (>18.2 MΩ/cm).
2.2 Water sample collection and onsite water sample analyses
Water samples were sampled at the influent and effluent of Daspoort Wastewater Works and downstream to upstream of the Apies River (see Fig. 1). The downstream is located 100 m away from the discharging point. The samples were taken between September and November 2017. The entire sampling site is situated in Pretoria, Gauteng Province, South Africa.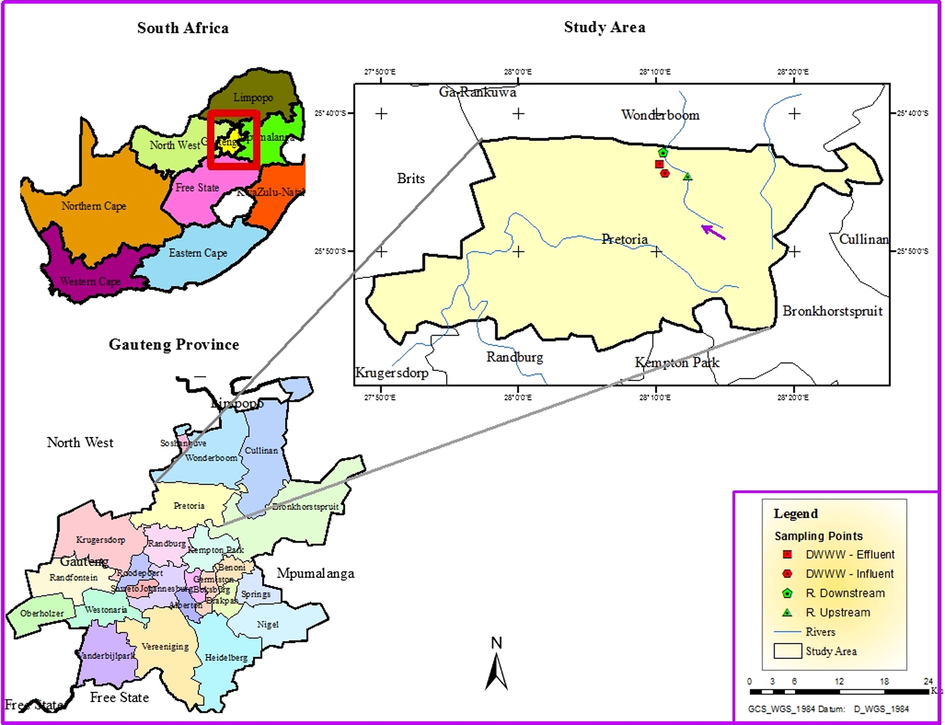
Map showing the sampling points.
The wastewater from industry, hospitals and households as well as sewage, is treated at the Daspoort Wastewater Works, via biological and physico-chemical means, before being released into the Apies River (Muller et al., 2004). The influent at the Daspoort Wastewater Works is subjected to mechanical screening, grit removal, oil and grease removal and primary settling in settling tanks. Thereafter, it gets filtered in a nitrifying trickling filter before it reaches the secondary biological treatment (by activated sludge) and finally tertiary steps, including activated carbon filtration. After being settled in the secondary settling tank, the effluent is discharged into the Apies River through effluent wastewater (Muller et al., 2004). Samples were collected from the entry of untreated raw water (inlet water), and the final stage of treatment (outlet), and also at upstream and downstream of Apis River supplied by the treatment plant.
Water samples were collected in 1.0 L amber glass bottles. At the site, the sampling bottles were rinsed three times with the river or wastewater to be collected. At the influent and effluent, water was collected as grab sample. The containers were filled to over-flowing, leaving no headspace. After water collection, the bottles were closed with caps that was lined with aluminium foil to prevent contamination with phthalates and plasticizers from the lids. All the samples were kept in a cooler box containing ice and were transported to the laboratory. At the laboratory, samples were filtered using glass microfibers GF/F Filters (0.45 µm) and adjusted to pH 3.0, then stored at 4 °C in the fridge.
The water samples were analysed for levels of pH, electrical conductivity (EC), salinity and total dissolved solids (TDS) in the field immediately after sampling, using a Hanna Instrument (Woonsocket, RI, USA) model HI-9828 multi-meter. Deionized water was used to rinse the electrode of the meter prior to the successive measurements of TDS, EC, salinity, temperature, and pH to avoid inter-sample contamination.
2.3 Preparation of standard solutions
About 1000 mg/L of individual stock solutions for LOV, MEV, SIM, GEMF, FENOF, CLOF, CLOF. Ac, FENOF. Ac, atorvastatin d5 and fenofibric d6 acid were prepared by weighing 1 mg of each certified reference standard in a LC-MS vial (1.5 mL). The weighed sample was then dissolved for 15 min under ultra-vortex and sonicated in 1 mL of acetonitrile (LC-MS CHROMASOLV® grade). Stock solutions (1000 mg/L) of ATORV and PRAV were prepared by weighing 1 mg a sample in a LC-MS 1.5 mL vial followed by a for 15 min dissolution in 1 mL of methanol (LC-MS CHROMASOLV® grade) under ultra-vortex and sonicated to achieve complete dissolution. In addition, the 1000 mg/L FLUV stock solution was prepared by weighing 1.0 mg in a LC-MS 1.5 mL vial containing ethanol (HPLC grade) (1 mL) under vortex and ultra-sonicated for 10 min. From the individual stock solutions, several working standard solutions (10–90 ppb) were prepared using acetonitrile/water mixture as the diluent to establish a calibration curve. The stock and working standard solutions were kept at −20 °C in a freezer in order to maintain their stability and used for three months.
2.4 Optimization of UHPLC chromatographic separation and QTOF-MS conditions
The separation of analytes was carried out using a Dionex Ultimate 3000 UHPLC system (Dionex Softron GmbH, Dornierstr. 4, Germany) equipped with a reversed phase C18 analytical column of 100 mm × 2.1 mm and 1.7 µm particle size (Acquity UPLC® BEH, Waters, Ireland). The injected sample volume was 5 µL. The flow-rate used was 0.300 mL/min and the total run time was 14 min. This UHPLC system was connected to an ultrahigh resolution quadrupole time-of-flight mass spectrometer Impact II Bruker (Bruker Daltonics GmbH Fahrenheitstr 4, Bremen, Germany) equipped with an electrospray ionization. The accurate mass spectra were recorded across the range of 50–1600 m/z. The instrument was operated in full-scan mode for identification of selected compounds and degradation products. To achieve superior chromatographic separation and resolution, greater baseline stability and higher ionization efficiency of the analytes in the UHPLC–QTOF–MS, various parameters such as mobile phase composition, column temperature, ionization mode were fully investigated and optimized.
2.4.1 Effect of mobile phase composition
The chromatographic separation of the analytes were tested in various mobile phase composition namely acetonitrile-water, methanol-water and acetonitrile/methanol-water. The mobile phase was run as a binary mixture of solvent B (acetonitrile, methanol or acetonitrile + methanol) and solvent A consisted with water (LC-MS grade), both containing 0.1% formic acid at a constant flow rate of 0.300 mL/min. The mobile phase composition was kept in a gradient ramp elution system, which was started at 40% and increased linearly to 100% within 10 min and thereafter held for 12 min.
2.4.2 Effect of UHPLC column temperature
The UHPLC chromatographic resolution on the peak separation and shape were investigated by varying the UHPLC column temperatures. The temperatures were varied from 20 to 60 °C.
2.4.3 Effect of ionisation mode in QTOF-MS
The QTOF–MS spectrometer was operated in the positive and negative ion mode for the analysis of statins, fibrates and their metabolites. The sensitivities of statins, fibrates and metabolites were tested as protonated [M + H]+ and deprotonated [M − H]− ions. The mass spectra were recorded in the range of 50–1600 m/z for both positive and negative ion modes. Nitrogen was used as a nebulizer. The MS and MS/MS conditions were as follows: drying gas (N2) flow rate was 40 L/min, drying gas temperature was set at 230 °C, nebulizer was 0.8 Bar, and the capillary voltage was 5000 V. The identification of statins, fibrates and their metabolites were accomplished through structural elucidation of the fragment ions. The precursor molecular ion of ATOR, MEV, SIM, ROSUV, PRAV, FLUV, GEMF, FENOF, BEZA, CLOF, FENOF. Ac, CLOF. Ac and LOV formed in the MS source were selected and further energized and collided, in the collision cell of MS2 spectrometer, producing several fragment (daughter) ions. The fragment ions were structurally elucidate using Compass DataAnalysis software 4.3.
2.5 Solid phase extraction
Water samples (1000 mL) were filtered through glass microfibers GF/F Filters (0.45 µm) and acidified to pH 3.0 by formic acid solution, then extracted using Atlantic HLB disk onto a SPE instrument (Thermo Scientific, Dionex Auto trace 280). The Atlantic HLB disks was first conditioned with 10 mL of methanol and secondly conditioned with 10 mL of ultrapure water (adjusted to pH 3.0). About 500 mL of water sample was slowly loaded onto disk in a flow rate of 10 mL/min. After that, sample was purified, washing the disk with 15 mL of 5% methanol. The fraction was collected into 5 mL of sample tube using 5 mL of acetonitrile + methanol (6:4) and the analytes were completely dried using Nitrogen gas baseline 5.0 for 30 min. The analytes were reconstituted in 1 mL of acetonitrile: methanol: water (3:2:5), mixed well using vortex mixer (VM 18 Hiltern Scientific) and finally degassed off line in Ultra-sonication (Scienctech, South Africa) before UHPLC-QTOF-MS analysis.
2.6 Recoveries of statins and fibrates
Environmental water samples used for the investigation of the recovery efficiency were taken at the influent and effluent of Daspoort Wastewater Works and Apies River. About 500 mL of water samples were spiked with 100 ng/L of ATORV, PRAV, SIM, LOV, FLUV, MEV, CLOF, FENOF, CLOF. Ac and FENOF. Ac and were used to investigate the recovery efficiency of the analytes on HLB disks under Auto Trace–SPE technique. The efficiency of solid phase extraction (SPE) of the analytes were obtained using the following equation (1):
2.7 Limit of detention and quantification for statins and fibrates using UHPLC–QTOF–MS
The limit of detection (LOD) and limit of quantification (LOQ) for ATORV, PRAV, SIM, LOV, FLUV, MEV, CLOF, FENOF, CLOF. Ac and FENOF. Ac using UHPLC–QTOF–MS method were estimated from the calibration equation. The working standard used for calibration equation were prepared from the pure analytical standard over the nominal concentration range of 10–90 ppb. The limit of quantification (LOQ) and limit of detection (LOD) for each analyte were thus determined based on the signal-to-noise (S/N) ratios of 10 and 3.3 based on the residual standard deviation (SD) of the y-intercept of the regression line of the calibration curve and the sensitivity or slope of the regression line, as shown in Eqs. (2) and (3):
The LOQ and LOD were performed in triplicate to confirm the accuracy regarding each of the detected statins and fibrates at varying concentrations.
2.8 Method validation
In ensuring that the concentrations of statins and fibrates determined using the developed method reflect the true picture of the environmental media, quality control and assurance procedures were conducted. The ICH guidelines of Q2 (R1) (Guideline, 2005) were adopted to provide a framework for validating the developed method. The validation parameters included specificity, linearity, limit of detection (LOD) and limit of quantification (LOQ), precision (repeatability and reproducibility), accuracy and robustness. The specificity of the method was confirmed using the similarity of the retention times and the mass-to-charge ratio (m/z) of the analytes in the unfortified matrix and spiked water samples. Moreover, the matrix effects were assessed by evaluating the relationship between solvent and matrix-prepared curves. The linearity was evaluated by preparing three analytical curves with ten points each. The equations of the lines, the correlation (r), coefficients (R2) and the range of the values obtained from the statistical residuals were determined from the analytical curves constructed for the statins and fibrates. A high correlation coefficient (R2 > 0.99) was used as a criterion of linearity. The working range was defined by the LOQ and the upper limit of linearity. The precision was evaluated by repeatability and reproducibility tests. Repeatability was calculated from 20 measurements in the same conditions of three samples with different concentrations of statins and fibrates. The coefficient of variation (CV) of these measurements was used to assess the method repeatability. Reproducibility was calculated from 20 measurements spread over a period of 30 days, of three samples used in the repeatability tests. In the absence of a certified reference material, the accuracy was evaluated by analyzing spiked pooled solvent and samples at different concentrations covering the working range. Robustness of the UPLC QTOFMS method was evaluated by varying some chromatographic conditions such as mobile phase composition, column temperature, sample temperature and pH.
2.9 Determination of levels and occurrence of statins, fibrates and their metabolites in water samples
The extracted and separated analytes from the UHPLC C18 column were automatically infused into a QTOF–MS detector for their quantification. Q-TOF–MS was set to operate in the positive ion mode for the analysis of mevastatin, simvastatin, atorvastatin, lovastatin, gemfibrozil, fenofibrate, clofibrate and in negative ion mode for the analysis of fluvastatin, pravastatin and clofibric acid. The mass spectra were recorded in the range of m/z 50–1600 Daltons for both positive and negative modes. For accurate mass measurements, the QTOF-MS instrument was externally calibrated prior the analysis. Standard solution of sodium formate solution (calibrant), consisting of 10 mM sodium hydroxide in isopropanol −0.1% formic acid was run manually in a flow rate of 0.180 mL/h for calibration purposes. During analysis automated internal mass scale calibration of individual samples was performed by injecting the calibrant at the beginning and at the end of each run via a 6 - port divert valve. Calibration of the mass analyzer was performed in order to maintain a high level of mass accuracy measurements of the analytes.
3 Results and discussion
3.1 UHPLC chromatographic separation and QTOF-MS conditions
3.1.1 Effect UHPLC mobile phase composition
As shown in Fig. 2, the acetonitrile/methanol eluent proved to possess a higher elution strength, better peak shape and stronger response than the separate and individual solvents of acetonitrile (ACN) and methanol (MeOH).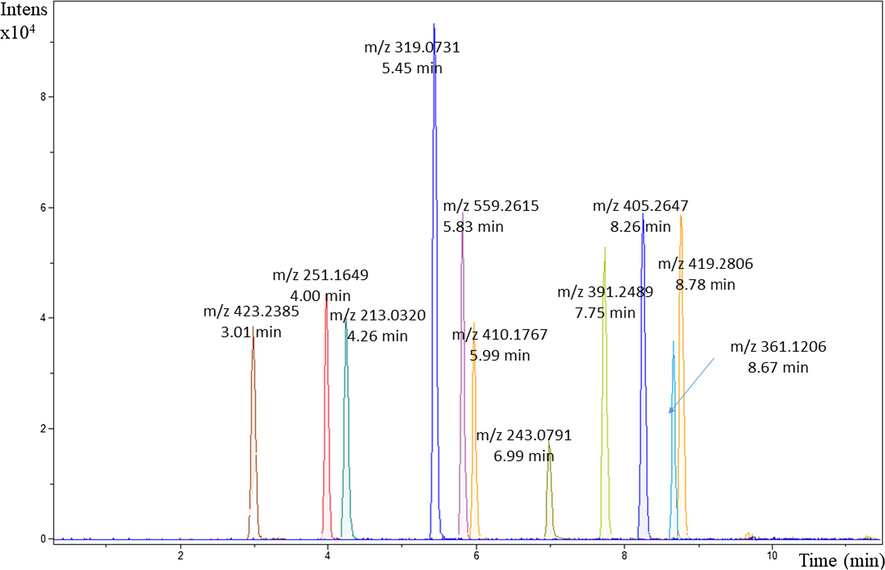
UHPLC–QTOF–MS chromatogram of 1 mg/L of standard mixture: mobile phase: Acetonitrile + Methanol (gradient elution), Waters, Acquity UPLC BEH C18 column, column temperature 60 °C.
Therefore, using acetonitrile or methanol as a mobile phase in the gradient elution mode, resulted in co-elution of the chromatogram peaks and weak sensitivity. Ultimately, the mobile phase system comprising of acetonitrile-methanol (6:4) and water (LC MS grade) both containing formic acid 0.1% was selected as the mobile phase for the gradient elution, and this resulted in increased sensitivities of clofibric acid, atorvastatin, fluvastatin, mevastatin, fenofibric acid and clofibrate. The optimized chromatographic method was programmed as follows: the initial mobile phase composition 40% acetonitrile – methanol (B) constant for 1.0 min, followed by a linear gradient from 40% B to 100% B for 10 min, kept at 100% B for 2.0 min and then dropped back to 40% B 12.1 min and kept constant at 40% B for 2.0 min. The flow-rate used was 0.300 mL/min and the total run time was 14 min. The chromatographic peak were in general were well separated with minimal tailing. Retention times were consistent during the instruments method development, indicating the reliability of the mobile phase systems.
3.1.2 Effect of UHPLC column temperature
The column temperature is known to influence chromatographic separation, resolution and peak shape (Ferrer and Thurman, 2003). In this method development, it was demonstrated that better chromatographic resolution was achieved at 60 °C, which is related to the increased peak intensity while maintaining the peak area. An increase in the column temperature to 60 °C, resulted in narrow and Gaussian shaped peaks for analytes such as clofibric acid, atorvastatin, mevastatin, fenofibric acid and clofibrate. Elevated column temperature was the most important contributor to the improvement of the chromatographic peak shape for those analytes, which had exhibited split peak shapes at room temperature. Vargo (2003) developed an LC-MS/MS method for the determination of chloroacetanilide, chloroacetamide herbicides and their polar degradation products in water. In the same study, an increase in the column temperature was found to greatly improve the peak shape when the acetonitrile/water/acetic acid gradient was used (Vargo, 2003). Shoemaker (2001) described a procedure using reversed phase HPLC with elution gradient at 70 °C. It was observed that there was no the peak splitting and thus better resolution on the degradation metabolites and elucidation of acetochlor and alachlor was possible. Several authors have also reported the importance of using elevated temperatures to achieve better peak resolution, especially when dealing with complex mixtures of parent compounds, metabolites and other transformed products (Ferrer and Thurman, 2003).
3.1.3 Effect of ionization mode in the QTOF–MS
In this study, the analytes showed different sensitivities with changes in polarity. Analytes such as mevastatin, simvastatin, lovastatin, gemfibrozil, clofibrate, atorvastatin, fenofibrate and fenofibric acid were found to be more sensitive in the positive ionization mode (PI). In contrast, analytes such as fluvastatin, pravastatin and clofibric acid were more sensitive in the negative ionization mode (NI). These observations are displayed in Table 2.
Compound
Formula
Molecular weight
Retention time
Ionization mode
Molecular ion
Ion precursor m/z
Fragment 1
Fragment 2
Fragment 3
Atorvastatin
C33H35FN2O5
558.64
6.77
Positive
[C33H35FN2O5 + H]+
559.2614
440.2247 [C27H29FNO4 + H]+
362.1539 [C27H29FNO2-H]+
Mevastatin
C23H34O5
390.513
7.75
Positive
[C23H34O5 + H]+
391.2489
271.1701 [C18H20O3 + H]+
185.1331 [C14H19-2H]+
159.1173 [C12H16-H]+
Lovastatin
C24H36O5
404.58
8.26
Positive
[C24H36O5 + H]+
405.2647
303,1962 [C19H27O3]+
285,1855 [C19H25O2]+
173,1325 [C13H18-H]+
Simvastatin
C25H38O5
418.556
8.78
Positive
[C25H38O5 + H]+
419.2806
303,1962 [C19H27O3]+
285,1855 [C19H25O2]+
173,1325 [C13H18-H]+
Gemfibrozil
C15H22O3
250.333
4.00
Positive
[C15H22O3 + H]+
251.1649
129.0913 [C7H13O2]+
83.0854 [C6H12-H]+
73.06479 [C4H6O + 2H]
Fenofibrate
C20H21ClO4
360.831
8.67
Positive
[C20H21ClO4 + H]+
361.1180
233.0365 [C13H8ClO2 + H]+
138,9951 [C7H4 ClO + H]+
121.0288 [C8H7O + H]+
Fenofibric acid
C17H15ClO4
317.7836
5.45
Positive
[C17H15ClO4 + H]+
319.0731
233.0365 [C13H8ClO2 + H]+
138,9951 [C7H4 ClO + H]+
121.0288 [C8H7O + H]+
Clofibrate
C12H15ClO3
242.698
6.99
Positive
[C12H15ClO3 + H]+
243.0791
169,0422 [C9H10ClO]
115,0749 [C6H11O2]
87,0441 [C4H7O2]
Clofibric acid
C10H11ClO3
214.645
4.59
Negative
[C10H11ClO3-H]−
213.0324
126.9954 [C6H5ClO-H]−
85.0249 [C4H8O2-H]−
Pravastatin
C23H36O7
424.528
3.01
Negative
[C23H36O7-H]−
423.2385
321.1707 [C18 H26O5-H]−
85.0295 [C4H6O2-H]−
Fluvastatin
C24H26FNO4
411.466
6.73
Negative
[C24H26FNO4-H]−
410.1773
321.161 [C21H21FNO4-H]−
208.064 [C14H18-H]−
88.024 [C3H5O3-H]−
Several authors have reported much better sensitivity measurements for acidic pharmaceutical drugs in PI mode than in the NI mode of operation (Ferrer and Thurman, 2003). Hernando et al. (2004) have found higher sensitivities for some acidic pharmaceutical drugs such as bezafibrate, gemfibrozil and fenofibrate in NI mode. In many cases, in order to develop the most effective method, the ionization mode should be determined experimentally since the modifier (acidifier) affinities of many analytes are unknown (Hammett-Stabler and Cotten, 2012). Miao and Metcalfe (2003) achieved high sensitivity measurements for mass accuracy measurements for atorvastatin, pravastatin, lovastatin, simvastatin and mevastatin in the positive ionization (PI) mode.
According to Dulik et al. (1990), the use of electrospray ionization at different modes has improved the sensitivity and structural elucidation of the organic species present in the environment. In the present study, the m/z fragment ions obtained using the QTOF-MS spectrometer for the targeted analytes were structurally elucidated as listed in Table 2.
In general, the structures of the fragment ions generated using this method was successfully elucidated which will facilitate a positive identification of the model pharmaceutical drugs under investigation in the aquatic environment. In this regard, the specific fragmentation pattern for the analyte in this method development, together with retentions times can be used as the fingerprint to identify and quantify these analytes in the real environmental water sample.
3.2 Recoveries of statins and fibrates drugs on HLB disks
The extraction recoveries after SPE using an Oasis HLB support varied between 70% and 110% for the targeted analytes (see Table 3). This demonstrates that Oasis HLB is a good support for the extraction of acidic pharmaceutical drugs such as statins and fibrates. This concurs with the findings reported by Xu (2013), who reported recoveries efficiency using Oasis HLB for various analytes in the percentage range of 70–150%. The recoveries obtained using the SPE procedure we found to be consistent with 70% recoveries for the solid phase extraction of organic compounds in the aquatic environment that were achieved by Petrovic et al. (2006).
Analytes
Influent
Effluent
Surface water
Clofibric acid
93 ± 4.65
99 ± 4.95
105 ± 5.25
Simvastatin
89 ± 4.45
105 ± 5.25
109 ± 5.45
Atorvastatin
75 ± 3.75
90 ± 4.5
102 ± 5.1
Lovastatin
91 ± 4.55
96 ± 4.8
100 ± 5
Pravastatin
71 ± 3.55
91 ± 4.55
101 ± 5.05
Mevastatin
85 ± 4.25
96 ± 4.8
103 ± 5.15
Fluvastatin
71 ± 3.55
82 ± 4.1
90 ± 4.5
Fenofibrate
81 ± 4.05
104 ± 5.2
106 ± 5.3
Fenofibric Acid
84 ± 4.2
106 ± 5.3
108 ± 5.4
Clofibrate
70 ± 3.5
81 ± 4.05
95 ± 4.75
Gemfibrozil
71 ± 3.75
82 ± 4.1
96 ± 4.8
In the present study, the relative recoveries were neither too low nor too high, thus suggesting that the matrix effect was minimal. The reduced effect on signal suppression and enhancement effect due to the co-extraction of co-existing compounds was achieved by: (i) including a washing-step (with 5% methanol) in the SPE procedure to remove the interferences before elution-step; and (ii) the optimization of chromatographic separation conditions. Nödler et al. (2010) have also reduced the matrix effect by washing the influent waste water sample with 10% methanol while Gracia-Lor et al. (2012) observed a minimal matrix effect after diluting the waste water sample with deionized water several times prior to analysis. In addition, Stankiewicz et al. (2015) have indicated that the optimization of chromatographic separation conditions is paramount when reducing the matrix effect as it leads to good separation of the target compounds. Martín et al. reported (2012) recoveries of atorvastatin, fluvastatin, lovastatin, pravastatin, rosuvastatin and simvastatin in the range of 74–93% in pure water, 46–97% in river water samples and 64–93% in effluent wastewater using SPE on Oasis HLB for the pre-concentration.
In order to evaluate the recovery efficiency, external calibration curve prepared from analytical standard in the matrix extracts were compared with calibration curve prepared from deuterated compounds of fenofibric-d6 acid in the matrix extracts as well. The overlapping of the two curves, as illustrated in Fig. 3, suggests that the effect on signal suppression and enhancement experienced by the analytes were minimal. It was also observed that when signal losses for a particular compound is huge, curves are not parallel, showing considered differences in the respective slopes.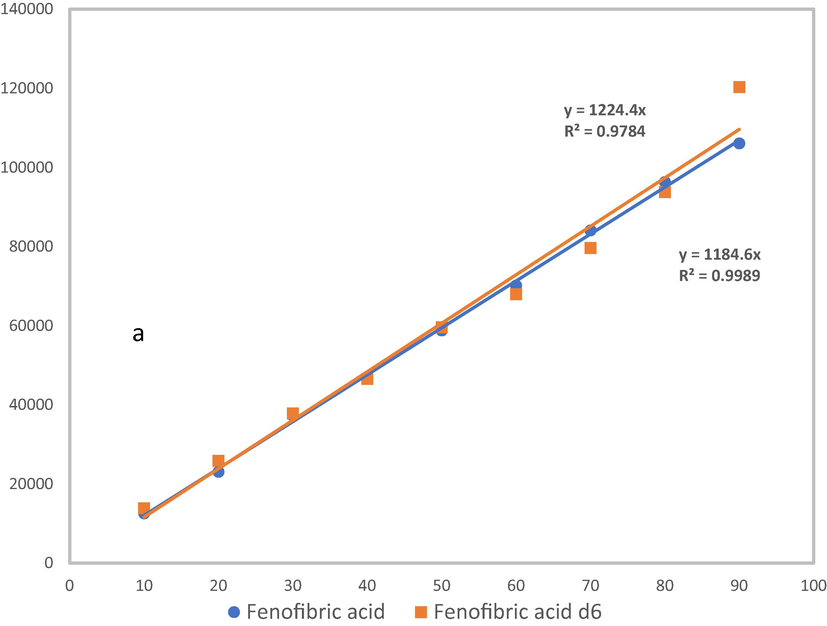
Analytical calibration curves and deutereted calibration curves for (a) fenofibric acid and fenofibric acid d6,
According to Gros et al. (2006), when the difference in slopes of the two curves is reduced to a value close to 1, as they are overlapped. These results justify the use of deuterated standards to verify the efficiency of the extraction technique.
3.3 Method validation
The results of three detection tests were in the range of 2.50 ± 0.17 µg/L; 12.50 ± 0.12 µg/L 25.00 ± 0.26 µg/L which was in good agreement with the standard values of 2.50 ± 0.50 µg/L 12.50 ± 0.50 µg/L and 25.00 ± 0.75 µg/L and the relative standard deviation (RSD) was only 1.7%. All of these results demonstrated a good accuracy, reproducibility and sensitivity of the developed method. The developed method was not affected by the small deliberate changes on chromatographic conditions.
3.4 Detection and quantification limits for statins and fibrates using UHPLC–QTOF–MS
The limit of detection (LOD) and limit of quantification (LOQ) of atorvastatin, simvastatin, lovastatin, mevastatin, fluvastatin, pravastatin, gemfibrozil, clofibrate, clofibric acid, fenofibrate and fenofibric acid using UHPLC–QTOF–MS are presented in Table 4.
Present study LOD
Present study LOQ
HPLC–UV–Vis
GC–MS/MS
HPLC/UHPLC–MS/MS
Analyte
µg/L
µg/L
µg/L
µg/L
µg/L (10−3)
Mevastatin
1.37
4.15
–
–
18a
Simvastatin
0.63
1.909
333d
0.05e
0.0009b
Pravastatin
0.39
1.18
1500d
0.5e
60a
Atorvastatin
0.446
1.35
102.5d
–
0.0007b
Fluvastatin
0.48
1.45
81.5d
0.05e
0.0005b
Lovastatin
0.907
2.75
120d
0.05e
0.0007b
Gemfibrozil
1.18
3.57
25000f
–
90a
Fenofibrate
0.65
1.97
22.2d
–
1250c
Fenofibric Acid
0.704
2.13
–
0.05 g
–
Clofibrate
1.64
4.97
29000f
–
–
Clofibric acid
0.64
1.94
–
0.01 g
60c
As reported in Table 4, the detection limits of statins, fibrates and their metabolites in the present study were found to be in good agreement with those reported in the literature using other analytical techniques used for environmental application (Mircia et al., 2017; Sirén et al., 2014). In general, LODs in LC–MS/MS are mainly dependent on the type of mobile phase composition, type of chemical modifier used for ionization in the electrospray ionization source (ESI) and the type of the hybrid mass spectrometer used. In the present method, the LODs were comparable with those assigned by Gros et al. (2006), Hernando et al. (2004) and Mircia et al. (2017). In addition, the method that we have developed has proven to be important in environmental applications, with particular capabilities of accurately identifying and quantifying statins, fibrate and their metabolites in wastewater samples.
3.5 Field measurements and quantification of statins, fibrates and metabolites in water
The range values of pH, electrical conductivity (EC), salinity (Sal) and turbidity determined in the field sites are indicated in Table 5.
Parameter
DWWWs Influent
DWWWs Effluent
Apies River downstream
Apies River upstream
pH Mean
8.37 ± 0.65
8.24 ± 0.17
8.09 ± 0.22
8.03 ± 0.24
Sal (mg/L)
0.35 ± 0.04
0.23 ± 0.01
0.21 ± 0.01
0.2 ± 0.01
Conductivity SPC (µS/cm)
670 ± 50.7
414.2 ± 16.4
405.3 ± 13.5
371.5 ± 16.6
Turbidity (mg/L)
479.7 ± 12
305.8 ± 12.02
285.5 ± 0.86
268.7 ± 0.98
The pH values of all the samples were within the acceptable health risk range of 6.50–8.50. Most aquatic organisms cannot survive if the pH of the water is outside of the neutral range (Vigil, 2003). The electrical conductivity was found to be above the maximum admissible limit of 250 µS/cm. Such results suggest that the water was heavily laden with ionic species that conduct the electricity which in turn may pose health hazard to users. The results of turbidity give a rough indication of the quantity of undissolved matter in water (Nesaratnam, 2014).
3.6 Quantification of statins and fibrates in water
The calibration curves were obtained from pure certified reference standards solutions of the target analytes. The relationship between the relative peak area and the mass of solute was found to be linear over concentration ranges of 10–90 ppb with the correlation coefficients higher than 0.99 (Fig. 4).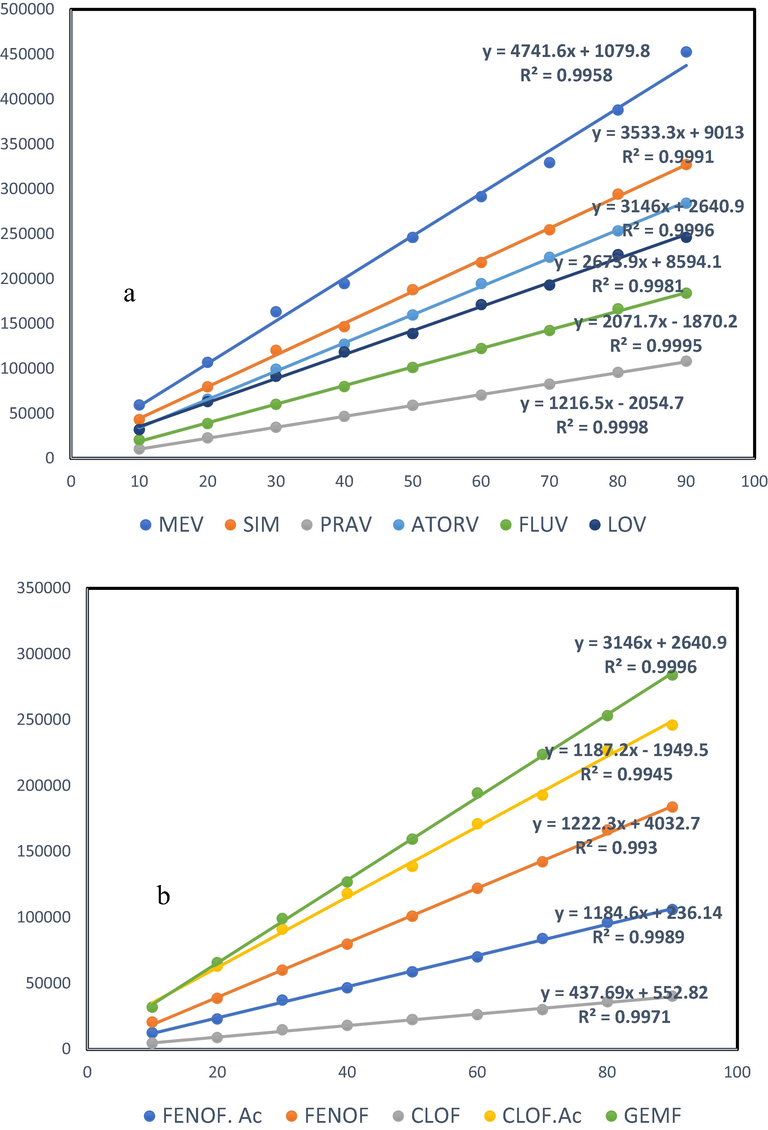
Calibration curves of selected (a) statins and (b) fibrates.
The concentration of the unknown sample was calculated from the calibration curves. The calculations were based on the signals of analytical standards on the QTOF-MS. Fig. 5 shows the mass spectra of lovastatin. The spectra showed a base peak at m/z = 405.2647, which correspond to the protonated molecular ion of lovastatin. The MS2 shows distinct fragments of lovastatin at m/z = 303.1962; 285.1855 and 173.1325, which correspond to [C19H27O3]+; [C19H25O2]+and [C13H18-H]+, respectively. The fragment ions at these m/z 303.1962; 285.1855 and 173.1325 resulted from the elimination of the ester side-chain followed by dehydration, dissociation and rearrangement reactions.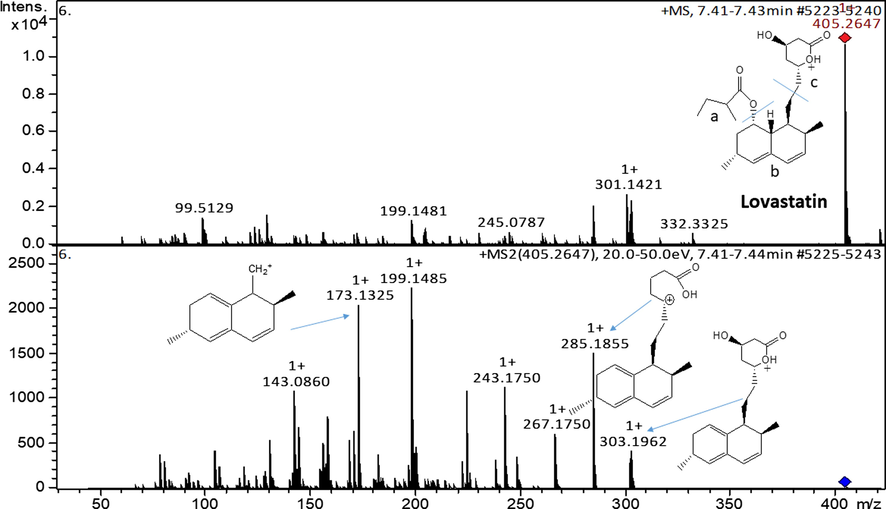
ESI-MS spectra of lovastatin and fragments at MS2.
Fig. 6 shows the mass spectra for simvastatin. The spectrum shows a base peak at m/z = 419.2806 which is inferred to protonated molecular ion of the compound itself. The product ion of protonated simvastatin produced major fragment ions at m/z 303.1962; 285.1859 and 173.1329, which were assigned to [C19H27O3]+; [C19H25O2]+ and [C13H18-H]+, respectively. Similar fragment ions for simvastatin and lovastatin have also been obtained by Wang et al. (2001).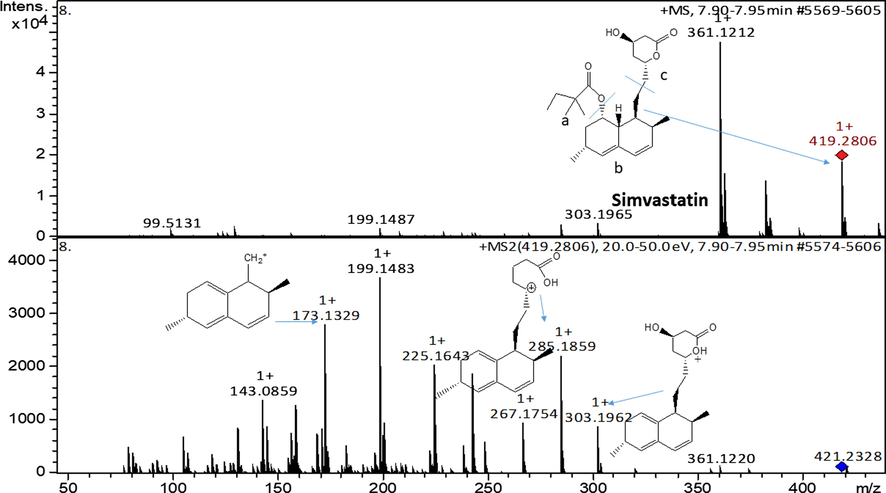
ESI-MS spectra of simvastatin and fragments at MS2.
The mass spectra in Fig. 7, shows a base peak of mevastatin (m/z = 319.2489) corresponding to the protonated molecular ion of mevastatin. The product ion of mevastatin produced major fragment ions at m/z 271.1701; 185.1331 and 159.1173 which were attributed to [C18H20O3 + H]+; [C14H19-2H]+ and [C12H16-H]+, respectively. The fragment ions at these m/z resulted from the elimination of the ester side-chain followed by dehydration, dissociation and rearrangement reactions based on MS.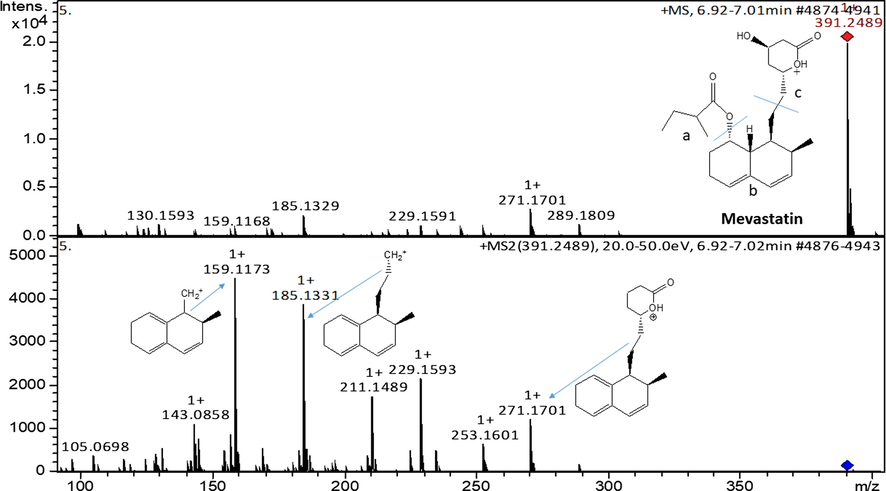
ESI-MS spectra of mevastatin and fragments at MS2.
The product ion scan of clofibrate at m/z 243.0791, produced three fragment ions corresponding to [C9H9ClO + H]+ (m/z 169.0422); [C6H10O2 + H]+ (m/z 115.0749) and [C4H6O2 + H]+ (m/z 87.0441). The base peak of atorvastatin at m/z = 559.2616 which is a protonated molecular ion of the compound itself, shows distinct fragments of atorvastatin at m/z = 440.2242 and 362.1561 corresponding to [C27H29FNO4 + H]+ and C27H29FNO2-H]+, respectively. The product ion scan of pravastatin (m/z 423.2384) produced two known fragment ions of [C18 H26O5-H]− (m/z 321.1706) and [C4H6O2-H]− (m/z 85.0295).
Clofibric acid at m/z 213.0320 produced two fragment ions corresponding to [C6H4ClO]− (m/z 126.9954) and [C4H5O2]− (m/z 85.0294) while fenofibrate, with base peak at m/z = 361.1212 which was identified as the protonated molecular ion of fenofibrate, produced hree fragment ions corresponding to [C13H8ClO2 + H]+, [C7H4ClO + H]+ and [C8H7O + H]+ with m/z of 233.0371, 138.9951 and 121.0288, respectively.
The mass spectra of gemfibrozil at m/z = 251.1649 corresponded to a protonated molecular ion, produced three fragment ions, namely [C7H12O2 + H]+ (m/z 129.0913); [C6H12-H]+ (m/z 85.0854) and [C4H6O2 + H]+ (m/z 73.0642). The molecular ion of protonated fenofibric acid (m/z = 319.0734) produced three fragment ions at m/z 233.0366; 138.9949 and 121.0286. These fragment ions corresponds to [C13H8ClO2 + H]+; [C7H4ClO + H]+ and [C8H7O + H]+ respectively. The MS spectra of theses analytes are displayed as supplementary information. These molecular ions and the fragments ions peaks of the sample were selected and used for quantification of statins, fibrates and their metabolites.
3.7 Levels and occurrence of statins and fibrates in water
The mean concentrations (measured in triplicate) of atorvastatin, simvastatin, lovastatin, rosuvastatin, fluvastatin, gemfibrozil, fenofibrate, fenofibric acid, and clofibric acid in water samples collected at Daspoort wastewater works inlet and outlet in Pretoria and the Apies River have been presented in Table 6.
Analyte
DWWWs Influent (µg/L)
DWWWs Effluent (µg/L)
Apies River downstream (µg/L)
Apies River upstream (µg/L)
Atorvastatin
3.735 ± 0.38
1.42 ± 0.20
0.56 ± 0.10
n.d.
Mevastatin
3.315 ± 0.50
1.865 ± 0.14
1.75 ± 0.30
n.d.
Simvastatin
11.70 ± 3.20
2.65 ± 0.8
1.585 ± 0.30
n.d.
Pravastatin
4.825 ± 1.25
2.63 ± 0.20
2.385 ± 0.19
n.d.
Fluvastatin
1.97 ± 0.33
1.025 ± 0.07
0.89 ± 0.037
n.d.
Lovastatin
8.025 ± 1.375
4.25 ± 0.14
1.325 ± 0.15
n.d.
Gemfibrozil
19.76 ± 0.525
8.32 ± 0.575
5.28 ± 2.16
n.d.
Fenofibrate
0.78 ± 0.068
0.71 ± 0.32
n.d.
n.d.
Fenofibric Acid
19.90 ± 0.53
6.24 ± 0.64
3.67 ± 0.24
n.d.
Clofibrate
n.d.
n.d.
n.d.
n.d.
Clofibric acid
12.955 ± 1.6
9.82 ± 1.23
6.04 ± 0.53
n.d.
In the present study, the highest concentration of lipid lowering drugs in sewage and surface water were found for the fibrates compounds as presented in Table 6. The mean concentration for these analytes ranged from 0.71 ± 0.32 to 19.90 ± 0.53 µg/L with the highest maximum concentration of fenofibric acid 19.90 µg/L registered in the influent of DWWWs. The levels of statins ranged from 0.56 ± 0.10 to 11.70 ± 3.20 µg/L with the highest maximum concentration of simvastatin 11.70 µg/L registered in the influent water samples.
The maximum levels of statins and fibrates recorded in this study were generally higher than those reported in the literature. This could be due to high human use and lack of efficient degradation processes in wastewater treatment plant. The presence of statins, fibrates and their metabolites in the effluent and Apies River samples is attributed to constant discharge of treated wastewater. Ellesat et al. (2010) reported decrease of metabolic activity and membrane stability of Rainbow trout (Oncorhynchus mykiss) exposed in vitro of atorvastatin at 100 µg/L. Bezafibrate was found to strongly affect the development of Matylus galloprovincialis larvae exposed for 48 h in the range of 100–1000 µg/L (Fabbri et al., 2014). Saravanan et al. (2011), observed that clofibric acid at 100 µg/L had a profound influence on the haematological, biochemical, ion regulatory and enzymological profiles of freshwater fish Cyprinus. carpio exposed for 96 h. Raldua et al. (2013), have conducted a comprehensive study on the effect of clofibrate on mortality and hatching time in zebrafish embryos in a nominal concentration range of 100–5000 µg/L. He observed that the embryos exposed to the highest concentration died during the gastrulation. Chronic exposure to bacteria, rotifers, crustaceans and Algae for fibrates such as Bezafibrate, Fenofibrate and Gemfibrozil and their photoproducts was conducted by Isidori et al. (2007), the µg/L level of these compounds caused inhibition of growth population on rotifers and crustaceans (T. platyurus).
Although observed at lower concentration levels than those reported in above studies the presence of statins, fibrates and metabolites in the water obtained from the effluent and Apies River may poses a huge risk to the growth and reproduction of aquatic organisms. To the best of our knowledge, guidelines for the presence of statins and fibrates in water and wastewater have not been reported. The regulation of statins and fibrates in any type of water is paramount as it provides vital information on the toxic risks associated with organic pollutants of pharmaceutical origin.
3.8 Spatial distribution of statins and fibrates in the selected study area
The distribution patterns of statins, fibrates and their metabolites within the selected study area is indicated in Fig. 8. Water samples selected downstream (100 m) of the DWWWs were also collected and analysed in order to assess the impact of the DWWW effluents on surface water of the Apies River. Concentrations of the compounds present in the DWWWs water were considerably lower at the downstream site compared to those of the influent and effluent due to dilution.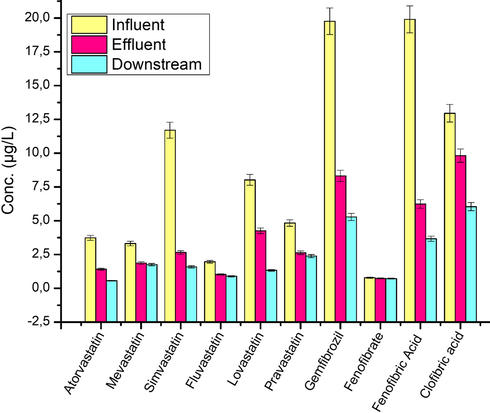
Analyte distribution within the sampling sites.
As shown in Fig. 8, a general decrease in the concentration levels of statin and fibrate compounds when moving from the influent to the downstream of the WWTP was noted. This suggests that effluent from DWWWs is the main source of downstream surface water contamination by these pharmaceutical drugs. In general, the concentrations of statins, fibrates and their metabolites were found to be highest in influent water of the DWWWs. This was also observed by Miao and Metcalfe (2003), who reported the presence of several cholesterol and lipid lowering drugs at elevated concentrations in the influent in comparison to the effluent site. This decrease in the concentration of these compounds is attributed to various wastewater treatment processes, such as bacteria activities and adsorption to the sludge of the WWTP. The removal efficiency of statins, fibrates and their metabolites are presented in Table 7. Analytes such as FLUV, MEV, LOV, FENOF and CLOF. Ac showed low transformation, degradation and removal efficiency at the Daspoort Wastewater Works. This could be due to their less sorption/adsorption properties to the solid compartments and heir high water solubility and resistance to bacterial degradation.
Analyte
Daspoort WWWs Influent (µg/L)
Daspoort WWWs Effluent (µg/L)
Removal efficiency (%)
Atorvastatin
3.735
1.42
62
Mevastatin
3.315
1.865
44
Simvastatin
11.70
2.65
77
Pravastatin
4.825
2.63
46
Fluvastatin
1.97
1.025
48
Lovastatin
8.025
4.25
47
Gemfibrozil
19.76
8.32
58
Fenofibrate
0.78
0.71
9.0
Fenofibric Acid
19.90
6.24
69
Clofibric acid
12.955
9.82
24
Hernando et al. (2004) have specifically reported that complete elimination by treatment plants is not usually achieved for pharmaceutical drugs and removal rates lower than 50% were reported when conventional treatment techniques were used for the removal of fibrates. The low removal levels for some analytes (see Table 7) suggests that the treatment technology applied in DWWWs in not suitable for the removal of this organic pollutant. Such an assertion is supported by studies undertaken by Petrovic et al. (2006), who reported that the high water solubility of statins and fibrates allows them to pass through the treatment plant processes unchanged. In addition, López-Serna et al. (2012) reported that clofibrate and fenofibrate are not usually encountered in the environment due to high microbial activities in the sewage. Corresponding metabolites of clofibrate and fenofibrate (clofibric and fenofibric acids, respectively) have been widely reported in sewage in support of this notion. High levels of clofibric and fenofibric acids that are significantly higher than their corresponding parent compounds were detected in this study. This confirms the transformation processes associated with clofibrate and fenofibrate that occurs in the treatment plant and the resultant metabolites (clofibric and fenofibric acids) can thus be used as biomarkers and to indicate the fate of fibrates.
4 Conclusion
A reliable method using UHPLC–QTOF–MS was developed for the analysis of acidic pharmaceutical drugs namely statins, fibrates and their metabolites in the aquatic environment. The method was found to be accurate, precise, and selective. The chromatographic peaks were well separated with minimal tailing and the relative retention times were consistent within the instruments method development, indicating that the mobile phase systems, the optimized temperature and the ionization mode parameters are reliable. The limit of detection of the UHPLC–QTOF–MS method for the targeted analytes ranged from 0.39 to 1.64 µg/L with less than 5% of the standard deviation from the true value and RSDs values less than 10% being achieved. Statins (SIM, PRAV, FLUV, LOV and ATORV) and fibrates (FENOF, FENOF. Ac, GEMF and CLOF. Ac) were successfully extracted and quantified with auto-trace-SPE and UHPLC-QTOF–MS/MS techniques, respectively, using water samples collected in Pretoria, South Africa. Other than clofibrate, all the analytes were detected and quantified and were found to occur at different levels of concentrations in water sampled from the effluent and influent of the Daspoort Wastewater Works and the Apies River. Theses analytes were detected in the range of 0.56 ± 0.10 to 19.90 ± 0.53 µg/L. Clofibric and fenofibric acids were the most distributed analytes, present at very high levels than the parent compounds (clofibrate and fenofibrate), which can be used as biomarkers for deciding fate of fibrates.
Acknowledgments
Funding: This work was supported by the Ministry of Science and Technology of the Mozambican Government and Nanotechnology and Water Sustainability (NanoWS) Research Unit, University of South Africa (UNISA).
Declaration of Competing Interest
The authors declare no conflict of interest.
References
- Pharmaceuticals as emerging organic contaminants in Umgeni River water system, KwaZulu-Natal South Africa. Environ. Monit. Assess.. 2014;186(11):7273-7291.
- [CrossRef] [Google Scholar]
- Pharmaceuticals in STP effluents and their solar photodegradation in aquatic environment. Chemosphere. 2003;50(10):1319-1330.
- [CrossRef] [Google Scholar]
- Occurrence and fate of the pharmaceutical drug diclofenac in surface waters: rapid photodegradation in a lake. Environ. Sci. Technol.. 1998;32(22):3449-3456.
- [CrossRef] [Google Scholar]
- Hot spot pollutants: pharmaceuticals in the environment. Toxicol. Lett.. 2002;131(1–2):1-3.
- [CrossRef] [Google Scholar]
- Analysis of xenobiotic conjugates by thermospray liquid chromatography/mass spectrometry. In: ACS Symposium Series. Vol vol. 420. Oxford University Press; 1990. p. :124-139.
- [CrossRef] [Google Scholar]
- Evaluation of antimicrobial agents for veterinary use in the ecotoxicity test using microalgae. Chemosphere. 2004;57(11):1733-1738.
- [CrossRef] [Google Scholar]
- Cytotoxicity of atorvastatin and simvastatin on primary rainbow trout (Oncorhynchus mykiss) hepatocytes. Toxicol. In Vitro. 2010;24(6):1610-1618.
- [CrossRef] [Google Scholar]
- Human pharmaceuticals in the marine environment: focus on exposure and biological effects in animal species. Environ. Toxicol. Chem.. 2016;35(4):799-812.
- [CrossRef] [Google Scholar]
- Adaptation of the bivalve embryotoxicity assay for the high throughput screening of emerging contaminants in Mytilus galloprovincialis. Mar. Environ. Res.. 2014;99:1-8.
- [CrossRef] [Google Scholar]
- Ecotoxicology of human pharmaceuticals. Aquat. Toxicol.. 2006;76(2):122-159.
- [CrossRef] [Google Scholar]
- Liquid Chromatography/Mass Spectrometry, MS/MS and Time of Flight MS. American Chemical Society; 2003. https://doi.org/10.1021/bk-2003-0850
- Occurrence and removal of pharmaceuticals in wastewater treatment plants at the Spanish Mediterranean area of Valencia. Chemosphere. 2012;87(5):453-462.
- [CrossRef] [Google Scholar]
- Development of a multi-residue analytical methodology based on liquid chromatography–tandem mass spectrometry (LC–MS/MS) for screening and trace level determination of pharmaceuticals in surface and wastewaters. Talanta. 2006;70(4):678-690.
- [CrossRef] [Google Scholar]
- Validation of analytical procedures: text and methodology Q2 (R1) In: International Conference on Harmonization, Geneva, Switzerland. 2005. p. :11-12.
- [Google Scholar]
- An introduction to drug testing: the expanding role of mass spectrometry. In: LC-MS in Drug Analysis. Totowa, NJ: Humana Press; 2012. p. :1-13.
- [CrossRef] [Google Scholar]
- Tracking persistent pharmaceutical residues from municipal sewage to drinking water. J. Hydrol.. 2002;266(3–4):175-189.
- [CrossRef] [Google Scholar]
- LC-MS analysis and environmental risk of lipid regulators. Anal. Bioanal. Chem.. 2007;387(4):1269-1285.
- [CrossRef] [Google Scholar]
- Analysis by liquid chromatography–electrospray ionization tandem mass spectrometry and acute toxicity evaluation for β-blockers and lipid-regulating agents in wastewater samples. J. Chromatogr. A. 2004;1046(1–2):133-140.
- [CrossRef] [Google Scholar]
- Hlavinek P., Bonacci O., Marsalek J., Mahrikova I., eds. Dangerous Pollutants (Xenobiotics) in Urban Water Cycle. Springer Science & Business Media; 2007. p. :118-121. ISBN 978-1-4020-6795-2
- Toxic and genotoxic impact of fibrates and their photoproducts on non-target organisms. Environ. Int.. 2007;33(5):635-641.
- [CrossRef] [Google Scholar]
- Chromatographic and spectrophotometric method for estimation of statin class drugs in bulk and in different dosage forms. J. Chem. Pharm. Res.. 2015;7:473-479.
- [Google Scholar]
- Determination of polar pharmaceuticals in sewage water of Greece by gas chromatography–mass spectrometry. Chemosphere. 2003;51(2):69-75.
- [CrossRef] [Google Scholar]
- Fate and toxicity of emerging pollutants, their metabolites and transformation products in the aquatic environment. TrAC, Trends Anal. Chem.. 2008;27(11):991-1007.
- [CrossRef] [Google Scholar]
- Occurrence and distribution of multi-class pharmaceuticals and their active metabolites and transformation products in the Ebro River basin (NE Spain) Sci. Total Environ.. 2012;440:280-289.
- [CrossRef] [Google Scholar]
- A review on the occurrence of micropollutants in the aquatic environment and their fate and removal during wastewater treatment. Sci. Total Environ.. 2014;473:619-641.
- [CrossRef] [Google Scholar]
- Occurrence of pharmaceutical compounds in wastewater and sludge from wastewater treatment plants: removal and ecotoxicological impact of wastewater discharges and sludge disposal. J. Hazard. Mater.. 2012;239:40-47.
- [CrossRef] [Google Scholar]
- Determination of pharmaceuticals in aqueous samples using positive and negative voltage switching microbore liquid chromatography/electrospray ionization tandem mass spectrometry. J. Mass Spectrom.. 2003;38(1):27-34.
- [CrossRef] [Google Scholar]
- The human lipid regulator, gemfibrozil bioconcentrates and reduces testosterone in the goldfish, Carassius auratus. Aquat. Toxicol.. 2005;73(1):44-54.
- [CrossRef] [Google Scholar]
- Simultanezous determination of fibrates by micellar electrokinetic capillary chromatography. Farmacia. 2017;65(1):109-113.
- [Google Scholar]
- Full-scale implementation of external nitrification biological nutrient removal at the Daspoort Waste Water Treatment Works. Water SA. 2004;30(5):37-43.
- [CrossRef] [Google Scholar]
- Hypocholesterolaemic pharmaceutical simvastatin disrupts reproduction and population growth of the amphipod Gammarus locusta at the ng/L range. Aquat. Toxicol.. 2014;155:337-347.
- [CrossRef] [Google Scholar]
- Simultaneous quantification of atorvastatin and active metabolites in human plasma by liquid chromatography–tandem mass spectrometry using rosuvastatin as internal standard. Biomed. Chromatogr.. 2006;20(9):924-936.
- [CrossRef] [Google Scholar]
- Development of a multi-residue analytical method, based on liquid chromatography–tandem mass spectrometry, for the simultaneous determination of 46 micro-contaminants in aqueous samples. J. Chromatogr. A. 2010;1217(42):6511-6521.
- [CrossRef] [Google Scholar]
- Multi-residue analysis of pharmaceuticals in wastewater by ultra-performance liquid chromatography–quadrupole–time-of-flight mass spectrometry. J. Chromatogr. A. 2006;1124(1–2):68-81.
- [CrossRef] [Google Scholar]
- Deciphering emerging toxicological effects of pharmaceuticals on aquatic organisms by using daphnia magna and Danio rerio as Model Organisms. Compreh. Analyt. Chem.. 2013;62:611-647.
- [CrossRef] [Google Scholar]
- Application of the combination index (CI)-isobologram equation to study the toxicological interactions of lipid regulators in two aquatic bioluminescent organisms. Water Res.. 2010;44(2):427-438.
- [CrossRef] [Google Scholar]
- Statins: an undesirable class of aquatic contaminants? Aquat. Toxicol.. 2016;174:1-9.
- [CrossRef] [Google Scholar]
- Ecotoxicological impacts of clofibric acid and diclofenac in common carp (Cyprinus carpio) fingerlings: hematological, biochemical, ionoregulatory and enzymological responses. J. Hazard. Mater.. 2011;195:188-194.
- [CrossRef] [Google Scholar]
- Analytical method development for Alachlor ESA and other acetanilide herbicide degradation products. In: 49th ASMS Conference on Mass Spectrometry and Allied Topics, Chicago, IL. 2001.
- [Google Scholar]
- Determination of statins by gas chromatography–EI/MRM–Tandem mass spectrometry: Fermentation of pine samples with Pleurotus ostreatus. J. Pharm. Biomed. Anal.. 2014;94:196-202.
- [CrossRef] [Google Scholar]
- Determination of selected cardiovascular active compounds in environmental aquatic samples–Methods and results, a review of global publications from the last 10 years. Chemosphere. 2015;138:642-656.
- [CrossRef] [Google Scholar]
- Polar drug residues in sewage and natural waters in the state of Rio de Janeiro, Brazil. Sci. Total Environ.. 1999;225(1–2):135-141.
- [CrossRef] [Google Scholar]
- Occurrence of drugs in German sewage treatment plants and rivers. Water Res.. 1998;32(11):3245-3260.
- [CrossRef] [Google Scholar]
- Determination of chloroacetanilide and chloroacetamide herbicides and their polar degradation products in water by LC/MS/MS. In: ACS Symposium Series. Vol vol. 850. Washington, DC: American Chemical Society; 2003. p. :238-255.
- [CrossRef] [Google Scholar]
- Vigil, K.M., 2003. Clean Water. As Introduction to Water Quality and Water Pollution Control. ISBN-13: 978-0870714986.
- Occurrence of emerging micropollutants in water systems in Gauteng, Mpumalanga, and North West Provinces, South Africa. Int. J. Environ. Res. Public Health. 2017;14(1):79. 10.3390%2Fijerph14010079
- [Google Scholar]
- Fragmentation study of simvastatin and lovastatin using electrospray ionization tandem mass spectrometry. J. Mass Spectrom.. 2001;36(1):58-70.
- [CrossRef] [Google Scholar]
- Drugs and personal care products as ubiquitous pollutants: occurrence and distribution of clofibric acid, caffeine and DEET in the North Sea. Sci. Total Environ.. 2002;295(1–3):131-141.
- [CrossRef] [Google Scholar]
- Ultra-high Performance Liquid Chromatography and its Applications. John Wiley & Sons; 2013. https://doi.org/10.1002/9781118533956


