

Translate this page into:
On-line monitoring the corrosion rate of reinforcing steel in concrete under natural conditions using bimetallic batch sensors along the coast of Khanh Hoa (Vietnam)
-
Received: ,
Accepted: ,
This article was originally published by Elsevier and was migrated to Scientific Scholar after the change of Publisher.
Peer review under responsibility of King Saud University. Production and hosting by Elsevier.
Abstract
A bimetallic batch sensor was proposed to assess the corrosion rate of steel reinforcement in concrete in the presence of chlorides under laboratory and marine conditions. The prepared sensor could generate an electric current independently, indicating the corrosion process's intensity. Moreover, this sensor did not require any external polarization, resulting in reducing the device's cost and power consumption. These advantages are very important when using sensors for autonomous monitoring systems away from energy sources. Laboratory tests in an aqueous extract of concrete have shown the possibility of a sensor to detect the transition from a passive state to corrosion with an increase in the concentration of chlorides. Activation was received when 0.010 < CCl ≤ 0.10 mol·dm−3. The boundary between the passive state and corrosion was obtained at a current density of 8.6 ± 0.5 μA·cm−2. The measurement results on the sensor coincided with the data of the anode polarization curves and the polarization resistance method. In addition, the monitoring system based on sensors was tested in the field conditions of Khanh Hoa (Vietnam) for four exposure conditions for nine months. The correspondence of the measured current for sensors with standard monitoring methods was obtained: the half-cell potential and the electrical resistivity. The most intense corrosion occurred for the samples placed in the splash zone or immersed to a depth of 1 m. The coefficient of conversion of the current on the sensor and the corrosion rate by the polarization resistance method for concrete samples was set to 69.9. Therefore, it is possible to use the current value on the sensor to predict the time to structural failure using well-known models based on data on the corrosion rate of reinforcement. The sensors could retain their functionality and integrity after 9 months of field tests. The current findings suggest a continuous monitoring system of the corrosion rate of steel reinforcement in marine conditions for practical applications.
Keywords
Bimetallic batch sensor
Steel reinforcement corrosion
Half-cell potential
Electrical resistivity
Polarization resistance

1 Introduction
The costs of corrosion control in the late 20th and early 21st centuries accounted for a significant share of the national gross domestic product (GDP), especially in developed countries. For example, global corrosion control costs were $US 1.8 trillion (or 3–4% of global GDP) in 2009, which was more than half of the US budget or 9 budgets of the Russian Federation for this year (Schmitt et al., 2009). Stewart et al. reported that among reinforced concrete (RC) transportation facilities in Australia, one in six bridges might require costly repairs by 2100 due to carbonation alone (Stewart et al., 2012). However, there was an opportunity to reduce these costs by $US 450 billion using available corrosion control knowledge, including data on the durability of specific materials under various operating conditions and rational design methods (Koch et al., 2001; Behnia et al., 2021; Harb et al., 2020). The rational design is directly related to calculations based on a stability and dynamic analysis of the operation of reinforced concrete structures (Bourada et al., 2020), including machine learning to optimize the process (Garg et al., 2022a). At the same time, an important factor is monitoring reinforcement corrosion in RC structures and constructing models for the activation and development of the destruction process (Angst et al., 2011; Andrade and Izquierdo, 2023).
Over the last 40–50 years, the corrosion conditions and rate of reinforcement in concrete have been widely assessed by non-destructive electrochemical methods (Rodrigues et al., 2021). Corrosion of steel reinforcement occurs via an electrochemical mechanism (Elsener, 2003). Therefore, electrochemical methods are mainly assessing the corrosion condition of steel reinforcement. The redox reactions can be represented as follows (Elsener, 2003):
However, corrosion of steel reinforcement in the presence of chlorides caused 66% of destruction cases for RC structures (Osterminski, 2013). Therefore, methods of assessing the corrosion conditions and rate of steel reinforcement in concrete in the presence of chlorides, such as transport structures treated with de-icing reagents, marine structures, and energy facilities, are particularly important.
So far, the primary methods have been applied, including half-cell potential (HCP) (Elsener, 2001; Sadowski, 2013; Pfändler et al., 2022), electrical resistivity (Broomfield et al., 2002; Robles et al., 2022), linear polarization resistance (Andrade and Gonzalez, 1978; Verma et al., 2014), and micro- and macro-galvanic cells (Raupach and Schiessl, 2001; Tuutti, 1982). Those methods are standardized in national and international regulations, including ASTM C 876–2022, ASTM G 109–2021, AASHTO T 358–19 International Union of Laboratories and Experts in Construction Materials, System and Structures (RILEM) (Elsener, 2003; Polder, 2001; Andrade and Alonso, 2004), and so on.
On the other hand, the monitoring of many facilities located at different places at the same time requires high costs. Moreover, it is difficult to access hazardous production facilities, continuous operation, and structurally complex sites. Therefore, it is necessary to develop remote data collection systems using sensors based on the above methods (Fan and Bao, 2021; Hu et al., 2022; Taheri, 2019; Zhang et al., 2020). Such systems are installed only once during the manufacture or repair of RC. Then, data are collected and transmitted periodically according to a predetermined plan that can be adjusted remotely. In addition, the sensors are inexpensive to manufacture (Figueira, 2017).
Currently, various monitoring systems based on sensor designs can assess the rate or intensity of corrosion of steel reinforcement in concrete. The so-called anode-ladder system is the earliest and most popular version of such sensors (Raupach and Schießl, 2001; Xu et al., 2013; He and Li, 2021). The steel bars are arranged in a ladder with a reference electrode that can estimate the depth of corrosion in concrete. Sensors based on micro galvanic cells are also known (Tuutti, 1982). Pereira et al. proposed using an embedded sensor based on the linear polarization resistance (LPR) method and a commercially available GEOCOR 06 device to assess the corrosion rate (Pereira et al., 2008). Other researchers suggested using embeddable LPR sensors and HCP measurements to estimate the corrosion rate (Jin et al., 2018; Karthick et al., 2019). However, the above-proposed sensor designs and their data-collecting and recording systems require additional equipment for polarizing electrodes, recording and processing polarization curves, etc. These requirements cause an increase in the cost of the devices and power consumption. The latter aspect is critical when designing monitoring systems that operate away from energy sources and can only receive it from a battery or alternative sources, such as solar panels. Therefore, an important scientific and technical task is to develop systems for monitoring the corrosion rate of steel reinforcement in concrete based on inexpensive sensors that do not require polarization but provide correct results and long service life. In our previous work, bimetallic batch sensors were prepared and used to evaluate the active–passive transition of steel reinforcement in concrete and to evaluate the effectiveness of secondary protection (Shevtsov et al., 2022) against corrosion under intermittent chloride exposure in laboratory conditions.
The current work aims to study the operation of a bimetallic batch sensor, which does not require polarization from an external power source, to assess the corrosion rate of steel reinforcement in concrete in laboratory and field conditions and to test a data collection system based on it in the conditions of the marine climate of Khanh Hoa (Vietnam).
2 Experimental
2.1 Materials and sample preparation
CB300 deformed steel reinforcement (TCVN 1651–2:2018, diameter of 10 mm) was purchased from Pomina, Vietnam. The elemental composition is shown in Table 1. An insulated copper conductor was soldered to one end of the bar. The soldering area was coated with epoxy resin. A smooth electrode (15 × 15 mm) was made from a steel bar with the same composition for the laboratory experiments (all surfaces, except the working one, were insulated with epoxy resin).
Elements
Mass fraction (wt.%)
Reinforced steel
Sensor anode plate
Fe
98.515
97.857
C
0.257
0.284
Mn
0.452
0.682
Si
0.166
0.196
P
0.014
0.011
S
0.033
0.025
Ni
0.135
0.396
Cr
0.029
0.065
Cu
0.321
0.194
Mo
0.006
0.016
Al
0.022
0.003
W
0.004
0.007
Sn
0.037
0.017
Co
0.009
0.008
Zn
–
0.074
Pb
–
0.230
The bimetallic batch sensor consisted of steel plates (anode, Table 1, thickness of 0.25 mm), M1 copper GOST 859–2001 (cathode, copper content of 99.9%, thickness of 0.10 mm), and mica (insulator, thickness of 0.20 mm). The homogeneous metal leads were connected with insulated current conductors. All surfaces except the working one were insulated with epoxy resin (Fig. 1a and 1b).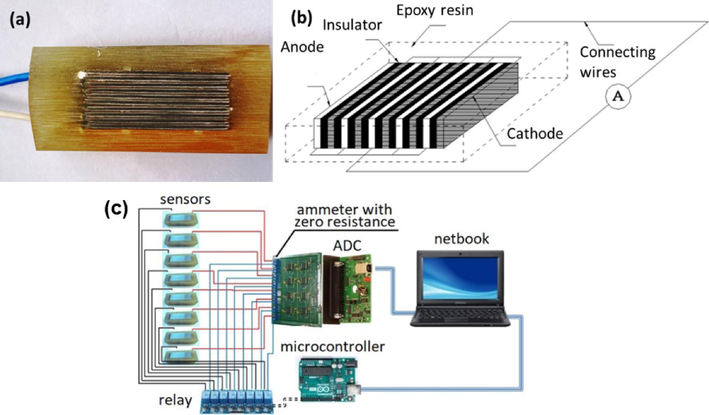
Photo (a) and schematic diagram (b) of sensor and schematic diagram (c) of systems.
The system for continuous monitoring was assembled by combining commercially available units with components produced in the laboratory. The system consisted of five components (Fig. 1c). A netbook was used to record and process data, while an analog–digital converter (ADC) L-CARD E-154 was applied to record on eight channels simultaneously. Besides, there was an electronic relay unit for periodic records and an ammeter featuring “zero” input resistance, which could read the signal generated by the bimetallic batch sensors. The ammeter was used to record values up to 0.1 μA.
The steel reinforcement and the anode plates of the sensor can be considered as having similar electrochemical properties since they have a similar elemental composition. Therefore, before immersion in aqueous solution and mortar, the surfaces of the electrodes and the sensor were sanded with P1000 sandpaper (14–20 µm Al2O3 abrasive) to St3 according to ISO 8501–1:2014 and degreased with ethyl alcohol (96%). The steel reinforcement was weighed to an accuracy of 0.0001 g to estimate the mass loss due to corrosion.
The cement-sand mortar was prepared from PCB40 Portland (Nghi Son) cement (composition presented in Table 2) and dry-washed quartz sand with a fraction of 0.20–0.63 mm. The weight ratio of cement to sand was 1:3. The water-cement ratio was w/c = 0.5. Samples of two types were obtained using formwork (Fig. 2). The first-type samples were prisms with dimensions of 170 × 130 × 120 mm with a sensor placed inside. The second-type samples were cylinders with a height of 250 mm and a diameter of 110 mm with a reinforcing bar along the axis. The thickness of the concrete coating over the working surface of the sensor and the reinforcement was 50 ± 5 mm. The samples were cured for 28 days at 100% humidity. They were removed from the formwork after 7 days. The exit point of current leads from concrete was additionally insulated with epoxy resin to prevent the accelerated ingress of aggressive components of the environment to the surface.
Components
Mass fraction (wt.%)
SiO2
22.0
Al2O3
8.0
CaO
62.0
Fe2O3
3.0
MgO
2.1
SO3
2.1
K2O
0.6
Na2O
0.2
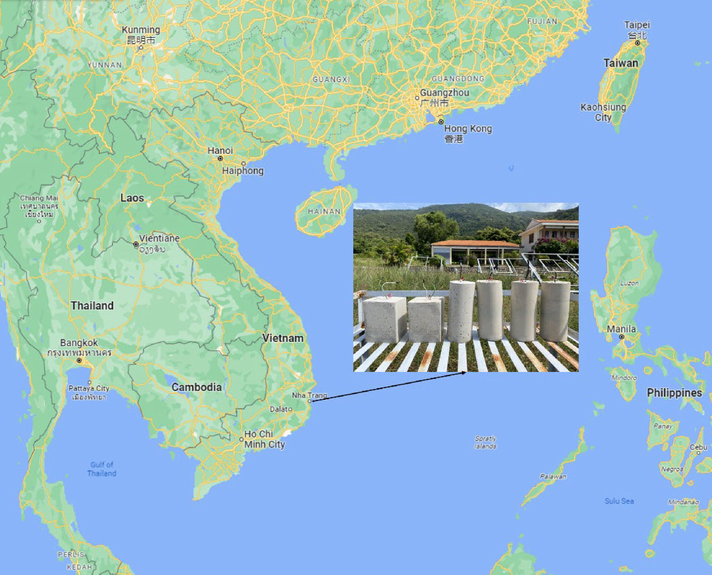
Photo of test samples and the location of the tests.
The aqueous extract for the laboratory experiments was prepared by a single extraction with distilled water from the crushed mortar for 24 h. The water/solids ratio was taken as 1:10 by weight. The resulting solution was filtered through a pleated filter paper. The ionic composition of the aqueous extract obtained by the iCAP Q ICP-MS method is presented in Table 3.
Ions
Concentration (mg·dm−3)
Na+
431.70
K+
1548.10
Ca2+
7306.00
Cl−
240.00
CO32−
98.69
SO42−
13.65
2.2 Method
2.2.1 Laboratory measurements
Potentiodynamic measurements were carried out under laboratory conditions in an aqueous extract, adding various chloride concentrations (CCl) from 0.0010 to 1.00 mol·dm−3. The experiment aimed to record complete anodic polarization curves and calculate the corrosion current density (icor) using the Mansfeld polarization resistance method (Mansfeld, 2005). A three-electrode glass cell with undivided cathode–anode spaces and natural aeration was used. The working electrode was immersed far from the solution surface of 20 ± 2 mm. The platinum grid and Ag/AgCl electrode were used as auxiliary and reference electrodes, respectively. The potential of the reference electrode relative to the standard hydrogen electrode was + 201 mV. For consistency, the results were presented using the Cu/CuSO4 reference electrode scale. The potential of the Cu/CuSO4 electrode to the standard hydrogen electrode scale was + 318 mV. After establishing the free corrosion potential (Ecor), polarization curves were recorded using a potentiostat/galvanostat (Autolab PGSTAT, the Netherlands) for 60 min at a scan rate of 0.2 mV/s until the activation potential (Eact). It was indicated by a sharp increase in the current density (i). The values of i were calculated relative to the geometric area of the electrode (2.25 cm2).
The current density at the sensor (isensor) was measured in an aqueous extract at the same above-chloride concentrations with different positions of the working sensor surface, including at 20 ± 2 mm and a range of 5 to 40 mm. The sensor current was recorded using a zero resistance ammeter with an accuracy of 0.1 µA for 60 min. The isensor values were calculated based on dividing the sensor current by the total geometric area of the anode plates (1.25 cm2). At least five reproducible dependences were obtained for each variation of the experiment. The data presented in Section 3 were obtained by statistical processing.
2.2.2 Field measurements
After curing, the obtained mortar samples were placed in different exposure conditions on the sea coast of Khanh Hoa Province, Vietnam (Fig. 2). It was marine atmosphere (60 m from the shoreline), splash zone (regular wetting by seawater, without constant immersion), and complete immersion in seawater to a depth of 1.0 and 3.0 m. The main parameters of the exposure conditions are provided in Table 4.
Parameter
Exposure conditions
Atmosphere
Seawater
Temperature, °C
23.6 – 31.4
23.4 – 31.5
Relative humidity of the air, %
49 – 98
–
Chloride deposition rate, mg·m−2·day−1
27.9 – 40.3
–
pH
–
8.1 – 8.4
Salinity, ‰
–
27 – 36
Dissolved oxygen, mg·dm−3
–
7.3 – 9.4
The electrochemical parameters of the samples were monitored at intervals of 14–40 days during the exposure. The mortar's electrical resistivity (ρ) was measured using a four-electrode Wenner probe (Resipod, Proseq, Switzerland) according to AASHTO T358-19. The free corrosion potential (Écor) of reinforcing steel on the surface of the samples was measured according to ASTM C876-2022 (Elcometer W331HM-4, England). The values of electrode potentials were presented according to the scale of the copper/copper sulfate reference electrode. The corrosion current density (icor) was calculated using the polarization resistance method according to ASTM G 109–2021 recommendations using the calculation procedure proposed by F. Mansfeld (Mansfeld, 2005). The icor values were presented in relation to the visible area of the reinforcement bar. The isensor was measured using a zero resistance ammeter with an accuracy of 0.1 µA for 180 s. The experiment was carried out for 260 days. At least three duplicate samples were used for each zone. The data presented in Section 3 were obtained by statistical processing.
2.2.3 Statistical analysis
To obtain reliable results and their subsequent statistical processing, measurements were carried out at least five times for laboratory tests for each type of solution. At least three samples of the same type were examined during field tests.
Statistical processing of the results of all measurements carried out in the work included: (i) determination of the average value for the measured value x, (ii) calculation of the standard deviation:
where xi is the result of the i-th measurement of x and n is the number of measurements; (iii) determination of the confidence interval for the value x: Δx = t0.90(n)⋅Sx,
where t0.90 is the Student's coefficient.
3 Results and discussion
3.1 Laboratory measurements
The Ecor values on the reinforcing steel electrode in aqueous extract without chlorides and with CCl ≤ 0.010 mol·dm−3 shifted positively until reaching the steady state (Fig. 3, curves 1–3). They varied from − 123 ± 7 to − 139 ± 8 mV. On the contrary, at CCl ≥ 0.10 mol·dm−3, there was a decrease in the potential (Fig. 3, curves 4–6), which may indicate a transition from the passive state to local activation. The Ecor values reached − 259 ± 9 mV at CCl = 0.10 mol·dm−3 and − 347 ± 7 mV at CCl = 1.00 mol·dm−3.
Changing the Ecor of steel reinforcement over time in an aqueous extract with different CCl, mol·dm−3: 1 – without Cl; 2 – 0.0010; 3 – 0.010; 4 – 0.10; 5 – 0.50; and 6 – 1.00.
Indeed, the anodic polarization curves had a passive region of more than 200 mV at CCl ≤ 0.010 mol·dm−3 (Fig. 4, curves 1–3). When the measurement was completed, no pitting or corrosion products were observed on the electrode surface with a magnification of up to 4 times. The increase in current density was probably due to the reaction of oxygen formation. At CCl ≥ 0.10 mol·dm−3 (Fig. 4, curves 4–6), the passive region was not recorded, and the value of Ecor was close to Eact. After the measurement, there were pits on the surface, visible without magnification. More details of the electrochemical parameters for the steel electrode at different chloride concentrations are presented in Table 5.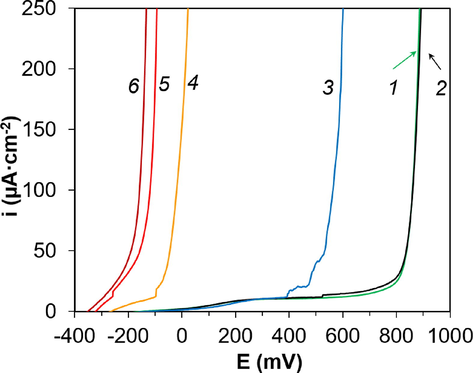
Anode polarization curves of an electrode made of steel reinforcement in an aqueous extract at different CCl, mol·dm−3: 1 – without Cl; 2 – 0.0010; 3 – 0.010; 4 – 0.10; 5 – 0.50; and 6 – 1.00.
CCl, mol·dm−3
Ecor, mV
ba, mV
bc, mV
B, mV
Rp, kΩ∙cm2
icor, µA·cm−2
isensor, µA·cm−2
0.0000
−139 ± 8
58 ± 5
47 ± 6
12 ± 3
128 ± 11
0.09 ± 0.02
5.1 ± 0.3
0.0010
−126 ± 9
152 ± 11
93 ± 9
26 ± 6
111 ± 8
0.22 ± 0.06
6.7 ± 0.3
0.010
−123 ± 7
216 ± 15
156 ± 12
40 ± 5
117 ± 6
0.34 ± 0.05
8.6 ± 0.5
0.10
−259 ± 9
196 ± 6
144 ± 8
37 ± 7
21 ± 3
1.8 ± 0.2
32 ± 2
1.00
−347 ± 7
197 ± 9
248 ± 18
49 ± 5
10.5 ± 0.9
4.5 ± 0.4
51 ± 4
The dependence of Eact on lgCCl could be satisfactorily described by a linear dependence (Fig. 5). Thus, the critical chloride concentration for the aqueous concrete extract of the specified composition was 0.010 < CCl ≤ 0.10 mol·dm−3. Within this range, local activation with the formation of pits takes place.
Dependence of Eact for steel reinforcement on lgCCl obtained in aqueous extract.
Similar results were obtained for the sensor. Thus, at CCl ≤ 0.010 mol·dm−3, a decreasing dependence of isensor up to a steady-state value in the range from 5.1 ± 0.3 to 8.6 ± 0.5 μA·cm−2 as a function of CCl (Fig. 6, curves 1–3) was recorded. The results are in satisfactory agreement with the previously obtained data for the passive state (Shevtsov et al., 2021). At CCl ≥ 0.10 mol·dm−3, the dependence of isensor increased over time (Fig. 6, curves 4,5). The steady-state values of isensor reached 32 ± 2 μA·cm−2 at CCl = 0.10 mol·dm−3 and 51 ± 4 μA·cm−2 at CCl = 1.00 mol·dm−3. More details of the electrochemical parameters for the sensor at different chloride concentrations are presented in Table 5.
Changing values of isensor of steel reinforcement over time in an aqueous extract with different CCl, mol·dm−3: 1 – without Cl; 2 – 0.0010; 3 – 0.010; 4 – 0.10; and 5 – 1.00.
The dependence between isensor and icor was satisfactorily described by a linear relationship (Fig. 7). The explicit form of the function could be represented as follows: isensor = 10.5·icor + 6.1. Thus, when we compared the results of potentiodynamic measurements on steel reinforcement in aqueous extract in the presence of chlorides and current density control on the sensor, we observed a correspondence between the corrosion state of the metal and the recorded values. The boundary between the passive state and local activation corresponded to isensor = 8.6 ± 0.5 µA·cm−2 at 0.010 < CCl ≤ 0.10 mol·dm−3 for the studied type of mortar. Absolute values of isensor and icor were linearly related with the proportionality coefficient of 10.5. So, the results of measurements of one parameter could be converted to the values of the other one.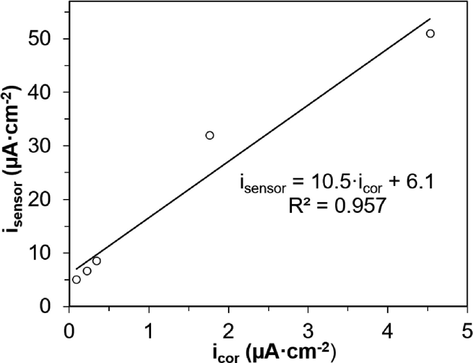
Dependence of isensor for steel reinforcement on icor obtained in the aqueous concrete extract.
The isensor dependence on the thickness of the electrolyte over the surface of the sensor was additionally obtained for the highest chloride concentration studied (Fig. 8). As expected, an increase in the isensor values from 43 ± 2 to 67 ± 5 μA·cm−2 was observed as the electrolyte thickness decreased from 40 to 5 mm. However, no linear correlation between these characteristics was determined. The research in this regard will be continued in further works.
Dependence of isensor in the aqueous extract with CCl = 1.00 mol·dm−3 at a different solution thickness above the working surface, mm: 1 – 5.0; 2 – 10; 3 – 20; 4 – 40.
3.2 Field measurements
After successful completion of the laboratory tests, field tests were carried out. The ρ values of the samples in the marine atmosphere during almost the entire observation period correspond to a moderate risk of corrosion (Fig. 9, curve 1) according to the criteria in the previous report (Broomfield et al., 2002). At one time (on the 195th day of observation), the values corresponding to a low risk of corrosion (69 ± 5 kΩ·cm) were obtained. This case was preceded under dry weather without precipitation for 7 days. Values at the border between the high and moderate risk of corrosion (10 ± 2 kΩ·cm) were recorded on the 36th and 99th days. The low electrical resistivity of the mortar corresponded to the period of abundant precipitation on the day of measurement and two to three days before it. The initial values of ρ for the samples in the splash zone and complete immersion were indistinguishable (Fig. 9, curves 2–4) and corresponded to a high risk of corrosion (2.0 ± 0.2 kΩ·cm). This phenomenon is due to the saturation of the capillary-pore system with seawater, which has high electrical conductivity. Over the observation time, ρ increased monotonously up to the border of high and moderate risk of corrosion. Such changes are typical for concrete in the first months after manufacture, when the coating is compacted due to the hydration of unreacted clinker in the presence of moisture (Garcia et al., 2022). Besides, according to the electrical resistivity criterion, a moderate corrosion risk was predicted only for samples in atmospheric conditions. When submerged in seawater and the splash zone, a high probability of corrosion persisted throughout the observation period.
Change in ρ for mortar samples under different exposure conditions: 1 – marine atmosphere; 2 – spray zone; 3 – complete immersion to a depth of 1 m; and 4 – complete immersion to a depth of 3 m.
For reinforcement bars of samples in the marine atmosphere, the Écor values were observed from − 350 mV to − 200 mV during the first 14 days, corresponding to the reinforcement's uncertain condition (Elsener, 2001) (Fig. 10, curve 1). After that, the Écor was increased up to − 200 mV. Together with the moderate risk of corrosion based on the ρ criterion, it is possible to predict the passive state before corrosion rate measurements.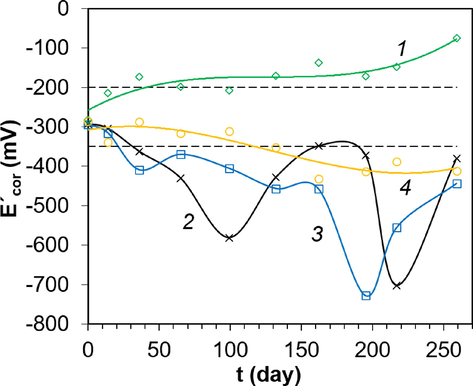
Change in Écor for mortar samples under different exposure conditions: 1 – marine atmosphere; 2 – spray zone; 3 – complete immersion to a depth of 1 m; and 4 – complete immersion to a depth of 3 m.
For samples located in the spray zone and submerged to a depth of 1 m, the Écor value was decreased to − 350 mV after 36 days (Fig. 10, curves 2,3). This behavior indicated a high probability of corrosion. For the case of exposure to seawater at a depth of 3 m, the transition to corrosion according to the Écor criterion was observed after 130 days (Fig. 10, curve 4).
On the other hand, by analyzing the criteria ρ and Écor, the passive state for reinforcing rods in samples that were in the marine atmosphere was reliably predicted during the entire observation time. A similar approach for samples in the spray zone and when submerged to a depth of 1 and 3 m allowed assuming a high probability of corrosion after the first measurement.
The corrosion rate values of steel reinforcement determined by the polarization resistance method generally agreed with the results of Écor measurements. Thus, for samples in the marine atmosphere, all values of icor were below the 0.1 μA·cm−2 limit. The only exception might be the beginning of the experiment, 36 and 132 days of observation, when the boundary values were obtained (Fig. 11, curve 1). For the splash zone and immersion to a depth of 1 m, there was a monotonic increase in icor (Fig. 11, curves 2,3): by day 14 and 36, respectively, the boundary of passive state and corrosion was reached. By the end of the experiment, moderately high values of 0.84 ± 0.15 and 0.67 ± 0.11 μA·cm−2 were obtained. At the same time, the icor for complete immersion to a depth of 1 m during the whole observation time did not exceed the values for the splash zone. Thus, the splash zone is a more corrosive medium for reinforced concrete structures. This phenomenon could be due to the cyclic nature of seawater exposure and greater oxygen availability. For samples immersed to a depth of 3 m, the initiation to corrosion of the reinforcement was observed by the 65th day (Fig. 11, curve 4). All calculated icor values were lower than those for the splash zone and 1 m immersion. The reason for the difference was discussed above. The results of isensor measurements have a similar pattern to icor (Fig. 12).
Change in icor for mortar samples under different exposure conditions: 1 – marine atmosphere; 2 – spray zone; 3 – complete immersion to a depth of 1 m; and 4 – complete immersion to a depth of 3 m.
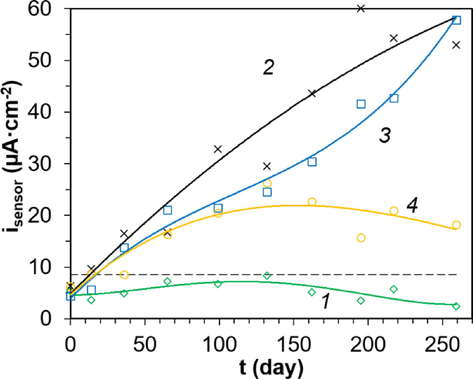
Change in isensor for mortar samples under different exposure conditions: 1 – marine atmosphere; 2 – spray zone; 3 – complete immersion to a depth of 1 m; and 4 – complete immersion to a depth of 3 m.
All the results of the isensor measurement and the icor calculation were compared, as in the case of aqueous concrete extract (Fig. 13). The obtained results can be described by a linear dependence at a high approximation confidence with an explicit form: isensor = 69.9·icor + 5.8. The resulting slope exceeds the value for the aqueous extract from concrete. The results obtained could be explained by the traditionally higher icor in aqueous solutions than concrete (Ramesh et al., 2022). Moreover, the hypothetical values of isensor at icor → 0 were almost very close (6.1 and 5.8 μA·cm−2).
Dependence of isensor for steel reinforcement on icor in mortar samples.
At the end of the experiment, there were no cracks on the samples (Fig. 14). The groups of samples subjected to complete immersion had traces of fouling. The presence of corrosion products and the nature of the failure of the reinforcing bars were visually analyzed after removing the protective layer. Photos are unavailable for publication due to data loss, so a verbal description is provided below. No corrosion products were observed on the surface of reinforcing bars from samples exposed to the marine atmosphere with a magnification of up to 4 times. The samples from the splash zone and those immersed to a depth of 1 m each showed 5–7 areas with corrosion products, represented by groups of pits. There were 3–4 corrosion areas on the reinforcing bars immersed at a depth of 3 m.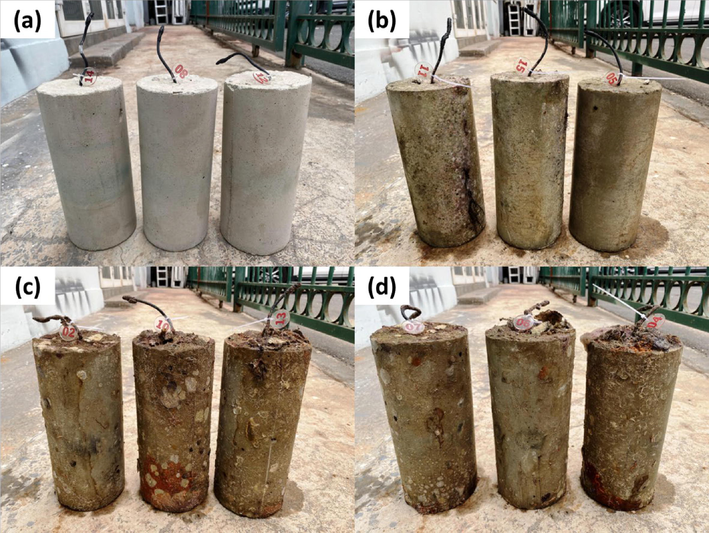
Photos of mortar samples after 9 months exposing in (a) marine atmosphere, (b) spray zone, and complete immersing at a depth of (c) 1 m and (d) 3 m.
The resulting corrosion products were removed according to ISO 8407:2021 to evaluate the mass loss. The results of converting the mass loss to the cross-section loss kweigh (assuming uniform corrosion) are presented in Table 6.
Exposure area
Loss of cross-section of reinforcing bars, k mm/year
kPR/kweigh
Weighing method
Polarization resistance method
Marine atmosphere
0.0003 ± 0.0002
0.0007 ± 0.0003
2.33
Spray zone
0.0033 ± 0.0006
0.0040 ± 0.0008
1.21
Immersion to a depth of 1 m
0.0030 ± 0.0008
0.0029 ± 0.0005
0.97
Immersion to a depth of 3 m
0.0016 ± 0.0005
0.0020 ± 0.0006
1.25
There are also the cross-section loss values calculated from the corrosion rates. The corrosion rates were estimated using the kPR polarization resistance method (calculated by Faraday's law). A good agreement on the values for the bars with corrosion products was achieved. The difference does not exceed 2 times the generally accepted error in determining the corrosion rate by the polarization resistance method for steel reinforcement in concrete (Andrade and Alonso, 2004). For the samples without traces of corrosion, the difference was 2.33 times. Both results correspond to the passive state. The more than two-fold difference is due to the proximity of the mass change of the control sample without corrosion products, adjusted for etching.
The sensors were also visually examined. All sensors retained their original dimensions and integrity. The samples exposed to the marine atmosphere had no corrosion products or pitting areas on the sensor surface (Fig. 15a). The crack resulted from breaking the concrete coating for visual examination. For the remaining cases, pitting areas were on the steel plates' surface (Fig. 15b-d).
Photos of sensors after 9 months exposing in (a) marine atmosphere, (b) spray zone, and complete immersing at a depth of (c) 1 m and (d) 3 m.
On the other hand, the satisfactory correspondence between isensor and icor was supported by the data of the cross-section loss control. This result makes it possible to apply the values of isensor (considering the proportionality coefficient) as a parameter in models for predicting the service life of RC structures, which were based on the corrosion rate (Andrade and Izquierdo, 2023). It is worth noting the prospects for developing such models based on machine learning, which has already been successfully used in predicting concrete's physical and mechanical properties (Garg et al., 2022a; Garg et al., 2022b).
4 Conclusions
The bimetallic batch sensor adequately simulates the corrosion of steel reinforcement in the mortar (more widely, concrete) in the presence of chlorides. It was confirmed by laboratory and field tests. The current density on the sensor, at which the passive state was maintained, was determined at 8.6 ± 0.5 μA·cm−2. An increase in the current density on the sensor was achieved at the concentration of chlorides 0.010 < CCl ≤ 0.10 mol·dm−3 in a model aqueous solution. Bimetallic batch sensors embedded in the mortar maintained their integrity and operability for at least 9 months in various exposure zones of Khanh Hoa (Vietnam). It was shown that the highest corrosion rate of steel reinforcement in the mortar was recorded in the splash zone and after immersion to a depth of 1 m in seawater. Under atmospheric conditions, the steel reinforcement remained passive. A linear dependence was obtained when comparing the current density on the sensor and the corrosion current density determined by the polarization resistance method (proportionality coefficient 69.9). This dependence makes it possible to apply the results of measurements on the sensor in known models to estimate the rate of destruction of RC structures, which are based on data on the corrosion rate of reinforcement. The sensor does not require external polarization and additional response analysis devices since it independently generates a signal (galvanic cell current). Using the current sensor can reduce the cost of a monitoring system but increase battery life when there is no constant access to energy sources. In addition, the results obtained for the system of continuous monitoring of the corrosion rate of steel reinforcement in concrete based on sensors of the proposed design in marine climate conditions show the prospects for further applications.
Funding
Cao Nhat Linh was funded by the Postdoctoral Scholarship Programme of Vingroup Innovation Foundation (VINIF), code VINIF.2022.STS.12. This research was also supported by the Joint Vietnam-Russia Tropical Science and Technology Research Center (project number 931/QĐ‐TTNĐVN).
Declaration of Competing Interest
The authors declare that they have no known competing financial interests or personal relationships that could have appeared to influence the work reported in this paper.
References
- Test methods for on-site corrosion rate measurement of steel reinforcement in concrete by means of the polarization resistance method. Mater. Struct.. 2004;37(9):623-643.
- [Google Scholar]
- Andrade C., Izquierdo D., 2023. Durability and cover depth provisions in next Eurocode 2. Background modelling and calculations. Hormigón y Acero. 1-39.
- Quantitative measurements of corrosion rate of reinforcing steels embedded in concrete using polarization resistance measurements. Mater. Corros.. 1978;29(8):515-519.
- [Google Scholar]
- Chloride induced reinforcement corrosion: Electrochemical monitoring of initiation stage and chloride threshold values. Corros. Sci.. 2011;53(4):1451-1464.
- [Google Scholar]
- High-performance cement mortars-based composites with colloidal nano-silica: Synthesis, characterization and mechanical properties. Arab. J. Chem.. 2021;14(9):103338
- [Google Scholar]
- Stability and dynamic analyses of SW-CNT reinforced concrete beam resting on elastic-foundation. Comput. Concr.. 2020;25(6):485-495.
- [Google Scholar]
- Half-cell potential mapping to assess repair work on R.C. structures. Constr. Build. Mater.. 2001;15:133-139.
- [Google Scholar]
- Half-cell potential measurements – Potential mapping on reinforced concrete structures. Mater. Struct.. 2003;36(7):461-471.
- [Google Scholar]
- Review of fiber optic sensors for corrosion monitoring in reinforced concrete. Cem. Concr. Compos.. 2021;120:104029
- [Google Scholar]
- Electrochemical sensors for monitoring the corrosion conditions of reinforced concrete structures: A review. Appl. Sci.. 2017;7:1.
- [Google Scholar]
- Mechanical properties and electrical resistivity of portland limestone cement concrete systems containing greater than 15% limestone and supplementary cementitious materials. Cement.. 2022;8:100026
- [Google Scholar]
- Machine learning models for predicting the compressive strength of concrete containing nano silica. Comput. Concr.. 2022;30(1):33-42.
- [Google Scholar]
- Predicting elemental stiffness matrix of F.G. nanoplates using Gaussian Process Regression based surrogate model in framework of layerwise model. Eng. Anal. Bound. Elem.. 2022;143:779-795.
- [Google Scholar]
- Olive leaf extract as a green corrosion inhibitor of reinforced concrete contaminated with seawater. Arab. J. Chem.. 2020;13(3):4846-4856.
- [Google Scholar]
- Quantitative determination of corrosion status of rebar by electrochemical parameters. Academic Journal of Architecture and Geotechnical Engineering.. 2021;3:32-40.
- [Google Scholar]
- A review on corrosion detection and protection of existing reinforced concrete (R.C.) structures. Constr. Build. Mater.. 2022;325:126718
- [Google Scholar]
- Continuous monitoring of steel corrosion condition in concrete under drying/wetting exposure to chloride solution by embedded MnO2 sensor. Int. J. Electrochem. Sci.. 2018;13:719-738.
- [Google Scholar]
- Reliability and long-term evaluation of GO-MnO2 nano material as a newer corrosion monitoring sensor for reinforced concrete structures. Cem. Concr. Compos.. 2019;100:74-84.
- [Google Scholar]
- Corrosion Costs and Preventive Strategies in the United States. Washington D.C., USA: FHWA; 2001.
- Tafel slopes and corrosion rates obtained in the pre-Tafel region of polarisation curves. Corros. Sci.. 2005;12:3178-3186.
- [Google Scholar]
- Zur voll-probabilistischen Modellierung der Korrosion von Stahl in Beton. Technische Universität München; 2013. Doctoral dissertation
- Embedded Sensors for Corrosion Monitoring of Existing Reinforced Concrete Structures. Mater. Sci. Forum. 2008;587–588:677-681.
- [Google Scholar]
- Spatial variability of half-cell potential data from a reinforced concrete structure – a geostatistical analysis. Struct. Infrastruct. Eng. 2022:1-16.
- [Google Scholar]
- Test methods for on site measurement of resistivity of concrete – a RILEM TC-154 technical recommendation. Constr. Build. Mater.. 2001;15(2–3):125-131.
- [Google Scholar]
- Evaluation of Greener Corrosion-Inhibiting Admixtures for Steel Reinforcements in Concrete. Arab. J. Sci. Eng.. 2022;47(10):13451-13466.
- [Google Scholar]
- Macrocell sensor systems for monitoring of the corrosion risk of the reinforcement in concrete structures. NDT and E Int.. 2001;34(6):435-442.
- [Google Scholar]
- Electrical Resistivity Measurements for Non-destructive Evaluation of Chloride-Induced Deterioration of Reinforced Concrete – A Review. Materials.. 2022;2022(15):2725.
- [Google Scholar]
- Reinforced concrete structures: A review of corrosion mechanisms and advances in electrical methods for corrosion monitoring. Constr. Build. Mater.. 2021;269:121240
- [Google Scholar]
- Methodology for assessing the probability of corrosion in concrete structures on the basis of half-cell potential and concrete resistivity measurements. Scientific World Journal. 2013;2013:1-8.
- [Google Scholar]
- Global Needs for Knowledge Dissemination, Research, and Development in Materials Deterioration and Corrosion Control. New York, NY, USA: World Corrosion Organization; 2009.
- System for Continuous Monitoring of the Corrosion Rate in Concrete Reinforcement based on Bimetallic Batch Sensors. Prot. Met. Phys. Chem. 2021;57:1388-1394.
- [Google Scholar]
- Evaluation of the efficiency of the secondary corrosion protection of steel reinforcement bars in concrete using a bimetallic batch sensor. International Journal of Corrosion and Scale Inhibition.. 2022;11(3):1228-1237.
- [Google Scholar]
- Climate change adaptation for corrosion control of concrete infrastructure. Struct. Saf.. 2012;35:29-39.
- [Google Scholar]
- A review on five key sensors for monitoring of concrete structures. Constr. Build. Mater.. 2019;204:492-509.
- [Google Scholar]
- Tuutti K., 1982, Corrosion of steel in concrete. Cement-och betonginst.
- Monitoring corrosion of steel bars in reinforced concrete structures. Scientific World Journal 2014
- [Google Scholar]
- A new corrosion sensor to determine the start and development of embedded rebar corrosion process at coastal concrete. Sensors. 2013;13:13258-13275.
- [Google Scholar]
- Fluorescent pH probes for alkaline pH range based on perylene tetra-(alkoxycarbonyl) derivatives. Arab. J. Chem.. 2020;13(6):5900-5910.
- [Google Scholar]


