

Translate this page into:
Optimising zero-valent iron from industrial waste using a modified air-Fenton system to treat cutting oil wastewater using response surface methodology
⁎Corresponding author at: Department of Environmental Science, Faculty of Science, Chulalongkorn University, Bangkok 10330, Thailand. vorapot.ka@chula.ac.th (Vorapot Kanokkantapong)
-
Received: ,
Accepted: ,
This article was originally published by Elsevier and was migrated to Scientific Scholar after the change of Publisher.
Peer review under responsibility of King Saud University.
Abstract
This study investigates the treatment of cutting oil wastewater from the automotive parts manufacturing industry to promote sustainability via the use of ‘used shot blasts’, which are the by-products of auto parts production. Used shot blasts are rich iron sources of Fe0, which becomes an effective catalyst in the Fenton reaction. A modified air-Fenton (MAF) system was proposed to generate hydroxyl radicals that eliminated recalcitrant organics in cutting oil wastewater. First, the Taguchi method, comprising the L18 orthogonal array design, was used to identify significant operation factors, including the size and amount of used shot blasts, initial pH, reaction time, mixing speed, initial cutting oil concentration, and air flow rate. Then, a central composite rotatable design coupled with response surface methodology (RSM) was used to determine the optimal conditions and model the influencing variables. The results provided three crucial variables for the cutting oil wastewater treatment through use of the MAF system: initial pH, the amount of used shot blasts, and initial cutting oil concentration. RSM was applied to reveal the optimum operating conditions, achieving a maximum removal efficiency of 92.82% for chemical oxygen demand (COD), 80.18% for total organic carbon (TOC), and 99.55% for turbidity within 45 min of operating the MAF system. The model agreed well with the experimental data, with coefficient of determination values of 0.9819, 0.9654, and 0.9715 for COD, TOC, and turbidity removal efficiency, respectively. Pseudo-second-order reaction kinetics fitted well for COD removal, with a rate constant of 0.0218 min−1 and hydrogen peroxide generation of 0.0169 M. Overall, the proposed MAF system was efficient and had a low operating cost (0.67 USD/m3).
Keywords
Aeration system
Used shot blasts
Wastewater treatment
Waste utilization
Taguchi method
Response surface methodology

- ANOVA
-
analysis of variance
- AOP
-
advanced oxidation process
- CCRD
-
central composite rotatable design
- COD
-
chemical oxygen demand
- MAF
-
modified air-Fenton
- OA
-
orthogonal array
- RSM
-
response surface methodology
- S/N
-
signal-to-noise
- SEM
-
scanning electron microscopy
- TM
-
Taguchi method
- TOC
-
total organic carbon
- XRD
-
X-ray diffraction
- XRF
-
X-ray fluorescence
- ZVI
-
zero-valent iron
Abbreviations
1 Introduction
Cutting oil is widely used in various industries, particularly during the machining process in auto parts manufacturing due to its properties as a coolant and lubricant. Cutting oil is composed of a base oil (mineral and synthesis oil), surfactant, and a variety of additives. With repeated use, cutting oil loses its effectiveness and can be contaminated with trash, small chips, bacteria, and various metals; one reason for this is that the base oil has low biodegradability and contains additives that generally have high chemical oxygen demand (COD), total organic carbon (TOC) level, and turbidity when contaminated with wastewater (Kobya et al., 2011; Kaur and Sodhi, 2020). Cutting oil wastewater can be treated in various ways, including ultrafiltration (Popović et al., 2019), adsorption (Sarkheil et al., 2014), coagulation and membrane processes (Cheng and Gong, 2018), modified induced air flotation (Chawaloesphonsiya et al., 2019), and electrocoagulation (Milic et al., 2016; Demirbas and Kobya, 2017). Among these methods, the homogeneous Fenton process, which is a type of advanced oxidation process (AOP) wherein hydrogen peroxide (H2O2) is used as an oxidant and Fe (II) ions are used as catalysts at an acidic pH, can be used to release hydroxyl radicals (•OH) (Rodríguez-Narváez et al., 2019; Hassan et al., 2021) and reduce oil wastewater at the laboratory scale (Hai Nam et al., 2021). However, the Fenton process has two major drawbacks: the cost incurred for the chemicals is high due to the continuous use of ferrous salt and H2O2, as well as the need for chemicals required to create acidic treatment conditions and neutralise discharge; second, the process involves disposing iron sludge (Bokare and Choi, 2014; Rezaei and Vione, 2018).
Recently, researchers have discovered that zero-valent iron (ZVI) can form alone in acidic and aerobic conditions; generally, H2O2 can generate •OH that are strong, non-selective, and highly reactive oxidants, thereby playing a significant role in the mineralisation of pollutants (Xiong et al., 2015; Ruan et al., 2021) and degradation of organic and inorganic pollutants such as phenol (Shimizu et al., 2012), nitro-aromatics (Yuan et al., 2016b), and dyes (Zhou et al., 2009). Hydroxl radicals generated in wastewater treatment systems can degrade organic pollutants via a reductive Fenton reaction (Harada et al., 2016).
From the literature, various types of catalysts have been typically applied in heterogeneous Fenton and Fenton-like reactions, such as iron mining residue (Rojas-Mantilla et al., 2019), prepared catalysts: Fe2O3 and TiO2-clay (Molina et al., 2020), solid waste: steel slag (Heidari et al., 2018), and zero-valent metals: Fe, Al, Zn, and Cu. The related studies have concentrated on waste utilisation, specifically its use as a catalyst in the Fenton process. The auto parts manufacturing industry typically generates a large amount of wastewater and other waste; particularly, used shot blasts (a particulate waste generated by spraying excess iron to meet a desired shape); this type of waste is commonly landfilled. Used shot blasts are small, round, steel waste products that are rich in ZVI, and therefore, should be suitable for use as a heterogeneous catalyst in the process known as the modified air-Fenton (MAF) system, which generates •OH in aeration systems without the need for H2O2. The MAF system is considered sustainable because it is readily available, cost-effective, and environmentally friendly (Van et al., 2019) in terms of waste utilisation. This study therefore applied the MAF system to treat wastewater utilising used shot blasts, and the product was then used to treat cutting oil wastewater at auto parts manufacturing plants. Moreover, numerous operating parameters from the reported literature were adopted and evaluated to optimise the conditions of the proposed MAF system, including initial pH, catalyst dosages, air flow rate, and treatment time (Ren et al., 2016; Yuan et al., 2016a; Yuan et al., 2016b), with mixing speed being of particular interest due to its potential for increasing the mass transfer rate as a result of the limited air rate under operating conditions (Yuan et al., 2016a).
To improve the performance of related experiments, this study used a technique that maximises benefits while requiring the least number of experiments to be performed in the shortest time period. Among central composite experimental designs, the central composite rotatable design (CCRD) has shown great potential for stabilising the target region of the design around a central point by using the properties of rotatability and orthogonality (Hader and Park, 1978). Furthermore, response surface methodology (RSM) can optimise the experimental variables in the organic pollution degradation processes, such as solar photoelectro-Fenton (Brillas and Garcia-Segura, 2016), photo-Fenton (Drumm et al., 2018), electro-Fenton (Dolatabadi et al., 2021), and Fenton reactions (Mahtab et al., 2021; Verma and Chaudhari, 2020).
The present study focused on optimising waste utilisation in a low-cost MAF system, with used shot blasts as a source of ZVI; the latter was, in turn, used as a catalyst. Solid waste was used to treat liquid waste in its production process for developing more environment-friendly procedures and transforming waste to Fenton catalysts. To create a mathematical model and optimise the operation parameters of the system, CCRD coupled with RSM was used. First, the Taguchi method (TM), comprising the L18 orthogonal array (OA) design, was used to identify the operating parameters (amount and size of used shot blasts, reaction time, mixing speed, initial pH, initial oil concentration, and air flow rate), which are significant parameters for the system. Of these, three crucial parameters were identified using CCRD based on their potential to model and optimise the factors influencing treatment efficiency in the MAF system. This study is the first to utilise used shot blasts from by-products as a catalyst in the MAF system, particularly to treat cutting oil effluent in the auto parts production process. Furthermore, based on our findings, we propose current trends and future prospects for waste utilisation in terms of sustainable development and economic benefits.
2 Materials and methods
2.1 Chemicals
All chemicals used in this study were of an analytical grade. Hydrogen peroxide (30% W/W), sulphuric acid (H2SO4), and sodium hydroxide (NaOH) were purchased from Merck Millipore Company, Germany. Deionised water (18.2 MΩ.cm) was used to prepare solutions for all experimental processes.
2.2 Catalyst preparation and characterisation
The used shot blasts that were used as a source of ZVI were collected from an auto-parts manufacturing firm in Chonburi Province, Thailand. This material was dried at 105 °C to a constant weight and then sieved using a mechanical sieve shaker, into different size fractions (0.5–1.0 and 0.2–0.5 mm) and subsequently stored in a desiccator. The morphology of the used shot blasts was determined via scanning electron microscopy (SEM (Apreo, FEI, The Netherlands). The iron content was analysed using X-ray fluorescence (XRF) spectroscopy (XGT-5200WR, HORIBA, Japan) and the chemical state of the iron was analysed using X-ray diffraction (XRD; Empyrean, PANalytical, The Netherlands). The specific surface area and pore diameter distribution was determined by an N2 adsorption/desorption experiment at Autosorb iQ Station 1 (Quantachrome, USA).
2.3 Synthesis of cutting oil wastewater
The synthetic cutting oil wastewater was prepared from commercial cutting oil (Castrol AlmeredgeTM BI). The oily wastewater was synthesised by mixing the cutting oil with deionised water content ranging from 0.1 to 4% v/v at 500 rpm for 10 min to form a homogeneous, milky oil-in-waster emulsion. The initial pH of the solution was then adjusted to the desired value using H2SO4 or NaOH prior to the experiments. The cutting oil type was a water-based cutting fluid (Wu et al., 2021) containing a mineral oil concentration greater than 60% wt and having a pH of 9.5 with a milky white colour. The COD concentration was prepared ranging from 1,200 to 65,000 mg/L based on metal processing wastewater (Amin et al., 2017; An et al., 2017; Garcia-Costa et al., 2021; Jagadevan et al., 2011; Jagadevan et al., 2013). The characteristics of this synthetic cutting oil are summarised in Table 1.
Parameter
Oil concentration (% v/v)
0.1
1
2
3
4
COD (mg/L)
1,293–1,642
11,546–14,066
25,532–28,936
37,447–39,149
51,200–65,600
TOC (mg/L)
–
5,450–5,508
9,650–11,310
14,640–15,690
–
Turbidity (NTU)
984–996
13,400–13,580
26,400–28,000
39,000–40,600
41,700–42,600
pH
8.0–9.0
8.0–9.0
8.0–9.0
8.0–9.0
8.0–9.0
2.4 Experimental procedure
2.4.1 Batch experiments in the MAF system
Batch experiments were performed in the MAF system by adding used shot blasts to 100 mL of synthetic wastewater at a desired initial concentration and initial pH in 250-mL Erlenmeyer flasks. In each trial, the cutting oil solution was continuously fed oxygen by an air pump and/or mixed under a rotary shaker at different speeds and times, to investigate the effects at ambient temperature, as shown in Fig. 1. At the end of the experiment, the final pH values of the samples were measured and adjusted to more than 8.0 using NaOH, if necessary, to stop the reaction. After allowing the samples to settle for approximately 2 h, the supernatant was withdrawn and used to analyse the response parameters. It should be noted that the same batch experiment procedure was used in all experiments, and each run was conducted in accordance with the experimental designs for the TM (Table 2) and CCRD (Table 3). COD was determined using the dichromate closed reflux method (Method 5520C; APHA, 2005), while the TOC and turbidity levels were measured using a TOC analyser (Shimadzu, Japan) with a range of 0–500 mg/L and a TN-100 waterproof turbidity meter (Thermo ScientificTM Eutech, USA) with a range of 0–1000 NTU, respectively. The removal efficiency of the dependent variables was calculated using Eq. (1):
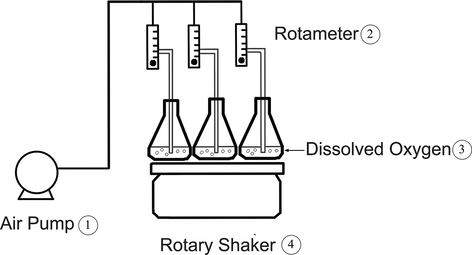
Schematic diagram of the experimental set-up used in this study.
Factor
Level
1
2
3
Size of used shot blast (mm)
0.5–1.0
0.2–0.5
–
Reaction time (min)
30
360
720
Mixing speed (rpm)
0
60
120
pH
2.0
5.0
7.0
Amount of used shot blasts
1.00
10.00
20.00
Air flow rate (ml/min)
1
3
5
Initial cutting oil concentration (% v/v)
0.10
1.00
4.00
Factor
Coded level for factor
−1.68
−1
0
1
1.68
pH
0.3
2.0
4.5
7.0
8.7
Amount of used shot blast (g)
16.59
20.00
25.00
30.00
33.41
Initial cutting oil concentration (% v/v)
0.32
1.00
2.00
3.00
3.68
2.4.2 Use of the TM for selecting suitable conditions
The TM is a powerful and efficient method for designing processes to be investigated using only a minimum number of trials (Karna and Sahai, 2012), while its use of an OA ensures no interaction among the independent factors (Zirehpour et al., 2014), and thus was selected to screen the crucial variables. Generally, the variability of parameters can be expressed as the signal-to-noise (S/N) ratio, where the signal represents a desirable value and noise represents an undesirable value, to measure the quality of a characteristic deviating from the desired values. Analysis of variance (ANOVA) was used to determine the significance of the operational parameters and the relative contributions to the response parameter (Yadav, 2017).
Based on the seven independent variables (the amount and size of used shot blasts, reaction time, mixing speed, initial pH, initial concentration of cutting oil, and air flow rate), the experimental design set of the L18 OA was selected as the most suitable. Eighteen experiments were required for seven factors consisting of three levels and one factor consisting of two levels; their values are summarised in Table 2. To maximise the removal efficiency, a larger problem of this type was selected to calculate the S/N ratio, along with a response variable, to determine the COD removal efficiency.
2.4.3 Use of CCRD to optimise conditions
In our study, CCRD coupled with RSM was applied to optimise the three independent variables (initial pH, amount of used shot blasts, and initial cutting oil concentration) that were obtained from the results of the L18 OA design. The remaining variables were used as control parameters as follows: the size of used shot blasts (0.2–0.5 mm), air flow rate (5 mL/min), no mixing speed, and reaction time of 45 min. The TM results were used to determine the reaction time under optimal conditions (size 0.2–0.5 mm of 20 g, initial pH of 2, and air flow rate of 5 mL/min). The COD removal efficiencies were examined at various times: 5, 10, 20, 30, 45, 60, 120, 180, 240, 360, and 1,080 min. Since the removal efficiency significantly increased from 5 to 45 min and then remained constant, the reaction time was considered as 45 min in this MAF system. In this section, the response functions, namely, the COD, TOC, and turbidity removal efficiencies, were analysed to obtain the optimum conditions. Sixteen CCRD experiments were required for each of the three factors, with five levels for each independent variable (−1.68, −1, 0, +1, and +1.68), as summarised in Table 3.
The general second-order polynomial equation presents the correlation between the response and independent variables, as shown in Eq. (2):
ANOVA was performed to determine the statistical significance of the variables, interactions, and lack of fit. The quality of the fitted polynomial model was expressed by the coefficient of determination (R2) and adjusted R2 (Almeida et al., 2011; El-Ghenymy et al., 2012; Barwal and Chaudhary, 2016). Moreover, kinetic studies were performed using the optimum conditions for CCRD experiments (Argun and Karatas, 2011). A spectrophotometric method using 2, 9-dimethyl-1, 10-phenanthroline was used to measure the H2O2 concentration (Kosaka et al., 1998) under optimum conditions. STATISTICA 10 (Statsoft, Tulsa, OK, USA) was used to analyse the data and design the statistics of both the Taguchi and CCRD experiments.
3 Results and discussion
3.1 Characterisation of catalysts
Shot blasting is a resurfacing process used to shape and clean steel products. The shot blasts are used in surface polishing to remove excess iron and sand the product during the forming process. Consequently, the shape of the original shot blast typically changes and is often contaminated with sand; thus, it cannot be used again in the manner depicted in Figs. 2 and 3. The used shot blasts have an average pore size of 2.64 nm, categorised as mesopores (between 2 and 50 nm (Haber, 1991). The specific surface area and total pore volume are 0.79 m2/g and 0.001 cm3/g, respectively. These values are lower in comparison with those of heterogeneous catalysts such as goethite (α -FeOOH) (Scaratti et al., 2018) and fly ash (Grassi et al., 2020). In our study, XRD was used to characterise used shot blasts of different sizes as shown in Figs. 4 and 5. Notably, iron was predominantly present in the Fe0 state, indicated by a diffraction peak at a 2θ value of 44.67°; other elements sized 0.2–0.5 mm, such as Si and Al, were present as silicon oxide (SiO2) and mullite (Al4.68Si1.32O9.66). Used shot blasts sized 0.5–1.0 mm indicated Fe in the form Fe0. XRF results revealed that the used shot blasts contained approximately 96.37 and 94.99 wt% Fe corresponding to pieces sized 0.2–0.5 and 0.5–1.0 mm, respectively. They also comprised trace elements, such as Si (2.06 wt%), Al (0.84 wt%), and others (0.73 wt%) in the 0.2–0.5-mm sizes, and Si (3.19 wt%), Al (0.80 wt%), and others (1.02 wt%) in the 0.5–1.0 mm sizes. As a result, the reaction of the used shot blasts with high Fe content under oxic conditions during wastewater treatment was primarily responsible for the degradation of organic pollutants in the MAF system.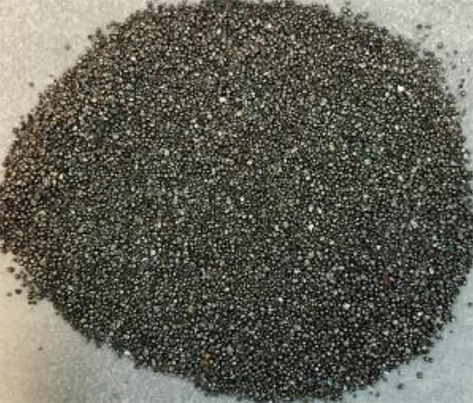
Used shot blast.
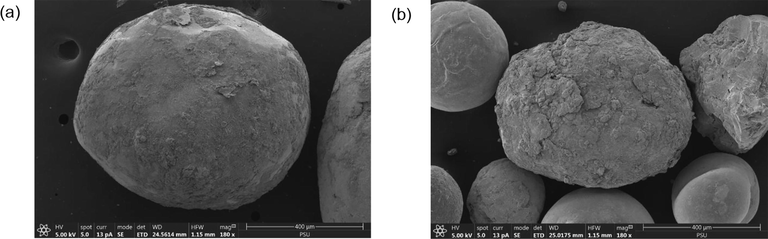
Scanning electron microscopy image of used shot blast samples before treatment. (a) 1.00–0.50 mm; 180x and (b) 0.20–0.50 mm; 180x.
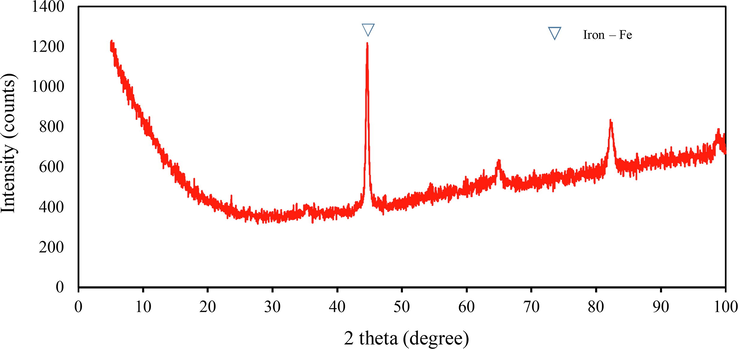
X-ray diffraction pattern of used shot blast sized 0.50–1.00 mm before the reaction.
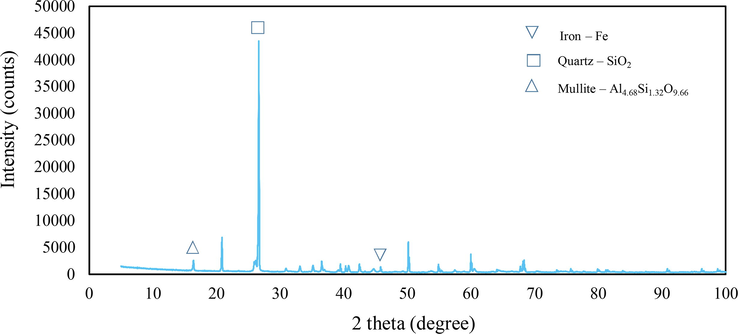
X-ray diffraction pattern of used shot blast sized 0.21–0.50 mm before the reaction.
3.2 Selected experimental conditions
The focus of the TM is to maintain a mean performance characteristic value near the target value, not a value within specified limits. The ANOVA test was applied to select the critical parameters in the MAF system that may have influenced COD removal efficiency. Table 4 illustrates the five factors that were significant (p-value < 0.05) for COD removal: the size of the used shot blasts (0.2–0.5 and 0.5–1.0 mm), followed by initial pH (2, 5, and 7), initial cutting oil concentrations (0.1, 1, and 4% v/v), amount of used shot blasts (1, 10, and 20 g), and the air flow rate (1, 3, and 5 mL/min). There was no significant influence of the reaction time (30, 360, and 720 min) and mixing speed (0, 60, and 120 rpm). The influence of the S/N ratio on each factor in COD removal is shown in Fig. 6.
Source
Sum of squares
Degrees of freedom
Mean square
F-value
P-value
Size of used shot blasts (mm)
575.80
1
575.80
64.99
0.0000
Amount of used shot blasts (g)
395.21
2
197.60
22.30
0.0000
Reaction time (min)
47.01
2
23.51
2.65
0.0929
Mixing speed (rpm)
29.10
2
14.10
1.69
0.2071
pH
541.68
2
270.84
30.57
0.0000
Initial cutting oil concentration (% v/v)
467.89
2
233.94
26.40
0.0000
Air flow rate (ml/min)
223.93
2
111.97
12.64
0.0002
Error
194.92
22
8.86
Total
2,476.44
35
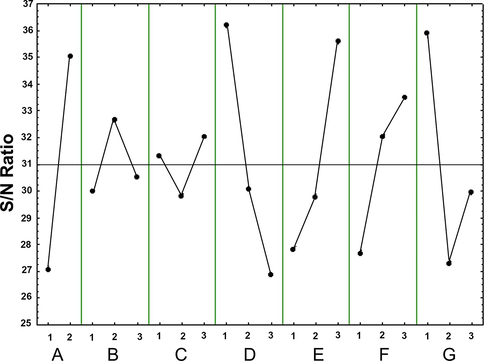
Average signal to noise ratio for factor levels of chemical oxygen demand (COD) removal in used shot blasts in the modified air-Fenton system. The factors were: A, size of used shot blast (mm); B, reaction time (min); C, mixing speed (rpm); D, initial pH; E, amount of used shot blasts (g); F, air flow rate (ml/min); and G, initial cutting oil concentration (% v/v). Solid lines indicate means and dashed lines indicate 2α of standard deviation.
The ANOVA test revealed that the size of the used shot blasts was the most significant independent variable; thus, 0.2–0.5 mm sized shot blasts were chosen to further optimise the conditions with a higher S/N ratio due to their high Fe content. This was done because it is well known that Fe content in the catalyst is a significant factor in the Fenton process (Lee et al., 2009). Moreover, the number of particles per unit weight was greater in the 0.2–0.5 mm size range than in the 0.5–1.0-mm size range (Hussain et al., 2021), resulting in the particles having a larger surface area. Furthermore, an air flow rate of 5 mL/min was chosen as a control variable, resulting in the highest S/N value, which increased the dissolved oxygen concentration, potentially causing Fe corrosion (Wang et al., 2010). The reaction could then produce H2O2 linked to •OH under oxic conditions (Harada et al., 2016; Yoon et al., 2016).
The three most critical operating parameters—the initial pH, amount of used shot blasts, and initial cutting oil concentration—were identified and optimised. Previous studies established that the initial concentration of pollutants, initial Fe load, and pH level affected wastewater mineralisation (Chang et al., 2009; Wang et al., 2010). In our study, the S/N value increased in direct proportion to the amount of used shot blasts to achieve complete COD degradation. However, the pH results illustrated that the highest S/N value was obtained under strong acidic conditions (pH 2.0); this indicated the dissociation of Fe powder. Under an aeration system, the oxidation of Fe0 with O2 first generates H2O2 and then •OH, as shown in Eqs. (3) and (4) (Harada et al., 2016; Wang et al., 2018):
According to previous a study, the degradation of organic pollutants under oxic conditions is significantly greater than under anoxic conditions in acidic conditions (Wang et al., 2010). As a result, given acidic conditions and enough dissolved oxygen, the MAF process has the potential to completely degrade organic pollutants.
3.3 Optimising conditions under the MAF system
3.3.1 Effect of crucial independent experimental variables on the MAF system
The three most crucial independent variables obtained from the TM, namely the initial pH ( ), amount of used shot blasts ( ), and initial cutting oil concentration ( ), were optimised for three response variables of removal efficiency: COD, TOC, and turbidity. At an air flow rate of 5 mL/min in 45 min, the results for 16 runs revealed a strong influence of the experimental variables on the response variables.
The design matrix for the CCRD, as well as the observed and predicted removal efficiencies given in Table 5, were then modelled using Eq. (2). The empirical model describes the relationship between the responses and the independent variables, as illustrated in Eqs. (5) through (7) below:
, initial pH;
, amount of used shot blasts (g);
, initial cutting oil concentration (%v/v).
Run
Coded levels
COD (%)
TOC (%)
Turbidity (%)
Observed
Predicted
Observed
Predicted
Observed
Predicted
1
−1
−1
−1
60.73
56.49
39.13
42.97
89.01
94.43
2
−1
−1
1
46.03
46.78
9.35
13.69
10.24
8.61
3
−1
1
−1
92.82
88.86
80.18
75.67
99.55
95.03
4
−1
1
1
69.45
69.81
21.96
25.37
20.26
29.76
5
1
−1
−1
33.03
31.31
−2.64
−3.30
53.64
42.95
6
1
−1
1
29.41
32.00
4.27
11.52
7.91
11.24
7
1
1
−1
26.67
24.56
9.15
7.55
22.22
22.66
8
1
1
1
13.04
15.91
2.44
1.35
18.11
11.50
9
−1.68
0
0
70.83
74.39
62.03
59.14
80.33
74.54
10
+1.68
0
0
9.52
7.89
1.03
0.04
8.41
15.89
11
0
−1.68
0
30.77
31.67
11.32
3.86
21.29
22.84
12
0
+1.68
0
44.34
45.37
19.24
22.81
23.42
23.56
13
0
0
−1.68
61.40
67.90
34.63
37.70
81.90
86.89
14
0
0
+1.68
57.02
52.46
14.81
7.86
8.64
5.34
15
0
0
0
60.00
61.41
24.45
22.75
19.35
15.98
16
0
0
0
63.16
61.41
20.38
22.75
12.90
15.98
In Eqs. (5) through (7), the synergistic effect can be represented by a positive sign, whereas an antagonistic effect can be represented by a negative sign. The initial pH, amount of used shot blasts, and initial cutting oil concentration had significant effects on the removal efficiency. In comparison with all parameters, the coefficient estimation with higher values had a greater impact. The initial pH ( = −39.54) had a stronger effect on the COD removal efficiency than the initial concentration of cutting oil ( = −9.18) and the amount of used shot blasts ( = 8.14). The TOC removal efficiency was significantly affected by the initial pH ( = −35.15), followed by the initial cutting oil concentration ( = −17.74) and the amount of used shot blasts ( = 11.27). However, the initial cutting oil concentration ( = −48.49) had the greatest effect on the turbidity removal efficiency, followed by the initial pH ( = -34.87) and the amount of used shot blasts ( = 0.43). Furthermore, a coefficient estimation with a negative value indicated a negative effect of the parameters on the removal efficiency and vice versa; thus, increasing the pH and initial cutting oil concentration reduced the COD, TOC, and turbidity removal efficiency, whereas increasing the amount of used shot blasts increased these parameters.
An ANOVA test was used to statistically validate the significance of the models and the lack of fit for the quadratic models in Eqs. (5) through (7); essentially, the ANOVA test was used to assess the significance of individual, binary, and quadratic terms that are summarised in Tables 6–8. In all cases, the F-values for the models were greater than the Ftabulated values, and the F-value for the lack of models was lower than the Ftabulated value; indicating that all the models fitted the experimental data well. From the data provided in Tables 6–8, the F-values for the regressions were 36.10 for COD, 18.60 for TOC and 22.69 for turbidity; all of these were greater than the Ftabulated value of 4.10 (p < 0.05). The F-values for the lack of fit of the models were 5.49 for COD, 6.23 for TOC and 4.23 for turbidity, which were less than the Ftabulated value of 230.26 (p > 0.05). As expected, all the mathematical models fitted the experimental data well, exhibiting a significant model fit and non-significant lack of fit (Bezerra et al., 2008).
Source
Sum of squares
Degrees of freedom
Mean square
F-value
Ftabulated
P-value
Model
7686.69
9
854.08
36.10
4.10
0.0001a
pH
5337.612
1
5337.612
225.5805
0.0000a
Fe
226.375
1
226.375
9.5672
0.0213a
Oil
287.736
1
287.736
12.1604
0.0130a
pH2
475.962
1
475.962
20.1153
0.0042a
Fe2
606.931
1
606.931
25.6504
0.0023a
Oil2
1.776
1
1.776
0.0751
0.7933b
pH*Fe
765.187
1
765.187
32.3387
0.0013a
pH*Oil
54.184
1
54.184
2.2899
0.1810b
Fe*Oil
43.618
1
43.618
1.8434
0.2234b
Residual
141.97
6
23.66
–
–
Lack of fit
136.98
5
27.40
5.49
230.16
0.3127b
Pure error
4.99
1
4.99
–
–
–
Total
7828.66
15
R2 = 0.9819
R2adj = 0.9547
Source
Sum of squares
Degrees of freedom
Mean square
F-value
Ftabulated
P-value
Model
7425.14
9
825.02
18.60
4.10
0.0010a
pH
4217.29
1
4217.29
95.09
0.0001a
Fe
433.46
1
433.46
9.77
0.0204a
Oil
1074.42
1
1074.42
24.23
0.0027a
pH2
54.21
1
54.21
1.22
0.3113b
Fe2
102.50
1
102.50
2.31
0.1793b
Oil2
0.0012
1
0.0012
0.00003
0.9960b
pH*Fe
238.71
1
238.71
5.38
0.0594b
pH*Oil
972.41
1
972.41
21.93
0.0034a
Fe*Oil
221.13
1
221.13
4.99
0.0670b
Residual
266.09
6
44.35
–
Lack of fit
257.81
5
51.56
6.23
230.16
0.2947b
Pure error
8.28
1
8.28
–
Total
7691.23
15
R2 = 0.9654
R2adj = 0.9135
Source
Sum of squares
Degrees of freedom
Mean square
F-value
Ftabulated
P-value
Model
15676.71
9
1741.86
22.69
4.10
0.0005a
pH
4152.35
1
4152.35
54.09
0.0003a
Fe
0.63
1
0.63
0.01
0.9310b
Oil
8027.66
1
8027.66
104.58
0.0001a
pH2
989.60
1
989.60
12.89
0.0115a
Fe2
60.33
1
60.33
0.79
0.4094b
Oil2
1051.47
1
1051.47
13.70
0.0101a
pH*Fe
218.20
1
218.20
2.84
0.1428b
pH*Oil
1463.95
1
1463.95
19.07
0.0047a
Fe*Oil
211.15
1
211.15
2.75
0.1483b
Residual
460.56
6
76.76
–
Lack of fit
439.76
5
87.95
4.23
230.16
0.3526b
Pure error
20.80
1
20.80
–
Total
16137.27
15
R2 = 0.9715
R2adj = 0.9287
As can be seen in Fig. 7, the predicted and actual plots of the COD, TOC, and turbidity removal efficiency determined by the model equation revealed that the observed values were distributed near the straight line (Fig. 7a, 7c, and 7e) indicating that the observed values were very close to the predicted values. The residual-predicted plots (Fig. 7b, 7d, and 7f, respectively) obtained for the COD, TOC, and turbidity removal efficiency were randomly distributed around the mean, in front of the predicted values by discarding the system error (El-Ghenymy et al., 2012).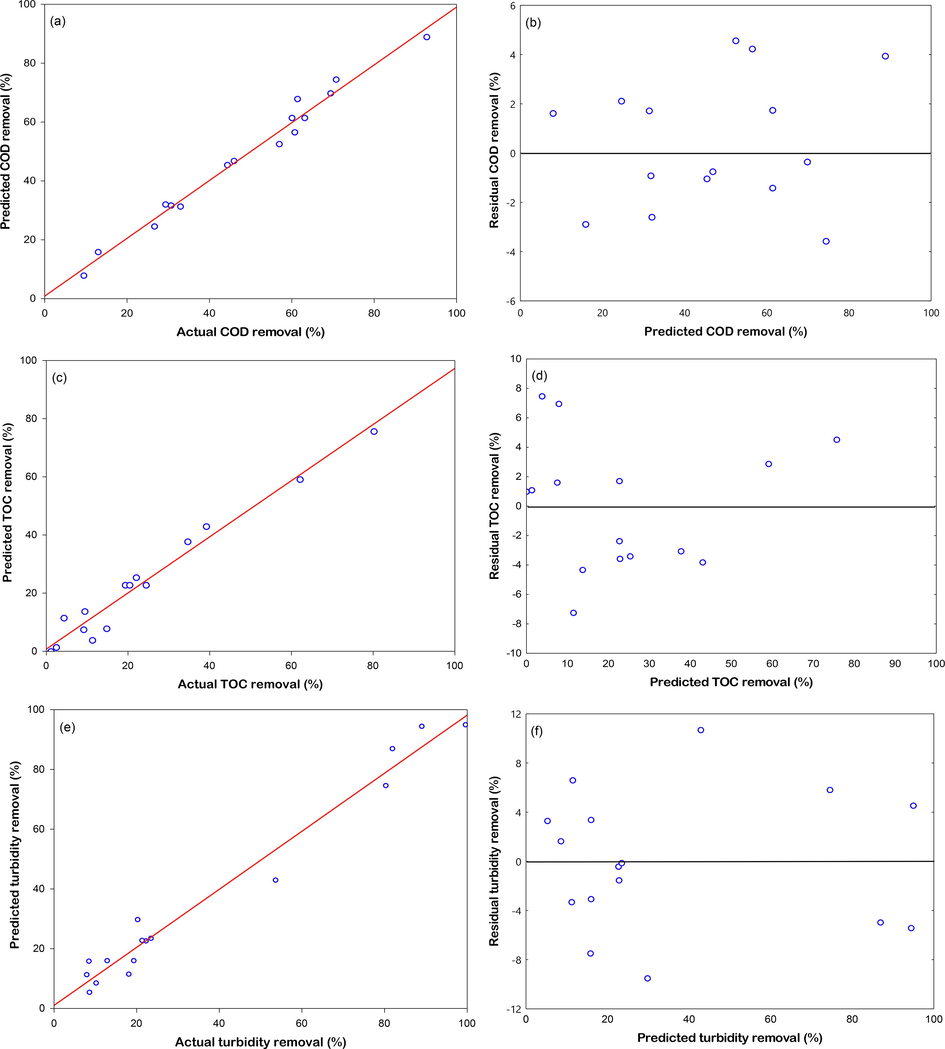
Plot of predicted and observed values for the removal efficiency of COD (a); TOC (c); turbidity (e) and plot of residual and predicted values obtained for the removal efficiency of COD (b); TOC (d); turbidity (f) of the CCRD experiment using used shot blasts in modified air-Fenton system at 45 min. Predicted values are from Eqs. (5) to (7).
The accuracy of the polynomial model was shown to be adequate with the R2 value of the models, being 0.9819, 0.9654, and 0.9715, respectively, for the response functions of the COD, TOC, and turbidity removal efficiency, whereas the adjusted R2 of the models were 0.9547, 0.9135, and 0.9287, respectively, as illustrated in Tables 6–8. The R2 and adjusted R2 values were close to 1.0, indicating a good correlation between the observed and predicted values (Barwal and Chaudhary, 2016). This demonstrates that the fitted model agreed well with the mathematical model, having accuracies of 98.19, 96.54, and 97.15% for COD, TOC, and turbidity, respectively. Table 5 compares the observed and predicted values of the COD, TOC, and turbidity removal efficiency. The maximum observed removal efficiencies were 92.82, 80.18, and 99.55% for for COD, TOC, and turbidity, respectively, whereas the predicted removal efficiencies were 88.86, 75.67, and 95.03% for COD, TOC, and turbidity, respectively.
3.3.2 Interaction effect between the influencing factors
The three-dimensional plot for the COD, TOC, and turbidity removal efficiency shows the interaction between the variables. The predicted equations for the COD (Eq. (5)), TOC (Eq. (6)), and turbidity (Eq. (7)) removal efficiencies were used to generate the respective response surface plots under optimal experimental conditions as shown in Fig. 8. An increase in the pH level resulted in a lower COD, TOC, and turbidity removal efficiency for all amounts of used shot blasts (Fig. 8a, 8b, and 8c) and all initial oil concentrations (Fig. 8d, 8e and 8f). The results indicate that increasing the initial pH from 2.0 to 5.0, initial oil concentration to 1% v/v, and amount of used shot blasts to 30 g, decreased the COD, TOC, and turbidity removal efficiencies from 88.86 to 57.16%, 75.67 to 32.48%, and 95.03 to 41.68%, respectively, compared to the removal efficiency at the initial pH value of 7.0 (only 24.56, 7.55, and 22.66% for COD, TOC, and turbidity, respectively). This means that the degradation of organic pollutants in cutting oil wastewater under acidic conditions (pH < 5.0) was more effective than that under near-neutral conditions, due to the high reactivity of ZVI; the latter could only be obtained when the initial pH of the wastewater was below 5.0 (acidic conditions) (Xiong et al., 2015). Therefore, it can be deduced that the pH has a strong influence on the redox reaction occurring at the surface of ZVI by accelerating corrosion and formation of OH (Wang et al., 2018). Similarly, at a lower pH, the production of OH occurs in commercial micro- and nanoscale ZVI in an O2 system via the Fenton reaction (Karim et al., 2017; Ghariani et al., 2019).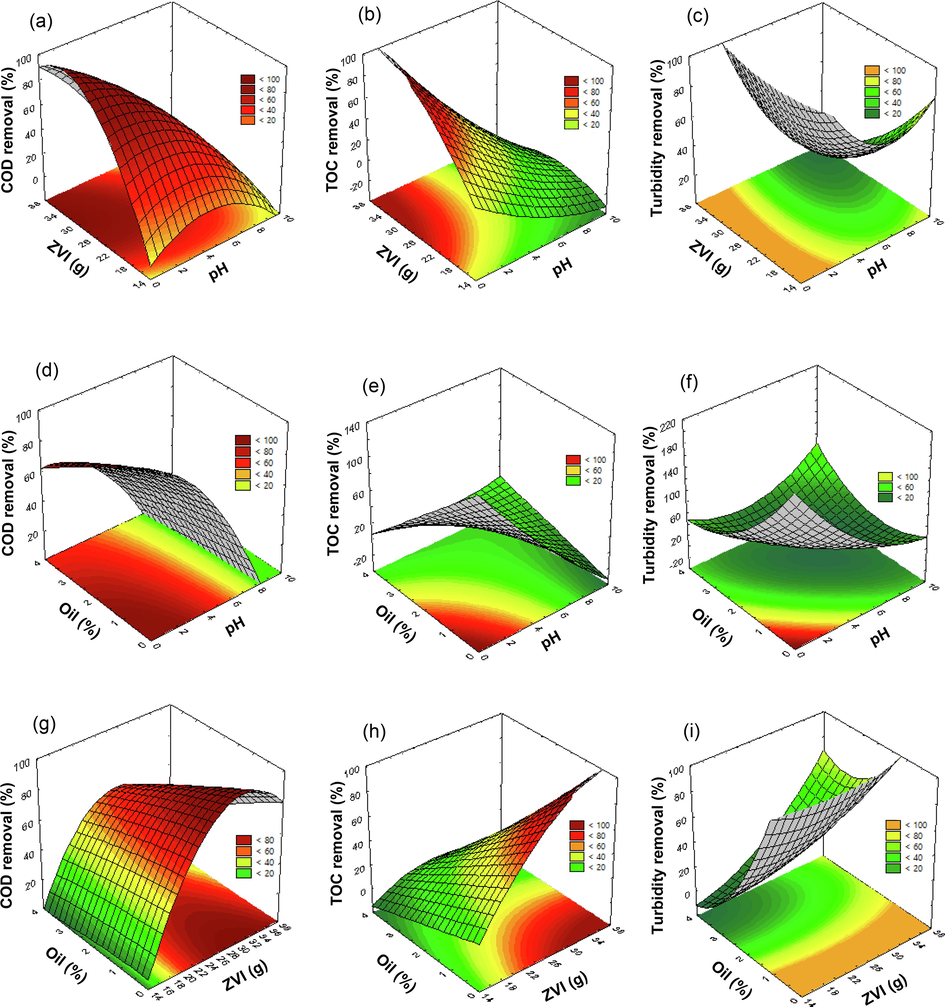
Response surfaces from the CCRD method using Eq. (5) for COD removal, Eq. (6) for TOC removal, and Eq. (7) for turbidity removal after treatment with used shot blasts under a modified air-Fenton (MAF) system for (a), (b), and (c) the combined effect of the amount of used shot blast (g) and pH; (d), (e) and (f) the combined effect of initial cutting oil concentration (%v/v) and pH; and (g), (h), and (i) the combined effect of initial cutting oil concentration (%v/v) and the amount of used shot blast (g).
As demonstrated in (Fig. 8g, 8 h, and 8i), high removal efficiencies were achieved using this treatment with a large amount of used shot blasts. Increasing the amount of shot blasts from 20 to 30 g at pH 2.0, with a cutting oil concentration of 1%, increased the COD, TOC, and turbidity removal efficiencies from 56.49 to 88.86%, 42.97 to 75.67%, and 94.43 to 95.03%, respectively. This may indicate that increasing the amount of used shot blasts could improve •OH, according to Eqs. (3) and (4) (Ghariani et al., 2019), and the total surface area and active sites favour Fenton-like reactions with increasing Fe0 dosage, which could improve pollutant removal (Yuan et al., 2016b). However, as predicted, increasing the amount of used shot blasts by more than 30 g decreased removal efficiency; for example, only 80.77% COD removal efficiency was obtained with 35 g of used shot blasts. This can be attributed to the pollutant removal efficiency becoming limited by other factors, particularly, the mass transportation rate of pollutants, intermediates, and corrosion products between the Fe0 surface and the wastewater phase, upon increment in the used shot blast amount (Yuan et al., 2016a). However, we maintain that the MAF system overall was able to enhance the obstruction owing to the sufficient air flow rate (Yuan et al., 2016a) applied in this work based on the literature.
However, the high initial oil concentrations caused a lower removal efficiency similar to the treatment at a pH value of 2.0 and 30 g of used shot blasts, with varying initial concentrations of 3 to 1% v/v; this resulted in an increase in the COD, TOC, and turbidity removal efficiencies from 69.81 to 88.86%, 25.37 to 75.67%, and 29.76 to 95.03%, respectively. Thus, the results demonstrate that the mathematical approach applied in our study improved the performance of the MAF system.
3.3.3 Degradation of pollutants in cutting oil wastewater
In the CCRD experiment, under the optimal conditions, the initial synthesised milky white cutting oil wastewater solution turned colourless during operation and clear in the top zone when it settled. As shown in Table 5 and Fig. 9, Run 3 at pH 2.0 and with 30 g of used shot blasts (0.2–0.5 mm) achieved the highest removal efficiency by degrading the 1% initial oil concentration (14,000 mg/L for COD, 5,500 mg/L for TOC, and 13,400 NTU for turbidity). To compare Runs 3 and 7, the increase in the pH from 2.0 to 7.0 resulted in a decrease in the COD, TOC, and turbidity removal efficiencies from 92.82 to 26.67%, 80.18 to 9.15%, and 99.55 to 22.22%, respectively. In addition, acidic conditions provided the desired conditions compared to the control experiment, which was run at pH 4.5. The pH of the solution increased after the completion of the reaction (Wang et al., 2010; Lee et al., 2013), at an initial to final pH of 2.0 to 2.6–4.1, initial to final pH of 4.5 to 6.0–7.6, and initial to final pH of 7.0 to 7.2–7.9 within 45 min. In this system, H2O2 could have been generated owing to the presence of oxygen and Fe0 in the acidic aqueous solution (He et al., 2013); in the presence of dissolved oxygen, Fe0 in aeration would become a novel MAF process that can be used to generate OH and mineralise non-selected pollutants. Under neutral conditions, the reactivity of Fe0 would be very low, to the extent of being almost unaffected by dissolved oxygen (Xiong et al., 2015). Hydroxl radicals are the main oxidiser at acidic pH levels, whereas an alternative oxidation (most likely Fe(IV)) is predominant at neutral pH levels. Notably, Fe(IV) is believed to be less reactive than OH and its different forms, such as oxo- and hydroxo-complexes, including those with organic and inorganic ligands (Lee, 2015).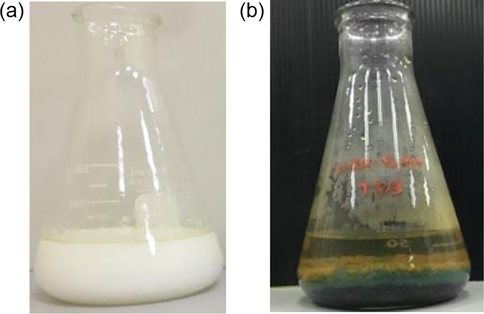
Run 3 of the CCRD experiment with used shot blasts under a modified air-Fenton system: (a) cutting oil wastewater before reaction and (b) cutting oil wastewater after stop reaction.
3.3.4 Kinetics and mechanisms for organic pollutant degradation
Under optimum conditions, the reaction kinetic fitted the pseudo-second-order kinetic reaction well, with an R2 value of 0.9987 and a pseudo-second-order decay rate constant of 0.0218 min−1. The former can be expressed as shown in Eq. (8) (Argun and Karatas, 2011):
As illustrated in Fig. 10, the pseudo-second-order kinetic plot of
versus t results in a perfect straight line. The use of used shot blasts as catalysts to treating cutting oil wastewater in the oxic system follows the same pseudo-second-order kinetics as when micro-ZVI was used in the O2 system to treat dye concentration (Ghariani et al., 2019). Although the MAF system with ZVI involved four mechanisms—reductive and oxidative degradation, precipitation, and adsorption—to remove organic pollutants (Harada et al., 2016), the main mechanism was Fenton’s reaction in the form of the corrosive oxidation of the used shot blasts. Therein, Fe2+ can be accompanied by the transfer of two electrons from the latter. As evidence of Fe2+ and H2O2 generation, proved by the 2, 9-dimethyl-1, 10-phenanthroline method (Kosaka et al., 1998), the generation of ferrous ions from the oxidation of used shot blasts was confirmed as shown in Eq. (3). Subsequently, during the production of •OH (Eq. (4)), 0.0169 M H2O2 was generated (at 45 min) under optimal conditions. The final pH was acidic, indicating that the corrosive surface of the used shot blasts in the Fenton reaction was greater than that achieved through the adsorption mechanism onto the iron oxide formed on the surface of the Fe particles under alkaline conditions (Ghariani et al., 2019). Furthermore, the used shot blast surfaces were coated with lepidocrocite that was formed by O2 in the presence of Fe0; this effect was accelerated in an acidic environment, and promoted the generation of more ferrous ions (Goswami et al., 2021). The dissolution of ZVI, that resulted in the formation of iron oxide and hydroxide on the surface layer of ZVI, can be explained by the following reactions (Harada et al., 2016):
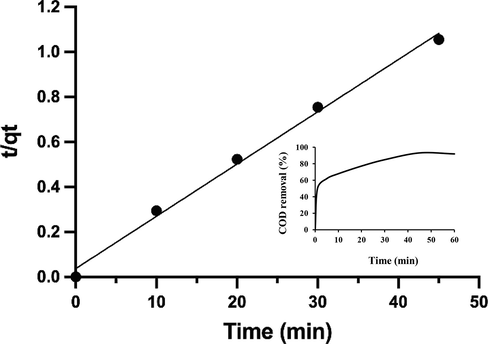
Plot of pseudo-second order kinetic at optimum condition.
After the reaction under optimum conditions, the surface of the used shot blasts was analysed using SEM, XRD, and XRF. The XRD results are shown in Fig. 11. The diffraction peaks indicated that the used shot blasts were mainly in the Fe0 state. To identify the iron species, the surface layer was analysed and found to contain Fe, SiO2, Al4.86Si1.32O9.66, and lepidocrocite (y-FeOOH). The main reactions are explained by Eq. (11) (Haruda et al., 2016). SEM analysis indicated the corrosion of the used shot blasts utilised in the MAF system, as shown in Fig. 12, and the XRF results indicated that the Fe content decreased slightly from 96.37 to 92.61%; this confirmed iron corrosion.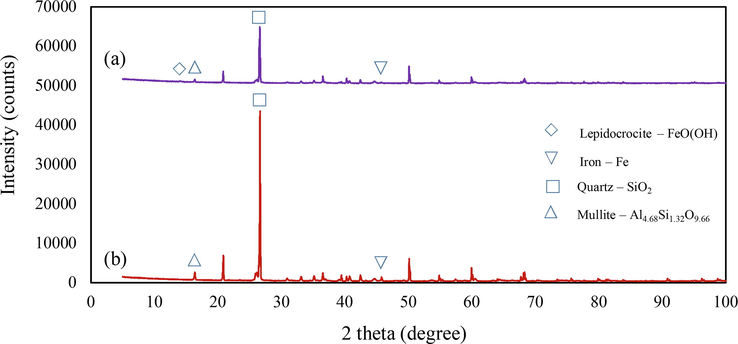
X-ray diffraction pattern of used shot blast, sized 0.2–0.5 mm (a) after reaction and (b) before reaction in at optimum conditions at 45 min.
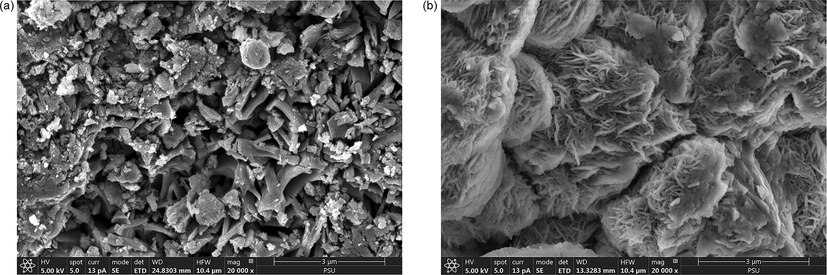
Scanning electron microscopy image of (a) used shot blast, sized 0.2–0.5 mm before treatment; 20000x and (b) used shot blast sized, 0.2–0.5 mm after treatment; 20000x.
In previous studies, iron oxides and hydroxides such as FeOOH, Fe3O4, and Fe2O3 were observed to form on the surface of ZVI in oxic aqueous solutions. However, only lepidocrocite was identified, which indicated the initial stage of dissolution of iron oxides and hydroxides; this could have decreased the reaction rate in the oxic aqueous solution. In an oxygen-rich environment, the formation of lepidocrocite was evidently the main oxidation product on the surface of nano-ZVI (Karim et al., 2017).
Due to the properties of oil wastewater, this effort to determine the recyclability of used shot blast after treatment with oil wastewater was unsuccessful. However, waste from the MAF process may be used as a substitute for cement (Reddy and Neeraja, 2018). Notably, the cost of the proposed MAF process in this study was calculated based on the cost effectiveness of the system, e.g. the costs of the pH reagents and electricity. The system cost was 0.67 USD/m3, which is lower than that of other processes used to treat cutting oil wastewater.
3.4 Comparison with treatment processes from previous works
Table 9 presents a comparison of the physiochemical effectiveness of metal working fluid wastewater as summarised from the literature. Based on the comparison, it was found that the present study demonstrates good performance of the wastewater treatment process, including high removal efficiency, and a convenient and low-cost treatment process. The removal efficiency of the proposed MAF treatment system was better than that of some of the previously undertaken treatment processes (Palaniandy et al., 2015; Demirbas and Kobya, 2017; Mirshahghassemi et al., 2017; Scaratti et al., 2018). The MAF system provides an overall convenient process without combining an excessive number of sub-processes as compared to previous works (Palaniandy et al., 2015; Su et al., 2018). Moreover, the proposed system revealed a low-cost treatment process compared to electrocoagulation (Demirbas and Kobya, 2017); therefore, this MAF system is promising as an effective alternative treatment process.
Oily water source
Pollutant (mg/L)
Treatment process
Reaction time (min)
Removal efficiency and cost
References
Petroleum wastewater
550–1600 (COD)
220–265 (TOC)Solar photo-two catalyst TiO2 and Photo-Fenton process
90
50% (COD)
62% TOCPalaniandy et al., 2015
Real MWF wastewater
17,312 ± 2812 (COD)
3155 ± 505 (TOC)Electrocoagulation (Al electrode)
25
94% (COD)
83% (TOC)
1.190 USD/m3 (Cost)Demirbas and Kobya, 2017
Fe electrode (Fe electrode)
25
90% (COD)
80% (TOC)
1.1813 USD/m3 (Cost)
Car wash wastewater
35,000 ± 500 (COD)
5800 ± 25 (TOC)Electrocoagulation
20
80.8% (COD)
Mirshahghassemi et al., 2017
Electro-Fenton
10
85.6% (COD)
Cutting Fluid
Wastewater:195,000 (COD)
Multi-stage chemical pretreatment NZVI@ACF/H2O2 system
–
(1) Primary flocculation, 79% (COD)
(2) Secondary flocculation, 85% (COD)
(3) Heterogeneous Fenton-process, 99.8% (COD)Su et al., 2018
Petrochemical wastewater
1,148 (COD)
420 (TOC)Homogeneous photo –Fenton (UV/Fe2+/H2O2)
240
30.1% (COD)
26.4% (TOC)Scaratti et al., 2018
Heterogeneous photo-Fenton (UV/goethite/H2O2)
240
90% (COD)
90% (TOC)
4 Conclusions
Used shot blasts from the automobile parts manufacturing industry were successfully applied as a catalyst in the MAF system for the degradation of organic pollutants in cutting oil wastewater. The effectiveness of this system was attributed to the in situ Fenton reaction with generated H2O2 that utilised the used shot blasts as a source of Fe (96.37 wt%) in the form of Fe0. The iron source was used as a catalyst in an oxic acidic system, thereby suggesting the possibility of sustainably using readily available, cost-effective, and environmentally friendly materials for related industrial purposes (Wang et al., 2018). Experiments using the L18 OA and CCRD (combined with RSM) designs yielded satisfactory results among seven variables: the size of used shot blasts, amount of used shot blasts, pH level, initial cutting oil concentration, air flow rate, reaction time, and mixing speed. Of these, the TM results revealed three significant variables for enhanced COD removal efficiency: pH level, amount of used shot blasts, and initial cutting oil concentration. The results of CCRD coupled with RSM indicated that used shot blasts (30 g), under optimum acidic conditions (pH 2), and an air flow rate of 5 mL/min, could achieve a removal efficiency of 92.82% for COD, 80.18% for TOC, and 99.55% for turbidity within 45 min at 1% initial cutting oil concentration. The model agreed well with the experimental data, with R2 values of 0.9819, 0.9654, and 0.9715 for COD, TOC, and turbidity removal efficiency, respectively, and the adjusted R2 of the models were 0.9547, 0.9135, and 0.9287, respectively. The reaction kinetics fitted well for the pseudo-second-order reaction, with a regression coefficient of 0.9987 and a rate constant of 0.0218 min−1. Moreover, lepidocrocite covered the surface of ZVI, and 0.0169 M H2O2 was generated in the MAF system. The proposed method has a moderate organic pollutant loading removal and is environmentally friendly since Fenton's reagent is not required. The results of this study confirm that the use of used shot blasts in the MAF system promoted the oxidation of pollutants by reactive oxygen species, primarily non-selective oxidants such as •OH, thereby making it both a low-cost treatment process (0.67 USD/m3) and a sustainable waste management option.
CRediT authorship contribution statement
Warangkana Srimoke: Investigation, Writing – original draft. Vorapot Kanokkantapong: Conceptualization, Writing – review & editing. Nuta Supakata: Resources. Wanida Limmun: Software, Validation.
Acknowledgement
The research was supported by the Center of Excellence in Hazadous Substance Management and the International Postgraduate Programs in Hazadous Substance and Environmental Management, Graduate School, Chulalongkorn University, the Royal Thai Government Science and Technology, the National Research Council of Thailand and Walailak University, Thailand.
Declaration of Competing Interest
The authors declare the following financial interests/personal relationships which may be considered as potential competing interests: Vorapot Kanokkantapong reports financial support was provided by Chulalongkorn University. Vorapot Kanokkantapong reports a relationship with National Research Council of Thailand that includes: funding grants.
References
- Solar photoelectro-Fenton degradation of paracetamol using a flow plant with a Pt/air-diffusion cell coupled with a compound parabolic collector: process optimization by response surface methodology. Appl. Catal. B. 2011;103(1–2):21-30.
- [Google Scholar]
- Treatment of industrial wastewater contaminated with recalcitrant metal working fluids by the photo-Fenton process as post-treatment for DAF. J. Ind. Eng. Chem.. 2017;45:412-420.
- [Google Scholar]
- Emerging usage of electrocoagulation technology for oil removal from wastewater: A review. Sci. Total Environ.. 2017;579:537-556.
- [Google Scholar]
- Application of Fenton process for decolorization of reactive black 5 from synthetic wastewater: Kinetics and thermodynamics. Environ. Prog. Sustain. Energy Energy.. 2011;30(4):540-548.
- [Google Scholar]
- Standard Methods for the Examination of Water and Wastewater (21st ed.). Washington, DC, USA: American Public Health Association; 2005.
- Application of response surface methodology to optimize the operational parameters for enhanced removal efficiency of organic matter and nitrogen: moving bed biofilm reactor. Environ. Sci. Pollut. Res.. 2016;23(10):9944-9955.
- [Google Scholar]
- Response surface methodology (RSM) as a tool for optimization in analytical chemistry. Talanta. 2008;76(5):965-977.
- [Google Scholar]
- Review of iron-free Fenton-like systems for activating H2O2 in advanced oxidation processes. J. Hazard. Mater.. 2014;275:121-135.
- [Google Scholar]
- Solar Photoelectro-Fenton degradation of acid Orange 7 azo dye in a solar flow plant: optimization by response surface methodology. Water Conserv. Sci. Eng.. 2016;1(1):83-94.
- [Google Scholar]
- Degradation of azo and anthraquinone dyes by a low-cost Fe0/air process. J. Hazard. Mater.. 2009;166(2–3):1127-1133.
- [Google Scholar]
- Stabilized oily-emulsion separation using Modified Induced Air Flotation (MIAF): factor analysis and mathematical modeling. Eng. J.. 2019;23(5):29-42.
- [Google Scholar]
- Treatment of oily wastewater from cold-rolling mill through coagulation and integrated membrane processes. Environ. Eng. Res.. 2018;23(2):159-163.
- [Google Scholar]
- Operating cost and treatment of metalworking fluid wastewater by chemical coagulation and electrocoagulation processes. Process Saf. Environ. Prot.. 2017;105:79-90.
- [Google Scholar]
- Electro-Fenton approach for highly efficient degradation of the herbicide 2, 4-dichlorophenoxyacetic acid from agricultural wastewater: process optimization, kinetic and mechanism. J. Mol. Liq.. 2021;334:116116.
- [Google Scholar]
- Response surface methodology approach for the optimization of tartrazine removal by heterogeneous photo-Fenton process using mesostructured Fe2O3-suppoted ZSM-5 prepared by chitin-templating. Chem. Eng. Commun.. 2018;205(4):445-455.
- [Google Scholar]
- Optimization of the electro-Fenton and solar photoelectro-Fenton treatments of sulfanilic acid solutions using a pre-pilot flow plant by response surface methodology. J. Hazard. Mater.. 2012;221:288-297.
- [Google Scholar]
- Cutting oil-water emulsion wastewater treatment by microwave assisted catalytic wet peroxide oxidation. Sep. Purif. Technol.. 2021;257:117940.
- [Google Scholar]
- Removal of Acid Orange 51 by micro zero-valent iron under different operational conditions and evaluation of toxicity. Environ. Sci. Pollut. Res.. 2019;26(18):18392-18402.
- [Google Scholar]
- Treatability of five micro-pollutants using modified Fenton reaction catalysed by zero-valent iron powder (Fe (0)) J. Environ. Chem. Eng.. 2021;9(4):105393.
- [Google Scholar]
- Investigation of the reaction pathway for degradation of emerging contaminant in water by photo-Fenton oxidation using fly ash as low-cost raw catalyst. Int J Environ Res.. 2020;14(4):427-438.
- [Google Scholar]
- Manual on catalyst characterization (Recommendations 1991) Pure Appl. Chem.. 1991;63(9):1227-1246.
- [Google Scholar]
- Treatment of cutting oil-in-water emulsion by combining flocculation and fenton oxidation. J. Chem.. 2021;2021
- [Google Scholar]
- Hydroxyl radical generation linked with iron dissolution and dissolved oxygen consumption in zero-valent iron wastewater treatment process. Chem. Eng. J.. 2016;303:611-620.
- [Google Scholar]
- Aromatic free fenton process for rapid removal of phenol from refinery wastewater in an oscillatory baffled reactor. Arab. J. Chem. 2021:103635.
- [Google Scholar]
- pH-dependent degradation of acid orange II by zero-valent iron in presence of oxygen. Sep. Purif. Technol.. 2013;117:59-68.
- [Google Scholar]
- The use of steel slags in the heterogeneous Fenton process for decreasing the chemical oxygen demand of oil refinery wastewater. Water Sci. Technol.. 2018;78(5):1159-1167.
- [Google Scholar]
- Steel Scale Waste as a Heterogeneous Fenton-like Catalyst for the Treatment of Landfill Leachate. Ind. Eng. Chem. Res.. 2021;60(31):11715-11724.
- [Google Scholar]
- Harmonisation of chemical and biological process in development of a hybrid technology for treatment of recalcitrant metalworking fluid. Bioresour. Technol.. 2011;102(19):8783-8789.
- [Google Scholar]
- Treatment of waste metalworking fluid by a hybrid ozone-biological process. J. Hazard. Mater.. 2013;244:394-402.
- [Google Scholar]
- Degradation of 17α-ethinylestradiol by nano zero valent iron under different pH and dissolved oxygen levels. Water Res.. 2017;125:32-41.
- [Google Scholar]
- A study on removal of cutting oil from wastewater by using agricultural wastes. Mater. Today:. Proc.. 2020;32:719-727.
- [Google Scholar]
- Optimization of electrocoagulation process for the treatment of metal cutting wastewaters with response surface methodology. Water Air Soil Pollut.. 2011;215(1):399-410.
- [Google Scholar]
- Comparison among the methods for hydrogen peroxide measurements to evaluate advanced oxidation processes: application of a spectrophotometric method using copper (II) ion and 2, 9-dimethyl-1, 10-phenanthroline. Environ. Sci. Technol.. 1998;32(23):3821-3824.
- [Google Scholar]
- Oxidation of organic contaminants in water by iron-induced oxygen activation: a short review. Environ. Eng. Res.. 2015;20(3):205-211.
- [Google Scholar]
- Steel dust catalysis for Fenton-like oxidation of polychlorinated dibenzo-p-dioxins. J. Hazard. Mater.. 2009;163(1):222-230.
- [Google Scholar]
- pH-Dependent reactivity of oxidants formed by iron and copper-catalyzed decomposition of hydrogen peroxide. Chemosphere. 2013;92(6):652-658.
- [Google Scholar]
- Optimization of the process variables for landfill leachate treatment using Fenton based advanced oxidation technique. Eng. Sci. Technol. Int. J.. 2021;24(2):428-435.
- [Google Scholar]
- Microfiltration of cutting-oil emulsions enhanced by electrocoagulation. Desalinat. Water Treat.. 2016;57(24):10959-10968.
- [Google Scholar]
- Optimizing electrocoagulation and electro-Fenton process for treating car wash wastewater. مجله مدیریت و مهندسی بهداشت محیط.. 2017;4(1):37-43.
- [Google Scholar]
- Removal of emerging pollutants in aqueous phase by heterogeneous Fenton and photo -Fenton with Fe2O3-TiO2-clay heterostructures. Environ. Sci. Pollut. Res.. 2020;27(31):38434-38445.
- [Google Scholar]
- Treatment of petroleum wastewater using combination of solar photo-two catalyst TiO2 and photo-Fenton process. J. Environ. Chem. Eng.. 2015;3(2):1117-1124.
- [Google Scholar]
- Optimization of ultrafiltration of cutting oil wastewater enhanced by application of twisted tapes: Response surface methodology approach. J. Clean. Prod.. 2019;231:320-330.
- [Google Scholar]
- Aluminum residue waste for possible utilisation as a material: a review. Sādhanā. 2018;43(8):1-8.
- [Google Scholar]
- Treatment of reverse osmosis (RO) concentrate by the combined Fe/Cu/air and Fenton process (1stFe/Cu/air-Fenton-2ndFe/Cu/air) J. Hazard. Mater.. 2016;302:36-44.
- [Google Scholar]
- Effect of pH on zero valent iron performance in heterogeneous fenton and fenton-like processes: A review. Molecules. 2018;23(12):3127.
- [Google Scholar]
- Comparison between Fenton and Fenton-like reactions for l-proline degradation. J. Environ. Sci. Technol.. 2019;16(3):1515-1526.
- [Google Scholar]
- Parameters affecting LED photoreactor efficiency in a heterogeneous photo-Fenton process using iron mining residue as catalyst. J. Environ. Sci. Health A.. 2019;54(13):1277-1286.
- [Google Scholar]
- Review on the synthesis and activity of iron-based catalyst in catalytic oxidation of refractory organic pollutants in wastewater. J. Clean. Prod.. 2021;321:128924.
- [Google Scholar]
- Oil by-product removal from aqueous solution using sugarcane bagasse as absorbent. Int. J. Emerg. Sci. Eng.. 2014;2(9):48-52.
- [Google Scholar]
- Residue-based iron oxide catalyst for the degradation of simulated petrochemical wastewater via heterogeneous photo-Fenton process. Environ. Technol.. 2018;39(20):2559-2567.
- [Google Scholar]
- Phenol removal using zero-valent iron powder in the presence of dissolved oxygen: roles of decomposition by the Fenton reaction and adsorption/precipitation. J. Hazard. Mater.. 2012;201:60-67.
- [Google Scholar]
- Treatment of cutting fluid waste using activated carbon fiber supported nanometer iron as a heterogeneous Fenton catalyst. Sci. Rep.. 2018;8(1):1-11.
- [Google Scholar]
- Using FeO-constituted iron slag wastes as heterogeneous catalyst for Fenton and ozonation processes to degrade Reactive Red 24 from aqueous solution. Sep. Purif. Technol.. 2019;224:431-442.
- [Google Scholar]
- Optimization of multiple parameters for treatment of coking wastewater using Fenton oxidation. Arab. J. Chem.. 2020;13(4):5084-5095.
- [Google Scholar]
- Effects of dissolved oxygen on dye removal by zero-valent iron. J. Hazard. Mater.. 2010;182(1–3):886-895.
- [Google Scholar]
- The mechanism of 2-chlorobiphenyl oxidative degradation by nanoscale zero-valent iron in the presence of dissolved oxygen. Environ. Sci. Pollut. Res.. 2018;25(3):2265-2272.
- [Google Scholar]
- Circulating purification of cutting fluid: an overview. Int. J. Adv. Manuf. Technol.. 2021;117(9):2565-2600.
- [Google Scholar]
- Comparative study on the reactivity of Fe/Cu bimetallic particles and zero valent iron (ZVI) under different conditions of N2, air or without aeration. J. Hazard. Mater.. 2015;297:261-268.
- [Google Scholar]
- A hybrid approach of Taguchi-Response surface methodology for modeling and optimization of duplex turning process. Measurement. 2017;100:131-138.
- [Google Scholar]
- Kinetic study for phenol degradation by ZVI-assisted Fenton reaction and related iron corrosion investigated by X-ray absorption spectroscopy. Chemosphere. 2016;145:409-415.
- [Google Scholar]
- Combined Fe0/air and Fenton process for the treatment of dinitrodiazophenol (DDNP) industry wastewater. Chem. Eng. J.. 2016;283:1514-1521.
- [Google Scholar]
- Treatment of ammunition wastewater by the combined Fe0/air and Fenton process (1stFe0/air-Fenton-2ndFe0/air) J. Taiwan Inst. Chem. Eng.. 2016;65:286-294.
- [Google Scholar]
- Rapid decolorization and mineralization of simulated textile wastewater in a heterogeneous Fenton like system with/without external energy. J. Hazard. Mater.. 2009;165(1–3):193-199.
- [Google Scholar]
- Mixed matrix membrane application for olive oil wastewater treatment: Process optimization based on Taguchi design method. J. Environ. Manag.. 2014;132:113-120.
- [Google Scholar]


