

Translate this page into:
Optimization and ecofriendly synthesis of iron oxide nanoparticles as potential antioxidant
⁎Corresponding author.
-
Received: ,
Accepted: ,
This article was originally published by Elsevier and was migrated to Scientific Scholar after the change of Publisher.
Peer review under responsibility of King Saud University.
Abstract
The present study involves the use of Box-Behnken design for optimization of the energy-efficient process variables, eco-friendly synthesis of nanoparticles of iron oxide using Coriandrum sativum L. (cilantro) leaf extract. The factors, which significantly influenced mean nanoparticle size, surface charge, and size distribution, were the volume of leaf extract, agitation speed, and temperature. The developed model using Box-Behnken design was validated by synthesizing the iron nanoparticles using optimized operational conditions i.e. 10 ml volume of leaf extract, 1500 rpm agitation speed and 30 °C temperature. This resulted in the formation of highly stable iron oxide nanoparticles with mean particle size 161.5 nm and polydispersity index 0.132 with a zeta potential of −19.5 mV. The free radical inhibitory activity of prepared iron oxide nanoparticles was found comparable to ascorbic acid. These results reveal that iron nanoparticles for a biomedical application can be prepared at ambient temperature in an eco-friendly manner.
Keywords
Iron oxide nanoparticles
Box-Behnken design
Antioxidants
Coriander
Green synthesis

1 Introduction
The iron oxide nanoparticles owing to their distinct physicochemical properties are one of the most important nanostructure materials in science and technology (Nielsen et al., 2018). These nanoparticles are presently employed for diverse applications; ranging from environmental remediation in earth sciences to biomedicine in life sciences. Iron oxide nanoparticles have many biomedical uses including the treatment of illness and the drug delivery systems. Disease diagnosis includes applications in MRI (Zhu et al., 2015) and immunoassays; whereas the applications in the drug delivery systems (Tudisco et al., 2015; Majeed et al., 2013) includes hyperthermia (Dorniani et al., 2012), tissue repair and detoxification (Blanco-Andujar et al., 2015). Due to immense importance in the biomedical industry, there is an unmet requirement to develop the iron oxide nanoparticle. Several physicochemical methods like co-precipitation, thermal and electrochemical decomposition, the sonochemical, hydrothermal, microemulsion has used for the synthesis of iron oxide nanoparticles. All these multi-step methods suffer from several limitations like poor control on the size of a particle, requirement of expensive equipment, high temperature, pressure, and energy-intensive processes; which ultimately increase the cost of manufacturing. Furthermore, these iron oxide nanoparticles have to be coated with suitable agents to prevent their agglomeration. Hence, green synthesis becomes the method of choice for the preparation of iron oxide nanoparticles due to easy processing, low economic constraints and high efficiency. Further, there is no requirement for high temperature and pressure and thus minimal energy and cost; requiring a single step synthetic process (Kim et al., 2010). The bio-reductant present in the plant extract serves the dual purpose of reducing agent in synthesis and stabilizing agent in preventing agglomeration (Hoag et al., 2009). These bio reductants are phytochemicals such as amino acids, carbohydrates, flavonoids, and polyphenols (Njagi et al., 2010). Several studies have reported the synthesis of iron oxide nanoparticles using plant extract but none based on optimizing the reaction conditions for iron oxide nanoparticles preparation (Nadagouda et al., 2010).
Coriander (Coriandrum sativum L.) is one of the oldest herbs used in the Umbelliferae (Apiaceae) family for more than 3000 years (Ebers papyrus, 1550 BCE), both for medicinal and culinary purposes. (Ishikawa et al., 2003). Due to its attractive green color and fragrance, the green leaves are used as fresh herbs, in salads and sauces (Kamat et al., 2003). The coriander leaves are a rich source of natural antioxidants like kaempherol (3.49 ± 0.40%), p-Coumaric acid (4.39 ± 0.55%) 4′-O mequercetin quercetin (5.62 ± 0.66%), 3′-O-mesquercetin (9.19 ± 0.24%), acacetin (3.91 ± 0.45%), trans-ferulic acid (11.07 ± 0.66%) and vanillic acid (7.51 ± 0.55%) (Nambiar et al., 2010). The present study involves the preparation of iron oxide nanoparticles from the aqueous extract of Coriandrum sativum leaf and understanding the influence of reaction conditions like the volume of leaf extracts (10%w/v), agitation speed, and temperature. The minimum concentration of plant extracts required for the synthesis of iron oxide nanoparticles was selected based on FTIR of prepared iron oxide nanoparticles. A combination of mathematical and statistical methods, Box-Behnken design was applied to determine optimal experimental conditions for reproducible synthesis of monodisperse iron oxide nanoparticles from Coriandrum sativum leaf extract. Iron oxide nanoparticles thus prepared using the coriander leaf extract can be used as a potential antioxidant, antimicrobial and anticancer agent (Rodger et al., 2015).
2 Materials and methods
Ferrous sulfate heptahydrate, AR was purchased from Himedia Pvt Laboratories (Mumbai, India). The coriandrum sativum L. An annual herb belonging to the family Apiaceae (Umbelliferae) commonly known as coriander. For further research, fresh coriander leaves were collected from the local market (January-March 2019).
2.1 Preparation of coriander leaf extract
Fresh leaves from Coriandrum sativum L. (cilantro) have been collected and washed with deionized water. The aqueous leaf extract was prepared by taking in a 250 ml beaker with 100 ml of deionized water and 10 gm of coriander leaves was cut into small parts. The solution was boiled in the water-bath at 30 °C for 15 min and plant leaf extract then was cooled and filtered with Whatman No.1 filter paper and stored at 5 °C in a clean sealed flask for further studies.
2.2 Biosynthesis of iron oxide nanoparticles
Nanoparticles of iron oxide have been prepared by adding coriander leaf extract dropwise to 0.01 mM FeSO4 in a 100 ml conical flask with constant agitation speed at 1500 rpm. The immediate presence of black colour suggested a reduction of Fe+2 ions to zero-valent iron (Fig. 1). A magnetic stirrer was used to agitate the reaction mixture at 30 °C for 15 min (Hariani et al., 2013). The prepared iron oxide nanoparticles were then separated at 15,000 rpm for 20 min by centrifugation. The pellet was washed with triple distilled water and purified by repeated centrifugation. The iron oxide nanoparticles were freeze-dried for 24 h at −78 °C with a pressure of 10 Pa. The reduction of Fe+2 to zero-valent iron was confirmed by the measurement of the UV spectra in the 200–800 nm range.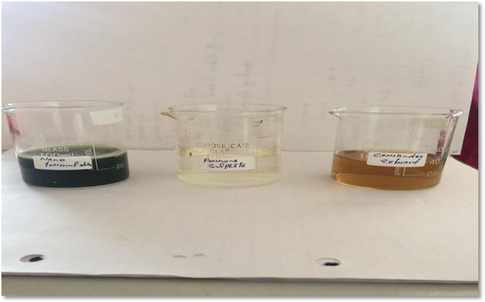
(a) Synthesized iron oxide nanoparticles (b) 0. 01 M ferrous sulphate and (c) Coriander leaf extract.
2.3 In-vitro antioxidant activity
The iron oxide nanoparticles the antioxidant study was conducted using the free radical assay 1,1–diphenyl-2-picrylhydrazyl radicals (DPPH), as defined in (Blois, 1958). Different concentrations of iron oxide nanoparticles (50, 100, 150, 200 and 250 μg / ml) were mixed with 2 ml of freshly prepared DPPH solution (1 mM in ethanol) and mixed thoroughly. The resulting solution was then incubated for 30 min in a dark place at 25 °C. The absorbance was taken at 517 nm using UV–visible spectrophotometer using ethanolic ascorbic acid as a reference standard. DPPH (all reagent except sample) was used as a control solution, and ethanol was used as a blank. The DPPH free radical scavenging activity expressed as the percentage of inhibition, which was calculated using the following formula:
2.4 Statistical optimization using design of experiments (DoE)
Box Behnken Design using Design Expert statistical software (version 11.0) were designed to optimize the process parameters used during the synthesis of iron oxide nanoparticles. According to the DoE, the 3-factor 3-level Box Behnken design generated 17 experimental runs containing three independent variable and corresponding responses. The concentration of leaf extract (X1), agitation speed (X2) and temperature (X3) were selected as independent variables and particle size (Y1), zeta potential (Y2) and PDI (Y3) were taken as evaluative responses. Statistical and diagnostic tests were they carried out to determine the adequate mathematical model for analysis using multi regression statistical analysis (MRSA). To demonstrate the interaction between independent and dependent variables, perturbation design and 3-D surface designs were plotted. Analysis of Variance (ANOVA) and polynomial equations were performed for evaluation of significance level of a mathematical model.
2.5 Characterization of synthesized iron oxide nanoparticles
2.5.1 Fourier transformed infrared spectroscopy (FT-IR)
The chemical interactions of test samples were carried out in Fourier Transform Infrared Spectrophotometer (FTIR) (Bruker, Germany). The synthesized plant-extract iron oxide nanoparticles were mixed with potassium bromide (KBr) pellets. For each measurement, approximately 32 running scans were collected with a resolution of 4 cm−1 at a finger print range of 4000–500 cm−1 (Das et al., 2014).
2.5.2 Energy dispersive X-Ray spectroscopy (EDXS)
The study of the energy-dispersive X-ray spectroscopy (EDXS) was performed in well-calibrated EDXS instrument (Bruker, Germany) fitted working at a 200 kV acceleration voltage. The solid samples were prepared by drying a drop of the diluted distribution of the iron oxide nanoparticles on a clear carbon film in a copper grid (Prasad et al., 2014).
2.5.3 Field emission-scanning electron microscopy (FE-SEM)
The study of Field Emission-Scanning Electron Microscope carried out using Hitachi S-4800 (Tokyo, Japan). The conditions used were: extra high voltage 0.5–30 kV, working distance 7000 um, (Zhuang et al., 2014) secondary electrons display mode, high vacuum, and room temperature (25 °C).
2.5.4 Dynamic light scattering (DLS) studies
The particle size of the different formulations was calculated by the Malvern particle size analyzer (Malvern, UK), using the DLS phenomenon theory. Aliquots were prepared by dissolving 10 mg of iron oxide nanoparticles into 10 ml of deionized water. Further dilutions were executed at 1:100 v/v fold and mean particle size was determined at a scattering angle of −173° at backscattering mode (Turakhia et al., 2018).
2.5.5 Zeta potential and electrophoretic studies
The Zeta potential of developed formulations was determined using Malvern Zeta sizer (Malvern, UK). The samples were diluted in 1:100 v/v fold and were put in transparent (10 × 10 mm) disposable cuvettes. The samples were tested for zeta potential by running the samples at 10 zeta runs in a backscattering mode and at a temperature of 25 °C (Turakhia et al., 2017).
3 Results and discussion
3.1 Design of experiments (DoE)
The entire design summary containing observations gathered from dependent and independent variables are showing in Table 1.
Run
X
1X
2X
3Response
1Response
2Response
3
plant Leaf extract (ml)
Agitation speed (RPM)
Temperature (0C)
Particle Size (nm)
Zeta Potential (mV)
PDI
1
30.00
1500.00
30.00
654 ± 2.05
−7.83 ± 2.94
0.273 ± 1.45
2
50.00
1000.00
45.00
987 ± 2.45
−6.56 ± 3.15
0.394 ± 1.09
3
10.00
1500.00
45.00
142 ± 2.67
−20.65 ± 1.34
0.095 ± 1.25
4
50.00
1250.00
65.00
783 ± 2.12
−9.13 ± 1.67
0.352 ± 1.19
5
30.00
1250.00
45.00
655 ± 1.89
−5.33 ± 1.86
0.262 ± 1.16
6
50.00
1250.00
30.00
854 ± 1.67
−4.37 ± 2.45
0.473 ± 1.02
7
30.00
1250.00
45.00
765 ± 1.98
−8.24 ± 2.67
0.357 ± 1.02
8
30.00
1250.00
45.00
728 ± 1.93
−9.89 ± 2.74
0.314 ± 0.98
9
30.00
1000.00
60.00
742 ± 2.12
−5.67 ± 2.56
0.352 ± 1.12
10
10.00
1250.00
30.00
161 ± 2.
−18.65 ± 2.89
0.152 ± 1.26
11
30.00
1250.00
45.00
663 ± 2.76
−6.93 ± 2.95
0.253 ± 1.12
12
10.00
1000.00
45.00
195 ± 2.84
−1638 ± 3.10
0.131 ± 1.31
13
10.00
1250.00
60.00
173 ± 2.89
−16.97 ± 3.56
0.121 ± 1.08
14
30.00
1500.00
60.00
535 ± 2.76
−7.64 ± 3.26
0.273 ± 1.14
15
30.00
1000.00
30.00
547 ± 2.67
−9.87 ± 3.03
0.168 ± 1.76
16
50.00
1500.00
45.00
954. ± 3.18
−7.56 ± 3.41
0.431 ± 1.17
17
50.00
1250.00
45.00
663 ± 2.18
−6.93 ± 3.41
0.253 ± 1.13
Statistical process optimization of the development of iron oxide nanoparticles were obtained from Surface Response Methodology (RSM). Our objectives of RSM was to identify the maximum prominent interactions between important parameters to generate the minimum sized iron oxide nanoparticles with optimum uniformity and stability. From these investigations of particle size (Y1), zeta potential (Y2) and PDI (Y3) were found to lie in the range of 161.5 nm, −19.5 mV and 0.132 respectively. The selection of the mathematical model was based on several statistical parameters in Design-Expert Software. The uniformity in sequential p-value and lack of fit p values at 99% confidence intervals (p < 0.001) indicated the statistical significance and adequacy of the model terms. The adjusted and predicted R2 values of all the response showed an equal correlation of >0.997 suggesting the satisfactory quality of statistical analysis (Table 2). For analysis of interaction effects, the polynomial analysis says that positive values are synergistic outcome on the response and the negative values represent an antagonistic outcome on the response (Sood and Chopra, 2018). After statistical evaluation of responses, the Linear and Quadratic model were selected for Y1, Y2 and Y3 respectively. The polynomial equations in terms of coded factors are depicted in (2), (3) and (4).
Responses
Model
C.V%
p-value
PRESS
R-squared
Adjusted R-squared
Predicted R-squared
Adequate precision
Particle Size
Quadratic
9.61
<0.0001
2.331E+05
0.9807
0.9559
0.8068
19.1025
Zeta Potential
Quadratic
17.97
0.0013
188.02
0.9445
0.8731
0.5305
10.7398
PDI
Liner
19.36
<0.0001
0.0673
0.8195
0.7778
0.6676
11.5012
The significance and appropriateness of the model were tested using Fischer statistical analysis through ANOVA, as illustrated in Tables 3–5. The surface plots of 3D responses reflect the interaction between variables and describe each parameter's optimal condition for the development of desired iron oxide nanoparticles, as illustrated in Figs. 2–4. The average effect of the variables showed that that X1 (10–50 ml) increased the particle size of iron oxide nanoparticles, while X2 (1000–1500 rpm) decreased iron nano size.
Source
Sum of squares
D.F
Mean
F
P-Value
Square
Value
Prob > F
Model
1.183E+06
9
1.315E+05
39.56
<0.0001
Significance
X1
1.056E+06
1
1.056E+06
317.84
<0.0001
X2
4324.50
1
4324.50
1.30
0.2915
X3
36.13
1
36.13
0.0109
0.9199
X1X2
100.00
1
100.00
0.0301
0.8672
X1X3
1722.25
1
1722.25
0.5182
0.4949
X2X3
24649.00
1
24649.00
7.42
0.0296
X12
66872.84
1
66872.84
20.12
0.0028
X22
2.21
1
2.21
0.0007
0.9801
X32
24336.00
1
24336.00
7.32
0.0304
Residual
23264.55
7
3323.51
Lack of fit
13627.75
3
4542.58
1.89
0.2731
Non-significance
Pure error
9636.80
4
2409.20
Cor total
1.207E+06
16
Source
Sum of Squares
D.F
Mean
F
P-Value
Square
Value
Prob > F
Model
378.24
9
42.03
13.23
0.0013
Significance
X1
253.46
1
253.46
79.81
<0.0001
X2
3.38
1
3.38
1.06
0.3365
X3
0.2145
1
0.2145
0.0675
0.8024
X1X2
2.67
1
2.67
0.8418
0.3894
X1X3
10.37
1
10.37
3.26
0.1137
X2X3
4.02
1
4.02
1.27
0.2976
X12
102.15
1
102.15
32.17
0.0008
X22
0.6670
1
0.0070
0.2100
0.6606
X32
0.0505
1
0.0505
0.0159
0.9032
Residual
22.23
7
3.18
Lack of fit
10.62
3
3.54
1.22
0.4113
Non-significance
Pure error
11.61
4
2.90
Cor total
400.47
16
Source
Sum of squares
D.F
Mean
F
P-Value
Square
Value
Prob > F
Model
0.1658
3
0.0553
19.67
<0.0001
Significance
X1
0.1656
1
0.1656
58.93
<0.0001
X2
0.0001
1
0.0001
0.0324
0.8599
X3
0.0001
1
0.0001
0.0455
0.8343
Residual
0.0365
13
0.0028
Lack to fit
0.0280
9
0.0031
1.45
0.3823
Non-Significance
Pure Error
0.0086
4
0.0021
Cor Total
0.2024
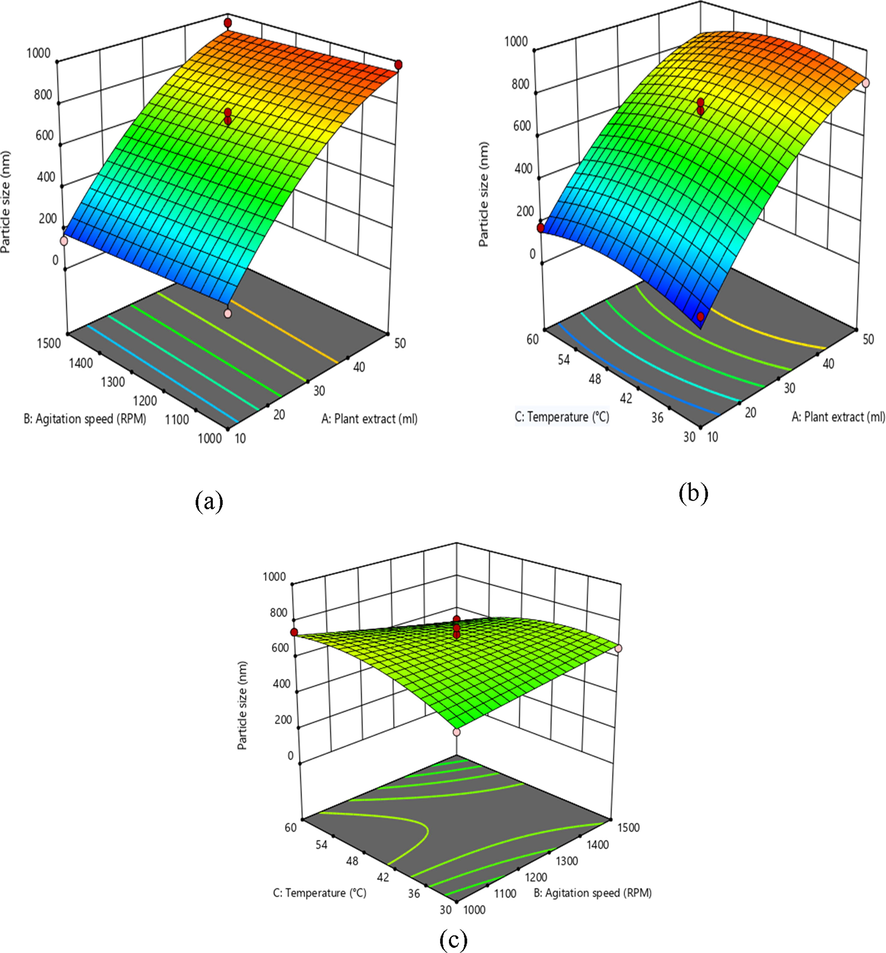
3D response surface graph showing the effect on independent variables on mean particle size.
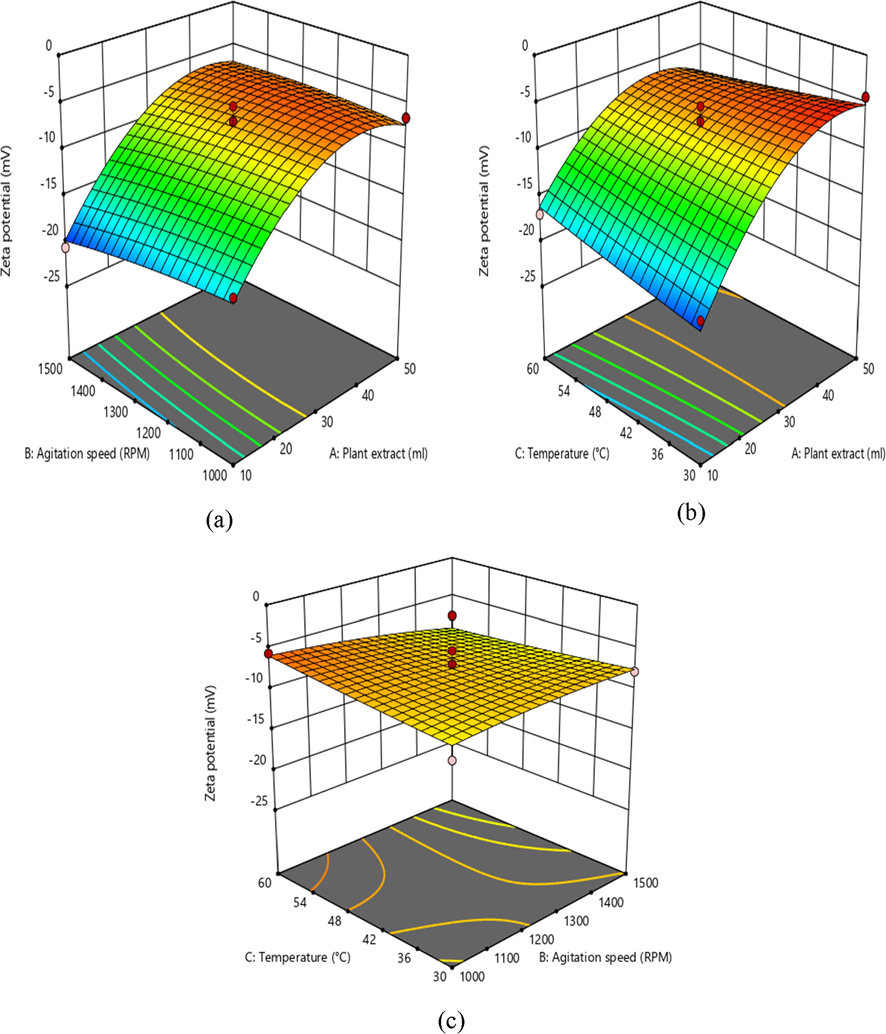
3D response surface graph showing the effect on independent variables on zeta potential.
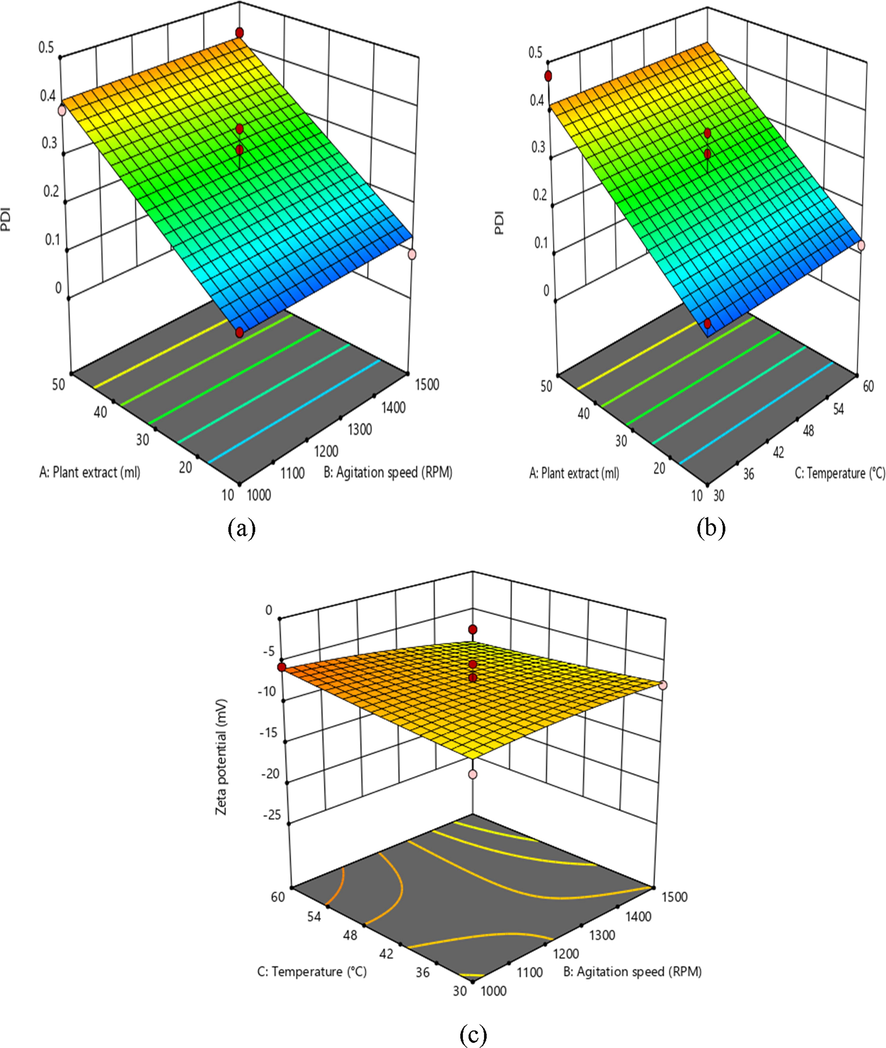
3D response surface graph showing the effect on independent variables on PDI.
In addition, the decrease in X1 extract leads to the rise in zeta potential, with the minimum PDI, which is a measure of the homogeneity in solution particles. Furthermore, the perturbation plot in Fig. 5 also clearly shows correlations between the variables.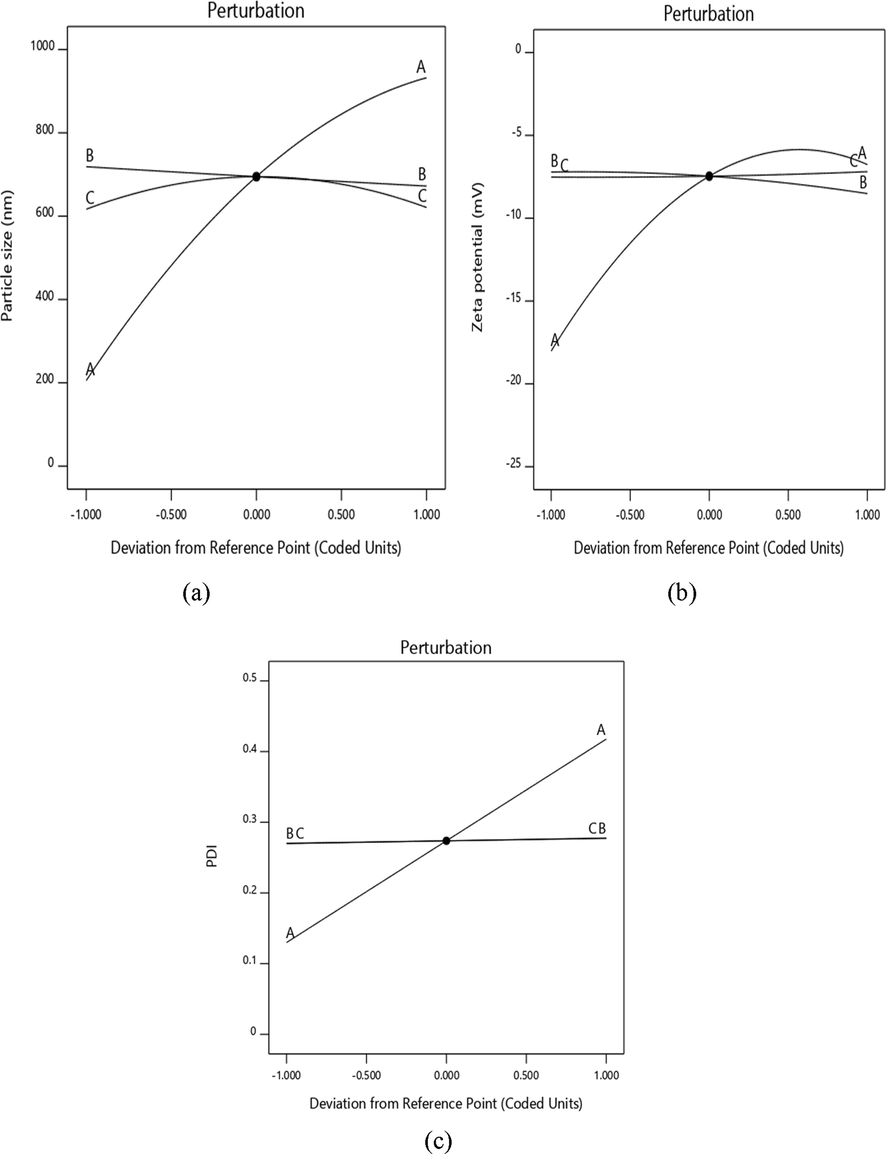
Perturbation plot of showing the effect of (a) particle size (nm) (b) zeta potential (mV) (c) PDI.
3.2 Validation of data by numerical optimization
Innovative research was shown in accordance with suggested parameters to validate the optimization, which combines all the responses in one measurement also offers a view of predicting the optimal degree of independent variables, based on the correlation plots and approach to desirability as seen in Fig. 6. The prepared formulations were evaluated and the data were found to fit well with the predicted model values with <5% error as shown in Table 6. However, the optimized batch having minimum particle size of 157.3 nm has a minimum PDI of 0.129 and highest zeta potential of −20.5 mV was selected. The optimal desirability approach was respectively predicted by solving the model at the optimum agitation speed of 1500 rpm, temperature 300 °C and plant leaf extract of 10 ml. For further studies, thus optimized formulation was selected with optimum desirability. Therefore, to carry out further experiments, the optimized concentration of iron oxide nanoparticles was lyophilized.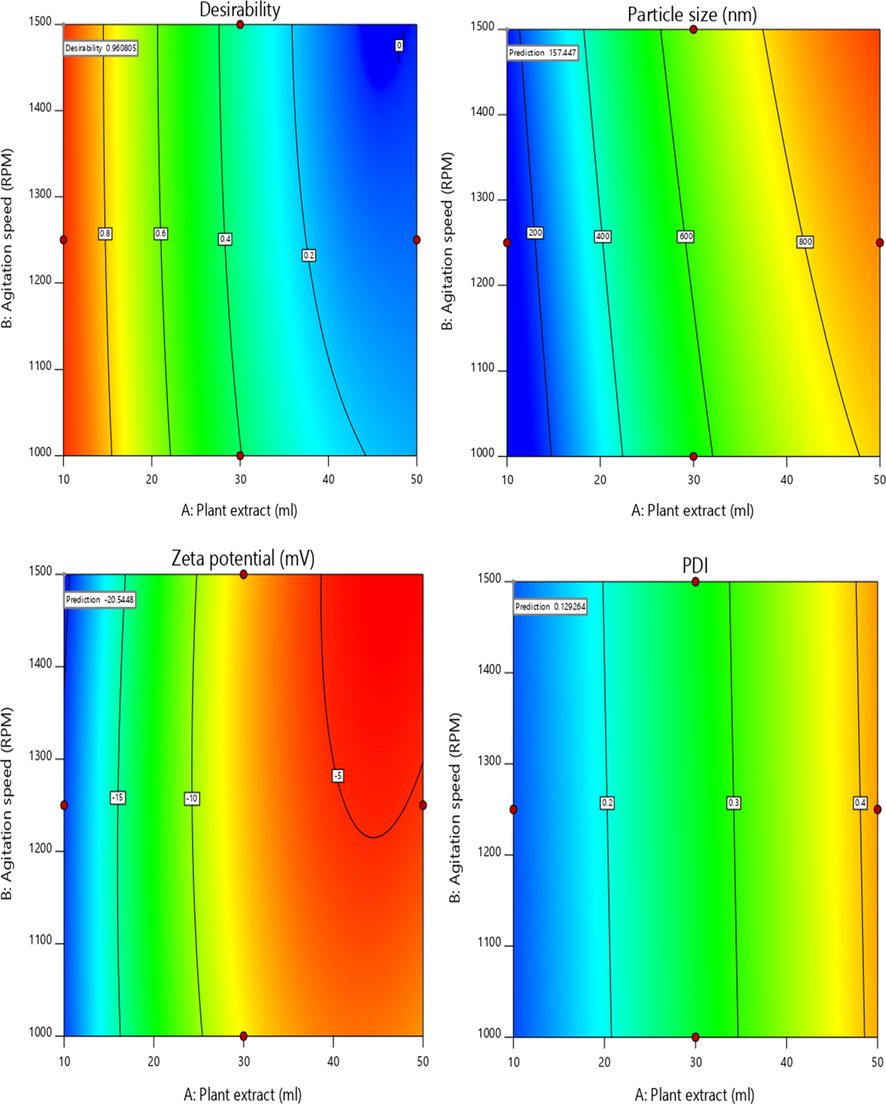
Contour plots representing desirability of optimized formulation.
Formulations
A
B
C
Plant leaf extract, Agitation speed
10.00
13.00
17.00
Temperature
1499
1250
1000
30.00
30.00
30.00
Particle Size
Predicted
157.3
246.2
350.2
Observed
161.5
256.4
361.3
%Variation
2.60%
3.97%
3.07%
Zeta Potential
Predicted
−20.5
−17.4
−12.8
Observed
−19.5
−18.1
−14.3
%Variation
4.87%
3.8%
10.4%
PDI
Predicted
0.129
0.13
0. 21
Observed
0.132
0.14
0.22
%Variation
2.27%
7.14%
4.54%
Desirability
0.960
0.936
0.983
3.3 Determination of antioxidant capacity
3.3.1 2, 2-diphenyl-1-picrylhydrazyl (DPPH) activity
The free radical inhibitory activity of different concentrations of iron oxide nanoparticles (50–250 µg) on DPPH ranged from 32.54 to 84.28%, whereas ascorbic acid ranged from 28.25 to 81.41. The findings showed stronger antioxidant ability compared to DPPH radical scavenging activity with standardized ascorbic acid. The IC50 value of iron oxide nanoparticles on DPPH radical was obtained were as 86.68 µg/ml, which was compared with standard ascorbic acid (IC50 = 107 µg/ml). Some studies reported DPPH radical reduce the hydrogen donating ability of phenolics and flavonoids (Fig. 7).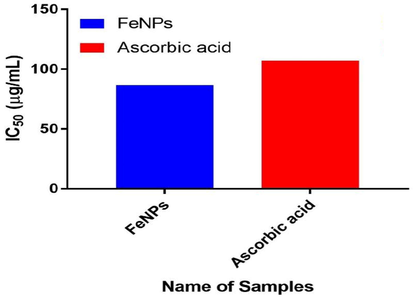
Determination of IC50 of iron oxide nanoparticles and standard ascorbic acid.
3.4 Ultraviolet–visible analysis
UV–visible Spectroscopy is an analytical technique, which concerned the measurement of electromagnetic radiation absorption (Mulvaney, 1996). UV–visible spectral analysis was initiated at a wavelength of 200–800 nm to study the absorption spectrum of green synthesized iron oxide nanoparticles and absorption peaks were observed in 210–330 nm regions because of surface excitation Plasmon vibrations in iron oxide nanoparticles. (Fig. 8).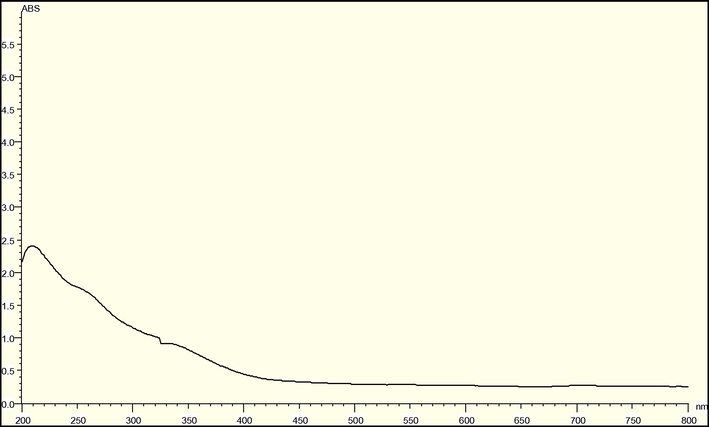
UV–visible spectroscopy of iron oxide nanoparticles.
3.5 Particle size and PDI analysis
Mean particle size is a significant parameter for preconcentration nanoformulations, as the particle of the nanoscale favours increased product absorption and dissolution. The mean particle size of the iron oxide nanoparticles was 161.5 nm due to the increased interfacial surface area. The Polydispersity Index (PDI) has also used to attain information on the size distribution and homogeneity of nanoformulations (Fig. 9a).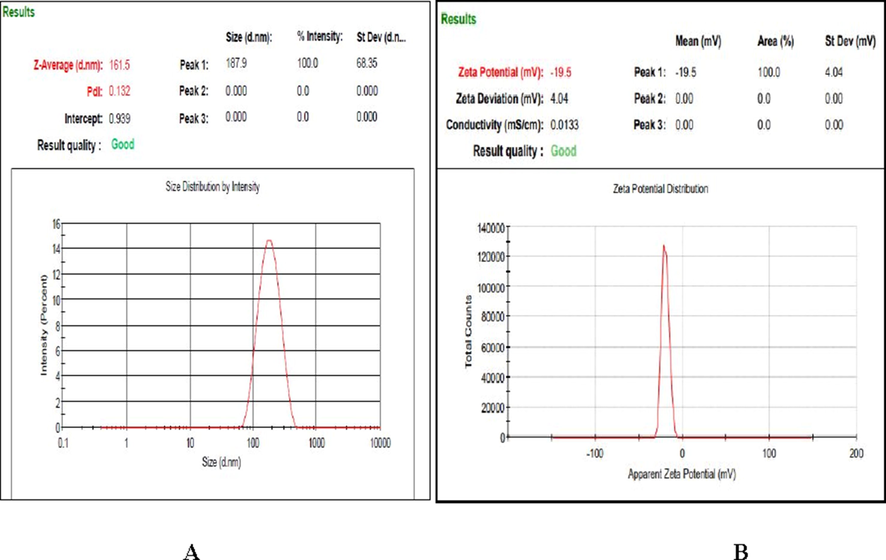
(a) Mean particle size and (b) Zeta potential of optimized iron oxide nanoparticles.
3.6 Zeta potential analysis
Zeta potential provides information on nanoformulations stability, and the negative value suggests a decreased particle aggregation in the continuous phase (Shi et al., 2012). The possible zeta potential value was found to be −19.5 mV, which indicate moderately stable of the nanoparticles (Fig. 9b) (Bhattacharjee, 2016). The negative value of iron oxide nanoparticles corroborates conjugation of polyphenolic compounds kaempherol, 4′- O mequercetin quercetin, 3′- O-mesquercetin, acacetin, vanillic acid and trans-ferulic acid on to the surface of iron oxide nanoparticles (Igwe and Nwamezie, 2018).
3.7 Fourier transformed spectroscopy
FTIR spectra of biosynthesized iron oxide nanoparticles were reported to find the capping and successful stabilization of nanoparticles by biomolecules in coriander leaf extract (Wang et al. 2014). Fig. 10 showed the FTIR spectrum of synthesized iron oxide nanoparticles with coriander leaf extract. The strong band near 3168 cm−1 indicate the presence of aromatic CH stretching and broad-band at 3200–3600 cm−1 indicate OH stretching which may due to presence of the phenolic compound. Hence, the coating of iron oxide nanoparticles with coriander extract can be inferred from this data (Mahdavi et al., 2013). This is in correlation with the presence of phenolic compounds in coriander extract.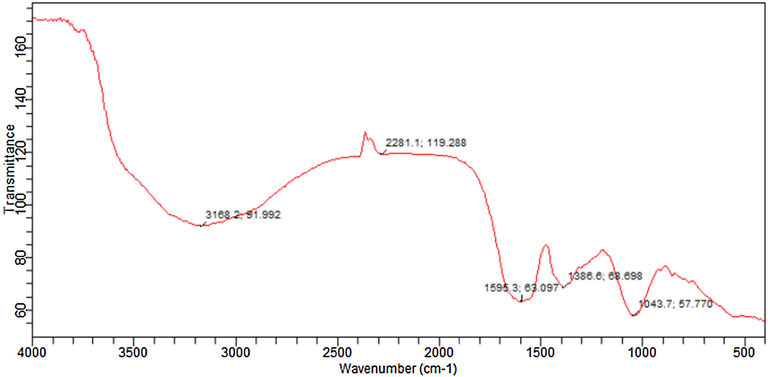
FTIR spectra of optimized iron oxide nanoparticles.
3.8 EDXS analysis
The study of iron oxide nanoparticles by Energy Dispersive X-ray Spectroscopic (EDXS) is shown in Fig. 11, and their elemental compositions are outlined in Table 7. The presence of an extreme peak of Fe, which confirms iron oxide nanoparticles formation. The oxygen signals must originate from FeSO4 and coriander extract precursors respectively, Used in iron oxide nanoparticles synthesis (Shahwan et al., 2011). The Carbon peaks appear because of the use of carbon film during EDXS measurement. Each value stands for the mean of three experiments ± S.E.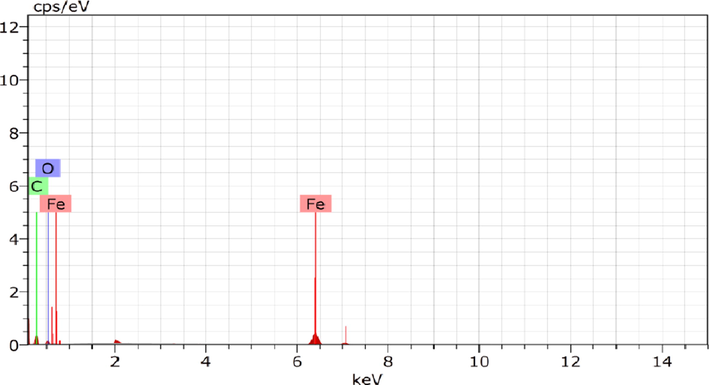
Energy-dispersive spectrometry of optimized iron oxide nanoparticles.
Iron oxide nanoparticles
Elements
Weight%
Atomic%
Iron
67.07 ± 0.03
31.40 ± 0.21
Carbon
27.24 ± 0.05
69.30 ± 1.07
Oxygen
5.79 ± 0.24
9.29 ± 1.35
3.9 FE-SEM analysis
The FE-SEM images of synthesized lyophilized iron oxide nanoparticles in the current research are showing with different magnification scale 20,000× and 15,000× in Fig. 12. The biosynthesized nanoparticles were spherical in shape with polydispersity (Gupta and Gupta, 2005). These results show that the significance of coriander leaf extract in the synthesis of iron oxide nanoparticles but the synthesized of nanoparticles show some agglomeration that was indicated by spherical shape and non-uniform particles size with the different void spaces.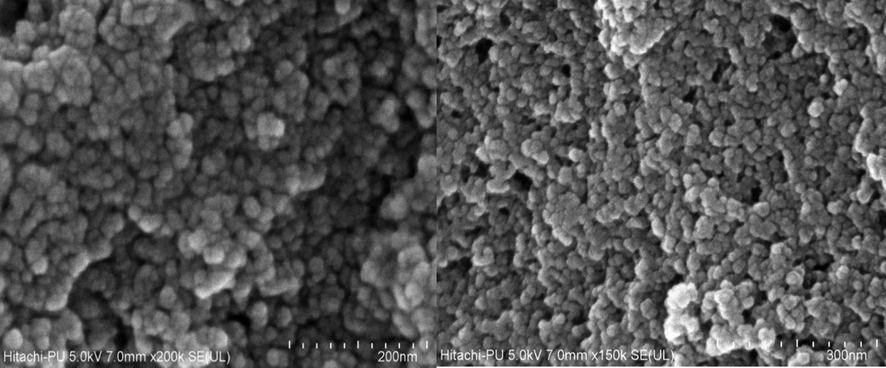
Field emission-scanning electron microscope images of iron oxide nanoparticles.
4 Conclusion
Iron oxide nanoparticles were efficiently prepared using Coriandrum sativum L. (cilantro) leaf extract. The optimization design predicted the values of mean particle size of iron oxide nanoparticles as157.3 nm, polydispersity index as 0.129 and zeta potential as −20.5 mV. The optimized batch of iron oxide nanoparticles thus prepared exhibited mean particle size of iron oxide nanoparticles as 161.5 nm, polydispersity index as 0.132 and zeta potential as −19.5 mV. The volume of plant extract (10% w/v) highly influenced the mean particle size of iron oxide nanoparticles. The iron oxide nanoparticles thus produced were monodisperse with a very high value of zeta potential, indicating maximum repulsion and minimum agglomeration between prepared iron oxide nanoparticles. Thus, biological synthesis of the iron oxide nanoparticles is one of the most suitable, reproducible methods where particle size, surface charge, surface functionalization can be easily controlled for their potential biomedical use as an antimicrobial, antioxidant and anticancer agent.
Acknowledgement
We are grateful to the Department of Pharmaceutical Sciences and Drug Research, Punjabi University, Patiala, Punjab.
Declaration of Competing Interest
The authors have no known conflicts of interest associated with this article.
References
- DLS and zeta potential – what they are and what they are not? J. Control Release. 2016;235:337-351.
- [Google Scholar]
- High performance multi-core iron oxide nanoparticles for magnetic hyperthermia: Microwave synthesis, and the role of core-to-core interactions. Nanoscale. 2015;7:1768-1775.
- [Google Scholar]
- Antioxidant determinations by the use of a stable free radical. Nature. 1958;181:1199-1200.
- [Google Scholar]
- Datura inoxia leaf extract mediated one step green synthesis and characterization of magnetite (Fe3O4) nanoparticles. Res. Rev. J. Pharm. Anal.. 2014;2:21-24.
- [Google Scholar]
- Preparation of fe3o4 magnetic nanoparticles coated with gallic acid for drug delivery. Int. J. Nanomed.. 2012;7:5745-5756.
- [Google Scholar]
- Synthesis and surface engineering of iron oxide nanoparticles for biomedical application. Biomaterials. 2005;26:3995-4021.
- [Google Scholar]
- Synthesis and properties of Fe3O4 nanoparticles by Co-precipitation method to removal procion dye. Int. J. Environ. Sci.. 2013;4:336-340.
- [Google Scholar]
- Degradation of bromothymol blue by 'greener' nano-scale zero-valent iron synthesized using tea polyphenols. J. Mater. Chem.. 2009;45:8671-8677.
- [Google Scholar]
- Green synthesis of iron nanoparticles using flower extract of Piliostigma thonningii and antibacterial activity evaluation. Chem. Int.. 2018;4:60-66.
- [Google Scholar]
- Potential application of low dose gamma irradiation to improve the microbiological safety of fresh coriander leaves. Food. Cont.. 2003;14:529-537.
- [Google Scholar]
- Antioxidant and antiproliferative activities of mango (Mangifera indica L.) flesh and peel. Food. Chem.. 2010;121:429-436.
- [Google Scholar]
- Green biosynthesis and characterization of magnetic iron oxide (Fe3O4) nanoparticles using seaweed (Sargassum muticum) aqueous extract. Molecules. 2013;18:5954-5964.
- [Google Scholar]
- Highly water-soluble magnetic iron oxide (fe3o4) nanoparticles for drug delivery: Enhanced in vitro therapeutic efficacy of doxorubicin and mion conjugates. J. Mater. Chem. B. 2013;22:2874-2884.
- [Google Scholar]
- Surface plasmon spectroscopy of nanosized metal particles. Langmuir. 1996;12:788-800.
- [Google Scholar]
- In vitro biocompatibility of nanoscale zerovalent iron particles (NZVI) synthesized using tea polyphenols. Green. Chem.. 2010;12:114-122.
- [Google Scholar]
- Characterization of polyphenols from coriander leaves (Coriandrum sativum), red amaranthus (A. paniculatus) and green amaranthus (A.frumentaceus) using paper chromatography: and their health implications. J. Herb. Med. Toxicol.. 2010;4:173-177.
- [Google Scholar]
- Rational management of iron-deficiency anaemia in inflammatory bowel disease. J. Nutr.. 2018;10
- [Google Scholar]
- Biosynthesis of iron and silver nanoparticles at room temperature using aqueous sorghum bran extracts. Langmuir. 2010;27:264-271.
- [Google Scholar]
- Synthesis of green nano iron particles (GnIP) and their application in adsorptive removal of As (III) and As (V) from aqueous solution. Appl. Surf. Sci.. 2014;317:1052-1059.
- [Google Scholar]
- Haematological problems in obstetrics. Best. Pract. Res. Clin. Obstet. Gynaecol.. 2015;29:671-684.
- [Google Scholar]
- Shahwan, T., Abu, Sirriah, S., Nairat, M., Boyaci, E., Eroğlu, A.E., Scott, T.B., Hallam, K.R., 2011. Green synthesis of iron nanoparticles and their application as a Fenton-like catalyst for the degradation of aqueous cationic and anionic dyes. Chem. Eng. 172, 258-266.
- Biocompatibility of chitosan-coated iron oxide nanoparticles with osteoblast cells. Int. J. Nanomed.. 2012;7:5593-5602.
- [Google Scholar]
- Optimization of reaction conditions to fabricate Ocimum sanctum synthesized silver nanoparticles and its application to nano-gel systems for burn wounds. Mater. Sci. Eng. C.. 2018;92:575-589.
- [Google Scholar]
- Multifunctional magnetic nanoparticles for enhanced intracellular drug transport. J. Mater. Chem. B.. 2015;20:4134-4145.
- [Google Scholar]
- Green synthesis of Zero valent iron nanoparticles from Coriandrum sativum and its application in reduction chemical oxygen demand and biological oxygen demand in wastewater. South-Asian J. Multidiscip. Stud.. 2017;5:132-139.
- [Google Scholar]
- Green synthesis of zero valent iron nanoparticles from Spinacia oleracea (spinach) and its application in wastewater treatment. J. Adv. Res.. 2018;5:46-51.
- [Google Scholar]
- Characterization of iron–polyphenol nanoparticles synthesized by three plant extracts and their Fenton oxidation of azo dye. ACS Sustain. Chem. Eng.. 2014;2:1022-1025.
- [Google Scholar]
- Facile synthesis of magnetic core-shell nanocomposites for MRI and CT bimodal imaging. J. Mater. Chem. B.. 2015;3:6905-6910.
- [Google Scholar]
- Preparation and characterization of Fe3O4 particles with novel Nano sheets morphology and magneto chromatic property by a modified solvothermal method. Sci. Rep.. 2014;5:21-26.
- [Google Scholar]


