Translate this page into:
Optimization and mass transfer simulation of remazol brilliant blue R dye adsorption onto meranti wood based activated carbon
⁎Corresponding author. chazmier@usm.my (Mohd Azmier Ahmad)
-
Received: ,
Accepted: ,
This article was originally published by Elsevier and was migrated to Scientific Scholar after the change of Publisher.
Peer review under responsibility of King Saud University.
Abstract
Remazol brilliant blue R dye (RBBR) brings toxicity to living organisms once it enters the environment. This study utilized response surface methodology (RSM) and Polymath software for optimization and mass transfer simulation purposes, respectively. RSM revealed that the optimum preparation conditions of meranti wood-based activated carbon (MWAC) were 441 W, 5.76 min, and 1.35 g/g for radiation power, radiation time, and KOH:char impregnation ratio (IR), respectively, which translated into 86.39 mg/g of RBBR uptakes and 31.94 % of MWAC’s yield. The simulation study predicted the mass transfer rate, rm to be 112.20 to 1007.50 s−1 and the adsorption rate, k1 to be 3.96 to 4.34 h−1. The developed model predicted the adsorption surface area, am to be 790.04 m2/g and this value is highly accurate as compared to the actual mesopores surface area of 825.58 m2/g. Mechanism analysis divulged that the interaction that occurred between RBBR molecules and MWAC’s surface were hydrogen bond (methylene and alkyne), dipole–dipole force (alkyl carbonate, terminal alkyne, and methoxy), and ion–dipole force (primary amine). The isotherm and kinetic studies found that the adsorption data obeyed the Freundlich model and pseudo-first-order (PFO) model the best, respectively. The Langmuir maximum adsorption capacity, Qm was computed to be 327.33 mg/g. Thermodynamic parameters were calculated to be −4.06 kJ mol−1, 0.06 kJ mol−1 K−1, –22.69 kJ mol−1, and 16.03 kJ mol−1 for ΔH°, ΔS°, ΔG°, and Ea, respectively, which signified the adsorption process studied was exothermic, spontaneous and governed by physisorption.
Keywords
Activated carbon
Adsorption process
Response surface methodology
Simulation
Polymath
Remazol brlilliant blue R
1 Introduction
The annual production of synthetic dyes is kept rising due to the increasing demand worldwide. Several industries that extremely depend on synthetic dyes include textile, paper, magazines, cosmetics, and foods (Kishor et al., 2021). Synthetic dyes are a large group of organic chemicals and most of them contain complex aromatic in their structure. To date, almost 10,000 different types of synthetic dyes are reported in the literature (Firdaus et al., 2022). Based on their solubility in water, synthetic dyes can be divided into cationic (basic dyes), anionic (acid, direct, and reactive dyes), and non-ionic (vat and disperse dyes). Among them, reactive dyes are preferred to dye cotton due to their ability to attach to this material strongly. Unfortunately, reactive dyes may undergo hydrolysis during the dyeing process which prevents them from attaching to the textile substrate, thus producing highly polluted effluents of colours (Peláez-Cid et al., 2016). An example of reactive dye is remazol brilliant blue R (RBBR). This dye dissociates in water to produce negative ions. These negative ions are attracted to the positive polar side of water molecules, making RBBR molecules dissolve in textile effluents at a higher degree. Upon exposure to humans, animals, and aquatic plants for an adequate amount of time, RBBR can cause serious diseases since RBBR is carcinogenic, mutagenic, and toxic (Lellis et al., 2019).
Nowadays, the adsorption process by using activated carbon (AC) is the most economical-friendly and efficient method to treat a variety of contaminants from wastewater, namely synthetic dyes (Ahmad et al., 2021a, Ahmad et al., 2021b), heavy metals (Yusop et al., 2022a, Yusop et al., 2022b), pesticides (Aziz et al., 2021, Domergue et al., 2022), emerging contaminants (Quesada et al., 2022) and others. This versatility trait of AC is contributed by the high surface area and variety of surface functional groups occurring on the AC’s surface. Commercial AC is usually derived from coal, lignite, and petroleum coke. However, the dependency on these materials as AC’s precursor had shifted to agricultural wastes due to economically attractive and reduction in environmental pollution (Bazan-Wozniak et al., 2017). Examples of agricultural wastes that successfully converted to AC are kraft lignin (Brazil et al., 2022), acacia wood (Yusop et al., 2021b), orange peels (Ramutshatsha-Makhwedzha et al., 2022a), pomegranate peel (Azmier et al., 2021), durian peel (Yusop et al., 2021a), lemongrass peel (Ahmad et al., 2021a) and many others. The adsorption process is widely applied due to a relatively fast process and environmental compatibility (Rasoulzadeh et al., 2021, Mohammadi et al., 2016).
In this study, meranti wood was processed into become optimized AC (MWAC) to treat RBBR dye in wastewater. Process optimization in AC preparation is important to discover the conditions that can lead to the best possible response; thus, one can increase the efficiency of processes without increasing the cost at all. Response surface methodology (RSM) is a promising tool for optimization and is widely utilized by most studies (Giri et al., 2022, Motaghi et al., 2022, Rubio-Clemente et al., 2021). In a traditional optimization method, one variable is altered at one time whilst other variables are fixed at a constant value. The RSM can overcome the limitations of the traditional optimization method such as; (i) the neglect of interactive effects between variables, (ii) extensive numbers of experiments needed to determine the optimization levels, (iii) a laborious and time-consuming process, and (iv) the data obtained is less precise than expected (Mohammadi et al., 2017, Asgari et al., 2022). Besides optimization, this study also focussed on simulating the RBBR-MWAC adsorption process to determine the mass transfer coefficient, mass transfer rate, and adsorption rate by using Polymath software. These parameters enable researchers to understand better the movement of adsorbate molecules from the bulk phase to the solid phase. The classic kinetic models of pseudo-first-order (PFO) and pseudo-second-order (PSO) can provide the rate constant value for the overall adsorption process only. Another perk of this simulation study is that the value for adsorption surface area can be computed as well. This surface area value can be compared directly with the surface area obtained through a characterization test to validate the adequacy of the simulation model.
2 Materials and methods
2.1 Chemicals
Remazol brilliant blue R dye, RBBR (C22H16N2Na2O11S3) with a purity of 65 % was supplied by Sigma-Aldrich (M) Sdn. Bhd., Malaysia. KOH pellet with a purity of 85 % was supplied by Riedel-el Haen, Germany. Both carbon dioxide, CO2 (99.80 %) and nitrogen, N2 (99.99 %) were supplied by MOX Gases Berhad, Malaysia.
2.2 Preparation of MWAC
The precursor of meranti wood chip (5 – 10 mm) was collected from a furniture factory located at Sungai Petani, Kedah, Malaysia. Once obtained, the precursor was cleaned thoroughly with water and then, dehydrated in an oven for 72 h. The dried precursor was carbonized using a vertical furnace at 550 °C for 1 h, under N2 gas. The produced char was impregnated with KOH at different impregnation ratios (IR), as calculated as follows:
2.3 Process variables and experimental design
This study aimed to produce MWAC with high RBBR dye removal and high yield. This was done by finding the MWAC’s optimum preparation conditions by using the standard RSM design of Central Composite Design (CCD). The experimental data were analysed by a software known as Design Expert Software (STAT-EASE Inc. Minneapolis, USA) version 6.0.6. Three variables of radiation power, radiation time, and IR were selected and the ranges (−α, −1, 0, +1, +α) for these variables were (144 W, 264 W, 440 W, 616 W, 736 W), (2.64 min, 4.00 min, 6.00 min, 8.00 min, 9.36 min) and (0.00 g/g. 0.50 g/g, 1.25 g/g, 2.00 g/g, 2.51 g/g), respectively.
2.4 Batch adsorption studies
In batch adsorption studies, RBBR dye solutions with different initial concentrations (25, 50, 100, 200, 250, and 300 mg/L) were prepared. For each of these solutions, 200 mL was filled inside 250 mL of Erlenmeyer flasks. These flasks were transferred inside a shaker and 0.2 g of MWAC was added to each flask. The temperature and the agitation speed of the shaker were set to 30 °C and 120 rpm, respectively. The pH of RBBR solution was let to be original with no alteration during the batch adsorption studies. This process continues until adsorption equilibrium was reached. UV–vis spectrophotometry (Agilent Cary 60, USA) was used to determine the concentration of RBBR dye solution (λmax = 592 nm). A small sample of RBBR solution was taken out using syringe that is equipped with a nylon filter (0.45 µm) to filter out any debris of MWAC. The amount of RBBR adsorbed by MWAC and RBBR dye removal percentage during equilibrium studies were calculated by using Eq. (3) and Eq. (4), respectively, as follows:
Langmuir (Langmuir, 1918):
Freundlich (Freundlich, 1906):
Temkin (Tempkin and Pyzhev, 1940):
Koble-Corrigan (KC) (Koble and Corrigan, 1952):
2.5 Kinetic study
The kinetic study was conducted by measuring the concentration of six RBBR solutions (25–300 mg/L) at a pre-determined time interval between 0 and 180 min. The dosage of MWAC used was 0.20 g per 200 mL of RBBR solution. Other experiment conditions such as solution temperature and shaking speed of the water bath shaker were fixed at 30 °C and 80 rpm, respectively. The two most employed kinetic models of pseudo-first-order (PFO) and pseudo-second-order (PSO) were utilized in this study. Their non-linear equations are given as follows:
Pseudo-first order (PFO) (Lagergren, 1898):
Pseudo-second order (PSO) (Ho and McKay, 1998):
2.6 Simulation mass transfer study
A proposed mathematical model was used to represent the RBBR-MWAC adsorption system. Below is the material balance equation for RBBR uptakes by MWAC:
Eq. (15) was integrated with initial conditions of X(t = 0) = X0 and C(t = 0) = t0. The resulting equation is shown as follows:
The parameters of mass transfer were determined by fitting the experimental results into Eq. (16), with the aid of Polymath® version 6.2 (CACHE Corporation, USA).
2.7 Thermodynamic study
Increasing solution temperature can alter the dynamic of the adsorption process significantly. Thermodynamic parameters of change of enthalpy, ΔH° (kJ/mol), and change of entropy, ΔS° (kJ/mol.K) computed using Van’t Hoff equation as follows:
3 Results and discussions
3.1 Optimization studies
3.1.1 Regression models development
The complete experimental design matrix for MWAC’s preparation is given in Table 1. For both responses studied, quadratic type of models was suggested by the software. These empirical models in the form of coded factors are given as follows:
Run
MWAC’s preparation variables
Responses
Radiation power, X1 (watt)
Radiation time, X2 (min)
IR, X3
RBBR removal, Y1 (%)
MWAC’s yield,
Y2 (%)
1
440 (0)
6.00 (0)
2.51 (+α)
82.55
14.92
2
264 (-1)
4.00 (-1)
2.00 (+1)
73.15
25.04
3
440 (0)
6.00 (0)
1.25 (0)
88.11
33.19
4
736 (+α)
6.00 (0)
1.25 (0)
79.34
15.94
5
440 (0)
2.64 (-α)
1.25 (0)
65.85
27.63
6
264 (-1)
8.00 (+1)
0.50 (-1)
67.35
22.87
7
440 (0)
6.00 (0)
1.25 (0)
87.13
32.87
8
264 (-1)
4.00 (-1)
0.50 (-1)
51.89
26.87
9
440 (0)
6.00 (0)
1.25 (0)
84.11
30.13
10
616 (+1)
4.00 (-1)
0.50 (-1)
61.44
22.12
11
440 (0)
9.36 (+α)
1.25 (0)
77.55
17.85
12
440 (0)
6.00 (0)
1.25 (0)
86.86
32.32
13
616 (+1)
8.00 (+1)
2.00 (+1)
80.56
15.05
14
440 (0)
6.00 (0)
0.00 (0)
67.86
19.9
15
616 (+1)
4.00 (-1)
2.00 (+1)
81.44
21.15
16
264 (-1)
8.00 (+1)
2.00 (+1)
66.66
22.12
17
440 (0)
6.00 (0)
1.25 (0)
84.75
31.45
18
440 (0)
6.00 (0)
1.25 (0)
85.44
31.99
19
616 (+1)
8.00 (+1)
0.50 (-1)
75.44
17.86
20
144 (-α)
6.00 (0)
1.25 (0)
53.51
27.52
RBBR uptakes (mg/g), Y1:
MWAC’s yield (%), Y2:
The empirical models in the form of non-coded factors (actual equations) are given as follows:
RBBR uptakes (mg/g), Y1:
MWAC’s yield (%), Y2:
Fig. 1(a) and (b) present the plots of predicted versus actual for RBBR uptakes response and MWAC’s yield response, respectively. The predicted values for RBBR uptakes response were obtained from Eq. (21) and (23) whilst the predicted values for MWAC’s yield were obtained from Eq. (22) and (24). The actual values for both responses were obtained from the experiment. The adequacy of Eq. (21) and (22) were verified in terms of R2, adj-R2, standard deviation (SD), and adequate precision (AP). Both of these models were excellent due to the high R2 and adj-R2 obtained of (0.9788 and 0.9597) and (0.9703 and 0.9435), respectively. Adj-R2 values were important since insignificant terms were omitted in its calculation. Both equations produced small SD of 2.23 and 1.50, respectively, therefore signifying low deviation between experimental and calculated data. AP values were determined to be 21.57 and 17.10 for both equations, respectively. Since these values were above 4, therefore the developed models were adequate to navigate the design space.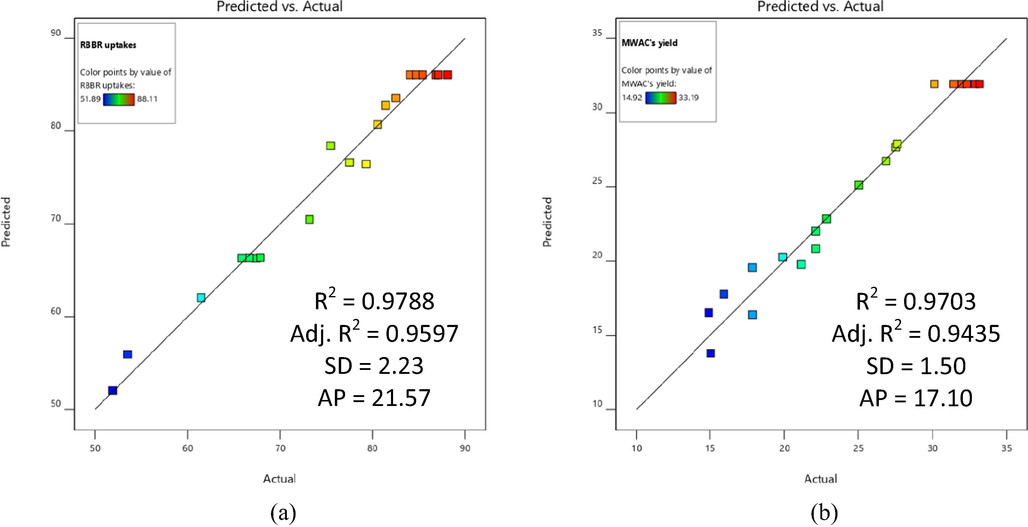
Plots of predicted versus actual for (a) RBBR uptakes and (b) MWAC’s yield.
3.1.2 Analysis of variance (ANOVA)
The adequacy of the developed models can be further verified through analysis of variance (ANOVA). The result of ANOVA for both responses are shown in Table 2. Since the Prob > F value for the models of Y1 and Y2 were < 0.0001, therefore both of these models were significant. The significant terms for Y1 were X1, X2, X3, X2X3, X12, X22 and X32 whilst significant terms for Y2 were X1, X2, X3, X12, X22 and X32. By judging F-value, the response of Y1 was significantly affected by radiation power and IR whereas the response of Y2 was greatly influenced by radiation power and radiation time.
Source
Response 1, Y1: RBBR removal by MWAC
Response 2, Y2: MWAC’s yield
Sum of Squares
DF
Mean Square
F Value
Prob > F
Sum of Squares
DF
Mean Square
F Value
Prob > F
Model
2297.72
9
255.30
51.23
< 0.0001
734.12
9
81.57
36.26
< 0.0001
X1
507.73
1
507.73
101.89
< 0.0001
118.30
1
118.30
52.59
< 0.0001
X2
127.72
1
127.72
25.63
0.0005
83.28
1
83.28
37.02
0.0001
X3
366.18
1
366.18
73.48
< 0.0001
15.13
1
15.13
6.73
0.0268
X1X2
2.15
1
2.15
0.4320
0.5258
1.48
1
1.48
0.6576
0.4363
X1X3
2.59
1
2.59
0.5193
0.4876
0.1800
1
0.1800
0.0800
0.7830
X2X3
169.56
1
169.56
34.02
0.0002
0.0722
1
0.0722
0.0321
0.8614
X12
712.36
1
712.36
142.95
< 0.0001
153.10
1
153.10
68.06
< 0.0001
X22
384.83
1
384.83
77.22
< 0.0001
121.42
1
121.42
53.98
< 0.0001
X32
224.85
1
224.85
45.12
< 0.0001
330.95
1
330.95
147.12
< 0.0001
3.1.3 Three-dimensional (3D) response surface of MWAC
Each of the variables studied affects the responses of Y1 and Y2 differently. These effects can be better understood by examining the three-dimensional (3D) response surface. Fig. 2 shows the 3D surface plot for (a) RBBR uptakes, Y1 (effects of radiation power and IR), and (b) MWAC’s yield, Y2 (effects of radiation power and radiation time). Based on Fig. 2(a), when radiation power and IR were at their lowest values of 264 W and 0.50 g/g, respectively, the lowest RBBR dye removal by MWAC occurred. As both of these variables increased, RBBR dye removal increased accordingly. This can be explained by the fact that at higher radiation power, more volatile matter and tar compounds are successfully removed due to the enhanced cracking reaction, thus creating more pores and increasing adsorption capacity (Wan Mahari et al., 2016). According to Rashidi and Yusup (2017), higher IR can help create more pores by providing an extra amount of K+ ions to penetrate the char, thus increasing the adsorption capacity. However, at an extremely high level of radiation power and IR, a small dropped in RBBR dye removal was noticed. At an extremely high level of radiation power, excess energy is causing a certain amount of carbon to be burned, thus reducing existing pores and adsorption capacity. Likewise, by increasing the IR level beyond the optimum level, excess K+ ions are trapped inside the existing pores, thus reducing adsorption capacity. Based on Fig. 2(b), radiation power and radiation time were found to have a negative effect on MWAC’s yield. In fact, the highest MWAC’s yield was obtained when both of these variables were at the lowest level of 264 W and 8.00 min, respectively. An increase in radiation power leads to a higher degree of volatilization process to occur, thus reducing more of MWAC’s weight. Furthermore, by increasing radiation time, the aggressive volatilization process would occur for a longer period of time, therefore reducing MWAC’s weight even further. A similar finding was reported by Ghani et al. (2017) where the yield of the sample decreased significantly after being exposed to microwave heating beyond the optimum range of radiation time.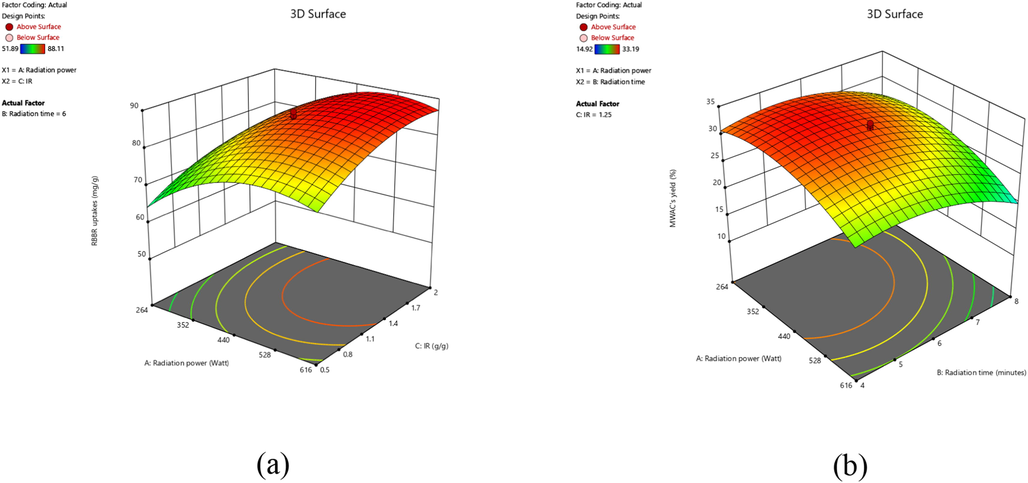
3D response surface plots for (a) RBBR dye removal and (b) MWAC’s yield.
3.1.4 Optimization of MWAC’s preparation variables
Table 3 presents the optimization data for the variables and responses studied. The optimization process was executed by setting the responses studied as “maximum” and the variables studied as “in range”. As the result, the optimum values generated by the software were found to be 441 W, 5.77 min, and 1.35 g/g for radiation power, radiation time and IR, respectively which produced 86.39 mg/g and 31.94 % of RBBR uptakes and MWAC’s yield, respectively. The models were validated to be excellent in predicting the responses due to the small error percentage obtained for RBBR dye removal (2.14 %) and MWAC’s yield (0.85 %). The desirability for this solution was relatively high of 0.942.
Variables
Responses
Model desirability
Radiation power, X1 (W)
Radiation time, X2 (min)
IR, X3 (g/g)
RBBR uptakes, Y1 (mg/g)
MWAC’s yield, Y2 (%)
Actual
Predicted
Error (%)
Actual
Predicted
Error
441
5.77
1.35
88.28
86.39
2.14
32.21
31.94
0.85
0.942
3.2 Characterization of MWAC
The elemental and proximate analyses are given in Table 4. The precursor was found to be composed of 33.20 % of C element, 7.52 % of H element, 0.21 % of S element, and 59.07 % of N + O elements whilst MWAC was revealed to be comprised of 81.94 % of C element, 1.59 % of H element, 0.11 % of S element, and 16.36 % of N + O elements. The proximate analysis revealed that after carbonization and activation processes took place, moisture and volatile matter decreased significantly from 10.28 % and 59.22 % in the precursor to 4.74 % and 10.19 % in MWAC, respectively. These components evaporated and left the sample, causing the fixed carbon to rise from 28.15 % in the precursor to 83.16 % in MWAC. The selection of meranti wood as the precursor was the right decision in the first place due to the relatively high fixed carbon percentage that it posed. Precursors with a high percentage of fixed carbon can produce AC with good performance since the fixed carbon made up the carbon matrix structure in AC. In comparison, other biomasses pose lower fixed carbon percentages such as pine wood of 26.50 % (Ahmed et al., 2019), acacia wood of 24.75 % (Yusop et al., 2021b), and Jatoba barks of 23.60 % (Spessato et al., 2019). Besides that, another good trait of meranti wood is the low ash percentage of 2.35 %. Ash is not desired in AC since ash does not have any pores, thus ash does not contribute to the adsorption process.
Proximate analysis (%)
Elemental analysis (%)
Moisture
Volatile matter
Fixed carbon
Ash
C
H
S
(N + O)
Precursor
10.28
59.22
28.15
2.35
33.20
7.52
0.21
59.07
MWAC
4.74
10.19
83.16
1.91
81.94
1.59
0.11
16.36
Physicochemical activation employed succeeded in increasing the BET surface area and mesopores surface area from 453.25 m2/g and 278.11 m2/g in char to 1257.22 m2/g and 825.58 m2/g in MWAC, respectively. During chemical activation, K+ penetrates deep into the skeleton of the char, resulting development of a new pores network while during physical activation, CO2 gas molecules bombarded the surface of the sample, making the existing pores to be bigger in size besides assisting new pores to be developed. The pores in MWAC lie in the mesopores region due to an average pore diameter of 2.48 nm and a total pore volume of 0.5870 cm3/g. The surface morphology of the precursor and MWAC was studied by inspecting their SEM images, as shown in Fig. 3. The surface of the precursor was found to contain no pores whereas the surface of MWAC was spotted to be packed with pores distributed all over the places. Originally, these pores are the home for the moisture content, volatile matter, and tar compound that were successfully removed by effective carbonization and physicochemical activation.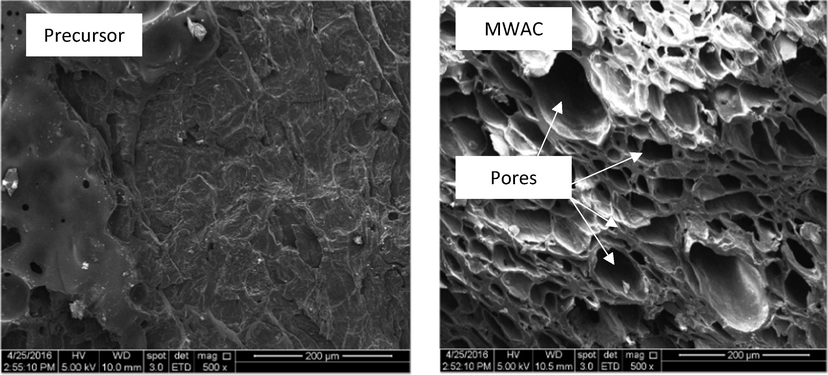
SEM images of precursor and MWAC.
The functional groups existed on the surface of precursor and MWAC was identified by studying their FTIR spectrum, as given in Fig. 4. Peaks that can be seen on both spectrum of precursor and MWAC were alkyne C—H bend (632 and 575 cm−1), methylene (CH2)n (750 and 612 cm−1), cyclohexane ring vibrations (1013 and 832 cm−1), C⚌C–C aromatic ring stretch (1512 and 1191 cm−1), alkyl carbonate (1747 and 1543 cm−1), aryl carbonate (1791 and 1609 cm−1), aliphatic primary amine, NH stretch (3390 and 3310 cm−1) and nonbonded hydroxy group, OH stretch (3645 and 3530 cm−1), respectively. Unlike them, some functional groups were badly affected by physicochemical activation and microwave heating, thus they only existed on precursor, such as nitrate ions (815 cm−1), alkenyl C⚌C stretch (1629 cm−1), carboxylic acid (1703 cm−1), methylene C—H asymmetric (2935 cm−1). New peaks were formed on MWAC’s surface namely C≡C terminal alkyne (1969 cm−1), C≡C medial alkyne (2071 cm−1), methoxy, C—H stretch (CH3-O) (2386 cm-1), vinyl C—H stretch (2511 cm-1), alkyne C—H stretch (3083 and 3149 cm−1), phenols, O—H stretch (3318 cm−1) and tertiary alcohol, O—H stretch (3400 cm−1). Fig. 5 shows the possible interactions occurred between functional groups and RBBR molecules. Functional groups of methylene and alkyne formed hydrogen bonds with RBBR molecules, alkyl carbonate, terminal alkyne and methoxy interacted with RBBR molecules via dipole–dipole force whilst primary amine and alcohol formed ion dipole force with RBBR molecules.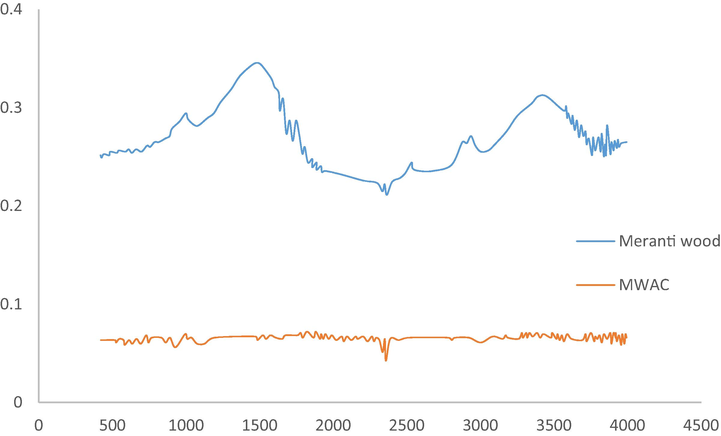
FTIR spectrum for (a) precursor and (b) MWAC.
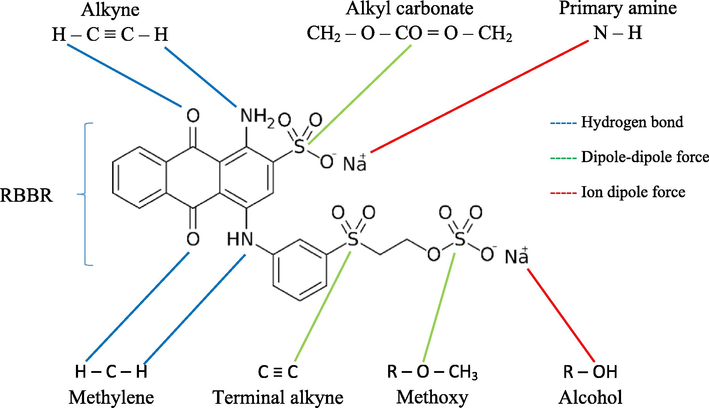
Possible interactions between RBBR molecules and surface functional groups.
Fig. 6 presents the XPS spectra for MWAC. Based on these spectra, it was found that MWAC posed atomic concentration of C (75.91 %), O (18.01 %), N (1.25 %) and Si (4.83 %). This result was consistent with the elemental analysis where C element posed the highest elemental percentage, followed by the combination of O and N elements. Small atomic composition of Si in MWAC came from the ash component which is consistent with the result of proximate analysis.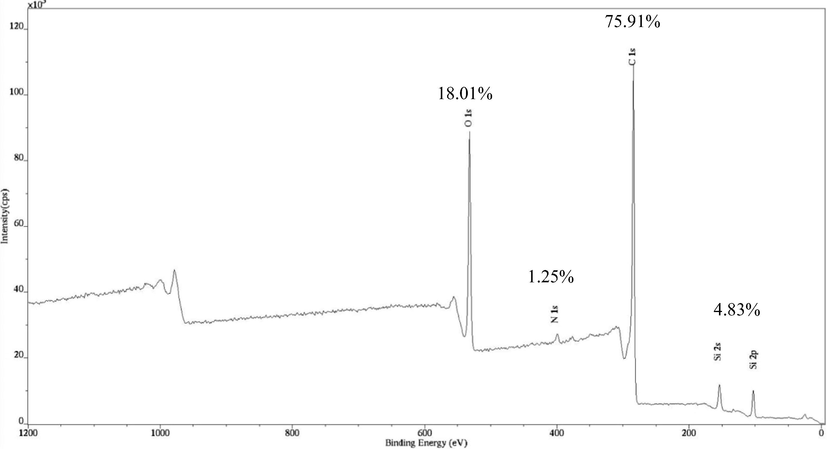
XPS spectra for MWAC.
3.3 Adsorption equilibrium
3.3.1 Effect of contact time and initial MB dye concentration
The plots of adsorption uptakes versus time and percentage removal versus time at different RBBR initial concentration are given in Fig. 7(a) and (b), respectively. When RBBR initial concentration increased from 25 to 300 mg/L, adsorption uptakes of RBBR increased from 22.94 to 210.15 mg/g. At higher concentration, larger mass transfer driving force occurred to enable RBBR molecules to triumph mass transfer resistance (Yusop et al., 2021b). On contrary, RBBR percentage removal dropped from 91.77 to 70.05 % when RBBR concentration increased from 25 to 300 mg/L. At lower initial concentration, a smaller number of RBBR molecules available, thus less competition occurred among them to be adsorbed. Less adsorption competition at lower initial concentration also causing the adsorption system at 25 and 50 mg/L to achieve equilibrium state faster at 4 to 5 h. In contrast, higher initial concentration of 100 to 300 mg/L required 7 h to achieve the same state.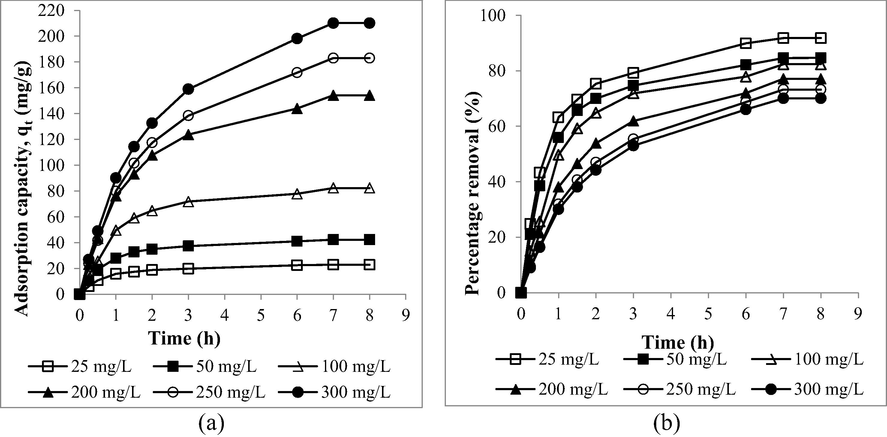
The plots of (a) adsorption uptakes and (b) percentage removal of RBBR by MWAC versus time for different initial concentration.
3.3.2 Effect of solution temperature and pH
By raising the solution temperature from 30 to 50 °C, a reduction in RBBR adsorption uptakes occurred from 82.33 to 76.25 mg/g. At higher solution temperatures, the performance of MWAC in adsorbing RBBR becomes poorer due to the increased solubility of RBBR dye molecules in the solution. In addition, adsorbate molecules posed higher kinetic energy at higher solution temperatures, thus making it easier for them to flee from the solid phase to the bulk phase (Abbaszadeh et al., 2016). Furthermore, Doumic et al. (2015) stated that electrostatic interaction between anionic RBBR dye and polar functional groups that existed on MWAC’s surface becomes weaker at higher solution temperatures, thus promoting the desorption process. The plots of RBBR uptakes by MWAC under different solution temperature and solution pH is given in Fig. 8(a) and (b), respectively whilst the zeta potential value for MWAC at pH 2 and 12 are given in Table 5. It was revealed that MWAC performed the best and the worst in removing RBBR dye at pH 2 (87.42 mg/g) and pH 12 (64.21 mg/g), respectively. At pH 12 (alkaline condition), a large amount of OH– ions existed in the solution and inducing the MWAC’s surface to be negatively charged. As a consequence, an electrostatic repulsion occurs between anionic RBBR dye molecules and MWAC’s surface which led to the drop in MWAC’s adsorption performance. This was supported by the zeta potential value of the −19.60 mV for MWAC at pH12 (MWAC-pH12). The negative sign of zeta potential value signifies that the surface of MWAC-pH12 was filled with negatively charged surface functional groups. At pH 2 (acidic condition), excess H+ ions are present in the solution and inducing the surface of MWAC to be less negatively charged, thus reducing the electrostatic repulsion between anionic RBBR dye molecules and MWAC’s surface. This was supported by the zeta potential value of −2.08 mV for MWAC at pH2 (MWAC-pH2). Although the zeta potential value for MWAC-pH2 is still negative, its magnitude had dropped significantly as compared to MWAC-pH12. Therefore, it proved the effect of H+ in reducing the negative charge on MWAC’s surface.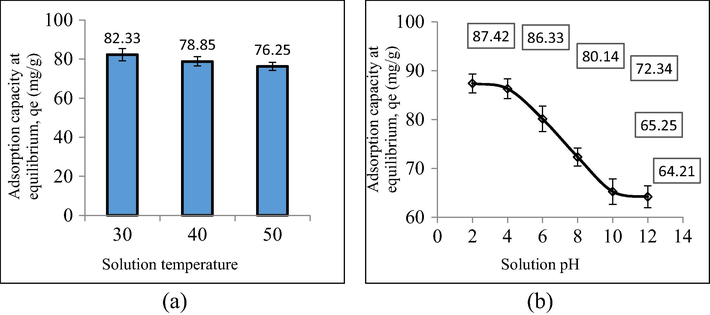
The plots of RBBR uptakes by MWAC under different (a) solution temperature and (b) solution pH.
MWAC-pH2
MWAC-pH12
Zeta potential (mV)
−2.08
−19.60
Conductivity (mS/cm)
37.1
25.30
3.4 Adsorption isotherm
The isotherm plots are provided in Fig. 9 and all the parameters obtained from the isotherm models are presented in Table 6. Three models of Langmuir, Freundlich, and Koble-Corrigan (KC) produced low RMSE values of 4.41, 5.59, and 3.40, respectively. But between these three models, the Freundlich model was able to predict the experimental data the best, thus yielding the lowest error percentage of 4.86 %. Therefore, this adsorption process obeyed the Freundlich model, signifying multilayer coverage of RBBR onto MWAC’s surface. More than one RBBR molecule can be absorbed by MWAC, and the strength of each bond is not homogenous. Besides that, the more RBBR molecules were absorbed in one active site, the lower the probability of another molecule binding to the exact active site because a higher energy is needed (Ammendola et al., 2017). The parameter from Freundlich isotherm, nF was found to be 1.69 and since this value is between 1 and 10, it signifies that the adsorption process was favourable as well. Despite of low RMSE and average error produced by Koble-Corrigan, this model is invalid to describe the adsorption process study since the nKC value was found to be 0.83 which is<1 (Koble and Corrigan, 1952, Mozaffari Majd et al., 2022). Langmuir monolayer adsorption capacity, Qm obtained was 327.33 mg/g and this value was relatively high as compared to RBBR removal by sewage sludge biochar of 126.59 mg/g (Raj et al., 2021), RBBR removal by bone char of 20.60 mg/g (Bedin et al., 2017) and RBBR removal by acacia sawdust based AC of 263.16 mg/g (Yusop et al., 2017). A further comparison between MWAC’s adsorption performance with other biomass-based AC is summarized in Table 7. The equilibrium constant, RL was found to be 0.15. Since this value is between 0 and 1, therefore the adsorption process studied was found to be favourable (Chen et al., 2021). In literature, besides dyes, few studies reported the adsorption of heavy metals onto meranti-based adsorbents. For instance, the meranti-based adsorbent was found to remove Cd(II), Cu(II), Cr(II), Ni(II), and Pb(II) with adsorption capacities of 175.43, 32.05, 37.88, 35.97, and 34.25 mg/g, respectively (Rafatullah et al., 2009, Rafatullah et al., 2012). Another study performed by Ahmad et al. (2009) found that meranti-based adsorbent can adsorb 37.17 mg/g of Cu(II) and 37.04 mg/g of Pb(II).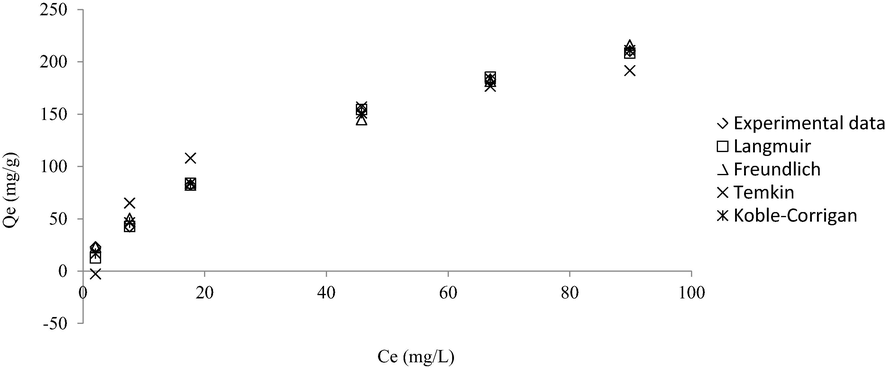
Non-linear isotherm plots for RBBR-MWAC adsorption system at 30 °C.
Langmuir
Freundlich
Temkin
KC
Qm (mg/g)
327.33
nF
1.69
B (L/mg)
51.48
AKC
9.57
KL (L/mg)
0.019
KF (mg/g)(L/mg)1/n
15.04
A (L/mg)
0.46
BKC
0.02
nKC
0.83
RMSE
4.41
RMSE
5.59
RMSE
19.23
RMSE
3.40
Error (%)
8.21
Error
(%)
4.86
Error (%)
35.10
Error (%)
6.88
AC’s precursor
Adsorbate (dye)
Maximum adsorption capacity (mg/g)
References
Meranti wood
RBBR
327.33
This study
Walnut shell
Methylene blue
307.40
(Vakili et al., 2023)
Durian peel
Malachite green
231.17
(Yusop et al., 2021a)
Date palm frond
Eosin yellow
217.00
(Jabbar et al., 2022)
Rice husk
Crystal violet
235.70
(Goswami and Kumar Dey, 2022)
Mangosteen peel
Methylene blue
163.60
(Jawad et al., 2022)
Peltophorum pterocarpum leaf
Acid blue 9
Rhodamine blue
Safranine O
Malachite green151.00
170.10
221.81
272.66(Subba Reddy et al., 2023)
Orange and lemon peel
Methyl orange
Methylene blue33.00
38.00(Ramutshatsha-Makhwedzha et al., 2022b)
3.5 Adsorption kinetic
Fig. 10(a) and (b) present the non-linear kinetic plots for the PFO model and PSO model, respectively, whilst Table 8 shows the kinetic data. It was found that the adsorption of RBBR dye onto MWAC was best represented by PFO kinetic model due to a lower average error percentage of 8.89 %. Therefore, PFO kinetic model can predict the adsorption uptakes, qt with higher accuracy as can be seen in Fig. 10(a). Alberti et al. (2012) stated that four steps occur in the adsorption process. The first step is the transport of adsorbate molecules to the adsorbent. The second step is the diffusion of the adsorbate molecules through the film layer surrounding the adsorbent. The third step involves intraparticle diffusion and the last step involves physisorption or chemisorption. According to McGinley et al. (2022), PFO signifies that the rate limiting step in the adsorption process is caused by the first step, which is the transport of adsorbate to the adsorbent. The value of k1 was found to decrease from 1.55 to 0.64 h−1 when RBBR initial concentration increased from 25 to 300 mg/L. At a higher adsorbate concentration, the ratio of adsorbate molecules to the available active sites on the adsorbent is high. Therefore, the adsorbate molecules compete to be adsorbed by the adsorbent at an intense level. As the consequence, the overall rate constant becomes lower at higher adsorbate concentrations and vice versa.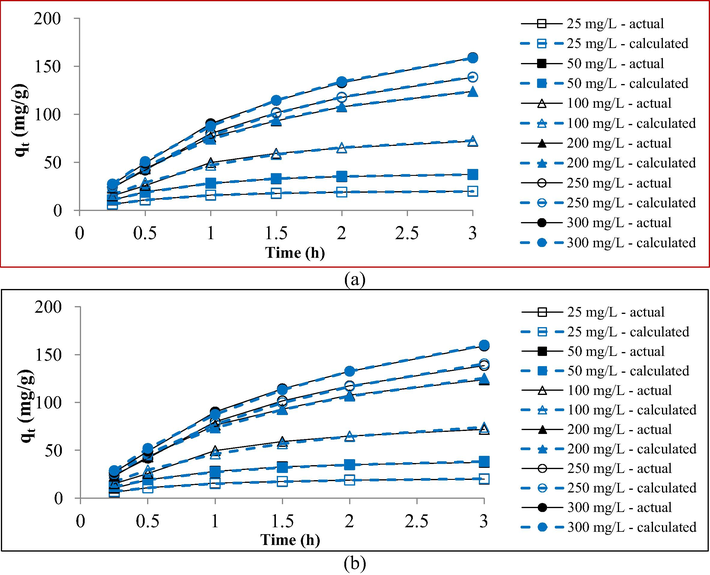
Non-linear kinetic plots of (a) PFO and (b) PSO for RBBR-MWAC adsorption system at 30 °C.
Initial
concentration (mg/L)
qe, exp
(mg/g)
PFO
PSO
k1
(h−1)
qe, cal
(mg/g)
Error (%)
k2 (g/mg.h)
qe, cal
(mg/g)
Error (%)
25
19.81
1.55
19.78
0.14
0.0635
24.65
24.48
50
37.34
1.37
37.71
0.98
0.0276
47.96
28.45
100
71.86
0.93
77.29
7.56
0.0072
106.55
48.27
200
123.76
0.77
137.09
10.77
0.0031
194.40
57.08
250
138.48
0.65
161.73
16.79
0.0020
237.93
71.82
300
158.94
0.64
186.07
17.07
0.0017
273.72
72.21
Average
8.89
50.39
3.6 Adsorption mass transfer simulation
Polymath version 6.2 (CACHE Corpn., USA) was used to model the adsorption data to find the mass transfer and rate parameters. Fig. 11 shows the plot of mass transfer simulation. Table 9 summarized the mass transfer parameters obtained for this adsorption process. As RBBR concentration increased from 25 to 300 mg/L, mass transfer rate, rm, and rate constant, K1 increased from 112.20 to 10007.50 s−1 and from 3.96 to 4.34 h−1, respectively. At higher RBBR initial concentration, a higher concentration slope between RBBR at bulk and solid phase occurred, thus causing higher mass transfer driving force to form. As the result, higher rm and K1 were obtained at higher RBBR concentrations. This model predicted the average adsorption surface area, am to be 790.04 m2/g. This value was accurately close to the actual mesopores surface area of 825.58 m2/g (error = 4.50 %), signifying the accuracy of the model developed. Further adequacy of this model was verified based on high R2 values (0.9863 to 0.9979) and low RMSD (0.2719 to 1.0678) obtained.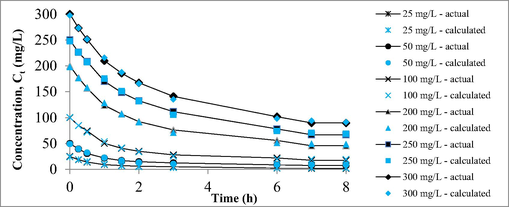
The plot of mass transfer simulation.
RBBR concentration (mg/L)
Mass transfer coefficient, Km (mg.m/s)
Mass transfer rate, rm (mg/s)
Rate constant, K1 (L/s)
Adsorption surface area, am (m2/g)
R2
RMSD
25
0.006350
112.20
3.9591
798.30
0.9863
0.2719
50
0.006378
209.98
4.0326
801.80
0.9928
0.3708
100
0.006333
405.92
4.1833
796.21
0.9952
0.6133
200
0.006243
741.01
4.2813
784.90
0.9963
1.0100
250
0.006203
876.50
4.3305
779.87
0.9972
1.0554
300
0.006198
1007.50
4.3373
779.19
0.9979
1.0678
Average:
790.04
0.9943
0.7315
3.7 Adsorption thermodynamic
The effect of temperature on the adsorption behaviour can be evaluated by determining the thermodynamic parameters which include enthalpy change (ΔH°), entropy change (ΔS°), Gibbs free energy (ΔG°), and Arrhenius activation energy, Ea. The enthalpy change, ΔH° was determined to be −4.06 kJ/mol. A negative sign for this value signified the exothermic nature of the adsorption process where RBBR uptakes were higher at lower solution temperatures (Singh and Kuma, 2016). The value for entropy change, ΔS° was −0.06 kJ/mol.K, and the negative sign of this parameter indicates a reduction in randomness at the solid–liquid interface (Tharaneedhar et al., 2017). Arrhenius activation energy, Ea was calculated to be 16.03 kJ/mol and since this value lies between 5 and 40 kJ/mol, therefore the adsorption process was confirmed to be controlled by physisorption. The Gibbs free energy, ΔG° was found to be −22.69 kJ/mol. Due to the negative sign for this parameter, it can be concluded that the adsorption process was feasible and spontaneous in nature.
4 Conclusions
Meranti wood chip was successfully converted into MWAC to adsorb RBBR dye with a relatively high Qm of 327.33 mg/g. MWAC was found to pose a high BET surface area and mesopores surface area of 1257.22 m2/g and 825.58 m2/g, respectively. With the aid of RSM, optimum preparation conditions were determined to be 441 W, 5.76 min, and 1.35 g/g for radiation power, radiation time, and IR, respectively which are responsible for producing MWAC with RBBR dye removal of 86.39 mg/g and yield of 31.94 %. The RBBR uptakes response was majorly affected by radiation power and IR whereas MWAC’s yield response was significantly affected by radiation power and radiation time. Mechanism analysis divulged that interaction between RBBR molecules and surface functional groups of MWAC was contributed by hydrogen bond, dipole–dipole force, and ion–dipole forces. The adsorption process followed the Freundlich isotherm model which signified multilayer coverage. In terms of kinetic, the adsorption system was best described by PFO. The mass transfer model developed from Polymath can predict the mesopores surface area with high accuracy. Adsorption of RBBR onto MWAC was found to be thermodynamically exothermic, spontaneous in nature, and controlled by physisorption. All in all, MWAC is a good adsorbent for reactive RBBR dye removal.
Funding
This research was funded by the Ministry of Higher Education Malaysia through the Fundamental Research Grant Scheme (project code: FRGS/1/2021/TK0/USM/01/3) and the Postdoctoral Fellowship Scheme from Universiti Sains Malaysia.
Declaration of Competing Interest
The authors declare that they have no known competing financial interests or personal relationships that could have appeared to influence the work reported in this paper.
References
- Treatment of lead-contaminated water using activated carbon adsorbent from locally available papaya peel biowaste. J. Clean. Prod.. 2016;118:210-222.
- [Google Scholar]
- Adsorptive potentials of lemongrass leaf for methylene blue dye removal. Chemical Data Collections. 2021;31
- [Google Scholar]
- Removal of Cu(II) and Pb(II) ions from aqueous solutions by adsorption on sawdust of Meranti wood. Desalination. 2009;247:636-646.
- [Google Scholar]
- Adsorption of methylene blue from aqueous solution by peanut shell based activated carbon. Mater. Today: Proc.. 2021;47:1246-1251.
- [Google Scholar]
- Activated carbon preparation from biomass feedstock: clean production and carbon dioxide adsorption. J. Clean. Prod.. 2019;225:405-413.
- [Google Scholar]
- Beyond the synthesis of novel solid phases: review on modelling of sorption phenomena. Coord. Chem. Rev.. 2012;256:28-45.
- [Google Scholar]
- CO2 adsorption on a fine activated carbon in a sound assisted fluidized bed: thermodynamics and kinetics. Chem. Eng. J.. 2017;322:302-313.
- [Google Scholar]
- Heterogeneous catalytic degradation of nonylphenol using persulphate activated by natural pyrite: response surface methodology modelling and optimisation. Int. J. Environ. Anal. Chem.. 2022;102:6041-6060.
- [Google Scholar]
- Single-Stage microwave-assisted coconut-shell-based activated carbon for removal of Dichlorodiphenyltrichloroethane (DDT) from aqueous solution: optimization and batch studies. Int. J. Chem. Eng.. 2021;2021:9331386.
- [Google Scholar]
- Optimization and batch studies on adsorption of Methylene blue dye using pomegranate fruit peel based adsorbent. Chem. Data Collect.. 2021;32:100676
- [Google Scholar]
- The influence of activation procedure on the physicochemical and sorption properties of activated carbons prepared from pistachio nutshells for removal of NO2/H2S gases and dyes. J. Clean. Prod.. 2017;152:211-222.
- [Google Scholar]
- Bone char prepared by CO2 atmosphere: Preparation optimization and adsorption studies of Remazol Brilliant Blue R. J. Clean. Prod.. 2017;161:288-298.
- [Google Scholar]
- Sustainable process to produce activated carbon from Kraft lignin impregnated with H3PO4 using microwave pyrolysis. Biomass Bioenergy. 2022;156:106333
- [Google Scholar]
- In-situ immobilization of ZIF-67 on wood aerogel for effective removal of tetracycline from water. Chem. Eng. J.. 2021;423:130184
- [Google Scholar]
- Adsorption onto granular activated carbons of a mixture of pesticides and their metabolites at trace concentrations in groundwater. J. Environ. Chem. Eng.. 2022;10:108218
- [Google Scholar]
- Efficient removal of Orange G using Prussian Blue nanoparticles supported over alumina. Catal. Today. 2015;240:67-72.
- [Google Scholar]
- Conversion of teak wood waste into microwave-irradiated activated carbon for cationic methylene blue dye removal: optimization and batch studies. Arab. J. Chem.. 2022;15:104081
- [Google Scholar]
- Optimization of preparation conditions for activated carbon from banana pseudo-stem using response surface methodology on removal of color and COD from landfill leachate. Waste Manag.. 2017;62:177-187.
- [Google Scholar]
- Lead removal from synthetic wastewater by biosorbents prepared from seeds of Artocarpus Heterophyllus and Syzygium Cumini. Chemosphere. 2022;287:132016
- [Google Scholar]
- Synthesis and application of treated activated carbon for cationic dye removal from modelled aqueous solution. Arab. J. Chem.. 2022;15:104290
- [Google Scholar]
- Removal of an anionic Eosin dye from aqueous solution using modified activated carbon prepared from date palm fronds. Chem. Data Collect.. 2022;42:100965
- [Google Scholar]
- Mesoporous activated carbon from mangosteen (Garcinia mangostana) peels by H3PO4 assisted microwave: Optimization, characterization, and adsorption mechanism for methylene blue dye removal. Diam. Relat. Mater.. 2022;129:109389
- [Google Scholar]
- Ecotoxicological and health concerns of persistent coloring pollutants of textile industry wastewater and treatment approaches for environmental safety. J. Environ. Chem. Eng.. 2021;9:105012
- [Google Scholar]
- About the theory of so-called adsorption of soluble substances. Sven. Vetenskapsakad. Handingarl. 1898;24:1-39.
- [Google Scholar]
- The adsorption of gases on plane surfaces of glass, mica and platinum. J. Am. Chem. Soc.. 1918;40:1361-1403.
- [Google Scholar]
- Effects of textile dyes on health and the environment and bioremediation potential of living organisms. Biotechnol. Res. Innovation. 2019;3:275-290.
- [Google Scholar]
- A critical review of the estimation of the thermodynamic parameters on adsorption equilibria. Wrong use of equilibrium constant in the Van't Hoof equation for calculation of thermodynamic parameters of adsorption. J. Mol. Liq.. 2019;273:425-434.
- [Google Scholar]
- Adsorption isotherm models: a comprehensive and systematic review (2010–2020) Sci. Total Environ.. 2022;812:151334
- [Google Scholar]
- Batch adsorption of herbicides from aqueous solution onto diverse reusable materials and granulated activated carbon. J. Environ. Manage.. 2022;323:116102
- [Google Scholar]
- Equilibrum and kinetic studies on the adsorption of penicillin G by chestnut shell. Environ. Eng. Manag. J.. 2016;15:167-173.
- [Google Scholar]
- Predicting the capability of carboxymethyl cellulose-stabilized iron nanoparticles for the remediation of arsenite from water using the response surface methodology (RSM) model: Modeling and optimization. J. Contam. Hydrol.. 2017;203:85-92.
- [Google Scholar]
- Simultaneous adsorption of cobalt ions, azo dye, and imidacloprid pesticide on the magnetic chitosan/activated carbon@UiO-66 bio-nanocomposite: Optimization, mechanisms, regeneration, and application. Sep. Purif. Technol.. 2022;284:120258
- [Google Scholar]
- Elimination of textile dyes using activated carbons prepared from vegetable residues and their characterization. J. Environ. Manage.. 2016;181:269-278.
- [Google Scholar]
- Caffeine removal by chitosan/activated carbon composite beads: adsorption in tap water and synthetic hospital wastewater. Chem. Eng. Res. Des.. 2022;184:1-12.
- [Google Scholar]
- Adsorption of copper (II), chromium (III), nickel (II) and lead (II) ions from aqueous solutions by meranti sawdust. J. Hazard. Mater.. 2009;170:969-977.
- [Google Scholar]
- Removal of cadmium (II) from aqueous solutions by adsorption using meranti wood. Wood Sci. Technol.. 2012;46:221-241.
- [Google Scholar]
- Kinetic and thermodynamic investigations of sewage sludge biochar in removal of Remazol Brilliant Blue R dye from aqueous solution and evaluation of residual dyes cytotoxicity. Environ. Technol. Innov.. 2021;23:101556
- [Google Scholar]
- Activated carbon derived from waste orange and lemon peels for the adsorption of methyl orange and methylene blue dyes from wastewater. Heliyon 2022:e09930.
- [Google Scholar]
- Activated carbon derived from waste orange and lemon peels for the adsorption of methyl orange and methylene blue dyes from wastewater. Heliyon. 2022;8:e09930.
- [Google Scholar]
- A review on recent technological advancement in the activated carbon production from oil palm wastes. Chem. Eng. J.. 2017;314:277-290.
- [Google Scholar]
- Eco-friendly rapid removal of palladium from aqueous solutions using alginate-diatomite magnano composite. J. Environ. Chem. Eng.. 2021;9:105954
- [Google Scholar]
- Sustainable mesoporous graphitic activated carbon as biosorbent for efficient adsorption of acidic and basic dyes from wastewater: Equilibrium, kinetics and thermodynamic studies. J. Hazardous Mater. Adv.. 2023;9:100214
- [Google Scholar]
- Adsorption capacity of the biochar obtained from Pinus patula wood micro-gasification for the treatment of polluted water containing malachite green dye. J. King Saud Univ. – Eng. Sci. 2021
- [Google Scholar]
- Measurement and analysis of adsorption isotherms of CO2 on activated carbon. Appl. Therm. Eng.. 2016;97:77-86.
- [Google Scholar]
- KOH-super activated carbon from biomass waste: Insights into the paracetamol adsorption mechanism and thermal regeneration cycles. J. Hazard. Mater.. 2019;371:499-505.
- [Google Scholar]
- Kinetics of ammonia synthesis on promoted iron catalyst. Acta Physicochim. URSS. 1940;12:327.
- [Google Scholar]
- Prediction and interpretation of adsorption parameters for the sequestration of methylene blue dye from aqueous solution using microwave assisted corncob activated carbon. Sustain. Mater. Technol.. 2017;11:1-11.
- [Google Scholar]
- The impact of activation temperature and time on the characteristics and performance of agricultural waste-based activated carbons for removing dye and residual COD from wastewater. J. Clean. Prod.. 2023;382:134899
- [Google Scholar]
- Pyrolysis recovery of waste shipping oil using microwave heating. Energies. 2016;9:780.
- [Google Scholar]
- Scavenging remazol brilliant blue R dye using microwave-assisted activated carbon from acacia sawdust: equilibrium and kinetics studies. AIP Conf. Proc. 2017:1892.
- [Google Scholar]
- Scavenging malachite green dye from aqueous solution using durian peel based activated carbon. Malaysian J. Fundamental Appl. Sci.. 2021;17:95-103.
- [Google Scholar]
- Adsorption of cationic methylene blue dye using microwave-assisted activated carbon derived from acacia wood: optimization and batch studies. Arab. J. Chem.. 2021;14:103122
- [Google Scholar]
- Single-stage microwave assisted coconut shell based activated carbon for removal of Zn(II) ions from aqueous solution – Optimization and batch studies. Arab. J. Chem.. 2022;15:104011
- [Google Scholar]
- Single-Stage optimized microwave-induced activated carbon from coconut shell for cadmium adsorption. Chem. Eng. Technol.. 2022;45:1943-1951.
- [Google Scholar]


