

Translate this page into:
Optimization and stabilization of the antioxidant properties from Alkanet (Alkanna tinctoria) with natural deep eutectic solvents
-
Received: ,
Accepted: ,
This article was originally published by Elsevier and was migrated to Scientific Scholar after the change of Publisher.
Peer review under responsibility of King Saud University.
Abstract
Natural Deep eutectic solvents (NaDESs) are promising green solvents for the extraction of phytochemical compounds with antioxidant properties. In this study, we aimed to evaluate the behavior of the antioxidant properties of Alkanet (Alkanna tinctoria) root in hydrophilic NaDESs. For this purpose, two NaDESs constituted of sodium acetate:lactic acid (SALA12) and sodium acetate:formic acid (SAFA12) were synthesized to evaluate the antioxidant properties of Alkanet. 70% ethanol, 80% methanol and water were used as conventional solvents for comparison. SALA12 and SAFA12 were characterized considering their viscosities and FITR spectra. The extracts obtained with SALA12 and SAFA12 presented the best results when compared to the conventional solvents. The NaDES presented the highest extraction performance was SAFA12. This prominent NaDES was subjected to the response surface methodology using a Box-Behnken design to figure out the optimum conditions to have the maximum antioxidant activity of Alkanet root. For total phenolic content (TPC), total flavonoid content (TFC) and DPPH radical scavenging, the optimum conditions were 1:4 molar ratio, 45% water content and 25% mL solvent ratio. The confirmed responses at the optimum conditions were 390.16 mg GAE/g, 10.69 mg ECE/g and 444.68 mmol TE/g, respectively. NaDES molar ratio and water content were found to impact most significantly the antioxidant properties Alkanet. The thermal stability experimentation revealed that phytochemicals along with the antioxidant properties of Alkanet were more stable in NaDES. These findings revealed that novel NaDES is an efficient green solvent for the extraction of bioactive compounds with antioxidant properties from plants.
Keywords
Alkanna tinctoria
NaDES
Antioxidant properties
Response surface methodology
Thermal stability

1 Introduction
Alkanna tinctoria (L.) Tausch or Alkanet is one of the species belonging to the Boraginaceae family. It is a perennial plant with 40 cm height which grows wild in many countries throughout the Mediterranean areas. In Turkey, alkanet is naturally grown in the Mediterranean and Southern Anatolia regions. Its attractive flowers bloom during summer, especially from May to July. Alkanet is traditionally used not only as a dye but also as a food ingredient and preventive and curative remedy. The roots are surrounded by large cortex scales which have a dark reddish-brown color (Jaradat et al., 2018). Alkanet roots are multipurpose used in traditional communities and industries as a natural source of red pigments, including dye of cosmetics, food and textiles (Jaradat et al., 2018; Tung et al., 2012). Moreover, the roots are used as a natural remedy to prevent and to treat ulcers, wounds, fever, inflammation, aging and herpes (Abdel-gelil et al., 2019; Jaradat et al., 2018). The root extracts had effective effects as anticancer (Tung et al., 2012), antioxidant (Assimopoulou et al., 2004; Assimopoulou and Papageorgiou, 2005; Ozer et al., 2010; Rashan et al., 2018), antiwinkle (Jaradat et al., 2018), antipyretic, antinociceptive and sedative (Salih et al., 2016), wound cure (Gümüş and Karaman, 2017) and antimicrobial (Alwahibi and Perveen, 2017; Khan et al., 2015). These beneficial effects of Alkanet roots are associated with the properties of the phytochemical compounds they contain.
Naphthoquinones are the main phytochemical components extracted from Alkanet. The quinones and derivatives isolated from Alkanet roots included alkannin, shikonin, acetylalkannin, angelylalkannin, 5-methoxyangenylalkannin, acetylshikonin, dimethylacryl alkannin, naphtharzin, arnebifuranone, shikalkin, alkanfuranol and alkandiol (Assimopoulou et al., 2004; Assimopoulou and Papageorgiou, 2005; Tung et al., 2012). Furthermore, the presence of phenolic acids, flavonoids, glucosides, tannin, alkaloids and volatile oil has been reported in various extracts of the roots (Jaradat et al., 2018). The essential oil of Alkanet showed higher antioxidant activity and was composed mainly by pulegone, 1,8-cineole, α-terpinyl acetate and isophytol (Ozer et al., 2010).
The antioxidant properties of Alkanet have been evaluated only with the conventional solvents consisting of water, methanol, dichloromethane, ethyl acetate, acetone and ethanol (Jaradat et al., 2018; Assimopoulou et al., 2004; Ozer et al., 2010). Although these conventional solvents had a high performance for the extraction of phenolic compounds, they are associated with possible hazards such as inflammation, volatility, explosivity, toxicity and environmental pollution (Chemat et al., 2012). Therefore, many alternative eco-friendly solvents with less toxicity, low cost and high extractability have emerged (El Kantar et al., 2019).
Recently, Natural deep eutectic solvents (NaDESs) emerged as prominent, green and sustainable solvents for the extraction and optimization of phytochemical compounds from plants. NaDESs are a combination of two or more natural components consisting of hydrogen bond donor (HBD) and hydrogen bond acceptor (HBA) (Kadhom et al., 2017). The mixture HBA and HBD produces a green solvent having a strong supramolecular structure, low melting point, non-toxic, renewable, cheaper and easily preparable (Cunha and Fernandes, 2018; El Kantar et al., 2019; Kadhom et al., 2017; López et al., 2020; Martins et al., 2019; Wei et al., 2015). Many different kinds of NaDESs are formulated and tested for their extraction performance of polyphenols. It resulted that they had higher extractability performance when compared to the conventional solvents since NaDESs could form a strong intramolecular structure with the solute (Dai et al., 2015; Saha et al., 2019). Moreover, NaDESs have shown higher performance for the extraction, detection of polyphenols and characterization of antioxidants properties of many plants, byproducts and waste (Balaraman et al., 2020; Barbieri et al., 2020; Chakroun et al., 2019; Dai et al., 2014; Saha et al., 2019; Wei et al., 2015). However, the high viscosity of NaDESs is the limiting factor affecting their applicability. Therefore, the addition of some quantity of water has been suggested to tailor the NaDESs viscosity (Aroso et al., 2017; Dai et al., 2013).
To best of authors’ knowledge, no published studies investigating the antioxidant properties of Alkanet roots using the NaDESs had been found in the existing literature. In the present study, two hydrophilic natural deep eutectic solvents were synthesized to evaluate the antioxidant properties of Alkanet (Alkanna tinctoria) for the first time. The new hydrophilic NaDESs were composed of HBA (sodium acetate) and HBD (formic acid and lactic acid) with the addition of water. The effect of the addition of water on the antioxidant activities of Alkanet was determined. Water, ethanol and methanol were used as conventional solvents for comparison. In addition, the ultrasound-assisted extraction (UAE) was carried out to enhance the extraction performance. The most prominent NaDES was selected for the optimization using Box Behnken design along with Response Surface Methodology and for the thermal stability tests.
2 Material and methods
2.1 Plant material and chemicals
A. tinctoria root was collected from Iğdır province, Turkey. The root was cleaned, packed into sterilized brown bottles and kept at 4 °C for further use. Before analysis, the root was powdered by a disintegrator (sinbo, coffee and spice grinder, SCM 2934) and sieved. Distilled water was purified by a Millipore-Q system (Millipore Billerica, Massachusetts, USA).
Methanol (≥99.8%), 2,2- diphenyl-1-picrylhydrazyl (DPPH), 2,4,6-tris(2-pyridyl)-s-triazine (TPTZ, ≥99.0%), Trolox (97%), sodium nitrite (99–100.5%), hydrochloric acid (36.5–38%), (−)- epicatechin, gallic acid (≥99.0), lactic acid (≥85%) and sodium carbonate (99.5–100.5%) were purchased from Sigma-Aldrich. Ethanol (≥99.9%) was bought from Isolab. Folin-Ciocalteu reagent, aluminium chloride, iron (III) chloride, iron sulfate heptahydrate (≥99.5%) and formic acid (98–100%) were brought from Merck. Sodium acetate anhydrous (≥99.0%), glacial acetic acid (99.5%), potassium chloride (≥99.0%) and Sodium hydroxide (≥97.0%) were taken from Carlo erba.
2.2 NaDES preparation
The NaDESs were prepared following the procedures detailed in El Kantar et al. (2019) and Wei et al. (2015) with some changes. The NaDESs were synthesized as molar ratio of two different components consisting of hydrogen bond donor (HBD) and hydrogen bond acceptor (HBA), followed by the addition of 20% of distilled water. Sodium acetate was used as HBA and formic acid and lactic acid were used as HBD (Xu et al., 2015; Pal and Jadeja, 2020). In this study, NaDES components were placed in reaction flask by heating at 75 °C with constant stirring for 2 h30 min until a homogeneous liquid was obtained.
2.3 Rheology
The rheological characteristics of NaDESs were monitored based on the viscosities. The viscosity of NaDESs was determined with a Rheometer (Buchi, CH-9230 Flawil 1, Switzerland) fitted with a parallel geometry with 20 mm of diameter and gap 1 mm. The measurements were carried out as described in Aroso et al. (2017). All the measurements were performed in triplicate at 20 °C.
2.4 Fourier transformed infrared (FTIR) analysis
FTIR analysis of NaDESs and extracts was carried out using a FTIR Spectrometer ((Perkin Elmer, Spectrum-Two, USA, PEService 35). Diamond lens attenuated resistance was used. The spectrometer was adjusted in resolution 4 and by selecting the Norton-Beer (N-B) strong apodization function. The range of all spectra was between the wavenumbers of 4000 and 400 cm−1. Before every spectrum, a background reference was taken using an empty cell to ensure no interferences. Then, spectrum intensity was transformed into relative transmittance, %T.
2.5 Extraction
The extraction of phytochemical compounds with antioxidant activity was achieved in both conventional and NaDESs media using an ultrasound. The ultrasound-assisted extractions (UAE) were performed in a sonication water bath (WUC-A03H, ultrasonic cleaner set, daihan scientific Co., Ltd). Distilled water, 70% ethanol and 80% methanol were considered in present work as conventional solvents due to their high extractability of polyphenols. 0.25 g of comminuted A. tinctoria root was mixed with 10 mL of conventional solvents and NaDESs. The sonication was carried out following a modified previous method (Zhao et al., 2020). The mixture was ultrasonicated in an ultrasonic bath at room temperature (25 °C) for 20 min. The samples were then filtered through Whatman filter paper No.1 thrice.
2.6 Determination of total phenolic content (TPC)
The TPC of A. tinctoria extracts was determined using a previous Folin-Ciocalteu method with modification (Maran, 2013; Zannou et al., 2020). Briefly, an aliquot of 150 μL of the diluted extract was mixed 750 mL of 10% Folin-Ciocalteu reagent. The mixture was shaken for 1 min before adding 600 mL of 7.5% sodium carbonate solution. The mixture was shaken again and placed in the dark for 2 h before reading absorbance. The absorbance was read at 760 nm in an UV-spectrophotometer (Thermo Spectronic) and the TPC was calculated from a calibration curve using gallic acid as a standard. The results were given as mg gallic acid equivalent (GAE) g−1 dw.
2.7 Determination of total flavonoid content (TFC)
The TFC was determined using a modified protocol (Hossain and Shah, 2015; Lakka et al., 2019). 1 mL of the diluted solution was combined with 0.3 mL of 5% NaNO2 and left to stand for 5 min, followed by the addition of 0.5 mL of 5% AlCl3. The mixture was kept for 6 min before adding 0.5 mL of 1 M NaOH. After 10 min, the absorbance was read at 510 nm. The TFC was estimated based on a calibration curve using epicatechin as standard. The results were given as mg epicatechin equivalents (ECE) g−1 dw.
2.8 Determination of the DPPH radical scavenging activity
The DPPH radical scavenging was determined using a modified method (Hossain and Shah, 2015; Singh et al., 2015). Briefly, an aliquot of 50 μL sample was added with 1 mL DPPH solution (0.06 mM in 80% methanol). The mixture was shaken and left to stand in dark for 1 h until the reaction completed. Thereafter, the absorbance at 517 nm was recorded. The DPPH solution was used as control. The reduction ratio of DPPH was determined with the following equation:
2.9 Determination of ferric reducing antioxidant power (FRAP)
FRAP assay was performed according to the procedure of Shang et al. (2019) and Singh et al. (2015). Briefly, an aliquot of 50 µL volume of sample was mixed with 950 mM of FRAP solution constituted of 100 mM acetate buffer: 10 mM FeCl3: 10 mM TPTZ (2,4,6-tripyridyl-s-triazine). The assembly was shaken for about 5 min and the absorbance was read at 593 nm against a blank. The FRAP values of the extracts were calculated from the calibration curve using FeSO4 as a standard. The results were given as mmol FeSO4 equivalents (mmol ISE g−1 dw).
2.10 Optimization plan
The optimization parameters of the NaDES were examined systematically using response surface methodology based on the three-level Box-Behnken design (Design expert software 11.0). The experimental design was carried out with three independent variables of X1 (SAFA molar ratio), X2 (water content) and X3 (solvent-to-solid ratio). The actual and coded values of the independent variables were presented in Table 1. The association of the molar ratio of sodium acetate (1) to formic acid (1, 2 and 4), water content (10%, 45% and 80%) and solvent-to-solid ratio (10:0.25, 17:0.25 and 25:0.25 mL/g) were independent variables chosen for UAE. These variables were regrouped in 15 experimental points including three replicate at the central point. Total phenolic content, total flavonoid content and DPPH radical scavenging activity were investigated as the responses (Y) for the design experiment. The experimental points along with responses were given in Table 2. The analyses were performed in duplicate. The experimental data were fitted to the following quadratic polynomial model:
X1 (Water content %); X2 (molar ratio) and X3 (Solvent ration, mL).
Coded values
Actual values
X1
X2
X3
−1
10
1:1
10
0
45
1:2
17
+1
80
1:4
25
Run
Coded values
Analytical responses
X1
X2
X3
TPC (Y1), mg GAE/g
TFC (Y2), mg ECE/g
DPPH radical scavenging (Y3), mmol TE/g
1
−1
−1
0
71.27
3.57
48.79
2
1
0
−1
267.23
6.61
237.31
3
−1
1
1
347.22
10.69
349.00
4
1
1
0
277.62
6.91
228.69
5
−1
0
−1
214.29
5.26
191.29
6
0
−1
1
258.56
1.37
205.32
7
0
0
0
306.49
6.21
283.71
8
−1
1
0
348.24
9.46
260.59
9
1
−1
0
260.27
5.33
205.32
10
0
1
−1
345.04
10.14
252.86
11
0
0
0
297.95
4.70
245.47
12
0
0
0
259.05
3.70
276.59
13
0
−1
−1
258.30
5.01
208.62
14
1
0
1
294.47
9.54
294.51
15
–
0
0
249.81
6.13
279.79
2.11 Thermal stability
5 mL of A. tinctoria extracts were put into the brown bottles with screw caps and placed in a preheated water bath at 80, 60 and 40 °C. The bottles were removed from the water bath after 2 h and cooled to room temperature. The first-order reaction rate constant (k) and activation energy (Ea) were used to express the kinetic modeling of degradation of TPC, TFC, DPPH radical scavenging and FRAP during the thermal treatment of A. tinctoria in NaDES (Dai et al., 2014; Olivares-tenorio et al., 2017).
2.12 Data and statistical analyses
The software Design Expert 11.0 (Trial version, Stat-Ease Inc., Mineapolis, USA) was used to design the experimentation along with data analysis. ANOVA was used to determine the statistical relationship between factors. The adequacy of the models obtained was ascertained by screening the R2, adjusted R2, coefficient of variation (CV) and the value of Fisher’s test (F-value). The significance of the models and regression coefficients were measured at p < 0.05. The relationship between independent variables and responses was checked by 3D graphics. The optimum conditions were determined according to the desirability function. One-way statistical analyses were carried out by ANOVA with post-hoc Duncan’s test using SPSS (version 21). The significance of the results was assessed at p ≤ 0.05.
3 Results and discussion
3.1 Characterization of NaDESs
The viscosity of NaDESs destined for extraction phytochemical compounds is a key element. The very high viscosity would adversely impact the extraction yield of phytochemical compounds since it hinders the mass transfer to be appropriately achieved (Wei et al., 2015). In the present study, two NaDESs composed of hydrogen bond acceptor (sodium acetate) and hydrogen bond donor (lactic acid and formic acid) in 1:2 M ratios were formulated (Xu et al., 2015; Pal and Jadeja, 2019; Zhao et al., 2020). The viscosity of these NaDESs was tailored by adding 20% of distilled water to enhance the extraction abilities (Obluchinskaya et al., 2019; Rajha et al., 2019; Saha et al., 2019). The NaDES sodium acetate:lactic acid was encoded SALA12 while sodium acetate:formic acid was SAFA12. The viscosity determined for SAFA12 was 46.25 ± 6.83 m.Pa while SALA12 exhibited a viscosity of 56.49 ± 7.68 m.Pa (Table 3). The highest viscosity was detected with SALA12 and the lowest with SAFA12. *ND means not determined; Same letters in the column mean no statistical difference p ≤ 0.05; Means values are given as dry basis.
Solvents
TPC, mg GAE/g
TFC, ECE mg/g
DPPH radical scavenging, mmol TE/g
FRAP, mmol ISE/g
Viscosity, m.Pa
pH
SALA12
170.96 ± 8.10a
3.82 ± 0.63b
112.31 ± 14.69ab
170.43 ± 26.29a
56.49 ± 7.68
3.41 ± 0.01
SAFA12
175.97 ± 13.58a
4.78 ± 0.25a
130.91 ± 5.56a
148.58 ± 16.87ab
46.25 ± 6.83
3 ± 0.01
Water
86.79 ± 7.24b
4.60 ± 0.42ab
97.39 ± 10.26b
55.47 ± 8.64d
ND
ND
70% ethanol
49.71 ± 3.83c
1.93 ± 0.21c
75.24 ± 7.83c
96.11 ± 6.35c
ND
ND
80% methanol
33.12 ± 2.14d
2.14 ± 0.66c
74.07 ± 11.17c
140.81 ± 7.81b
ND
ND
The pH is an essential factor influencing the performance of NaDESs (Duan et al., 2016; Chakroun et al., 2019). It exerts a crucial role in chelate formation and stability, affecting the recovery of targeted analyte (Zounr et al., 2018). The pH of SALA12 and SAFA12 were assigned in Table 3. As can be seen, the lowest pH was detected with SAFA12 (pH 3), while the highest pH was found with SALA12 (pH 3.41). Similarly, García et al. (2016) have reported pH 2 and pH 0.5 in choline chloride:lactic acid (1:2) and choline chloride:malonic acid, respectively.
The FTIR spectra (Fig. 1) were used to identify the functional groups and feature reactions that occur between HBA (sodium acetate) and HBD (lactic acid and formic acid). To the best of the authors’ knowledge, no study describing the FTIR frequencies of the studied NaDESs has been published so far. As shown in Fig. 1a, the FTIR analysis of SAFA12 revealed that the peak at 3418.98 cm−1 was associated to O— H stretching frequency of water denoting the effective presence of water in the medium. The peak at 2932.93 cm−1 could be associated to the stretching frequency of C— H of sodium acetate (Jones and Mclaren, 1954) and formic acid. The peak at 2540.17 cm−1 was assigned to O— H stretching frequency of formic acid since the peaks ranged between 2500 and 3000 cm−1 are due to the O— H stretching of the acid component. The strong frequencies obtained at 1705.71 and 1575.23 cm−1 were related to the stretching C⚌O of formic acid and sodium acetate, respectively. The rock C—H of formic acid was obtained at 1375.18 cm−1. Also, 1375.18 cm−1 could be considered as the stretching frequency of C—O of sodium acetate. The lower range of the region below 1200 cm−1 generally represents different kinds of C—H, C—O and CH3 vibrations (rocking, deformation and stretching) (Tripathi et al., 2015). These findings indicated the homogenization of the mixture and the formation of a strong network between the functional groups of NaDES sodium acetate:formic acid were effective.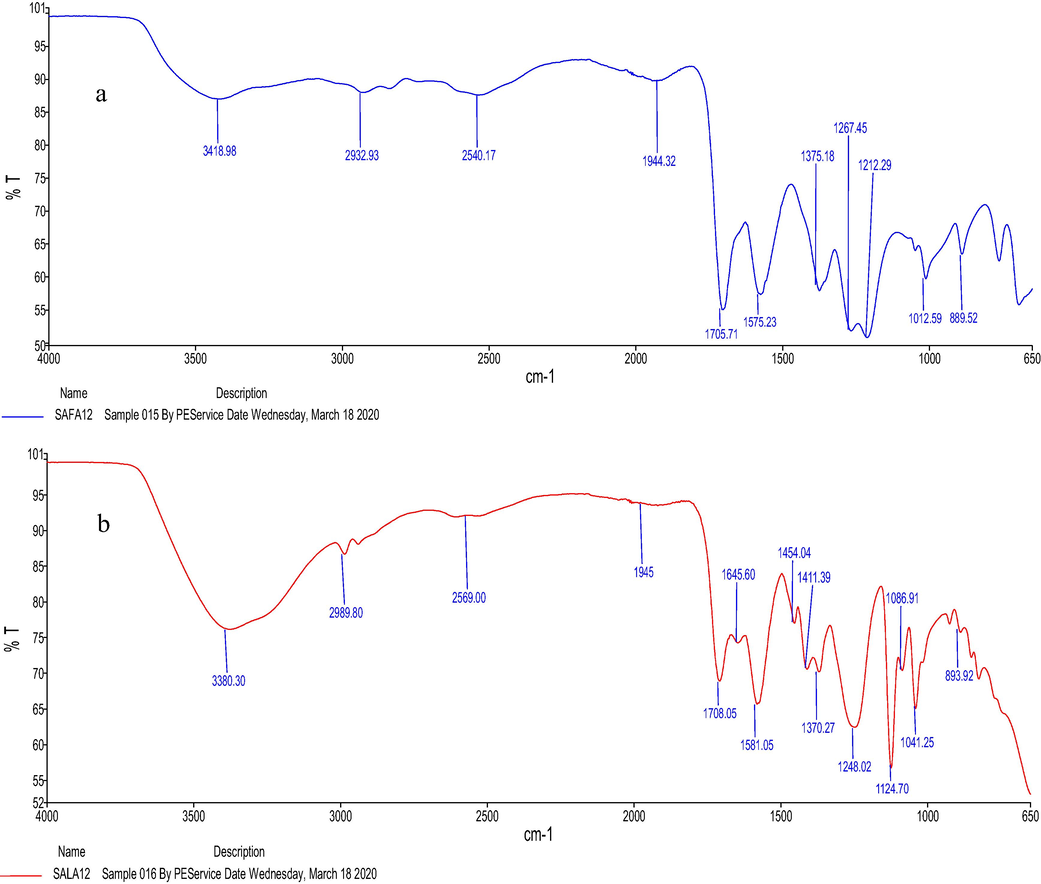
FTIR spectrum of (a) SAFA12 and (b) SALA12.
Fig. 1b presented the FTIR spectrum of SALA12. As can be seen, the peak at 3380.30 cm−1 was associated to O—H stretching frequency of water and lactic acid. This peak was found to be larger than O—H stretching peak obtained in Fig. 1a, since it rose from water and lactic acid. The peak at 2989.80 cm−1 was the stretching frequency of C—H of sodium acetate (Jones and McLaren, 1954) and lactic acid. The peak at 2569.00 cm−1 was assigned to O—H stretching frequency of lactic acid. The strong frequencies obtained at 1708.05 and 1581.05 cm−1 were assigned to the stretching C⚌O of lactic acid and sodium acetate, respectively. The C⚌O stretching band of lactic acid shifted to 1645.60 cm−1. The band at 1454.04 cm−1 was for CH3 deformation present in sodium acetate and lactic acid, while the band at 1411.39 cm−1 was C—O stretching of sodium acetate. The peak frequencies of 1370.27 and 1248.02 cm−1 were related to the CH bend and OH bend, respectively. The bands ranged from 1200 to 950 cm−1 explained the stretching modes of C—C and C—O functional groups of lactic acid. These results explained the effectiveness of the presence of NaDES components in the mixture and the formation of a strong network between the functional groups of NaDES sodium acetate:lactic acid.
3.2 Evaluation of NaDESs efficiency
There are many intrinsic characteristics notably diffusion, surface tension, viscosity, density, polarity, physicochemical interactions and solubility (Bi et al., 2013; Wei et al., 2015) which influence the extraction efficiency of NaDESs. The results showing the extraction performance of SAFA12 and SALA12 together with conventional solvents were presented in Table 3 and Fig. 2. The values of TPC, TFC, DPPH radical scavenging and FRAP values were ranged from 33.12 to 175.97 mg GAE/g, 1.93 to 4.78 mg EGE/g, 74.07 to 130.91 mmol TE/g and 55.47 to 170.43 mmol ISE/g, respectively. These results are in accordance with the values previously reported (Jaradat et al., 2018; Assimopoulou et al., 2004; Assimopoulou and Papageorgiou, 2005). As can be seen, the values of TPC, TFC, DPPH radical scavenging and FRAP were found to be higher in SAFA12 and SALA12. Similarly, the NaDES sodium acetate:lactic acid has provided the best extraction performance of phenolic compounds from mango (Pal and Jadeja, 2019). The conventional solvents such as water, 70% ethanol and 80% methanol displayed the lowest extractability performance compared to the NaDESs. The hydrophilic NaDESs have been revealed to be appropriate extraction solvents compared to the conventional solvents (El Kantar et al., 2019; Saha et al., 2019). The high extractability efficiency of SAFA12 and SALA12 could be linked with the multiple hydrogen-bonding networks generated during their formulation and the introduction of water to tailor their viscosity. The acid-based NaDESs have been reported to be adequate for the extraction of phenolic compounds, since they conferred strong H-bonding interactions amongst components and presented the low viscosity (Lakka et al., 2019; Y. Liu et al., 2019; Zhou et al., 2018). Furthermore, polyphenols are assigned to a type of hydrogen bond donor since they interact firmly with acetate anions leading to their higher solubility and satisfactory extraction performance (Bakirtzi et al., 2016). As shown in Table 3, SAFA12 displayed the highest extraction yield of TPC (175.97 mg GAE/g), TFC (4.78 mg EGE/g) and DPPH radical scavenging (130.91 mgTE/g) from A. tinctoria root. This might be explained by the difference in the viscosities of NaDESs, since SAFA12 displayed lower viscosity compared to SALA12. Saha et al. (2019) have reported that lowering the viscosity enhances the cavitational process and allows the formation of a stronger H-bonding between the NaDESs and solute, enhancing the extraction yield and capacity. In addition, the higher performance of SAFA12 could be related to the pH, since it displayed a lower pH than SALA12. It has been demonstrated that the most acidic NaDESs have shown the highest yields of bioactive compounds with antioxidant properties (García et al., 2016; Duan et al., 2016). Therefore, the NaDES SAFA12 was chosen for further investigation.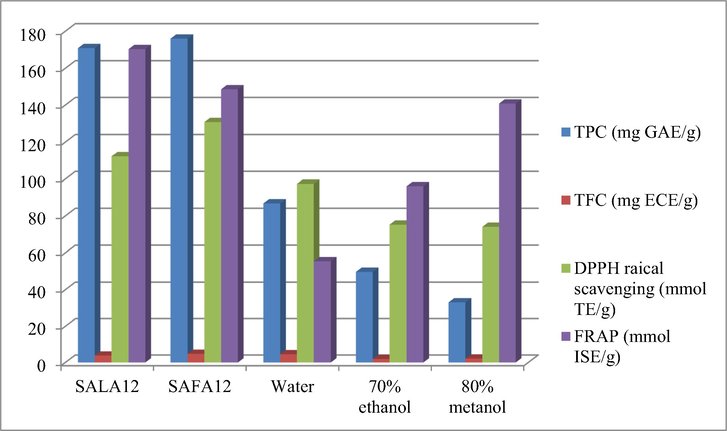
Extraction performance of NaDESs and conventional solvents.
3.3 Optimization of NaDES and extraction conditions
The influence of molar ratio, water content and liquid-to-solid ratio was studied in order to optimize the values of TPC, TFC, DPPH radical scavenging and FRAP of A. tinctoria root. A three-level Box-Behnken design (Design expert software 11.0) was used to design the experimentation profile. A total of 15 experimental points with three replication in the central point was generated and investigated. The responses and the coded independent factors of all the experimental points were shown in Table 2.
3.3.1 Model analysis
The results of response surface methodology were displayed in Table 2. TPC values were ranged from 71.67 to 348.24 mg GAE/g and TFC values ranged from 1.37 to 10.69 mg ECE/g. The values of DPPH radical scavenging activity were ordered between 48.79 and 349.00 mmol TE/g. The highest TPC was detected at run 8 (1:4 M ratio, 10% water content and 17 mL solvent ratio), while the highest TFC and DPPH radical scavenging were found at run 3 (1:4 M ratio, 45% water content and 25 mL solvent). The lowest TPC and DPPH radical scavenging were observed at 1 run (1:1 M ratio, 10% water content and 17 mL solvent ratio) while the minimum TFC was identified at run 6 (1:1 M ratio, 45% water content and 25 mL solvent ratio). The lowest responses were figured out at the runs with 10% water content and 1:1 M ratio, indicating that the viscosity was very high and the molar ratio was inadequate. 15–30% of water content has been suggested to enhance polyphenols compounds extraction performance of many NaDESs since very high viscosity of NaDESs limited the mass transport and decreased extractability efficiency (El Kantar et al., 2019; Y. Liu et al., 2019; Shang et al., 2019; Wei et al., 2015; Zhou et al., 2018). The maximum responses were obtained with 1:4 M ratio, indicating the availability of carboxyl group (—COOH) capable to initiate hydrogen-bonding and to increase NaDESs performance. These findings revealed the importance of viscosity and molar ratio in phenolic compounds extractability of NaDESs.
The analysis of the optimization models was made following the regression coefficients which were indicated at the least square for the second-order quadratic polynomial models. The reduced second-order equations in actual factors terms were used to express the proposed model, as the equation in terms of actual factors can be used to make predictions about the response for given levels of each factor. The non-significant factors were stepwise removed from the polynomial model. The reduced second-order models in terms of actual factors for the responses such as TPC, TFC and DPPH radical scavenging of A. tinctoria as a function of water content (X1), molar ratio (X2) and solvent ratio (X3) were obtained as follows:
These equations translate the response patterns for individual measurement and complexity of possible sceneries. The sign of the parametric value determines part of the response; for positive effects, the response is higher at the high level and when a factor has a negative effect, the response is lower at high level. Additionally, the higher of the parametric value, the more significant the weight of the governing variable is (Vieira et al., 2018). The results of the ANOVA of each response were presented in Table 4. The model developed for TPC was significant at p < 0.0002 and had satisfactory R2 (0.8740), adjusted R2 (0.8236), CV (11.48%) and adequate precision (10.3735). The R2 and adjusted R2 of the model developed were very close. Thus, there was a good conformity between the experimental and predicted values, proving that they can be used for the prediction and optimization stages (Vieira et al., 2018). The predicted R2 of 0.6458 is in reasonable agreement with the adjusted R2 of 0.8236; i.e. the difference is less than 0.2. Furthermore, the model of TPC presented a non-significant lack of fit, suggesting that the model was a good fit. The model generated for TFC was significant at p < 0.0006, but R2 (0.6076) and adjusted R2 (0.5774) were poor but close, indicating that there was satisfactory conformity between the experimental and predicted values. The model can be used to explore the design, since it had an adequate precision ratio (8.47) higher than 4. The predicted R2 of 0.4796 is in reasonable agreement with the adjusted R2 of 0.5774; i.e. the difference is less than 0.2. The lack of fit was non-significant indicating that the developed model was a good fit. However, the response surface methodology was unable to develop an appropriate model which describes better the TFC of A. tinctoria root extracted with sodium acetate:Formic acid NaDES, since R2 (0.6076) and adjusted R2 (0.5774) poor (Odabaş and Koca, 2016). Regarding to the model generated for DPPH radical scavenging, higher R2 (0.8717) and adjusted R2 (0.7754) were obtained along with a significant term at p < 0.0152. The R2 and adjusted R2 of the developed model were high and very similar. Thus, the model presented good conformity between the experimental and predicted values. Moreover, the model of DPPH radical scavenging generated a non-significant lack of fit, indicating that the model was a good fit. SS: Sum of squares.
TPC
TFC
DPPH radical scavenging
SS
F-value
p-value
SS
F-value
p-value
SS
F-value
p-value
Model
55916.97
17.34
0.0002
60.57
20.13
0.0006
54650.21
9.06
0.0033
X1
–
–
–
–
–
–
–
–
–
X2
25876.56
32.10
0.0002
60.57
20.13
0.0006
22925.14
22.25
0.0015
X3
–
–
–
–
–
–
8441.92
7.43
0.0260
X12
15541.12
19.28
0.0014
–
–
–
7517.09
7.44
0.0259
X13
–
–
–
–
–
–
–
–
X23
–
–
–
–
–
–
–
–
–
X11
8198.00
10.17
0.0097
–
–
–
–
7.40
0.0262
X22
–
–
–
–
–
–
11567.58
12.29
0.0080
X33
–
–
–
–
–
–
–
–
–
Residual
8060.79
39.12
8046.01
Lack of Fit
6781.66
1.33
0.4990
35.95
2.06
0.3720
7218.73
2.91
0.2778
Total
63977.75
99.69
62696.22
R2
0.8740
0.6076
0.8717
Adj-R2
0.8236
0.5774
0.7754
Pred-R2
0.6458
0.4796
0.4923
C.V. %
11.48
27.49
13.33
Adeq Precision
14.36
8.47
11.14
3.3.2 Effects of independent variables on TPC
The linear and quadratic terms of the response surface methodology models developed for TPC of A. tinctoria root were shown in Table 4. The model showed that the molar ratio was the most significant linear variable having effects on TPC with F values of 32.10 (p < 0.0002), which means that it is needed for complete understanding of the behavior of this response. The linear values of water content and solvent ratio had no significant effects on TPC. The interaction of the linear units of water content and molar ratio had significant impacts on TPC with F value 19.28 (p < 0.0014). Likewise, only the quadratic term of water content had the most significant impact on TPC with F values of 10.17 (p < 0.0097). The 3D response surface graphics (Fig. 3) were generated to interpret the effects of the combinations of water content and molar ratio, of water content and solvent ratio and of molar ratio and solvent ratio on TPC. As can be seen, the couple of variables water content and molar ratio had significant effects on TPC and occurred a rapid augmentation of this response when increased and this behavior of TPC was most accentuated when the molar ratio was incremented. The availability of H-bond donors elevated when the molar ratio increased, leading to the formation of a stronger hydrogen network between NaDES components and solute. Such phenomenon facilitates the dissolution of phenolic compounds in NaDESs, improving the extraction efficiency (Peng et al., 2015; Saha et al., 2019). The increase in water content demonstrated a beneficial effect on TPC as the highest value was obtained 80% of water content (Fig. 3). Similar reaction has been observed during the optimization of polyphenols from olive leaf (Alañón et al., 2020), as the salt-based NaDES are too anhydrous forming a plastic solid at low water content. Lowering the viscosity by adding water enhanced the efficiency of sodium acetate:formic acid NaDES for the extraction of polyphenols of A. tinctoria. The quantity of water required to extract the maximum phenolic compounds depends on the intrinsic characteristics of NaDESs, the raw material and the targeted phytochemical compounds. For example, 10, 20, 25, 30, 50 and 60% of water content in various NaDESs have been reported as the appropriate required water to perform higher efficiency the extraction of phenolic compounds many plant materials (Barbieri et al., 2020; Buldo et al., 2019; Cui et al., 2015; Jancheva et al., 2017; Ozturk et al., 2018; Wei et al., 2015). Nonetheless, some quantity of water should not be overpassed (Alañón et al., 2020) else, the eutectic structure of the mixture would break down (Dai et al., 2013). The solvent ratio was almost indifferent to the response surface carried out for TPC, indicating a positive character in economic terms. Moreover, larger solvent volumes negatively impact the efficiency and the economic feasibility, generating unnecessary byproducts (Zhang et al., 2014).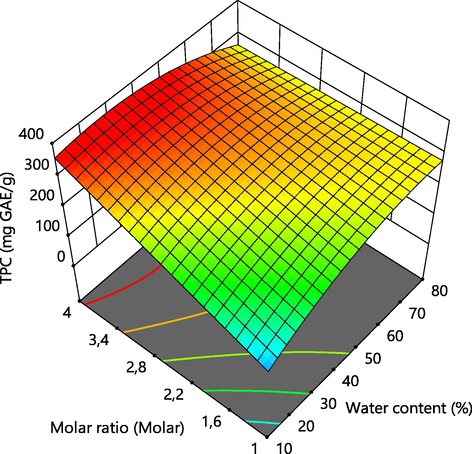
Effect of independent variables on TPC.
3.3.3 Effects of independent variables on TFC
The linear and quadratic terms of the response surface methodology models developed for TFC of A. tinctoria root were given in Table 4. The developed model showed that the linear term of molar ratio was the most significant linear unit having effects on TFC with F value 20.13 (p < 0.0006). The linear values of water content and solvent ratio had no significant effects on TFC. No quadratic term had significant on the TFC since all the quadratic terms displayed p-values higher than 0.05. The response surface plot showing the effect of molar ratio on TFC was presented in Fig. 4. As can be seen, the increase in molar ratio linearly generated an increase on the response TFC. The extraction of flavonoid compounds with NaDESs was reported to be strongly dependent to the extraction conditions, NaDESs components, molar ratio, solvent ratio and water content (Bajkacz and Adamek, 2017; Wei et al., 2015; Xiong et al., 2019; Zhuang et al., 2017).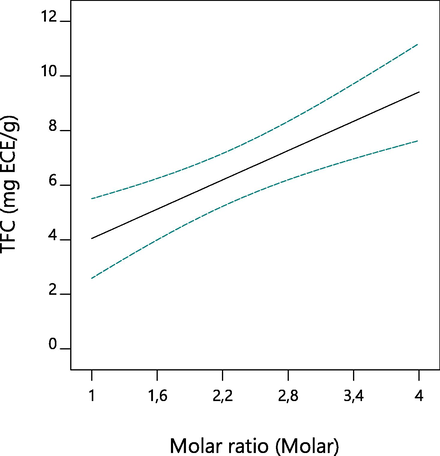
Effect of independent variables on TFC.
3.3.4 Effects of independent variables ratio on DPPH radical scavenging
The linear and quadratic terms of the response surface methodology models developed for DPPH radical scavenging of A. tinctoria root were presented in Table 4. The analysis of the model revealed that linear units of molar ratio and solvent ratio exhibited significant effects on DPPH radical scavenging with F values 22.25 (p < 0.0015) and 7.43 (p < 0.0260), respectively. The interaction of the linear units of water content and molar ratio had significant impacts on DPPH radical scavenging with F value 7.44 (p < 0.0259). Furthermore, the quadratic terms of water content and molar ratio were found to have important impacts on DPPH radical scavenging with F values of 7.40. (p < 0.0262) and 12.29 (p < 0.0080), respectively. The 3D response surface plots showing the behavior of DPPH radical scavenging against independent variables were given in Fig. 5. The couple variables molar ratio and water content showed a pronounced positive action occurring the augmentation in DPPH radical scavenging when increased. However, the pair variables of solvent ratio and water content and of molar ratio and solvent had moderate increasing effects independently of the linear variable solvent ratio. Similar behavior has been observed with TPC, suggesting that the DPPH values are dependent to the concentration of phenolic compounds at a certain degree. Such observations have been remarked for many foods and wastes (Makris et al., 2007; Pal and Jadeja, 2020, 2019).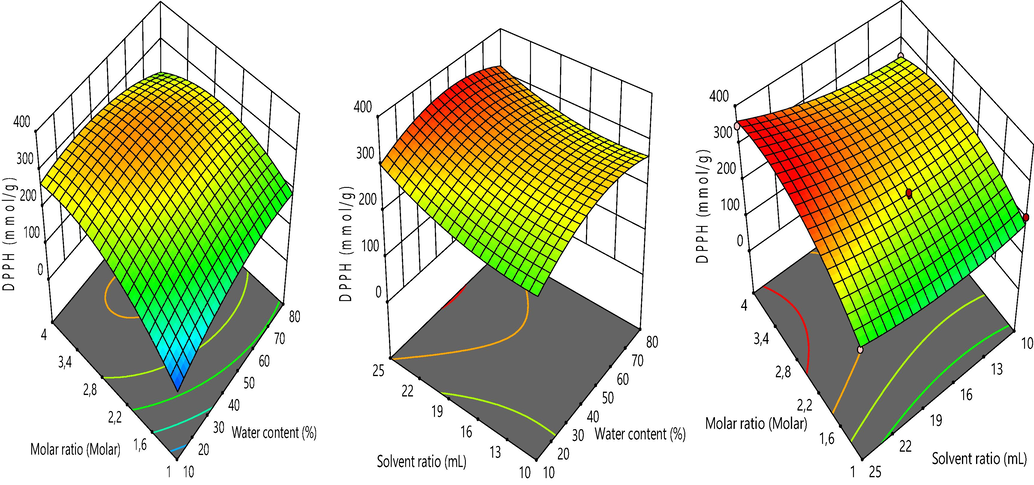
Effect of independent variables on DPPH radical scavenging.
3.3.5 Multi-response optimization on the responses
The analysis of the 3D graphics revealed that the TPC, TFC and DPPH radical scavenging values were strongly influenced by molar ratio and water content. Recently, it was demonstrated that the variation in molar ratio and water content of NaDESs affected deeply the extraction of phenolic compounds with antioxidant properties from agricultural products (Dai et al., 2014; Lakka et al., 2019; X. Liu et al., 2019; Ozturk et al., 2018; Saha et al., 2019). The increase in molar ratio caused a rapid increment of TPC, TFC and DPPH radical scavenging values of A. tintoria. The highest responses were figured out at 1:4 M ratio, while the lowest values were found at a low molar ratio 1:1. This is due to the carboxyl group (—COOH) and sodium cation (—Na+) from sodium acetate which would associate with the carboxyl group (—COOH) or the hydroxyl group (—OH) of formic acid when the molar ratio of formic acid is augmented. A lower molar rate of formic acid would imply the non-bonding of some specific groups from HBA. This phenomenon leads to the precipitation of NaDESs (Dai et al., 2013; Y. Liu et al., 2019). Furthermore, the maximum responses were obtained by increasing the water content up to 80%.
The response surface methodology was carried out to determine the optimum conditions to obtain the maximum TPC, TFC and DPPH radical scavenging values of A. tinctoria. The optimum conditions were identified with the desirability function. The optimum conditions to maximize the phenolic compounds and antioxidant properties of A. tinctoria were 1:4 M ratio, 45% water content and 25% mL solvent ratio. Under these optimum conditions, the predicted TPC, TFC and DPPH radical scavenging values were 365.71 mg GAE/g, 10.56 mg ECE/g and 361.91 mmol TE/g, respectively. For confirmation, analyses were carried out in triplicate under optimum conditions. The experimental results were presented as 390.16 mg GAE/g, 10.69 mg ECE/g and 444.68 mmol TE/g for TPC, TFC and DPPH radical scavenging, respectively. These findings confirmed the reliability and reproducibility of the optimum parameters. The NaDES obtained for the optimum conditions (1:4 M ratio and 45% water content) was encoded as SAFA14 for further analyses.
3.4 Characterization of SAFA14 and the optimum extract
The SAFA14 and the extract obtained at the optimum conditions were characterized to determine their rheological properties and structural features. For the rheological characterization, the viscosities of these samples were measured. The viscosities of SAFA14 and extract were determined as 8.6 ± 14.12 and 7.53 ± 3.26 m.Pa, respectively. As can been, the viscosities of SAFA14 and extract were very close, explaining the complete dissolution of the sample with NaDES during the extraction process. Thus, this resulted in the augmentation of the extraction yield. Furthermore, the viscosity of the extract was slightly low due to the application of temperature (25 °C) during the sonication. For the evaluation of structural features, the analysis FTIR spectra revealed that the FTIR spectrum of SAFA14 and SAFA12 were very similar (Fig. 6), denoting that both spectra possessed the same functional groups and then same components. However, the intensities of the frequencies at 3418.98, 1705.71 cm−1 were higher in SAFA14 when compared with SAFA12, indicating there are more water and acid in SAFA14. The FTIR spectra of SAFA14 and extract were shown in Fig. 7. As can be seen, the extract was a replicate of SAFA14. This confirmed the results of rheological properties and indicated SAFA14 inlaid the sample as its own component.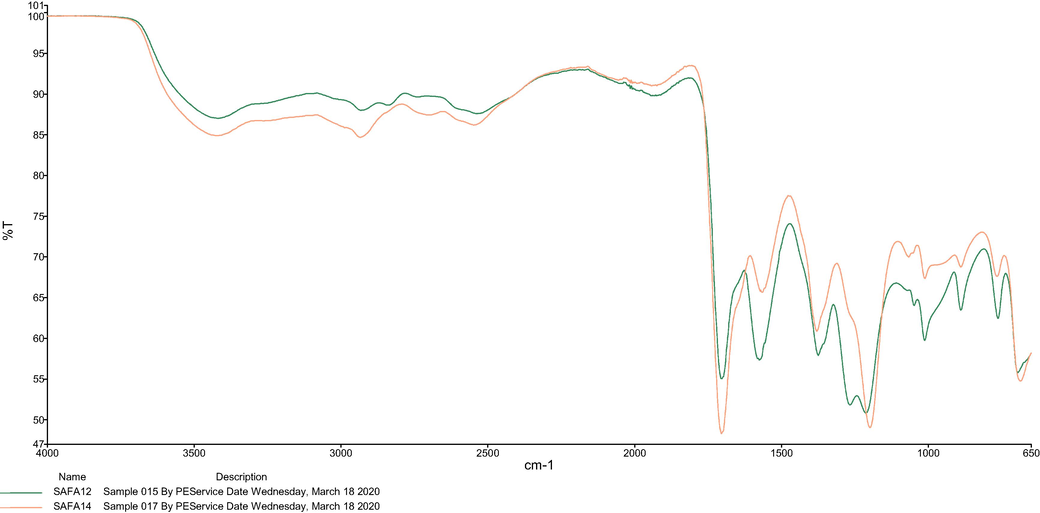
FTIR spectra of SAFA12 and SAFA14.
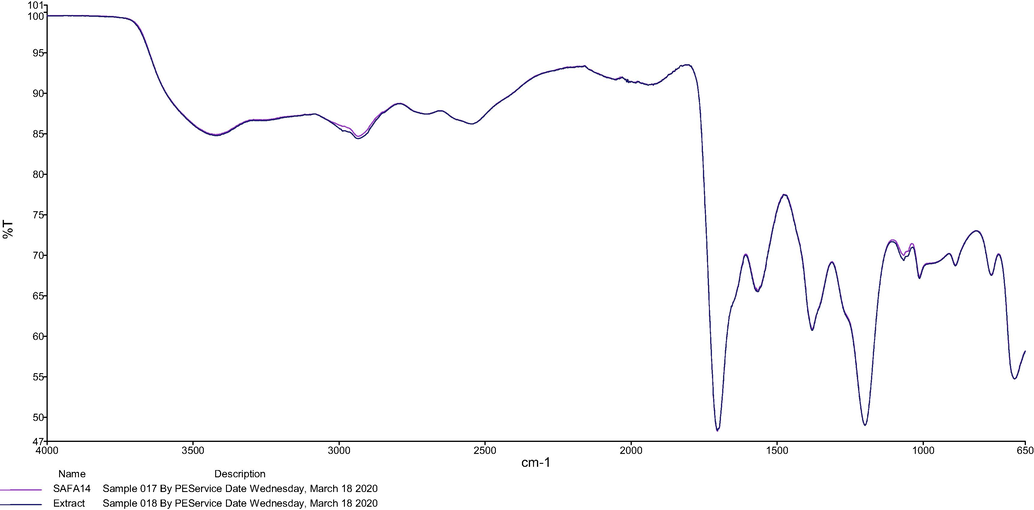
FTIR spectra of SAFA14 and extract.
3.5 Thermal stability of TPC, TFC, DPPH radical scavenging and FRAP in NaDES
The thermal effects on TPC, TFC, DPPH radical scavenging and FRAP values of the NaDES extract of A. tinctoria root were determined by applying 40, 60 and 80 °C for 2 h. The first-order kinetics (k) and activation energy (Ea) expressing the thermal degradation of TPC, TFC and antioxidant properties of A. tinctoria root in NaDES were calculated. For the thermal stability experimentation, the samples were prepared with the optimum conditions figured out upon the response surface methodology consisting of sodium acetate:formic acid (1:4 M ratio), 45% water content and 25% mL solvent ratio (SAFA14). The TPC, TFC, DPPH radical scavenging and FRAP values of A. tinctoria root extracts showed strong stability in NaDES during the experimentation. The values of TPC, DPPH radical scavenging and FRAP values increased from 390.16 to 404.82 mg GAE/g, 444.68 to 456.87 mmol TE/g and 537.63 to 568.20 mmol ISE/g during thermal treatment (Table 5). However, a slight decrease was observed at 80 °C, indicating the beginning of an obvious thermal degradation. Similar tendencies have reported during the thermal treatment of many agricultural products (Lupoae et al., 2019; Oancea et al., 2017, 2014; Zhan, 2018). Following the heat treatment, the highest degradation estimated at 17% loss of TFC occurred between 60 and 80 °C. This might be due to the prolonged heating time of 120 min. Our findings are consistent with the previous studies which have reported that the high temperature and prolonged magnitude of time caused the loss of flavonoids compounds (Oancea et al., 2017). The values of k varied from −6.91 · 10−6 to −0.74 · 10−6 s−1 for TPC, from 1.80 · 10−6 to 29.91 · 10−6 s−1, from −7.68 · 10−6 to −2.32 · 10−6 s−1 for DPPH radical scavenging and from −7.68 · 10−6 to −2.32 · 10−6 for FRAP (Table 6). These k values were found to be very low compared k values previously mentioned for many fruits extracted either with water and ethanol or with hexane:acetone mixture (Oancea et al., 2017, 2014; Olivares-tenorio et al., 2017). Thus, phytochemical compounds together with the antioxidant activity of A. tinctoria root were more protected in SAFA14 upon heat application. It has been proved bioactive compounds are stable in NaDESs during heat and light treatments as well as storage time (Dai et al., 2014). Moreover, low activation energies of 3.13 · 104 J mol−1 for TPC, 4.56 · 104 J mol−1 for TFC, 1.11 · 104 J mol−1 for and 1.94 · 104 J mol−1 for FRAP (Table 6). These Ea values indicated that the mass transfer during the extraction and heat process proceeded more easily in NaDES. In addition, the strong thermal stability observed for polyphenols and antioxidant activity extracted with NaDESs has been explained by the very strong network bonding occurring between extracts and NaDESs components (Dai et al., 2014).
Temperatures (°C)
TPC, mg GAE/g
TFC, mg ECE/g
DPPH radical scavenging mmol TE/g
FRAP, mmol ISE/g
Optimum point (25)
390.16 ± 11.90
10.69 ± 0.01
444.68 ± 5.28
537.63 ± 5.19
40
371.31 ± 10.11
10.55 ± 0.01
410.12 ± 5.28
512.72 ± 34.20
60
410.06 ± 16.33
10.41 ± 0.02
480.25 ± 35.60
554.62 ± 5.19
80
404.82 ± 7.26
8.62 ± 0.01
456.87 ± 86.46
568.20 ± 27.67
Temperature °C
k (s−1)
Ea (J mol−1)
TPC
TFC
DPPH radical scavenging
FRAP
TPC
TFC
DPPH radical scavenging
FRAP
40
−0.74 · 10−6
1.80 · 10−6
−2.32 · 10−6
−2.32 · 10−6
3.13 · 104
4.56 · 104
1.11 · 104
1.94 · 104
60
−6.91 · 10−6
3.63 · 10−6
−4.32 · 10−6
−4.32 · 10−6
80
−5.12 · 10−6
29.91 · 10−6
−7.68 · 10−6
−7.68 · 10−6
4 Conclusion
The extracts obtained with SALA12 and SAFA12 presented the best results of TPC (170.96–175.97 mg GAE/g), TFC (3.82–4.78 mg ECE/g), DPPH radical scavenging (112.31–130.91 mmol TE/g) and FRAP (148.58–170.43 mmol ISE/g) when compared to the conventional solvents. SAFA12 was found to be efficient NaDES presenting the highest extraction performance. Subsequently, this prominent NaDES was subjected to the response surface methodology using a Box-Behnken design in order to figure out the optimum conditions to have the maximum antioxidant activity of Alkanet root. The optimum conditions to maximize the phenolic compounds and antioxidant properties of Alkanet were 1:4 M ratio, 45% water content and 25% mL solvent ratio. Under these optimum conditions, the confirmed responses were 390.16 mg GAE/g, 10.69 mg ECE/g and 444.68 mmol TE/g for TPC, TFC and DPPH radical scavenging, respectively. The response surface methodology was revealed to be successful and NaDES molar ratio and water content had more effects on the antioxidant properties of A. tinctoria. The thermal tests revealed that the antioxidant properties of A. tinctoria were more stable in NaDES upon heating at 80, 60 and 40 °C for 2 h. This novel NaDES might be considered as a green solvent capable to enhance the extractability and stability of antioxidants of plants. Studies have to be carried out to determine to physicochemical, thermodynamic and electrochemical characteristics of the prepared NaDESs as well as to characterize the phytochemical compounds and their kinetics in Alkanet extracts obtained with NaDESs.
References
- Alkanna species: a promising herbal medicine and its uses. J. Food Nutr. Res.. 2019;2:309-315.
- [CrossRef] [Google Scholar]
- Choline chloride derivative-based deep eutectic liquids as novel green alternative solvents for extraction of phenolic compounds from olive leaf. J. Chem. Arab.. 2020;13(1):1685-1701.
- [CrossRef] [Google Scholar]
- Chemical analysis by GC-MS and in vitro antibacterial activity of Alkanna tinctoria extracts against skin infection causing bacteria. Biomed. Res.. 2017;28:7946-7949.
- [Google Scholar]
- Natural deep eutectic solvents from choline chloride and betaine – physicochemical properties. J. Mol. Liq.. 2017;241:654-661.
- [CrossRef] [Google Scholar]
- Antioxidant activities of alkannin, shikonin and Alkanna tinctoria root extracts in oil substrates. Food Chem.. 2004;87:433-438.
- [CrossRef] [Google Scholar]
- Radical scavenging activity of Alkanna tinctoria root extracts and their main constituents, hydroxynaphthoquinones. Phytother. Res.. 2005;147:141-147.
- [Google Scholar]
- Bajkacz, S., Adamek, J., 2017. Development of a method based on natural deep eutectic solvents for extraction of flavonoids from food samples.
- Novel lactic acid-based natural deep eutectic solvents: efficiency in the ultrasound-assisted extraction of antioxidant polyphenols from common native Greek medicinal plants. J. Appl. Res. Med. Aroma.. 2016;3:120-127.
- [CrossRef] [Google Scholar]
- High selective purification of Quercetin from Peanut hull using protic deep eutectic mixture based liquid–liquid microextraction. Microchem. J.. 2020;152:104444
- [CrossRef] [Google Scholar]
- Deep eutectic solvents applied in the extraction and stabilization of rosemary (Rosmarinus officinalis L.) phenolic compounds. Ind. Crops Prod.. 2020;144:112049
- [CrossRef] [Google Scholar]
- Evaluation of alcohol-based deep eutectic solvent in extraction and determination of flavonoids with response surface methodology optimization. J. Chromatogr. A. 2013;1285:22-30.
- [CrossRef] [Google Scholar]
- Detoxification of olive mill wastewaters by liquid-liquid extraction with natural deep eutectic solvents. Chem. Eng. Trans.. 2019;74:1495-1500.
- [CrossRef] [Google Scholar]
- Enhanced-performance extraction of olive (Olea europaea) leaf polyphenols using L-lactic acid/ammonium acetate deep eutectic solvent combined with β-cyclodextrin: screening, optimisation, temperature effects and stability. Biorefinery Biomass. Convers. 2019
- [CrossRef] [Google Scholar]
- Green extraction of natural products: concept and principles. Int. J. Mol. Sci.. 2012;13:8615-8627.
- [CrossRef] [Google Scholar]
- Deep eutectic solvent-based microwave-assisted extraction of genistin, genistein and apigenin from pigeon pea roots. Sep. Purif. Technol.. 2015;150:63-72.
- [CrossRef] [Google Scholar]
- Extraction techniques with deep eutectic solvents. TrAC - Trends Anal. Chem.. 2018;105:225-239.
- [CrossRef] [Google Scholar]
- Natural deep eutectic solvents as new potential media for green technology. Anal. Chim. Acta. 2013;766:61-68.
- [CrossRef] [Google Scholar]
- Natural deep eutectic solvents providing enhanced stability of natural colorants from safflower (Carthamus tinctorius) Food Chem.. 2014;159:116-121.
- [CrossRef] [Google Scholar]
- Tailoring properties of natural deep eutectic solvents with water to facilitate their applications. Food Chem.. 2015;187:14-19.
- [CrossRef] [Google Scholar]
- Comprehensive evaluation of deep eutectic solvents in extraction of bioactive natural products. ACS Sustain. Chem. Eng.. 2016;4:2405-2411.
- [CrossRef] [Google Scholar]
- Green extraction of polyphenols from grapefruit peels using high voltage electrical discharges, deep eutectic solvents and aqueous glycerol. Food Chem.. 2019;295:165-171.
- [CrossRef] [Google Scholar]
- Extraction of phenolic compounds from virgin olive oil by deep eutectic solvents (DESs) Food Chem.. 2016;197:554-561.
- [CrossRef] [Google Scholar]
- The effect of a beeswax, olive oil and Alkanna tinctoria (L.) Tausch mixture on burn injuries: an experimental study with a control group. Complement. Ther. Med.. 2017;34:66-73.
- [CrossRef] [Google Scholar]
- A study on the total phenols content and antioxidant activity of essential oil and different solvent extracts of endemic plant Merremia borneensis. Arab. J. Chem.. 2015;8:66-71.
- [CrossRef] [Google Scholar]
- Optimised extraction of antioxidant polyphenols from Satureja thymbra using newly designed glycerol-based natural low-transition temperature mixtures (LTTMs) J. Appl. Res. Med. Aroma. 2017:1-10.
- [CrossRef] [Google Scholar]
- Phytoconstituents, antioxidant, sun protection and skin anti-wrinkle effects using four solvents fractions of the root bark of the traditional plant Alkanna tinctoria (L.) Eur. J. Integr. Med.. 2018;21:88-93.
- [CrossRef] [Google Scholar]
- Infrared Spectra of CH3COONa and CD3COONa and assignments of vibrational frequencies. J. Chem. Phys.. 1954;22:1796.
- [CrossRef] [Google Scholar]
- Studying two series of ternary deep eutectic solvents (choline chloride – urea – glycerol) and (choline chloride – malic acid – glycerol), synthesis and characterizations. Arab. J. Sci. Eng.. 2017;42:1579-1589.
- [CrossRef] [Google Scholar]
- Alkanna tinctoria leaves extracts: a prospective remedy against multidrug resistant human pathogenic bacteria. BMC Complement. Altern. Med.. 2015;15:127.
- [CrossRef] [Google Scholar]
- Saffron processing wastes as a bioresource of high-value added compounds: Development of a green extraction process for polyphenol recovery using a natural deep eutectic solvent. Antioxidant. 2019;8
- [CrossRef] [Google Scholar]
- Green tailoring with water of choline chloride deep eutectic solvents for the extraction of polyphenols from palm samples. J. Chromatogr. Sci.. 2019;57:272-278.
- [CrossRef] [Google Scholar]
- Enhanced extraction of natural pigments from Curcuma longa L. using natural deep eutectic solvents. Ind. Crops Prod.. 2019;140:111620
- [CrossRef] [Google Scholar]
- Characterization of xylitol or citric acid:choline chloride:water mixtures: Structure, thermophysical properties, and quercetin solubility. Food Chem.. 2020;306
- [CrossRef] [Google Scholar]
- Investigations on thermal degradation of phytochemicals from lavender extract. Fascicle VI – Food Technol.. 2019;43:33-47.
- [Google Scholar]
- Polyphenolic content and in vitro antioxidant characteristics of wine industry and other agri-food solid waste extracts. J. Food Compost. Anal.. 2007;20:125-132.
- [CrossRef] [Google Scholar]
- Ultrasound assisted extraction of bioactive compounds from Nephelium lappaceum L. fruit peel using central composite face centered response surface design. Arab. J. Chem.. 2013;94
- [CrossRef] [Google Scholar]
- Insights into the nature of eutectic and deep eutectic mixtures. J. Solution Chem.. 2019;48:962-982.
- [CrossRef] [Google Scholar]
- The kinetics of thermal degradation of polyphenolic compounds from elderberry (Sambucus nigra L.) extract. Food Sci. Technol. Int. 2014
- [CrossRef] [Google Scholar]
- Phytochemicals and antioxidant activity degradation kinetics during thermal treatments of sour cherry extract. LWT - Food Sci. Technol. 2017
- [CrossRef] [Google Scholar]
- Natural deep eutectic solvents as alternatives for extracting phlorotannins from brown algae. Pharm. Chem. J.. 2019;53:243-247.
- [Google Scholar]
- Application of response surface methodology for optimizing the recovery of phenolic compounds from hazelnut skin using different extraction methods. Ind. Crops Prod.. 2016;91:114-124.
- [CrossRef] [Google Scholar]
- Thermal stability of phytochemicals, HMF and antioxidant activity in cape gooseberry (Physalis peruviana L.) J. Funct. Foods. 2017;32:46-57.
- [CrossRef] [Google Scholar]
- Essential oil composition and antioxidant activities of alkanet (Alkanna tinctoria subsp. tinctoria) Food Sci. Biotechnol.. 2010;19:1177-1183.
- [CrossRef] [Google Scholar]
- Extraction of polyphenolic antioxidants from orange peel waste using deep eutectic solvents. Sep. Purif. Technol.. 2018;206:1-13.
- [CrossRef] [Google Scholar]
- Microwave-assisted extraction for recovery of polyphenolic antioxidants from ripe mango (Mangifera indica L.) peel using lactic acid/sodium acetate deep eutectic mixtures. Food Sci. Technol. Int.. 2020;26:78-92.
- [CrossRef] [Google Scholar]
- Deep eutectic solvent-based extraction of polyphenolic antioxidants from onion (Allium cepa L.) peel. J. Sci. Food Agric.. 2019;99:1969-1979.
- [CrossRef] [Google Scholar]
- Green extraction of five target phenolic acids from Lonicerae japonicae Flos with deep eutectic solvent. Sep. Purif. Technol. 2015:1-9.
- [CrossRef] [Google Scholar]
- Innovative process of polyphenol recovery from pomegranate peels by combining green deep eutectic solvents and a new infrared technology. LWT-Food Sci. Technol.. 2019;111:138-146.
- [CrossRef] [Google Scholar]
- In vitro anti-proliferative activity of the Rubia tinctorum and Alkanna tinctoria root extracts in panel of human tumor cell lines.Jordan. J. Biol. Sci.. 2018;11:489-494.
- [Google Scholar]
- Effect of choline chloride-oxalic acid based deep eutectic solvent on the ultrasonic assisted extraction of polyphenols from Aegle marmelos. J. Mol. Liq.. 2019;287:110956
- [CrossRef] [Google Scholar]
- Evaluation of antipyretic, antinocieptive and sedative effects of Tribulus terrestris, Mimosa pigra and Alkanna tinctoria methanolic extracts. J. Phytopharmacol.. 2016;5:1-3.
- [Google Scholar]
- Tailor-made natural deep eutectic solvents for green extraction of isoflavones from chickpea (Cicer arietinum L.) sprouts. Ind. Crops Prod.. 2019;140:111724
- [CrossRef] [Google Scholar]
- Antibacterial and antioxidant activities of Mentha piperita L. Arab. J. Chem.. 2015;8:322-328.
- [CrossRef] [Google Scholar]
- Optimization of process variables for enhanced lactic acid production utilizing paneer whey as substrate in SMF. Appl. Food Biotechnol.. 2015;2:46-55.
- [Google Scholar]
- Naphthoquinone components from Alkanna tinctoria (L.) Tausch Show significant antiproliferative effects on human colorectal cancer cells. Phytother. Res.. 2012;27:66-70.
- [CrossRef] [Google Scholar]
- Enhanced extraction of phenolic compounds using choline chloride based deep eutectic solvents from Juglans regia L. Ind. Crops Prod.. 2018;115:261-271.
- [CrossRef] [Google Scholar]
- Application of natural deep eutectic solvents for extraction and determination of phenolics in Cajanus cajan leaves by ultra performance liquid chromatography. Sep. Purif. Technol.. 2015;149:237-244.
- [CrossRef] [Google Scholar]
- Ultrasound-assisted deep eutectic solvent as green and efficient media for the extraction of flavonoids from Radix scutellariae. New J. Chem.. 2019;43:644-650.
- [CrossRef] [Google Scholar]
- Enhancing cellulose accessibility of corn stover by deep eutectic solvent pretreatment for butanol fermentation. Bioresour. Technol.. 2015;203:364-369.
- [CrossRef] [Google Scholar]
- Elucidation of key odorants in Beninese Roselle (Hibiscus sabdariffa L.) infusions prepared by hot and cold brewing. Food Res. Int. 2020:109133.
- [CrossRef] [Google Scholar]
- Thermal processing affecting phytochemical contents and total antioxidant capacity in broccoli (Brassica oleracea L.) J. Food Process. Pres. 2018:1-8.
- [CrossRef] [Google Scholar]
- A Green deep eutectic solvent-based ultrasound-assisted method to extract astaxanthin from shrimp byproducts. Anal. Lett. 2014:37-41.
- [CrossRef] [Google Scholar]
- Ultrasound-assisted deep eutectic solvent as green and efficient media combined with functionalized magnetic multi-walled carbon nanotubes as solid-phase extraction to determine pesticide residues in food products. Food Chem.. 2020;310:1258693.
- [CrossRef] [Google Scholar]
- Enhanced phenolic compounds extraction from Morus alba L. leaves by deep eutectic solvents combined with ultrasonic-assisted extraction. Ind. Crops Prod.. 2018;120:147-154.
- [CrossRef] [Google Scholar]
- Deep eutectic solvents as green media for extraction of flavonoid glycosides and aglycones from Platycladi Cacumen. J. Pharm. Biomed. Anal.. 2017;134:214-219.
- [CrossRef] [Google Scholar]
- A simple and green deep eutectic solvent based air assisted liquid phase microextraction for separation, preconcentration and determination of lead in water and food samples by graphite furnace atomic absorption spectrometry. J. Mol. Liq.. 2018;259:220-226.
- [CrossRef] [Google Scholar]


