Translate this page into:
Optimization of CO2/N2 injection ratios in goaf by saturation adsorption capacity
⁎Corresponding author at: North China Institute of Science and Technology, 467 College Street, East Yanjiao, Beijing, China. zhaozihaolz@163.com (Zihao Zhao),
-
Received: ,
Accepted: ,
This article was originally published by Elsevier and was migrated to Scientific Scholar after the change of Publisher.
Abstract
The inerting technology is a common means to prevent fires in goaf of coal mine, in which adsorption capacity is the key index to measure the inerting effect. Therefore, this paper obtained the coal spontaneous combustion (CSC) stage of Qianyingzi coal mine through programmed heating experiments, and determined the physical adsorption stage temperature (below 323.15 K) matching the actual environment. The oxidation characteristics of coal samples with different adsorption degrees were further studied by adsorption experiment and TG-DSC test. The results indicate that the combustion activation energy of coal samples follows the sequence of second-stage adsorption coal > dried coal > raw coal > first-stage adsorption coal. This implies that the CO2 saturated adsorption can exert a specific inhibitory impact on coal combustion. Therefore, the index of the saturation adsorption capacity (SAC) was proposed to evaluate the inerting effect. We further studied the adsorption capacity of coal at different ratios of CO2/N2 by molecular simulation under different pressures (0–5 MPa). The results show that CO2 dominates in both single-component adsorption and competitive saturated adsorption. The average of ratios (AOR) and average of differences (AOD) threshold are determined. The priority of SAC is obtained in the order of single-component (CS), CO2/N2 mixture ratio at 4:6 (C4:6), CO2/N2 mixture ratio at 2:8 (C2:8) from largest to smallest. Furthermore, a fuzzy optimization method for injection ratio of CO2/N2 under different pressures was established. During dynamic changes in environmental pressure, it is appropriate to inject CO2 separately at 0.2–2.5 MPa. At 3 MPa, a mixture of CO2/N2 at a ratio of 2:8 is the best for prevent fires in goaf. Similarly, an inert gas with a CO2/N2 ratio of 4:6 is injected at 3–5 MPa.
Keywords
Goaf
Saturation adsorption capacity
CO2/N2 ratio
Inerting technology
Fuzzy optimization
1 Introduction
Coal spontaneous combustion (CSC) in goaf is the main disaster of coal mine, which has the characteristics of strong concealment and difficult prevention. Inerting technology is commonly used to prevent the CSC in goaf. The principle is that the inert gas is injected into the goaf to form an inerting zone around the coal. At the same time, the inert gas is adsorbed by the coal to block the coal-oxygen reaction process, thus inhibiting the CSC in the goaf (Cheng et al., 2021). Most scholars have imitated this process and studied the gas concentrations changes and microscopic mechanisms of coal oxidation at different inert gas atmospheres (Si et al., 2023) (Zhou et al., 2022) (Shao et al., 2014). There are few researches on the oxidation characteristics of pre-adsorbed coal. Zhang et al. studied the low-temperature oxidation characteristics and functional group changes of pre-adsorbed CO2 coal samples using a temperature-programmed experiment device (Zhang et al., 2023). The results show that the oxidation reaction of oxygen-containing functional groups was inhibited and the O2 consumption decreased by about 4 % after the coal sample was pre-adsorbed CO2, which indicates that the oxidation characteristics of coal will change after the coal sample has adsorption basis. In the actual production process, the inert gas is often injected in intermittent mode, which leads to the possibility that the residual coal may have adsorbed the inert gas many times, and resulting in differences in the coal oxidation characteristics. Therefore, the oxidation characteristics of different adsorption degrees coal samples need to be further studied.
Environmental parameters such as pressure, temperature, moisture, coal metamorphism and inert gas composition will affect the coal adsorption degree. Coal mines typically use CO2 and N2 as inert gas, which achieve the inerting of coal by displacing and occupying the adsorption site of O2 on the coal surface (Zhu and Liu, 2012) (Yan et al., 2023). However, the difference of physicochemical properties of CO2 and N2 leads to the competitive adsorption of the two gases on the surface of coal, which changes the adsorption efficiency of coal (Li et al., 2019) (Liu et al., 2023) (Hao et al., 2021). Currently, molecular simulation technology is the main method to explore the competitive adsorption of gases on coal, and the current research focuses on gas injection to displace CH4 and CO2 storage. A few scholars have also studied the competitive adsorption capacity between inert gases and O2. Based on the adsorption configuration of oxygen-containing coal, Ding et al. used Grand Canonical Monte Carlo (GCMC) and molecular dynamics (MD) methods to study the adsorption behavior of CO2/N2 on O2 (Ding et al., 2023). Wu et al. calculated the interaction energy and isosteric heat of inert gases adsorption on coal, finding that the competitive adsorption capacity is in the order of CO2, O2, N2 (Wu et al., 2017). Dong et al. studied the competitive adsorption relationship of CO and CO2/O2 on coal (Dong et al., 2023), while Wang et al. conducted similar research (Wang et al., 2022). These studies have laid a theoretical foundation for inertization mechanisms. In the actual production process, the gas injection pipeline is withdrawn with the advance of the working face, and the pressure distribution changes in the goaf. However, there is a lack of research on the optimization of CO2/N2 injection ratio under the change of pressure environment in goaf.
Therefore, this study employed a self-developed programmed heating device to conduct CSC experiments at room temperature to 573.15 K. Combined with gases adsorption equipment and TG-DSC test, the differences in oxidation characteristics of coal samples with different adsorption degrees were studied. Further, the evaluation index of adsorption effect is proposed. At different pressures (0–5 MPa), the simulation of CO2/N2 multi-proportion competitive adsorption on coal are conducted to study the optimal CO2/N2 injection ratio at the actual goaf pressure. The research results can provide theoretical parameters selection and guidance for mixed gas injection for fire prevention in goaf.
2 Methods and materials
2.1 Coal sample
The coal samples (QYZ) were obtained from the western wing of Qianyingzi coal mine. The QYZ were crushed to 0–6 mm, and part of the samples were sieved to 0.1–0.2 mm. Table 1 shows the results of the proximate analysis. We preserved the raw coal sample with moisture content of 2.00 %, dried it for 12 h to obtain the dried coal sample, and adsorbed coal samples in different adsorption degrees respectively. The moisture content is shown in Table 2.
Coal sample
Weight (g)
Mad (%)
Aad (%)
Vdaf (%)
QYZ
1.01
2.00
12.24
25.00
QYZ
Raw
Dried
First-stage adsorption
Second-stage adsorption
Mad (%)
2.00
1.81
1.52
1.40
2.2 Programmed heating experiment
Fig. 1 illustrates the programmed heating experimental platform for self-development, comprising the gas injection, heating, and gas chromatography sampling and analysis sections. In the procedure, the QYZ was placed in the heater. Attaining the set temperature, heating was halted and generated gases were analyzed for concentrations. In this experiment, varied heating parameters were set between 303.15 K-473.15 K and exceeding 473.15 K.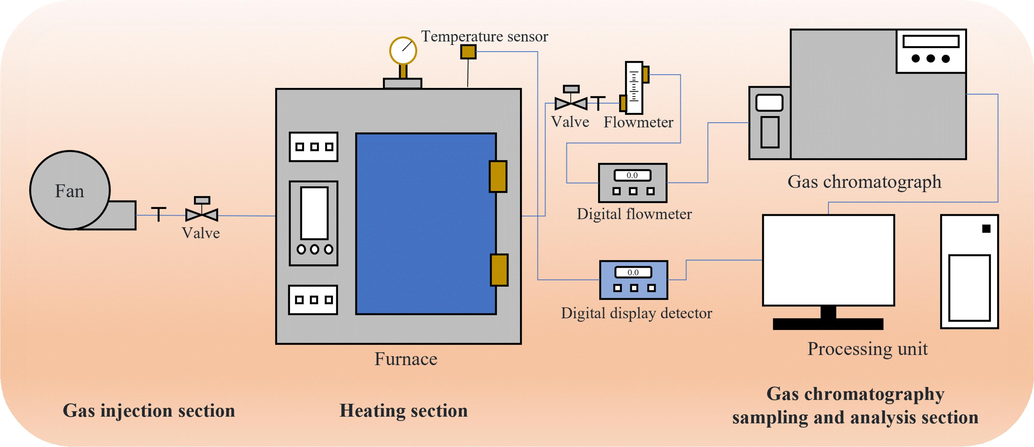
Programmed heating experimental platform.
2.3 Adsorption experiment
Fig. 2 shows the high-pressure isothermal adsorption experimental platform. CO2 adsorption trials were performed with 0–2.5 MPa and controlled temperature conditions (Santarosa et al., 2013). The experimental parameters were consistent with those detailed in our prior publication (Li et al., 2023). Through adsorption experiments, we obtained QYZ with different adsorption degrees, and investigated CO2 adsorption characteristics by coal.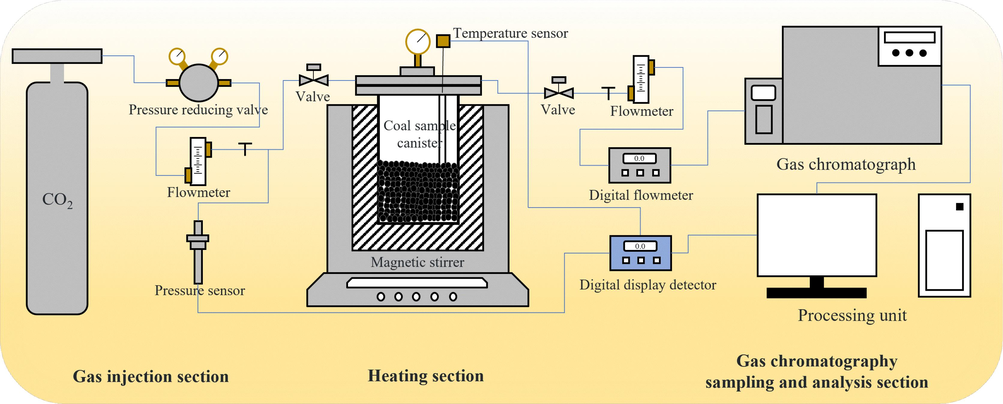
CO2 adsorption experimental platform.
2.4 TG-DSC test
The oxidation characteristics of raw samples, dried samples, first-stage adsorbed samples and second-stage adsorbed samples were analyzed by TG-DSC. The sample mass was 20 mg (±0.5 mg), uniformly placed at the bottom of a ceramic crucible. The experiment was conducted with a flow rate of 100 mL/min. The samples were heated from environment temperature to 1073.15 K at a rate of 10 K/min in an air atmosphere.
2.5 GCMC simulation
The QYZ coal sample is a young bituminous with a carbon content of 82–83 %, which is basically consistent with the properties of the coal molecular model proposed by W.H. Wiser. The molecular formula is C192H166N4O19S9. We constructed the model and optimized the force field configuration, followed by annealing. Table 3 shows the parameters selected for geometric optimization.
Setting
Parameter
References
Task
Geometry optimization
(Gao and Song, 2023)
Quality
Customized
(Ding et al., 2023) (Xi et al., 2022) (Bai et al., 2021)
Algorithm
Smart
Energy
0.001 kcal/mol
(Xu et al., 2023)
Force
0.1 kcal/mol
Max iterations
50,000
(Zhu et al., 2021)
Forcefield
Dreiding
(Gao et al., 2020)
Charge
Charge using QEq
(Meng et al., 2020)
Table 4 presents the comparison of the carbon molecule energy levels before and after optimization. The total energy decreased significantly, enhancing the stability of the molecular structure. The final optimized coal molecule model is depicted in Fig. 3. The optimized parameters of the coal structure model were obtained with the lattice constants of A = B = C = 16.3 Å and the interaxial angles of α = β = γ = 90°. The mass of a coal cell molecule is 5.197 × 10⁻²¹ g.
TE (kJ/mol)
VEE (kJ/mol)
NBE (kJ/mol)
BSE
BAE
TSE
ISE
HBE
VDW
CE
Initial
10831.90
2608.73
69.80
113.05
5.13
0
8057.50
–22.31
Final
639.76
88.23
79.73
97.20
2.37
0
408.55
–36.34
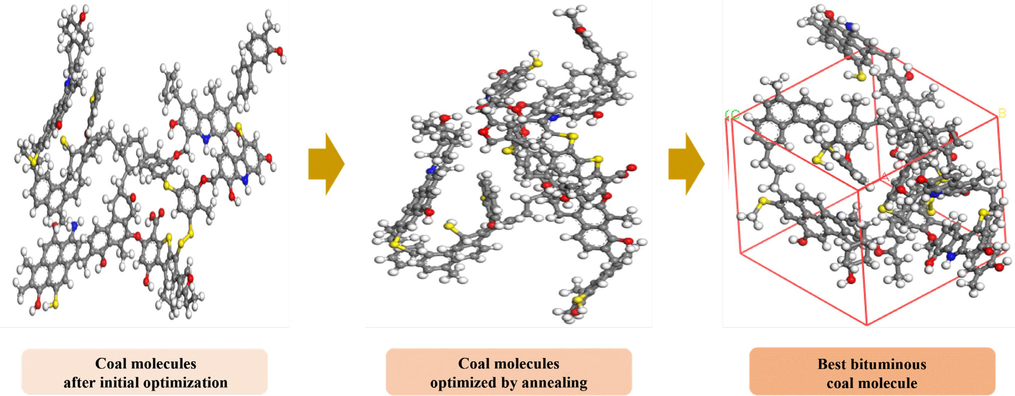
QYZ coal molecules optimized by annealing.
To investigate the single-component adsorption of CO2 and N2 on coal, the crystalline model of coal molecules was imported into the Fixed Pressure task of the Sorption module. The Metropolis method with medium accuracy was selected for the simulations. The system temperature ranged from 303.15 K to 323.15 K, and pressure was converted to fugacity inputs in 0.5 MPa increments at 0–5 MPa. CO2 and N2 were then mixed and the CO2 was increased by 10 % step by step for simulation. The temperature is set to 303.15 K, and other parameters are consistent with those set for the single component. The results of competitive adsorption and single-component adsorption were compared to optimize the inerting adsorption parameters.
3 Results and discussion
3.1 CSC stages analysis
Fig. 4 shows the trend of gas concentration changes during the QYZ heating process. At low-temperature stage (323.15 K-333.15 K), coal initiates the chemical adsorption of O2, resulting in a decrease in O2 concentration. Then, in the high-temperature stage (around 353.15 K), the active functional groups on the coal interact with oxygen atoms, leading to increased concentrations of CO and CO2. Similarly, Wang et al. also noted heightened levels of CO and CO2 during coal heating processes (Wang et al., 2022). As the temperature increases, the oxidation of coal produces C2H6 (at 403.15 K), C2H4 (at 423.15 K), and C3H6CO2 (at 443.15 K). It indicates that the coal oxidation reaction enters the accelerated stage and begins to enter the self-heating stage. Beyond 473.15 K, the O2 concentration decreases from 18.39 % to 14.27 % in 473.15 K-513.15 K. Wang et al.’s investigation also confirming the fluctuation in O2 levels during coal thermal treatment (Wang et al., 2022). The concentrations of the three alkene gases exhibit a more significant increase after 493.15 K. They continue to rise with temperature until 533.15 K, indicating that the coal is about to enter the combustion stage, suggesting the imminent shift towards combustion. Consistently, Ma et al. investigated the alkene gas production during coal heating processes and found similar trends (Ma et al., 2023).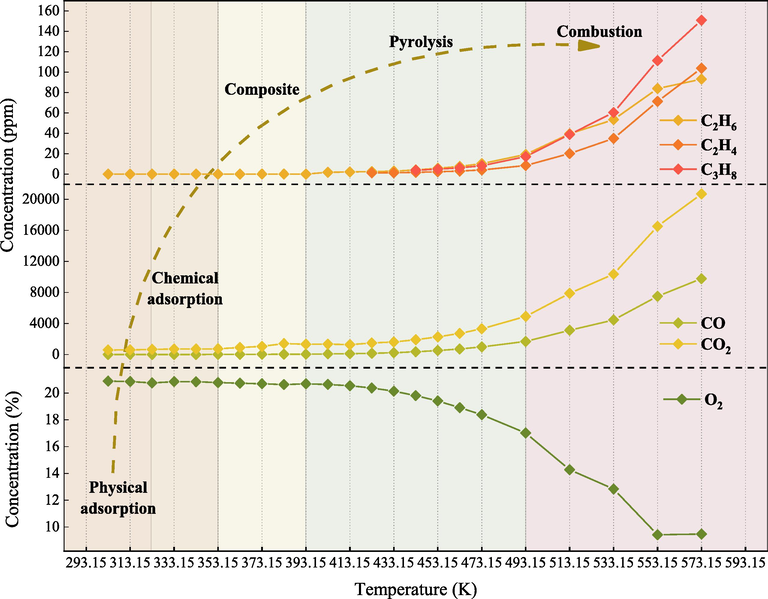
Concentration variation of CSC indicator gases.
Table 5 presents the classification system for CSC. In the latent adsorption process, physical adsorption dominates below 323.15 K which is consistent with the mine environment. Chemical adsorption occurs above 323.15 K. This is continued with the composite temperature stage, where the concentrations of CO and CO2 rise at 353.15 K. The pyrolysis stage at 393.15 K leads to the generation of hydrocarbon gases as the temperature increases. Finally, during the combustion stage, the concentrations of CO and CO2 increase rapidly when the temperature exceeds 533.15 K.
Stage
Temperature range (K)
Extreme temperature (K)
Adsorption Stage
Latent
< 323.15
323.15
Physical adsorption
323.15–353.15
353.15
Chemical adsorption
Composite
353.15–393.15
393.15
Pyrolysis
393.15–493.15
493.15
Combustion
> 533.15
533.15
3.2 CO2 adsorption on coal
Fig. 5 shows the results of previous CO2 adsorption tests. At 0–5 MPa (308.15 K), excess CO2 adsorption studies were conducted on sub-bituminous coal. The growth of adsorption capacity slowed down at 0.5 MPa and tended to level off at 1.4 MPa (Santarosa et al., 2013). Similarly, investigation on bituminous coal at 0–5 MPa and 303.15 K revealed a gradual stabilization of adsorption capacity at 3 MPa (Dong et al., 2023). Analyzing the single-component adsorption of CO, CO2, and O2 on bituminous coal at 0–16 MPa and 303.15 K, it was observed that CO2 reached saturation adsorption first (Yu et al., 2023). Combined with the results of our investigation, all indicate that the adsorption/desorption of CO2 on coal will gradually reach equilibrium, and the adsorption rate will decrease as the adsorption progresses. When the adsorption/desorption of CO2 reach equilibrium, the CO2 adsorption of coal is close to saturation. The adsorption capacity of CO2 at this time is called the saturation adsorption capacity (SAC), which is the most intuitive indicator to investigate the adsorption of CO2/N2 on coal.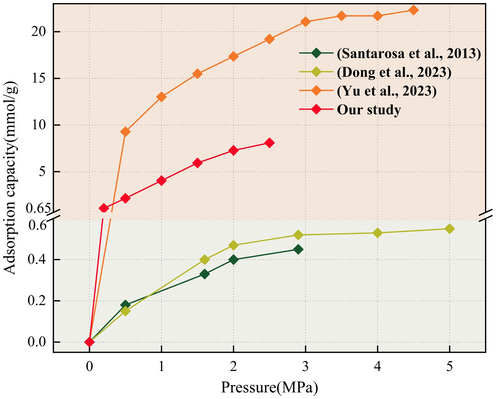
CO2 adsorption capacity on QYZ (Santarosa et al., 2013) (Dong et al., 2023) (Yu et al., 2023).
3.2.1 Adsorption characteristics
Based on the CSC stages and the actual underground environment, CO2 adsorption on coal was carried out under physical adsorption conditions (303.15 K). Fig. 6 shows the adsorption capacity of CO2 on coal at different adsorption degrees. Consistent with the previous investigation, the adsorption capacity increases with pressure, but the growth gradually slows down (Yu et al., 2022). The second-stage adsorption capacity of QYZ for CO2 is lower than that of the first stage at each pressure point, ranging from –0.0056 to 0.07103 mmol/g. This indicates that CO2 remains partially adsorbed on coal even after the first stage. In the second-stage adsorption, coal is partly saturated with CO2, leading to a decline in adsorption capacity. In the first-stage adsorption, capacity increases over time until the onset of second-stage adsorption, where the growth rate decreases and ultimately stabilizes. Therefore, we believe that the two stages CO2 adsorption on coal is a process in which the adsorption capacity tends to saturate and reaches the SAC.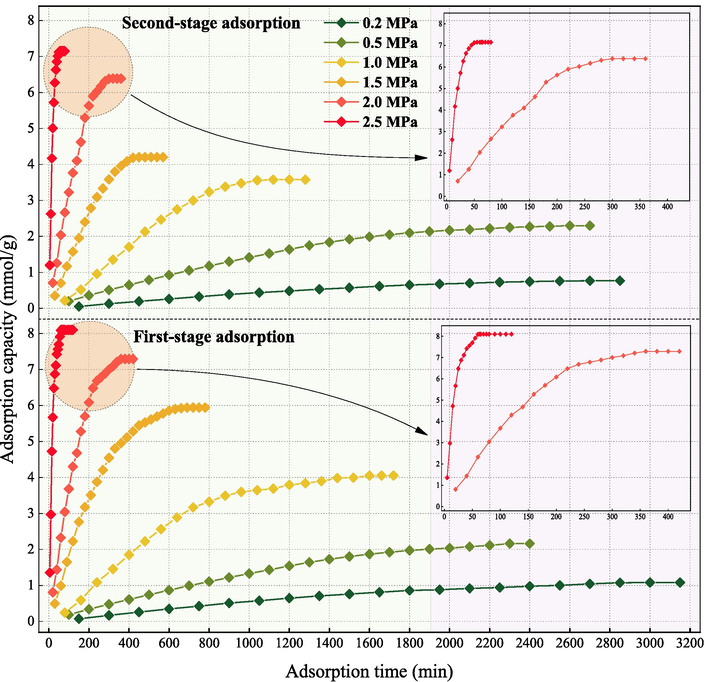
Comparison of adsorption equilibrium time at various pressure.
Fig. 7 shows the adsorption saturation time at different pressure. The time required to reach adsorption equilibrium and the adsorption capacity show a positive correlation at identical pressure conditions (Jiang et al., 2020). With increasing pressure, the adsorption saturation time decreases.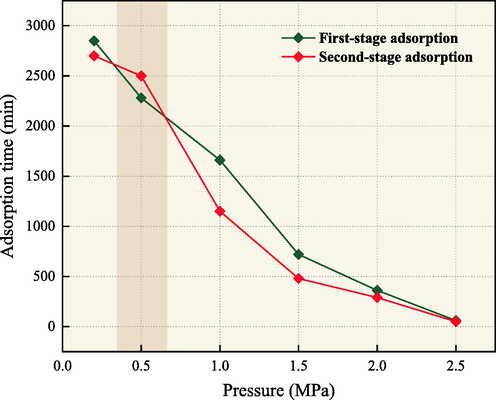
Adsorption equilibrium time at various pressure.
Table 6 shows the mass variations of QYZ before and after different degrees adsorption. The mass increment following the second-stage surpasses that of the first-stage, indicating incomplete saturation after the initial adsorption phase. The subsequent gas injection allows the coal to approach saturation adsorption. This demonstrates the importance of preventing CSC in goaf through multiple injections of inert gas.
Stages
Initial mass (g)
Final mass (g)
Mass increment (g)
First-stage adsorption
516.12
517.62
1.5
Second-stage adsorption
506.86
508.98
2.12
3.2.2 Combustion characteristics
(a) Curve analysis
Fig. 8 depicts the TG-DSC curve of QYZ. In contrast to the dried coal, both the raw and adsorbed coal exhibit heightened peak heat flow, attributed to moisture content in the raw coal. Equally, Zhao et al. demonstrated a similar impact of moisture content on peak heat flow in coal samples (Zhao et al., 2015). In addition, at elevated temperatures, a small amount of CO2 in the adsorbed coal is reduced to CO and continues to participate in the combustion reactions.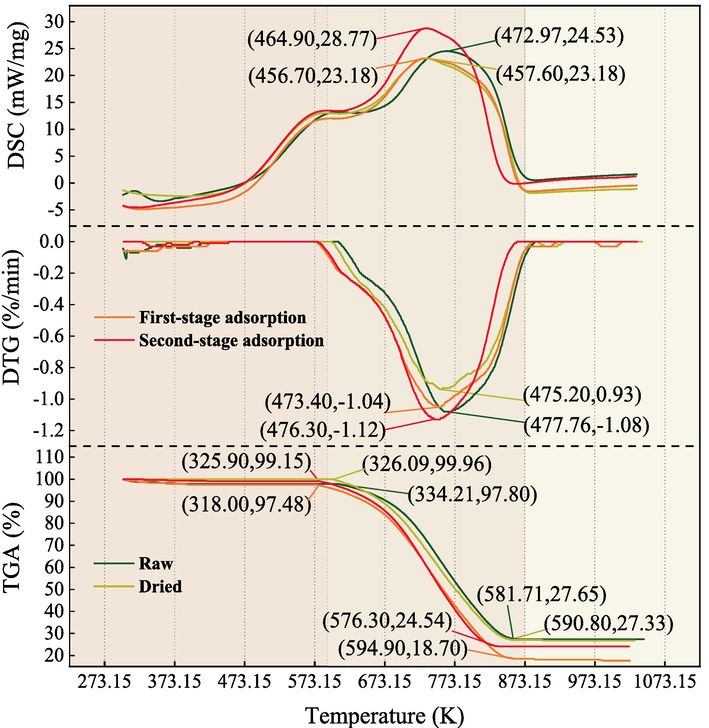
TG-DSC of QYZ.
At the combustion of QYZ, the weight loss process initiates at 603.15 K for the dried coal, whereas in raw coal samples, it commences at 607.15 K. In addition, the sharp weight loss temperatures of the different degrees adsorbed coal are 591.15 K and 598.15 K, respectively, both lower than the dried coal. Combined with the moisture content of each coal in Table 2, the adsorption of CO2 reduces the moisture content. As a result, the coal enters the combustion stage faster. Aligning with this phenomenon, Wu et al. underscored CO2 adsorption’s role in decreasing moisture content and accelerated the coal’s progression to combustion (Wu et al., 2020).
(b) Activation energy analysis
Fig. 9 shows the ignition activation energy of different coal samples. Based on the results shown in Table 7, it can be observed that the ignition activation energy decreases after the first-stage adsorption. Subsequently, it increases after the second-stage adsorption and exceeds that of the dried coal. This indicates that a small amount of adsorption does not inhibit the CSC, but can actually promote the self-ignition of coal oxidation. When the coal approaching the SAC of CO2 can prevent coal oxidation autoignition.
Activation energy of QYZ combustion.
QYZ
–E/R
R2
E (kJ/mol)
Raw
–8490.70
1.00
70.59
Dried
–9698.23
0.99
80.63
First-stage adsorption
–7669.43
1.00
63.76
Second-stage adsorption
–9741.86
0.99
80.99
3.3 SAC for CO2, N2
Fig. 10 shows the CO2/N2 adsorption mechanism on coal. O2 is displaced in the adsorption process of CO2 and N2 on coal. In addition, there is a certain amount of interaction among the CO2/N2. Due to differences in factors such as SAC, various gases compete for adsorption under actual conditions in mining areas (Jin et al., 2017). Excavation of the face results in inert gas pipeline replacement, altering pipeline distances from specific points in goaf. This will affect the pressure at that point. Therefore, the SAC is used as an indicator parameter to investigate the competitive adsorption patterns of CO2/N2 in coal molecules. We compare the single gas adsorption and competitive adsorption behavior of CO2 and N2 at different pressures.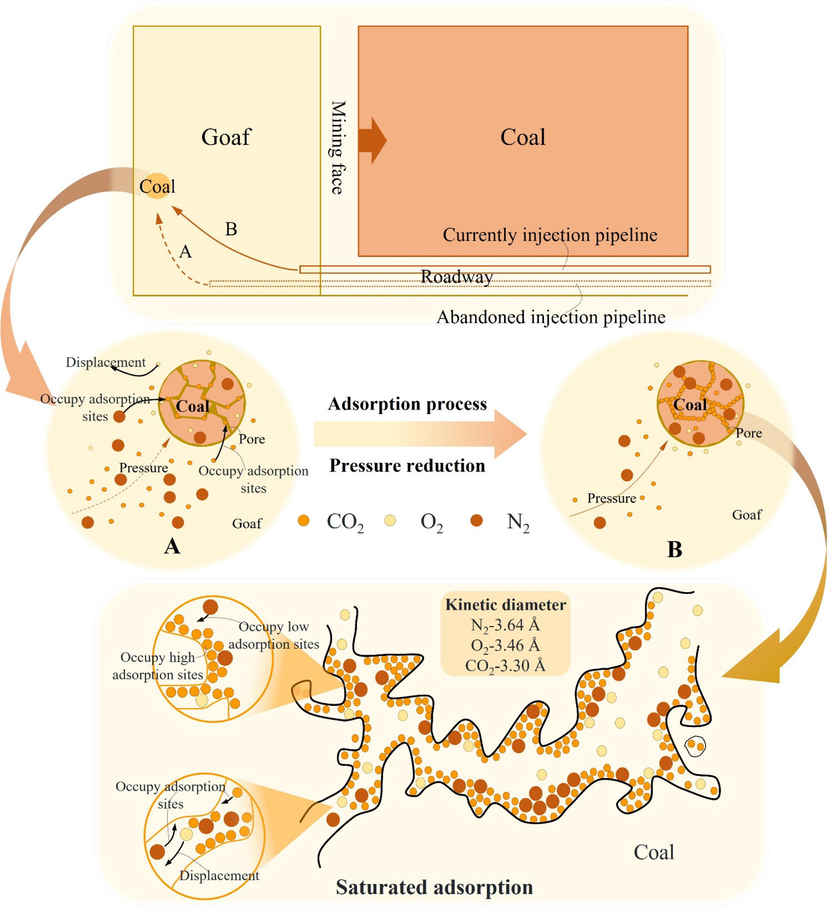
Adsorption mechanism of multiple inert gases on coal.
3.3.1 SAC of single-component
Fig. 11 shows the fluctuation of SAC for CO2 and N2 on coal at different temperatures within 0–5 MPa. During the increase of the adsorption capacity (0–2 MPa), the gases on coal are continuously transformed. As the pressure increases, the density of the free phase gas increases, forcing it to enter the adsorption phase. Due to the smaller kinetic diameter of CO2 (3.3 Å) compared to N2 (3.64 Å), it can enter more pore structures, hence offering a higher adsorption capacity compared to N2. At 2–5 MPa, the CO2 adsorption capacity escalates by 0.03 mmol/g, nearing saturation, consistent with the capacity observed at the same temperature and pressure.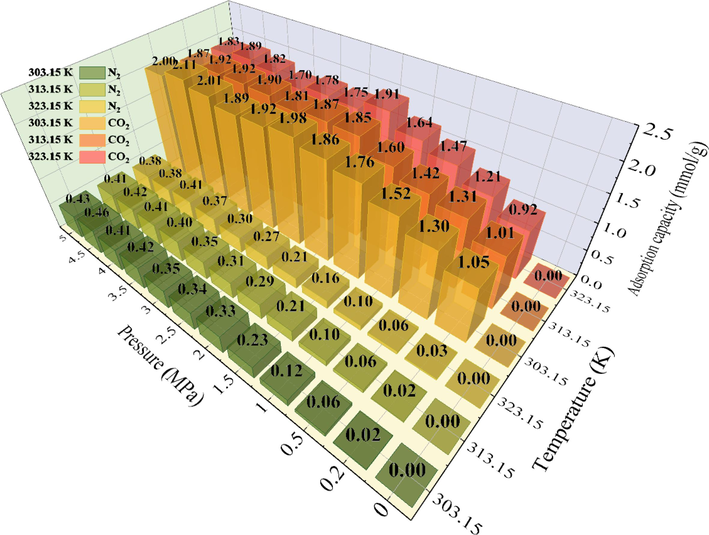
Single-component adsorption capacity of CO2 and N2 on QYZ.
The temperature dependence of coal adsorption for CO2 decreases with increasing temperature (Mustafa et al., 2020), which is consistent with previous investigations. The SAC decreases with temperature for both gases. However, a greater decrease is observed for CO2 compared to N2 which indicates that CO2 adsorption on coal is more affected by temperature. At the same temperature/pressure, the SAC of CO2 is higher.
After applying the Langmuir model for fitting, the parameters derived are shown in Table 8. The adsorption capacity a(CO2) > a(N2) at the same temperature, indicating higher SAC of coal for CO2. The adsorption equilibrium constant b(CO2) > b(N2), indicating that the CO2 adsorption rate on coal is significantly higher than N2 at 0–2 MPa. As the pressure increases to 2 MPa, the increase in CO2 adsorption slows and gradually approaches saturation, while N2 adsorption continues to rise.
Gas
Temperature(K)
a
b
R2
Gas
Temperature(K)
a
b
R2
CO2
303.15
2.11
3.71
0.94
N2
303.15
0.85
0.25
0.96
313.15
1.99
4.06
0.92
313.15
0.87
0.21
0.97
323.15
1.94
3.92
0.93
323.15
1.11
0.12
0.97
3.3.2 SAC of multi-component
In previous works, scholars have compared the adsorption capacities of sub-bituminous coal for various gas mixtures, including 100 % CO2, 90 % CO2 + 10 % N2, 70 % CO2 + 30 % N2, 30 % CO2 + 70 % N2, 10 %CO2 + 90 % N2 and 100 % N2. The findings indicated that CO2 predominantly influences the coal inerting process (Yu et al., 2023). In addition, another investigation was conducted to investigate the pyrolysis combustion rate and thermodynamic properties of coal at 18 % O2 concentration with different CO2/N2 ratios (10:0, 8:2, 6:4, 4:6, 2:8, and 0:10). A CO2/N2 ratio of 4:6 was found to have the best inhibitory effect on coal pyrolysis combustion (Wu et al., 2023). Thus, our investigation focuses on the investigation of the SAC of coal using CO2/N2 mixtures with ratios of 1:9, 2:8, 3:7, and 4:6 to offer insights into the coal inerting process.
Fig. 12 shows the variation of the competing SAC of coal for CO2 and N2. Aligning with previous analyses, CO2 plays a dominant role in the variation of total gas adsorption when examining CO2/N2 coalbed methane replacement technology (Sun et al., 2022). With an increment in the CO2 content within the mixture, the curves of multi-component adsorption capacity align closer to that of CO2. The maximum SAC is observed at a CO2 concentration of 40 %. It ranges from 0 to 1.909 mmol/g. The N2 maximum adsorption capacity of 0–0.0895 mmol/g is observed only when the CO2 concentration reaches 10 %. It is followed by a slow decrease with further increase of CO2 concentration. In comparison, the variation range of N2 adsorption capacity under single-component conditions (0–5 MPa, 30 °C) is between 0–0.4338 mmol/g. N2 is more affected by CO2 during competitive adsorption.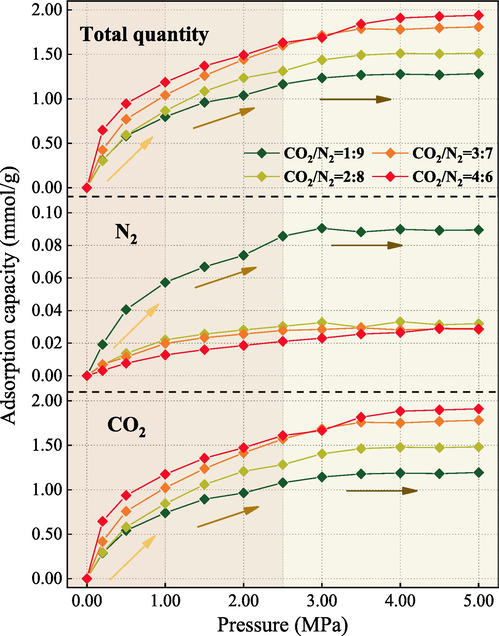
CO2/N2 competitive adsorption capacity on QYZ.
Fig. 13 shows the adsorption selectivity of coal for CO2 and N2. Adsorption capacity can provide a qualitative assessment of the relative strength of adsorption between two gases. However, for evaluating the magnitude of adsorption capacity, adsorption selectivity is more intuitive. The adsorption selectivity range of CO2 competitively adsorbing N2 is 99.55–302.7, significantly exceeding 1. Below 0.5 MPa, a higher CO2 concentration gives better adsorption selectivity for N2. In contrast, at 1–5 MPa, a CO2/N2 ratio of 2:8 demonstrates superior adsorption advantages.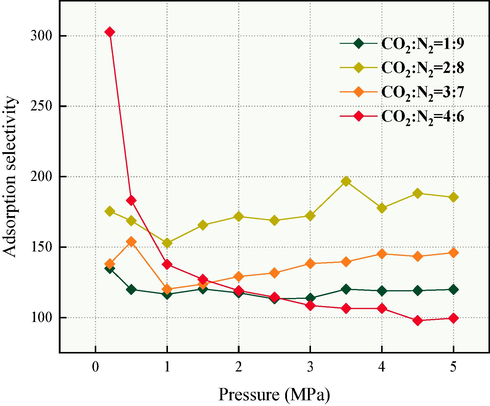
CO2/N2 competitive adsorption selectivity on QYZ.
3.4 Optimization CO2/N2 ratio for SAC
Comparing the results of single-component and competitive adsorption of CO2, it was observed that at each pressure, the SAC of single-component adsorption was larger than that of competitive adsorption. Long et al. similarly studied the analogous cases of adsorption capacities (Long et al., 2021). In the competitive adsorption, the maximum SAC was achieved when CO2/N2 = 4:6, reaching 1.909 mmol/g. Observe the adsorption selectivity, CO2/N2 = 2:8 was found to be the most favorable for coal adsorption of CO2 under most pressure conditions. Thus, we established a priority (shown in Fig. 14) based on the SAC at different pressures as follows: the maximum SAC of the single-component (CS) > the SAC of CO2/N2 = 4:6 (C4:6) > the SAC of CO2/N2 = 2:8 (C2:8). Based on this, we developed a fuzzy optimization method for selecting the CO2/N2 proportion, using the absolute difference as the primary threshold and relative relations as the auxiliary threshold. Yan et al. used similar methods to propose effective prediction strategies for coal intensity changes due to carbon dioxide adsorption (Yan et al., 2020).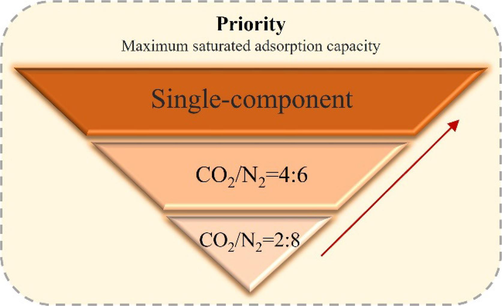
Priority of maximum saturated adsorption capacity.
To examine the relative relationships between the values, we introduced the average of ratios (AOR) as an auxiliary threshold, which is represented by Eq. (1). The average of differences (AOD) as the primary threshold was then proposed to investigate the absolute differences between the values, as shown in Eq. (2).
Table 9 shows the calculated results. When the SAC is less than the corresponding threshold, the difference in coal adsorption characteristics between the two components is ignored and the subsequent priority is selected. CO2/N2 mixture ratio at 2:8 is selected if CS C4:6, CS C2:8, and C4:6 C2:8 are all less than their respective threshold; CO2/N2 mixture ratio at 4:6 is selected if CS C4:6 and CS C2:8 are both less than their respective threshold; otherwise, CO2 is selected.
Threshold
CS C4:6
CS C2:8
C4:6 C2:8
AOR
1.21
1.70
1.37
AOD
0.25
0.59
0.34
Table 10 shows the optimum choice of CO2/N2 ratio based on AOR and AOD. There is a similar law between CS–C4:6 is below AOD1 and CS/C4:6 is below AOR1 at 3–5 MPa. CS/C2:8 is below AOR2 at 1.5–5 MPa, and CS/C2:8 is below AOR3 at 1.5–5 MPa. From the SAC, single-component CO2 has the best effect at 0.2–2.5 MPa, while CO2/N2 mixture ratio at 4:6 is selected at 3.5–5 MPa owing to CS–C4:6 is below AOD1. At 3 MPa C4:6–C2:8 is lower than AOD3, so CO2/N2 mixture ratio at 2:8 is selected using adsorption selectivity as a reference.
Pressure
SAC (mmol/g)
AOR1
1.21
AOR2
1.70
AOR3
1.37
AOR
Selection
AOD1
0.25
AOD2
0.59
AOD3
0.34
AOD Selection
Cs
C4:6
C2:8
Cs/C4:6
Cs/C2:8
C4:6/C2:8
Cs–C4:6
Cs–C2:8
C4:6–C2:8
0.2
1.05
0.64
0.30
1.61
3.47
2.15
4:6
0.40
0.74
0.35
CO2
0.5
1.30
0.94
0.59
1.38
2.19
1.59
CO2
0.35
0.71
0.35
CO2
1
1.52
1.19
0.87
1.28
1.76
1.37
CO2
0.34
0.66
0.32
CO2
1.5
1.76
1.37
1.08
1.28
1.62
1.26
CO2
0.38
0.67
0.29
CO2
2
1.86
1.49
1.24
1.25
1.51
1.21
CO2
0.37
0.63
0.26
CO2
2.5
1.98
1.63
1.31
1.21
1.51
1.24
CO2
0.35
0.67
0.32
CO2
3
1.92
1.69
1.44
1.14
1.33
1.17
2:8
0.23
0.48
0.25
2:8
3.5
1.89
1.84
1.49
1.03
1.27
1.23
2:8
0.05
0.40
0.35
4:6
4
2.01
1.91
1.51
1.05
1.33
1.26
2:8
0.10
0.50
0.40
4:6
4.5
2.11
1.93
1.51
1.09
1.40
1.28
4:6
0.18
0.60
0.42
4:6
5
2.00
1.94
1.51
1.03
1.32
1.28
2:8
0.06
0.49
0.42
4:6
4 Application of CO2/N2 ratio optimization method
Inerting technology encompasses the injection of CO2/N2 into the goaf through three methods: pipeline, buried pipeline, and borehole injection (Liang and Luo, 2008). This can be used to inert the coal at specific zone of goaf. However, as the working face advances, the distance between the injection pipeline and the target zone increases, as shown in Fig. 10. This leads to a redistribution of pressure at the zone. The injection process at the target zone can be seen as multiple-adsorption of CO2/N2 on coal. Investigation demonstrates that true effectiveness in inertization and fire prevention is achieved only when CO2/N2 adsorption nears saturation within the coal. This emphasizes the significance of optimizing inerting methods to maintain safe working conditions in coal mine.
In practical field applications, the fuzzy optimization method needs to accommodate the pressure of the CO2/N2 injection. For example, at 5 MPa, an optimal injection ratio of CO2/N2 mixture ratio at 4:6 can be selected. When the injection point moves backward, the pressure drops to 2.5 MPa, single-component injection of CO2 becomes viable. This method facilitates the saturation adsorption of inerting gases on coal, leading to enhanced inerting efficiency and cost savings through reduced injection volume.
5 Conclusions
In this paper, different oxidation stages of QYZ and the influence of different CO2 adsorption degree on CSC were studied through a series of experiments, and the SAC index was proposed. The adsorption characteristics of CO2/N2 single-component and four multi-components under different pressures were studied using molecular simulation methods. Finally, the optimization method of CO2/N2 injection ratio based on SAC is proposed to provide theoretical parameter selection and guidance for mixed gas injection fire prevention in goaf. The main conclusions are as follows:
(1) In the program heating experiment, the physical adsorption stage temperature of QYZ is below 323.15 K. After pretreatment of QYZ with different CO2 adsorption degree, the combustion activation energy of coal samples follows the sequence of second-stage adsorption coal > dried coal > raw coal > first-stage adsorption coal, which indicates that CO2 saturated adsorption plays a crucial role in inhibiting CSC.
(2) Below 303.15 K, QYZ exhibits initial growth and gradual saturation in two CO2 adsorption stages. The residual CO2 from the first-stage adsorption affects the second-stage adsorption. Compared with previous studies, it is found that in the coal physical adsorption stage (303.15 K), the adsorption of CO2 on coal gradually reaches a balance between adsorption and desorption with the increase of pressure, which is considered as the adsorption saturation of coal. Therefore, we propose the concept of Saturation Adsorption Capacity (SAC).
(3) The SAC of CO2 is greater than that of N2, and the SAC of CO2/N2 is mainly affected by the CO2, which indicate that CO2 has absolute superiority in single-component and competitive saturation adsorption. In this case, the average of ratios (AOR) and average of differences (AOD) threshold are determined. The priority of SAC is obtained in the order of single-component (CS), CO2/N2 mixture ratio at 4:6 (C4:6), CO2/N2 mixture ratio at 2:8 (C2:8) from largest to smallest.
(4) A fuzzy optimization method of CO2/N2 injection ratio at different pressure is established according to the dynamic change of the actual goaf pressure, and the optimal CO2/N2 injection ratio was determined to achieve saturated adsorption of inert gas in coal. In actual production, the single-component CO2 injection is selected between 0.2 to 2.5 MPa. At 3 MPa, a mixture of CO2/N2 at a ratio of 2:8 is the best for prevent fires in goaf. Similarly, an inert gas with a CO2/N2 ratio of 4:6 is injected at 3–5 MPa.
CRediT authorship contribution statement
Junhong Si: Funding acquisition, Investigation, Methodology, Project administration, Resources, Writing – review & editing. Zihao Zhao: Conceptualization, Visualization, Writing – original draft, Writing – review & editing. Lin Li: Investigation, Methodology, Resources, Writing – review & editing. Genyin Cheng: Funding acquisition, Project administration, Resources, Supervision. Junchao Chen: Investigation, Resources.
Acknowledgments
This work was supported by the National Natural Science Foundation of China [grant numbers 52074122, 51804120], the Natural Science Foundation of Hebei Province in China [grant number E2021508010], and the Fundamental Research Funds for the Central Universities [grant numbers 3142023053, 3142023077, 3142023059].
Declaration of competing interest
The authors declare that they have no known competing financial interests or personal relationships that could have appeared to influence the work reported in this paper.
References
- Molecular simulation of N2 and CO2 injection into a coal model containing adsorbed methane at different temperatures. Energy. 2021;219:119686.
- [Google Scholar]
- Simulation of the adsorption behavior of CO2/N2/O2 and H2O molecules in lignite. J. China Coal Soc.. 2021;46:960-969.
- [Google Scholar]
- Effects of inert gas CO2/N2 injection on coal low-temperature oxidation characteristic: experiments and simulations. Arab. J. Chem.. 2023;16:104510.
- [Google Scholar]
- Study on carbon monoxide, carbon dioxide and oxygen competitive adsorption properties of bituminous coals. Coal Sci. Technol.. 2023;51:111-121.
- [Google Scholar]
- Molecular simulation of gas adsorption characteristics and diffusion in micropores of lignite. Fuel. 2020;269:117443.
- [Google Scholar]
- Study on gas adsorption and desorption characteristics on water injection coal. J. Saudi Chem. Soc.. 2023;27:101645.
- [Google Scholar]
- Multi-component gases competitive adsorption on residual coal under goaf conditions based on Monte Carlo simulation. Chem. Phys. Lett.. 2021;771:138557.
- [Google Scholar]
- Study on empirical formula and heterogeneity for adsorption rate of CO2, N2 and CH4 by coal. J. Saf. Sci. Technol.. 2020;16:83-88.
- [Google Scholar]
- Competitive adsorption behavior and mechanism of different flue gas proportions in coal. J. China Coal Soc.. 2017;42:1201-1206.
- [Google Scholar]
- Molecular simulation of adsorption of gas in coal slit model under the action of liquid nitrogen. Fuel. 2019;255:115775.
- [Google Scholar]
- Experimental Study on Influencing Factors and Thermal Effects of CO2 Adsorption by Coal. ACS Omega. 2023;8:21906-21913.
- [Google Scholar]
- Current situation and development trend for coal mine fire prevention & extinguishing techniques in China. J. China Coal Soc.. 2008;33:126-130.
- [Google Scholar]
- Adsorption and diffusion behavior of two-component gases in coal particles at different temperatures. Fuel. 2023;339:126899.
- [Google Scholar]
- Molecular simulation of the competitive adsorption characteristics of CH4, CO2, N2, and multicomponent gases in coal. Powder Technol.. 2021;385:348-356.
- [Google Scholar]
- Study on the influence of key active groups on gas products in spontaneous combustion of coal. Fuel. 2023;344:128020.
- [Google Scholar]
- Insight on adsorption mechanism of coal molecules at different ranks. Fuel. 2020;267:117234.
- [Google Scholar]
- Experimental measurements of carbon dioxide, methane and nitrogen high-pressure adsorption properties onto Malaysian coals under various conditions. Energy. 2020;210:118575.
- [Google Scholar]
- CO2 sequestration potential of Charqueadas coal field in Brazil. Int. J. Coal Geol.. 2013;106:25-34.
- [Google Scholar]
- Comparative research on the influence of dioxide carbon and nitrogen on performance of coal spontaneous combustion. J. China Coal Soc.. 2014;39:2244-2249.
- [Google Scholar]
- Temperature distribution and dissipation in a porous media (coal)–CO2 system. Arab. J. Chem.. 2023;16:104979.
- [Google Scholar]
- Molecular simulation of the effect of CO2/N2 binary gas on methane adsorption in coal. Coal Geol. Explor.. 2022;50:127-136.
- [Google Scholar]
- Gas-heat characteristics and oxidation kinetics of coal spontaneous combustion in heating and decaying processes. Energy. 2022;250:123810.
- [Google Scholar]
- Coal oxidation characteristics and index gases of spontaneous combustion during the heating and cooling processes. Fuel. 2022;307:121806.
- [Google Scholar]
- Study on molecular dynamics simulation of competitive adsorption of compound inert gas in residual coal of goaf. J. Saf. Sci. Technol.. 2022;18:82-88.
- [Google Scholar]
- Differences of ability and competitiveness on coal adsorbing CO2, O2 and N2. Chinese J. Environ. Eng.. 2017;11:4229-4235.
- [Google Scholar]
- Study on the effect of extraneous moisture on the spontaneous combustion of coal and its mechanism of action. Energies. 2020;13(8):1969.
- [Google Scholar]
- Investigation of the influence of moisture during coal self-heating. Fuel. 2022;324:124581.
- [Google Scholar]
- Filling–adsorption mechanism and diffusive transport characteristics of N2/CO2 in coal: experiment and molecular simulation. Energy. 2023;282:128428.
- [Google Scholar]
- Simulation Study on Molecular Adsorption of Coal in Chicheng Coal Mine. Molecules (Basel, Switzerland). 2023;28:3302.
- [Google Scholar]
- Application of hybrid artificial intelligence model to predict coal strength alteration during CO2 geological sequestration in coal seams. Sci. Total Environ.. 2020;711:135029.
- [Google Scholar]
- Experimental Study on Adsorption Properties of CH4, CO2 and N2 and Their Multivariate Gases in Different Coal Ranks. Coal Technology. 2022;41:129-134.
- [Google Scholar]
- Research on difference in adsorption capacity of coal to CO2-N2, gas mixture with different proportions at 30℃. J. Saf. Sci. Technol.. 2023;19:80-85.
- [Google Scholar]
- Experimental research on spontaneous oxidization combustion characteristics of coal after pre-adsorption CO2. Combust. Sci. Technol. 2023:1-17.
- [Google Scholar]
- Comparative studies on the effect of mineral matter on physico-chemical properties, inherent moisture and drying kinetics of Chinese lignite. Energ. Conver. Manage.. 2015;93:197-204.
- [Google Scholar]
- Variation characteristics of active groups and macroscopic gas products during low-temperature oxidation of coal under the action of inert gases N2 and CO2. Fuel. 2022;307:121893.
- [Google Scholar]
- Construction and optimization of lignite molecular structure mode. J. Min. Sci. Technol.. 2021;6:429-437.
- [Google Scholar]
- Investigation into spontaneous combustion hazard and numerical simulation of nitrogen injectionfire prevention effects in the roof coal. J. China Coal Soc.. 2012;37:1015-1020.
- [Google Scholar]
- The effect of N2/CO2 blend ratios on the pyrolysis and combustion behaviors of coal particles: Kinetic and thermodynamic analyses. J. Loss Prev. Process Ind.. 2023;84:105120.
- [Google Scholar]


