

Translate this page into:
Optimization of heterogeneous Catalyst-assisted fatty acid methyl esters biodiesel production from Soybean oil with different Machine learning methods
⁎Corresponding authors. walidkamal.wr@gmail.com (Walid Kamal Abdelbasset), chsu@mail.mcut.edu.tw (Chia-Hung Su)
-
Received: ,
Accepted: ,
This article was originally published by Elsevier and was migrated to Scientific Scholar after the change of Publisher.
Peer review under responsibility of King Saud University.
Abstract
There is a growing attention to the bio and renewable energies due to fast depletion of fossil fuels as well as the global warming problem. Here, we developed a modeling and simulation method by means of artificial intelligence (AI) for prediction of the bioenergy production from vegetable bean oil. AI methods are well known for prediction of complex and nonlinear process. Three distinct Adaptive Boosted models including Huber regression, LASSO, and Support Vector Regression (SVR) as well as artificial neural network (ANN) were applied in this study to predict actual yield of Fatty acid methyl esters (FAME) production. All boosted utilizing the Adaptive boosting algorithm. The important influencing parameters on the biodiesel production such as the catalyst loading (CAO/Ag, wt%) and methanol to oil (Soybean oil) molar ratio were selected as the input variables of models while the yield of FAME production was selected as output. Model hyper-parameters were tuned to maintain generality while improving prediction accuracy. The models were evaluated using three distinct metrics Mean Absolute Error (MAE), Root Mean Square Error (RMSE), and R2. Error rates of 8.16780E-01, 4.43895E-01, 2.06692E + 00, and 3.92713 E-01 were obtained with the MAE metric for boosted Huber, SVR, LASSO and ANN models. On the other hand, the RMSE error of these models were about 1.092E-02, 1.015E-02, 2.669E-02, and 1.01174E-02, respectively. Finally, the R-square score were calculated for boosted Huber, boosted SVR, and boosted LASSO as 0.976, 0.990, 0.872, and 0.99702, respectively. Therefore, it can be concluded that although the boosted SVR and ANN models were better models for prediction of process efficiency in terms of error, but all algorithms had high accuracy. The optimum yield of 83.77% and 81.60% for biodiesel production were observed at optimum operating values from boosted SVR and ANN models, respectively.
Keywords
Bioenergy production
Fatty acid methyl ester (FAME)
Optimization and analysis
Transesterification process
Machine learning method

- FAME
-
Fatty acid methyl esters
- RMSE
-
Root Mean Square Error
- MAE
-
Mean Absolute Error
- SVR
-
Support Vector Regression
- ANN
-
Artificial Neural Network
- LASSO
-
Least Absolute Shrinkage and Selection Operator
Abbreviations
1 Introduction
Fossil fuels such as petroleum oil comprise 80% of current primary energy of world due to fast development of industries and economies (Qiu, 2019; Abas et al., 2015). However, fossil fuels have two main drawbacks environmental pollution as well as unsustainability and non-renewability (Bayat et al., 2015; Khounani, 2019). One of the best alternatives for fossil fuels are biofuels which are clean fuel, renewable and degradable (Guo, 2013). Fatty acid methyl esters (FAME) which are commonly referred as bioenergy can be generated from animal fats, waste edible oil and alcohol as well as vegetable oil through transesterification process (Alhassan, 2014; Ma, 2017). In transesterification, glycerides react with alcohols in the presence of a catalyst to form fatty acids esters and alcohol mixtures (Stavarache, 2005; Ma et al., 1998; Marchetti and Errazu, 2008). Catalysts can be homogeneous or heterogeneous catalysts. Despite of the main advantage of homogeneous catalyst such as high reactivity, they have some disadvantages including dissolution in the intermediate reagent, equipment corrosion and difficult separation from the solution media (Cole-Hamilton, 2003; Cole-Hamilton and Tooze, 2006). Heterogeneous catalyst due to ease of separation and reusability are used more favorably in transesterification process. The biodiesel production processes are very complex and nonlinear process and therefore designing and optimization of these processes are very difficult (Aghbashlo, 2021; Franceschini and Macchietto, 2007; Brásio, 2013). Complex scientific problems have been solved using data science tools in recent years. It has been demonstrated that machine learning (ML) modeling procedure can be a great alternative for prediction of the process efficiency in complex reactions including biodiesel production processes (Pelalak, 2021; Li, 2021; Chen, 2021; Heidari, 2020; Pelalak, 2021; Khoshmaram, 2021; Cao, 2021).
Similar to any other research area, chemical challenges, such as building chemical systems with tailored property and uncovering complicated structure–property relationships (SPRs), have started to benefit from data science (Hachmann, 2018; Pelalak, 2021; Jamalabadi, 2021). Data sets may be analyzed mathematically, allowing to discover previously unnoticed relationships and patterns, leading to new insights, patterns, rules, and guidelines. Different types of ML can be used in prediction of processes including supervised, semi-supervised, unsupervised, and reinforcement learning methods (Alberi, 2018; Pelalak, 2021). Huber regression, Least Absolute Shrinkage and Selection Operator (LASSO) regression, and Support Vector Regression (SVR) are common supervised regression models which used in modeling and simulation of complex processes (Fernández-Delgado, 2019). Although these models have good generality and efficiency in themselves, in order to improve the efficiency, the Adaboost as an ensemble method, can be added to these methods (Nowakowski, 2015).
D-driven Huber-type techniques are developed for linear and sparse regression in addition to mean estimation in high dimensions. The first step in each problem is to determine the sub-Gaussian concentration bounds under the least moment condition on the errors for the estimator that is based on the Huber-type method. These results that are considered as non-asymptotic can lead the way for choosing decisive tuning parameters. Some of these results have an independent interest which leads to the enhancement of the existing result through diminishing the scaling of the sample size (Friedman et al., 2010; Kim, 2007). The artificial neural network (ANN) is one of the computing models and effectively can predict the efficiency of biodiesel production (Pelalak, 2020; Pelalak, 2021; Heidari, 2022). The support vector machines (SVMs) are one of the most trending approaches in machine learning research. Variants of SVM or its different implementations are introduced every week, claiming unique in particular conditions. However, they are rarely compared to other methods or only a few primarily neural networks. SVM Regression is a sophisticated learning algorithm based on statistical learning theory ideas (Ralaivola and d’Alché-Buc, 2001; Mangasarian and Musicant, 2000; Mayoraz, 2001; Meyer et al., 2003).
The primary interest in LASSO regression a linear model with regularization is a linear model that predicts sparse coefficients. It is advantageous in specific settings because it prefers solutions with reduced non-zero coefficients, lowering the number of characteristics the supplied solution relies on. As a result, LASSO and its variants in compressed sensing are critical. It is possible to obtain the exact set of non-zero coefficients under certain circumstances (Catoni, 2012). One or a few essential samples on estimates of regression coefficients, particularly in the lasso regression, can also influence the estimator of shrinkage parameter, such that model selection findings based on the lasso will differ due to one or few samples (Kim, 2015).
In this study, different supervised regression modeling methods including Huber regression, LASSO, SVR and ANN models were selected for prediction of biodiesel production. Different operating factors including the catalyst loading (wt%) and methanol to oil molar ratio were selected as the models input while the biodiesel production efficiency was selected as the models output. The obtained results were compared and optimized conditions for highest amount of biodiesel production were selected.
2 Methodology
2.1 Data set
There are 20 data points, two inputs, and one output in the data set used in this study according to (Zhu, 2021). Table 1 represents the whole dataset that shows a small regression problem. The inputs are X1 = catalyst loading (CaO/Ag, wt%) and X2 = methanol to oil (Soybean oil) molar ratio and the output of these vectors, is Y = fatty acid methyl ester (FAME) production yield (%).
No.
X1 = Catalyst loading (CaO/Ag wt%)
X2 = Methanol:oil (Soybean oil) molar ratio
Actual yield (%)
1
1.17
9
76.34
2
1.17
9
75.56
3
2
6
73.52
4
2
6
72.73
5
2
12
80.27
6
2
12
79.84
7
4
4.76
68.32
8
4
4.76
67.17
9
4
9
80.46
10
4
9
82.56
11
4
9
82.41
12
4
9
83.48
13
4
13.24
83.23
14
4
13.24
82.07
15
6
6
62.32
16
6
6
61.05
17
6
12
78.05
18
6
12
77.45
19
6.83
9
65.46
20
6.83
9
66.32
2.2 Base models
This section introduces the base models used, including Huber regression, LASSO, and SVR, which Adabost will reinforce in this research. In previous studies such as (Zhou, 2018; Fan et al., 2017), estimators of the Huber-type were proposed for both high dimensional and low dimensional settings in addition to deriving non-asymptotic variance limits for the estimation error. In order to utilize each of Catoni’s methods or the Huber-type method, for balancing the estimation’s bias and robustness, the specification of a tuning parameter shown by τ is necessary. The analysis of the deviation proposes that the tuning parameter (robustification parameter) has to be adjusted with respect to dimension, confidence level, the variance of the noise, and sample size. Calibration plans are commonly Lepski's method or cross-validation, which requires an intense amount of computation, especially in the case of high dimensional approximation and large-scale interference problems for which the parameter's number can be exponential in the observation's number (Wang, 2020). For instance, an adaptive Huber-type estimator was proposed by (Avella-Medina, 2018) in order to approximate the high dimensional precision matrix and covariance matrix. For a covariance matrix with the dimension of d × d, despite the Huber-type method can robustly estimate every entry. At the same time, τ is chosen through cross-validation. The number of tuning parameters for the whole procedure equals d2, and by the growth of d, the cross-validation technique will become intractable from the computational aspect. Efficiently tuning is of importance for the interest of the problem and for usages in a more extensive context (Catoni, 2012; Huber, 1981; An et al., 1964).
The LASSO approach is used to minimize model complexity and prevent over-fitting in prediction models. The following βj parameters were used to optimize the residual sum of squares (Fu and Knight, 2000):
Vapnik pioneered SVR approach as a sophisticated learning algorithm based on statistical learning theory ideas (Vapnik, 1999). SVR is trained to detect the dependence connection between a set of goals
specified on R and inputs
that
, where n show the size of the dataset. So, the problem is transformed into a multidimensional feature, which can be matched using linear regression in order to accomplish this. Equation (3) is a possible representation of this concept (Dargahi-Zarandi, 2020):
An input vector can be transformed into something else using the mapping function
in this example. b and w denote the bias and weight axes (Amar et al., 2020). Model complexity and related experimental error are wrapped in the so-called “regularized risk function” to create a regression-purpose optimization problem for calculating w and b. What this means is that there is a problem (Keane et al., 2008):
Lagrange multipliers translate the restricted optimization problem indicated above into a dual vector space. Next, the resultant Lagrangian is resolved. The transformation phase and resolution phase are described formerly (Keane et al., 2008). The resulting answer is as follows (Shawe-Taylor and Cristianini, 2004):
2.3 Adaboost
Freund and Schapire (Freund and Schapire, 1997) proposed AdaBoost algorithm as an ensemble learning approach. Because of the possibilities of this technique, it has gained popularity. This approach, adaptively boosts basic models, allowing them to solve complicated situations. There are two methods to solve tough problems: simple models and sophisticated models. Simple models have good generalization qualities due to their simplicity of structure, which is one of the reasons for their appeal (Buitinck, et al., 1309). The AdaBoost approach is presented to address such challenges. In this method, a weak learner is employed, and then the learner and the other models are merged gradually and consistently to form a robust system capable of dealing with complex case (Lemaître et al., 2017).
2.4 ANN modeling
The ANN modeling was performed based on ten hidden layers according to Fig. 1 in JMP software. One linear and two non-linear (TanH) as well as one Gaussian functions were used in the hidden layer’s nodes. The trial-and-error method was used for optimization of biodiesel production.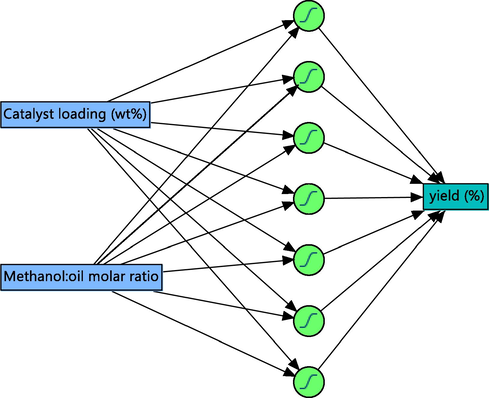
Prediction of biodiesel production by ANN model.
3 Results and discussion
The predictability capability of the hybrid intelligence models was examined using a number of statistical performance prediction skills metrics that quantify the absolute inaccuracy in prediction including mean absolute error (MAE), and root mean square error (RMSE) according Equation (6) and (7) (Pelalak, 2021):
here,
is the experimental value and
is the predicted value of
and N is the number of data. Also, R-squared (Equation (8)) metrics are used in this study (Pelalak, 2021):
Table 2 shows the optimized values of the hyper-parameters. In this table, the learning rate is the weight applied to each regressor during each boosting iteration. The loss function was also used to update the weights after every boosting iteration. These optimal values are obtained using the grid search method, and more than 1000 runs of different combinations are done to find them.
Models
Number of estimators
Learning
RateLoss
FunctionTolerance
Alpha
C
kernel
Adaptive Boosted Huber Regressor
25
1.7
square
5.0 × 10⁻⁵
0.00215
–
–
Adaptive Boosted Support Vector Regressor
35
1.5
linear
6.0 × 10⁻⁵
–
1.5
poly
Adaptive Boosted Lasso
50
1.7
square
0.0002
0.0055
–
–
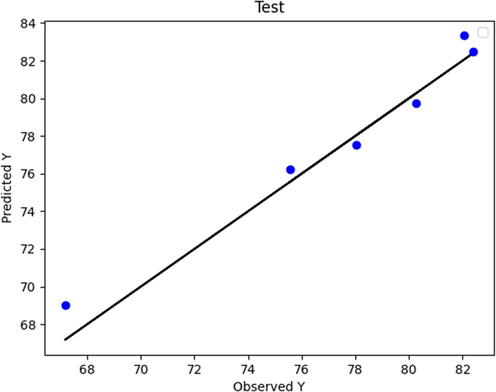
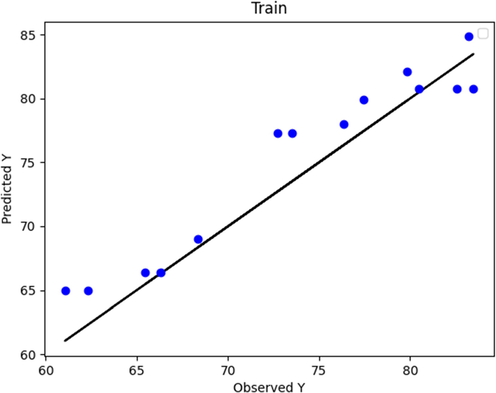
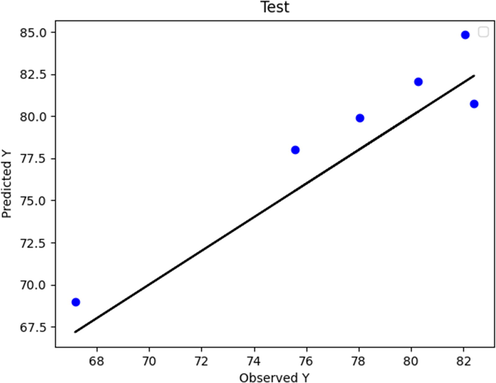
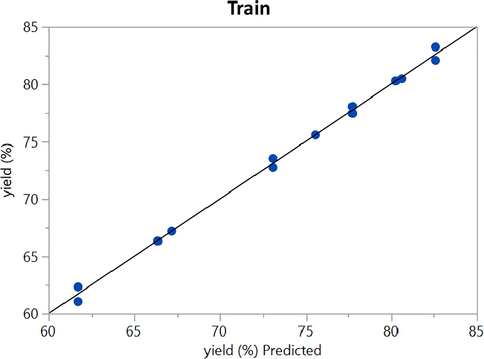
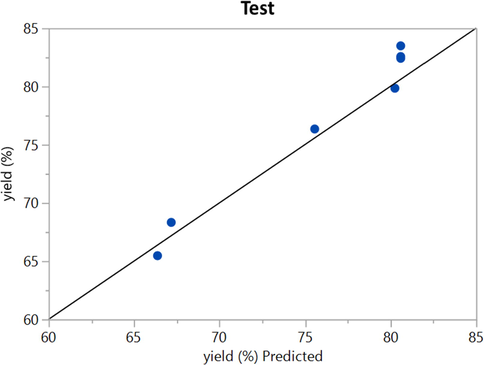
Figs. 2 to 9 show the predicted and actual values in the boosted Huber, boosted SVR, and boosted LASSO models made in the training and testing phase. By comparing Figs. 4 and 8 with Figs. 2 and 6, it can be concluded that in these figures, which is related to the boosted SVR and ANN, the predicted values were closer to the actual values, and this demonstrated the higher accuracy of boosted SVR and ANN in the training phase. Comparing the results obtained in the test phase (Figs. 3, 5, 7, and 9) demonstrated that there was a considerable dispersion between the actual and predicted values in the boosted LASSO model. This shows that the accuracy of the boosted LASSO model in the test phase was much less than the other two models. However, the boosted Huber, boosted SVR and ANN models were almost similar in the test phase and have almost the same accuracy.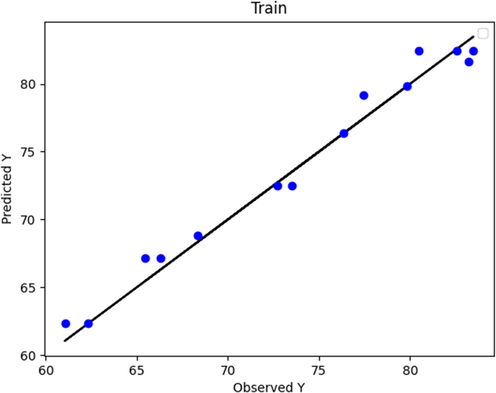
Boosted Huber (train phase): Actual vs. Predicted.
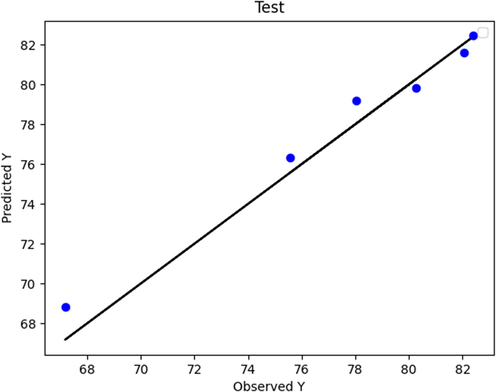
Boosted Huber (test phase): Actual vs. Predicted.
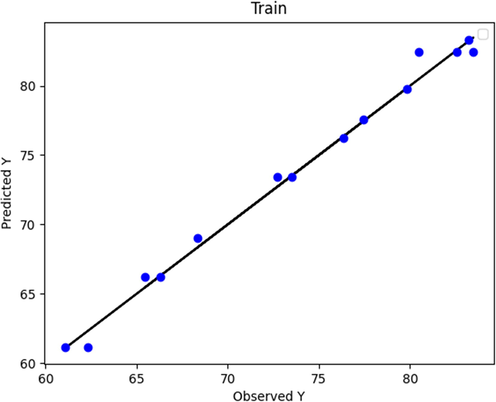
Boosted SVR (train phase): Actual vs. Predicted.
Boosted SVR (test phase): Actual vs. Predicted.
Boosted LASSO (train phase): Actual vs. Predicted.
Boosted LASSO (test phase): Actual vs. Predicted.
ANN (train phase): Actual vs. Predicted.
ANN (test phase): Actual vs. Predicted.
Also, the mentioned models were evaluated using three distinct metrics including MAE, RMSE, and R2. Table 3 summarizes the simulation results of model performance with the criteria defined in the relevant section. As can be seen the MAE metric error rates of 8.16780E-01, 4.43895E-01, 2.06692E + 00, and 3.92713 E-01 were obtained for boosted Huber, boosted SVR, LASSO, and ANN models. On the other hand, the RMSE error for boosted Huber, boosted SVR, LASSO, and ANN models were about 1.092E-02, 1.015E-02, 2.669E-02, and 1.01174E-02 respectively. Finally, the R2 score were calculated for boosted Huber, boosted SVR, and boosted LASSO, and ANN models as 0.976, 0.990, 0.872, and 0.99702 respectively. Based on the obtained results in train and test phases as well as the mentioned results in Table 3, it can be concluded that the boosted SVR and ANN model had the best experience in prediction of biodiesel production yield.
Models
MAE
R2
RMSE
Adaptive Boosted Huber Regressor
8.16780E-01
0.97665
1.09221E-02
Adaptive Boosted Support Vector Regressor
4.43895E-01
0.99029
1.01515E-02
Adaptive Boosted LASSO
2.06692E + 00
0.87237
2.66921E-02
Artificial Neural Network
3.92713 E-01
0.99702
1.01174E-02
The 3D plot in Fig. 10 shows the dual effect of catalyst amount and methanol to oil molar ratio on the biodiesel production yield. These results obtained from Adaptive Boosted SVR modeling method. As can be seen at different catalyst amount the molar ratio had different roles in production yield. In the lower amounts of catalysts increasing the methanol to oil ratio had no significant role in production of biodiesel which can be due to insufficient amount of available catalyst concentration that hinder the reaction progress. On the other hand, in higher amount of catalyst loading increasing the methanol to oil ratio had more significant role in production of biodiesel. This can be explained by sufficient catalyst amount in the solution. As it is obvious from Fig. 10 higher amount of catalysts in the solution had a revers effect on the process efficiency. This reduction can be due to the undesired soap formation reaction which increase the solution viscosity and decrease the process efficiency (Jaliliannosrati, 2013; Nayak and Vyas, 2019). Thus, an optimum value should be selected for this parameter to achieve the highest production rate of biodiesel.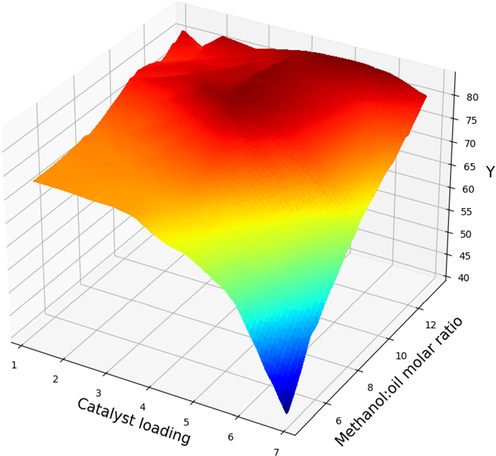
Two input features Projection with prediction surface in final Boosted SVR model: FAME yield (%) vs. the catalyst loading (wt%) and methanol to oil mass ratio.
Fig. 11 shows the 3D plots obtained from ANN results for predicted biodiesel production yield vs. input variables. Moreover, for better understanding the contour plots for prediction of biodiesel yield is shown in Fig. 12. As can be seen increasing the methanol to oil molar ratio, increased the FAME yield in the first stages which is in agreement with the obtained results of boosted SVR model. As mentioned above, in different amount of catalysts the role of methanol to oil ratio was different which was related to the amount of available catalysts in the reaction media. Similarly high catalysts amount reduced the process efficiency due to the undesired soap formation reactions (Jaliliannosrati, 2013; Nayak and Vyas, 2019). As can be seen in Figs. 11 and 12 after production yield reached to maximum, its amount was decreased. Therefore, it is very important to find the optimum values of each input variables to find the highest amount of biodiesel production yield.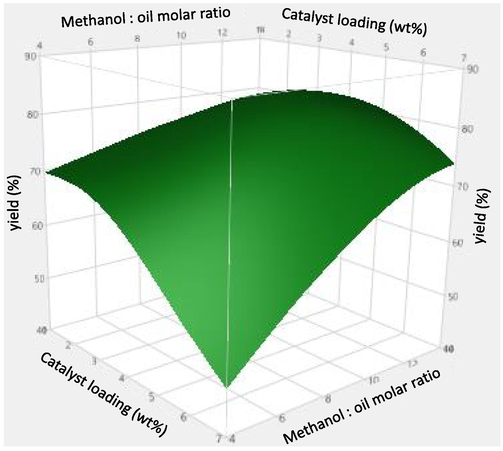
Two input features projection with prediction surface in ANN model: FAME yield (%) vs. the catalyst loading (wt%) and methanol to oil mass ratio.
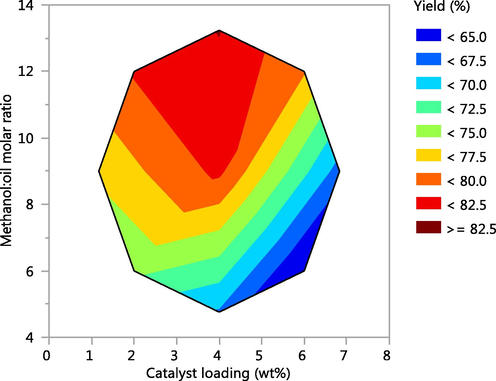
Contour plot in ANN model: FAME yield (%) vs. the catalyst loading (wt%) and methanol to oil mass ratio.
In order to optimize the biodiesel production yield boosted SVR and ANN model were employed, and the obtained results are mentioned in Table 4. According to these results the highest value of biodiesel production which is about 83.77% will be obtained at catalyst loading of 4 wt% and MeOH:oil molar ratio of 13.24. As can be seen ANN model predict that the maximum biodiesel production of 81.6% can be obtained when the catalyst loading is set at 4 wt%., methanol to oil molar ratio is set as 13.
Model
Catalyst loading (wt%)
Methanol:oil molar ratio
Actual yield (%)
Boosted SVR
4
13.24
83.77
ANN
4
13
81.60
Figs. 13 and 14 show the 2D presentation of effect of individual parameters on the biodiesel production yield. In each diagram one of the operating factors was changed while the other factors were kept constant. According to the diagram presented in Fig. 8, increasing the catalyst loading lead to the process yield increment. This can be because higher catalyst amount is available while a constant amount of methanol to oil is present in the reaction media. This trend was detected until the catalyst loading reached to 4% and after that the production yield was decreased due to occurrence of undesired reactions as mentioned before. As a result of these reactions the surface tension between glycerol phase and biodiesel will be reduced (Nayak and Vyas, 2019). These data are in agreement with the 3D diagram in Fig. 10.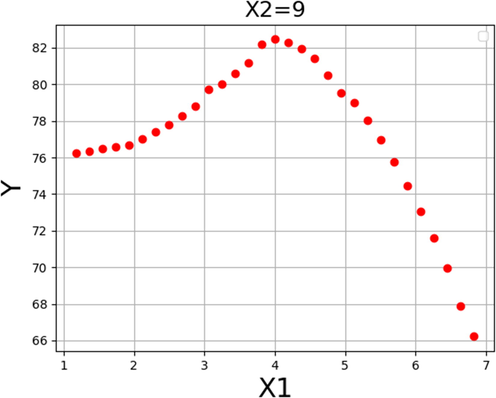
Response trend for Catalyst loading.
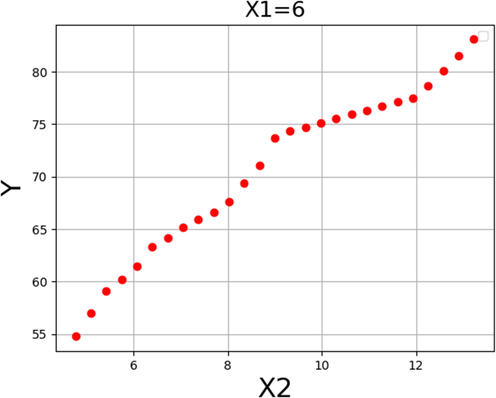
Response trend for Methanol:oil molar ratio.
Fig. 14 shows the individual effect of methanol to oil molar ratio on the production yield of transesterification process while the catalyst loading is kept constant at 6 wt%. According to the outcomes, it can be said that by increasing the molar the ratio up to the biodiesel production yield was increased. The reason can be due to the sufficient amount of available catalyst in the reaction medial which is around its optimum value. Therefore, increasing the methanol to oil molar ration has a positive effect on the biodiesel production yield.
4 Conclusion
Recently, there is an increase interest in using the machine learning (ML) methods for predicting the production of renewable energy. These methods not only help in production of high-quality bioenergy, but also lead to reducing the overall costs, and finding optimized conditions for biodiesel production. In this study three different Adaptive Boosted ML models including Huber regression, LASSO, Support Vector Regression (SVR) and Artificial Neural Network (ANN) were selected for simulation of biodiesel production. The catalyst loading (wt%) and the methanol to palm oil molar ratio were selected as the input variables of all models while the process yield was selected as the models’ output. The model hyper-parameters were then fine-tuned to maintain generality while enhancing prediction accuracy. Three independent metrics were used to evaluate the models. The MAE metric yields error rates of 8.16780E-01, 4.43895E-01, 2.06692E + 00 and 3.92713 E-01 were obtained for boosted Huber, boosted SVR, LASSO, and ANN models. The RMSE metric, the error rates were 092E-02, 1.015E-02, 2.669E-02, and 1.01174E-02, respectively. Finally, the R2 were determined as 0.976, 0.990, 0.872, and 0.99702 for boosted Huber, boosted SVR, boosted LASSO, and ANN models respectively. Given that all four algorithms had relatively good predictions with good approximation, the boosted SVR and ANN models appear to be better models. The effect of operating factors was evaluated on the biodiesel production and the highest yield of 83.77 and 81.60% were obtained at optimum conditions of boosted SVR (X1 = 4, X2 = 13.24) and ANN (X1 = 4, X2 = 13) models, respectively. Overall, the current study demonstrates the viability of different ML models for prediction of the biodiesel production yield.
Acknowledgments
The research fund by Princess Nourah bint Abdulrahman University Researchers Supporting Project number (PNURSP2022R99), Princess Nourah bint Abdulrahman University, Riyadh, Saudi Arabia is acknowledged.
Tazeddinova Diana is thankful to the South Ural State University (Russian Federation) and Zhangir Khan Agrarian Technical University (Republic of Kazakhstan) for their help and support in completing this work.
Bassem F. Felemban would like to thank Taif University Researchers Supporting Project number (TURSP-2020/260), Taif University, Taif, Saudi Arabia
Declaration of Competing Interest
The authors declare that they have no known competing financial interests or personal relationships that could have appeared to influence the work reported in this paper.
References
- Mild hydrothermal treatment on microalgal biomass in batch reactors for lipids hydrolysis and solvent-free extraction to produce biodiesel. Energy. 2019;189:116308
- [Google Scholar]
- Immobilization of microbes for bioremediation of crude oil polluted environments: a mini review. The Open Microbiol. J.. 2015;9:48.
- [Google Scholar]
- Techno-economic aspects of a safflower-based biorefinery plant co-producing bioethanol and biodiesel. Energy Convers. Manage.. 2019;201:112184
- [Google Scholar]
- Microalgae cultivation using an aquaculture wastewater as growth medium for biomass and biofuel production. J. Environ. Sci.. 2013;25:S85-S88.
- [Google Scholar]
- Co-solvents transesterification of cotton seed oil into biodiesel: effects of reaction conditions on quality of fatty acids methyl esters. Energy Convers. Manage.. 2014;84:640-648.
- [Google Scholar]
- Kinetics studies of biodiesel production from waste cooking oil using FeCl3-modified resin as heterogeneous catalyst. Renew. Energy. 2017;107:522-530.
- [Google Scholar]
- Fatty acids methyl esters from vegetable oil by means of ultrasonic energy. Ultrason. Sonochem.. 2005;12(5):367-372.
- [Google Scholar]
- The effects of catalyst, free fatty acids, and water on transesterification of beef tallow. Trans. ASAE. 1998;41(5):1261.
- [Google Scholar]
- Esterification of free fatty acids using sulfuric acid as catalyst in the presence of triglycerides. Biomass Bioenergy. 2008;32(9):892-895.
- [Google Scholar]
- Homogeneous catalysis–new approaches to catalyst separation, recovery, and recycling. Science. 2003;299(5613):1702-1706.
- [Google Scholar]
- Homogeneous catalysis—advantages and problems. In: Catalyst Separation, Recovery and Recycling. Springer; 2006. p. :1-8.
- [Google Scholar]
- Machine learning technology in biodiesel research: A review. Prog. Energy Combust. Sci.. 2021;85:100904
- [Google Scholar]
- Validation of a model for biodiesel production through model-based experiment design. Ind. Eng. Chem. Res.. 2007;46(1):220-232.
- [Google Scholar]
- Nonlinear model predictive control of biodiesel production via transesterification of used vegetable oils. J. Process Control. 2013;23(10):1471-1479.
- [Google Scholar]
- Synthesis, molecular dynamics simulation and adsorption study of different pollutants on functionalized mesosilica. Sci. Rep.. 2021;11(1):1967.
- [Google Scholar]
- Application of artificial neural networks and fuzzy logics to estimate porosity for Asmari formation. Energy Rep.. 2021;7:3090-3098.
- [Google Scholar]
- Chen, X., et al., Artificial neural network modeling and optimization of the Solid Oxide Fuel Cell parameters using grey wolf optimizer. 7 (2021), 3449–3459.
- Degradation of furosemide using photocatalytic ozonation in the presence of ZnO/ICLT nanocomposite particles: Experimental, modeling, optimization and mechanism evaluation. J. Mol. Liq.. 2020;319:114193
- [Google Scholar]
- Influence of machine learning membership functions and degree of membership function on each input parameter for simulation of reactors. Sci. Rep.. 2021;11(1):1-11.
- [Google Scholar]
- Supercritical process for preparation of nanomedicine: Oxaprozin case study. Chem. Eng. Technol.. 2021;44(2):208-212.
- [Google Scholar]
- Mathematical modeling and numerical simulation of CO2 capture using MDEA-based nanofluids in nanostructure membranes. Process Saf. Environ. Prot.. 2021;148:1377-1385.
- [Google Scholar]
- Hachmann, J., et al. Framing the role of big data and modern data science in chemistry. in NSF CHE Workshop Report (2018).
- Extraction of ingredients from tea leaves using oxidative enzymatic reaction and optimization of extraction conditions. Sci. Rep.. 2021;11(1):1-19.
- [Google Scholar]
- Nonlinear vibration analysis of functionally graded GPL-RC conical panels resting on elastic medium. Thin-Walled Struct.. 2021;160:107370
- [Google Scholar]
- Predictive thermodynamic modeling and experimental measurements on solubility of active pharmaceutical ingredient: Lornoxicam case study. J. Mol. Liq.. 2021;326:115285
- [Google Scholar]
- An extensive experimental survey of regression methods. Neural Netw.. 2019;111:11-34.
- [Google Scholar]
- Remote sensing data binary classification using boosting with simple classifiers. Acta Geophys.. 2015;63(5):1447-1462.
- [Google Scholar]
- Regularization paths for generalized linear models via coordinate descent. J. Stat. Softw.. 2010;33(1):1.
- [Google Scholar]
- An interior-point method for large-scale $\ell_1 $-regularized least squares. IEEE J. Sel. Top. Signal Process.. 2007;1(4):606-617.
- [Google Scholar]
- Degradation of sulfonamide antibiotics using ozone-based advanced oxidation process: Experimental, modeling, transformation mechanism and DFT study. Sci. Total Environ.. 2020;734:139446
- [Google Scholar]
- Efficient oxidation/mineralization of pharmaceutical pollutants using a novel Iron (III) oxyhydroxide nanostructure prepared via plasma technology: Experimental, modeling and DFT studies. J. Hazard. Mater.. 2021;411:125074
- [Google Scholar]
- A new insight into catalytic ozonation of sulfasalazine antibiotic by plasma-treated limonite nanostructures: Experimental, modeling and mechanism. Chem. Eng. J.. 2022;428:131230
- [Google Scholar]
- Incremental support vector machine learning: A local approach. In: International Conference on Artificial Neural Networks. Springer; 2001.
- [Google Scholar]
- Robust linear and support vector regression. IEEE Trans. Pattern Anal. Mach. Intell.. 2000;22(9):950-955.
- [Google Scholar]
- Multiclass classification with pairwise coupled neural networks or support vector machines. In: International Conference on Artificial Neural Networks. Springer; 2001.
- [Google Scholar]
- Challenging the empirical mean and empirical variance: a deviation study. In: in Annales de l'IHP Probabilités et statistiques. 2012.
- [Google Scholar]
- Case influence diagnostics in the lasso regression. J. Korean Stat. Soc.. 2015;44(2):271-279.
- [Google Scholar]
- Soybean biodiesel production using synergistic CaO/Ag nano catalyst: Process optimization, kinetic study, and economic evaluation. Ind. Crops Prod.. 2021;166:113479
- [Google Scholar]
- A new perspective on robust M-estimation: Finite sample theory and applications to dependence-adjusted multiple testing. Ann. Stat.. 2018;46(5):1904.
- [Google Scholar]
- Estimation of high dimensional mean regression in the absence of symmetry and light tail assumptions. Journal of the Royal Statistical Society. Series B. Stat. Methodol.. 2017;79(1):247.
- [Google Scholar]
- Robust estimation of high-dimensional covariance and precision matrices. Biometrika. 2018;105(2):271-284.
- [Google Scholar]
- Robust Statistics. New York: Wiler; 1981.
- An, H. and J.T. Landis, PJ Huber. Robust estimation of a location parameter. Ann. Math. Statist., 35: 73–101, 1964. ISSN 0003-4851. URL http://dx. doi. org. libproxy. lib. unc. edu/10.1214/aoms/1177703732.[p] PJ Huber and EM Ronchetti. Robust Statistics. Wiley Series in Probability and Statistics. John Wiley & Sons, 2009. ISBN 978-0-470-12990-6. URL http://dx. doi. org. libproxy. lib. unc. 2009, wiley series in probability and statistics. john wiley & sons.
- Vapnik, V., The nature of statistical learning theory. 1999: Springer science & business media.
- Modeling minimum miscibility pressure of pure/impure CO2-crude oil systems using adaptive boosting support vector regression: Application to gas injection processes. J. Petrol. Sci. Eng.. 2020;184:106499
- [Google Scholar]
- Applying hybrid support vector regression and genetic algorithm to water alternating CO2 gas EOR. Greenhouse Gases. Sci. Technol.. 2020;10(3):613-630.
- [Google Scholar]
- Keane, A., A. Forrester, and A. Sobester, Engineering design via surrogate modelling: a practical guide (2008), American Institute of Aeronautics and Astronautics, Inc.
- Shawe-Taylor, J. and N. Cristianini, Kernel methods for pattern analysis (2004), Cambridge university press.
- A decision-theoretic generalization of on-line learning and an application to boosting. J. Comput. Syst. Sci.. 1997;55(1):119-139.
- [Google Scholar]
- Buitinck, L., et al., API design for machine learning software: experiences from the scikit-learn project. arXiv preprint arXiv:1309.0238, (2013).
- Imbalanced-learn: A python toolbox to tackle the curse of imbalanced datasets in machine learning. J. Mach. Learn. Res.. 2017;18(1):559-563.
- [Google Scholar]
- Oak wood ash/GO/Fe3O4 adsorption efficiencies for cadmium and lead removal from aqueous solution: Kinetics, equilibrium and thermodynamic evaluation. Arabian J. Chem.. 2021;14(3):102991
- [Google Scholar]
- Microwave assisted biodiesel production from Jatropha curcas L. seed by two-step in situ process: Optimization using response surface methodology. Bioresour. Technol.. 2013;136:565-573.
- [Google Scholar]
- Optimization of microwave-assisted biodiesel production from Papaya oil using response surface methodology. Renew. Energy. 2019;138:18-28.
- [Google Scholar]


