

Translate this page into:
Optimization of high expression and purification of recombinant streptokinase and in vitro evaluation of its thrombolytic activity
⁎Corresponding author at: Department of Biochemistry and Molecular Biology, Theodor Bilharz Research Institute, Giza 12411, Egypt. samitbri@gmail.com (Sami Mohamed Nasr),
-
Received: ,
Accepted: ,
This article was originally published by Elsevier and was migrated to Scientific Scholar after the change of Publisher.
Peer review under responsibility of King Saud University.
Abstract
Background
Streptokinase (SK) is a potent plasminogen activator naturally produced by beta-hemolytic streptococcus bacteria and used as a thrombolytic drug.
Objectives
Optimize high yield production of recombinant streptokinase (rSK) in Escherichia coli and evaluate its thrombolytic activity.
Methods
Synthetic gene encoding mature SK protein with optimization for rare codons and mRNA secondary structure was cloned into the expression vector pET-3a and transformed into Escherichia coli BL21 (DE3). Seed banks were established for high rSK expression clones. The native rSK protein expression was optimized using IPTG induction. The nonsoluble rSK inclusion bodies were purified, denatured in 6 M guanidinium chloride, and refolded using the rapid dilution method. The refolded rSK protein was purified using anion exchange chromatography and evaluated with ELISA. The activity of rSK was evaluated using the casein digestion method and in vitro blood clot lysis assay with reference drug Sedonase as standard.
Results
Seed banks with high stable expression of native rSk (MW 47 kDa) were established. High rSK expression was optimized using 1 mM IPTG at bacterial OD600 0.6. The refolded rSK was prepared and purified successfully with high productivity (494 mg purified rsk/L culture). Using ELISA, the purified rSK molecular identity and conservation of native SK epitopes were confirmed. The enzymatic activity of the purified rSK was 1.945x10⁶ IU/mg with 62.94 ± 2.3% clot lysis efficiency.
Conclusion
A high yield production of proper rSK protein with in vitro thrombolytic activity similar to commercial SK has been achieved, suggesting a more cost-effective industrial production of its biosimilar drug.
Keywords
Streptokinase
Expression
Refolding
Purification
Activity assays

1 Introduction
The choice of a thrombolytic agent during therapy is dictated by several factors including the cost of the drug, the side-effects and their severity, in vivo stability and specificity towards fibrin clots, and immunological reactivity. Three major classes of thrombolytic drugs: tissue plasminogen activator (tPA), SK, and urokinase (UK). While drugs in these three classes can effectively dissolve blood clots, they differ in their detailed mechanisms in ways that alter their selectivity for fibrin clots (Aslanabadi et al., 2018).
Streptokinase (SK) was the first drug introduced as a therapy for acute myocardial infarction more than 40 years ago. Mature protein is a 47-kDa single-chain 414 amino acids protein that contains no disulfide bridges and is produced by beta-hemolytic Streptococcus bacteria. It has been used to break down clots in myocardial infarction (heart attack), pulmonary embolism, and arterial thromboembolism. It is used also to dissolve the fibrin of blood clots formed in shunts during kidney dialysis. This fast-acting drug is most effective in dissolving newly-formed clots and is often released at the site of the clot via a catheter inserted into an artery (Zia, 2020). It is one of the leading fibrinolytic agents in the treatment of thrombotic conditions, and it is on the World Health Organization's List of Essential Medicines (Organización Mundial de la Salud (OMS), 2019).
The production of rSK in E. coli expression systems helps to avoid the challenges faced with native SK produced in Streptococcus like high cost, presence of other antigenic proteins, and low yield (Avilán et al., 1997). rSK was found to have similar thrombolytic activity as that of the native SK (Assiri et al., 2014).
Several factors affect the production of recombinant proteins in E. coli like the nature of the protein, its posttranslational modifications, and codon usage in the organism besides induction conditions. The difference in codon usage between organisms could impair expression of cloned genes in heterologous expression hosts like E. coli due to the presence of rare codons. Occurrence of several rare codons in the gene makes ribosome stall at these positions due to the rarity of their cognate tRNAs and cause premature chain termination which affects production rates (Wang et al., 2016). Some E coli systems harbor additional plasmid expressing tRNAs for a few rare amino acids (like BL-21 codon plus, Invitrogen) have been used in our labs to solve this problem and yield high protein expression (Shaaban et al., 2019). But these systems require additional antibiotics to maintain tRNA plasmid (usually chloramphenicol, which inhibits protein synthesis) and don’t have the tRNAs for all the rare amino acids. Also, using two antibiotics and changing the balance of tRNA species could affect E. coli fitness and the success of expression (Lipinszki et al., 2018).
This study adopts a strategy for high yield rSK production in E. coli using synthetic SK gene designed for the exclusion of rare codons that arrest translation and exclusion of mRNA secondary structures that would prevent expression especially in the ribosomal binding sites and optimization of expression conditions.
2 Materials and methods
2.1 Synthetic SK gene preparation
Depending on DNA sequences for SK from group C (beta)-hemolytic streptococci retrieved from NCBI database, a synthetic gene encoding for the mature SK protein open reading frame (from aa 27, isoleucine, bp 79) has been designed using Codon usage analysis platform (http://www.kazusa.or.jp/codon/countcodon.html) to exclude the presence of rare codons which have no relative tRNA in E. coli for high expression in the used system. Also, restriction enzyme sites in the synthetic SK gene have been determined using NEBcutter V2.0-LabTools (http://nc2.neb.com/NEBcutter2/). The third step was to analyze, predict and modify mRNA seconady structure and complex hairpin loops that would prevent expression especially in the ribosomal binding sites for the SK mRNA expressed in E.coli after cloning in pET-3a using RNAfold 2.4.13. (http://rna.tbi.univie.ac.at/cgi-bin/RNAWebSuite/RNAfold.cgi). The designed synthetic gene was ordered from Biomatik Co., Canada.
3 Molecular cloning of the SK gene into the pET-3a vector
3.1 Ligation of the synthetic rSK gene into pET-3a expression vector
PCR was performed for the prepared synthetic gene using specifically designed primers (Table 1) and the proofreading enzyme (PFU). The PCR product and circular pET-3a vector (Novagen) were digested with NdeI and BamHI restriction enzymes (New England Biolabs Inc.). The digestion was performed in a 20 μl reaction volume containing: 2 μl 10 × buffer, 1–4 μg DNA, 1 unit enzyme/μg DNA, and H2O to make up the final volume. After incubation of the reaction mixtures at 37 °C for 2 h, the reactions were stopped by heat inactivation at 65 °C for 10 min and finally were applied to 1.5% Agarose gel electrophoresis (Lessard, 2013).
Primer name
Sequence
Restriction site
Forward SK
GGAATTCCATATGATTGCAGGTCCGGAATGG
NdeI
Reverse SK
CGCGGATCCTTATTTATCATTCGGATTATCCGG
BamHI
The linearized pET-3a vector and the digested SK PCR fragment were purified using the DNA Gel Extraction Kit (Norgen Biotec Corp). The concentration of purified DNA was measured using NanoDrop™ 2000 spectrophotometer (Thermo Fisher Scientific, USA). The ligation was carried out between linearized pET-3a and the digested rSK ORF fragment with a ratio of 3:1 (Lessard, 2013) using 1 unit of T4-DNA ligase (Thermo Fisher Scientific, USA).
3.2 Transformation of chemically competent TOP10 E. Coli
Fifty μl of chemically prepared OneShot TOP10 competent cells (Thermo Fisher Scientific, USA) were thawed on ice, and then 5 μl of the ligation reaction was added and mixed gently. After incubation in ice for 30 min, a heat shock at 42 °C for 90 s was performed, followed by immediate incubation on ice for 5 min. SOC medium (450 μl) was added to the cells and incubated for 1 h at 37 °C. About 150 μl of the suspension was plated out directly on LB agar plates containing ampicillin (50 μg/ml). The plate was incubated at 37 °C for 16–18 h (Froger and Hall, 2007). To evaluate the success of cloning, plasmid DNA extraction was performed for 5 ml cultures of selected transformed colonies using GeneJET Plasmid Miniprep kit (Thermo Fisher Scientific, USA). The purified plasmid preps were evaluated using 1% Agarose gel electrophoresis.
3.3 Analysis of transformed clones
To ensure proper, oriented in-frame ligation of SK into pET-3a expression vector and identity to the designed sequence, three steps were performed on the purified plasmid preps; PCR using SK gene-specific primers, PCR using SK reverse primer and T7 universal primer of the vector, digestion using NdeI and BamHI restriction enzymes and unidirectional DNA sequencing (Analysis Co., Egypt) using the vector T7 universal primer.
4 Seed banks development
4.1 Transformation of BL21 (DE3) E. Coli and clones’ selection
Transformation of chemically competent BL21 (DE3) (Novagen) was performed using 50 ng of the purified pET3a-SK plasmid confirmed in the previous step. Transformation reaction was plated directly on LB agar plates containing ampicillin (50 μg/ml). To evaluate the best expression clone and make glycerol stock for long-term preservation, several selected colonies were tested for rSK expression using 2 mM IPTG for 3 h as described later (Faust et al., 2015; Saber et al., 2017).
4.2 Seed banks establishment
A clone with the highest SK expression level was cultured and glycerol stocks (master seed bank) were prepared under highly selective conditions for long-term storage in −70. Glycerol stocks for 1st and 2nd generation cultures (working seed banks) of the master seed bank were prepared for further work and long-term storage (Winters and Winn, 2010). For detailed biochemical characterization of the seed banks and detection of any biochemical changes through the different generations, the Vitek 2 compact system (Biomerieux company) and Gram-negative identification cards (47 parameters) were used for the analysis of the biochemical profile of BL21 (DE3) in the seed banks
5 Preparation of rSK protein
5.1 Optimization of rSK expression
To optimize the expression of rSK, different pre-induction bacterial optical density at wavelength 600 nm (OD600) were tested (0.6, 0.8, and 1.2) using 1 mM IPTG for 6 h post-induction. Also, different concentrations of IPTG were tested (0.2, 1, and 1.5 mM) with 6 h post-induction as follows. A single colony of the master seed bank was inoculated into a 10 ml LB medium containing ampicillin (50 μg/ml) and cultivated overnight at 37 °C with shaking at 250 rpm in an environmental shaker. Dilution of the overnight culture was performed at a ratio of 1:10 with LB media containing the same antibiotic. Each culture (20 ml) was grown in the same condition and induced by adding IPTG at the determined OD600. After induction and measurement of post-induction OD 600, cultures were centrifuged at 7000g and 4 °C for 10 min. Pellets were resuspended in 0.5 ml of PBS buffer and sonicated. The rSK expression percentage (rSK%; SK expression percentage in total cell lysate protein) was evaluated in total cell lysates using 12% SDS-PAGE, Coomassie staining, and GelAnalyzer 19.1 software (Okasha et al., 2021).
5.2 Expression of rSK protein in seed banks
For each seed bank glycerol stock, a 50 ml overnight culture in selective LB medium was pelleted, resuspended in 50 ml selective LB media, diluted 1:10 with selective LB media (500 ml), and used for protein expression using the optimized condition. For each culture, cells were harvested and the pellets were stored at −70 °C.
5.3 Inclusion bodies (IBs) purification, solubilization, and rSK refolding
The harvested cells for 1-liter culture from the previous step (working seed banks cultures) were homogenized (4.2 g wet weight/ 25 ml lysis buffer 1 (0.1 M Tris-HCl pH7, 1 mM EDTA pH8, 1 M MgCl2)) for 3 min at 4 °C, using Ultraturrax homogenizer (10620 rpm). Lysozyme (1.5 mg/g of cells) was added, mixed, and incubated at 4 °C for 30 min. A complete homogenization was performed to disrupt the cells. Twelve ml of lysis buffer 2 (2 M urea, 60 mM EDTA, 6% Triton X-100, 1.5 M NaCl) was added and incubated for 30 min at 4 °C. The IBs were pelleted by centrifugation at 3,1000g and 4 °C for 10 min. The pellet was resuspended in lysis buffer 3 (0.1 M Tris-HCl pH7, 20 mM EDTA) using the Ultraturrax, then centrifugation was repeated, and IBs pellet was stored at −20 °C (Okasha et al., 2021). The pellet of IB was resuspended in 10 ml solubilization buffer (6 M guanidinium Cl, 0.1 M Tris-HCl pH8, 100 mM DTT, and 1 mM EDTA) and agitated for 2 h at 25 °C. Centrifugation was carried out at 10,000 g at 4 °C for 15 min to remove the debris. The supernatant contained the denatured rSK (Singh et al., 2015).
The rSK was refolded to its native structure using the rapid dilution method (Freydell et al., 2011). The solubilized IBs were diluted into the precooled (to 10 °C) refolding buffer (0.1 M Tris-HCl pH9, 2 M L-Arginine-HCl, 1 mM EDTA) under rapid mixing with a ratio of approximately 1:50 (v/v). After 12 h refolding at 10 °C, centrifugation was performed at 10,000 g, 10 °C for 20 min to precipitate the unfolded aggregated protein. The diluted refolded rSK was concentrated and put in another buffer (5 ml) suitable for the chromatographic purification using the cross-filtration cartridge, viva Flow 50 (MWCO 30 K Da, Sartirous) and vivaspin 20 (30 KDa GE Healthcare Life Sciences, Sweden).
5.4 Purification of rSK using anion-exchange chromatography
Using HiTrap® Q FF (1 ml) anion exchange chromatography column (GE Healthcare Life Sciences) and AKTA Purifier 100 FPLC system (GE Healthcare Life Sciences, Sweden), the rSK was purified. A sample containing refolded rSK (25 mg) in binding buffer A (50 mM Sodium phosphate buffer pH7) was centrifuged before applying to start buffer A equilibrated column (rate 0.5 ml/min). Linear gradient elution was carried out through 20 column volumes with an increase in ionic strength from 0 to 100% elution buffer B (50 mM Sodium phosphate buffer pH7 and 1 M NaCl). Fractions were collected, measured for protein concentration using Quick Start Bradford protein assay (Bio-Rad), and rSK bands were detected using 12% SDS-PAGE (Cheng et al., 2016).
6 Characterization of rSK
6.1 Enzyme-Linked ImmunoSorbent assay
To confirm the immunological identity of the rSK protein, Enzyme-linked immunosorbent assay (ELISA), which is considered the gold standard of immunoassays, was used. Polystyrene 96-well ELISA plate (Microtitre®) was coated overnight with 50 µl/well of serial dilution (2, 1, 0.5, and 0.25 mg/ml) of the reference drug Sedonase (1.5x10⁶ IU, SEDICO pharmaceutical Co., Egypt) as standard and the purified rSK (1 mg/ml) in 0.05 M carbonate buffer and the blank in triplicates. After washing with phosphate-buffered saline (PBS), blocking for non-specific binding sites was done using PBS containing 2% bovine serum albumin (BSA), 200 µl / well, for 1 h at room temperature. After washing with PBS containing 0.05% (v/v) Tween-20, 50 µl of 1–500 diluted Ab (polyvalent Rat anti-SK antibody, MyBioSource Inc) was applied/well. The plate was incubated at 37 °C for 1 h. After washing with PBS containing 0.05% (v/v) Tween-20. Fifty µl of the anti-rat IgG Ab HRP-conjugated (MyBioSource Inc) diluted in blocking buffer (0.2 µg/5 ml), was added at 50 µl / well and incubated at 37 °C for 1 h. After washing with PBS-containing 0.05% Tween-20, 50 µl of the chromogen solution A and 50 µl of chromogen solution B (MyBioSource Inc) were added to each well and then incubated for 15 min at 37◦C in dark. After sufficient color development, 50 μl of stop solution 3 N HCL was added to the wells. Then the absorbance was measured at wavelength 450 nm using Bio-Tek ELISA reader (Hidayat and Wulandari, n.d.).
6.2 Enzymatic activity evaluation using casein digestion method
Streptokinase (SK) activity was determined indirectly with the casein digestion method, which is based on the determination of the liberated tyrosine from digested casein after plasminogen activation. Reaction mixture (2 ml) containing 10 mg casein, 50 mM Tris-HCl, pH 8.0 and 0.1 ml of different concentrations (1.5, 1, 0.5, and 0.1 mg/ml) of purified rSK and Sedonase. The reactions were carried out at 37 °C for 20 min then it was terminated by the addition of 2.6 ml 5% w/v trichloroacetic acid (TCA) and 0.4 ml 3.3 M HCl. Reactions were then kept on ice for 30 min after which they were filtered using Whatman paper #1. The absorbance of the TCA soluble fractions was measured at 280 nm. Enzymatic activity of different concentrations of purified rSK was calculated using the standard curve of Sedonase (El-mongy et al., 2012).
6.3 Enzymatic activity evaluation using in vitro blood clot lysis assay
This assay was used to examine the thrombolytic activity by in vitro blood clot lysis activity according to a modified protocol of Babu & Subathra Devi (2015). Standard drug (Sedonase) as a positive control and purified refolded rSK were tested at different concentrations (1.5, 1, 0.5, and 0.1 mg/ml). A 200 μl of withdrawal blood from a healthy volunteer for each sample was left in the Eppendorf tube until clotting. Then 50 μl of each concentration was applied to the clotted blood and incubated for 30 min at room temperature. Distilled water was used as a negative (nonthrombolytic) control. The supernatant harboring the lysed clot was discarded and the remaining clot was weighed to substitute into the following equation: Percentage (%) of clot lysis = (weight of remaining clot after lysis/weight of clot before lysis) × 100 (Babu and Subathra Devi, 2015).
7 Statistical analysis
The data were presented as the mean ± SD of at least three replicates. The test of significance was performed by GraphPad Prism 7 (San Diego, California, USA). Paired T-test was employed to determine the significance of differences between groups. The ρ value < 0.05 was considered to indicate a statistically significant difference.
8 Results
8.1 Synthetic SK gene preparation
Analysis of group C (beta)-hemolytic streptococci mature SK ORF for the gene (WP_138098186.1) retrieved from NCBI database revealed 128 E. coli rare codons in the gene (31%). In the synthetic SK gene, these codons were replaced with common E. coli codons for the same amino acids. The absence of NdeI BamHI cutting site was confirmed in the synthetic gene. The secondary structure analysis for predicted rSK mRNA transcribed in E. coli revealed a very low minimum free energy (MFE) of the thermodynamic ensemble (-448.70 kcal/mol). The lyophilized synthetic gene was dissolved in 100 µl to give a concentration (100 µg/ ml).
8.2 Molecular cloning of SK gene into the pET-3a vector
Plasmid mini preparation was done for Top10 clones transformed with SK/ pET-3a ligation reaction and electrophoresed using 1% agarose gel electrophoresis (Fig. 1). One of these plasmid preps (pET-3a-SK-C1 clone) when tested using PCR with SK primers, a band of MW ∼ 1250 bp was detected in 12% agarose gel electrophoresis and when tested using PCR with reverse SK primer and T7 universal primer, a band of MW ∼ 1350 bp was detected (Fig. 2). The digestion of this plasmid using NdeI and BamHI restriction enzymes showed two bands that represent the plasmid and the SK insert (Fig. 2). Finally, the DNA sequencing of pET-3a-SK-C1 plasmid using T7 universal primer revealed exactly the predicted/designed sequence upstream and downstream of the SK gene start codon (data not shown).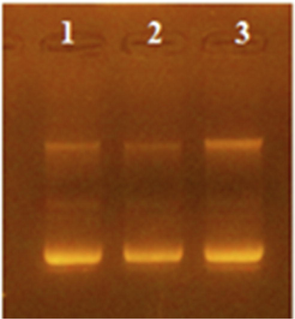
1% Agarose gel electrophoresis of plasmid preps for SK-pET-3a ligation reaction transformed TOP10 clones. Lanes 1,2, and 3 represent different isolated clones.
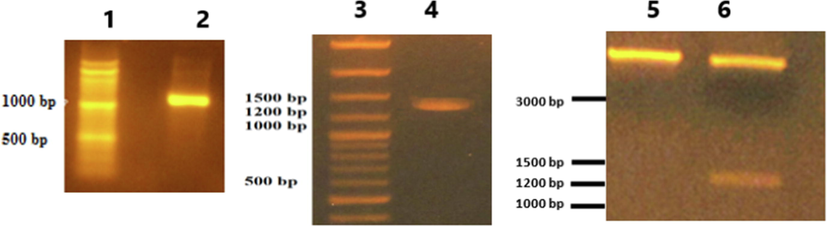
1.5 % Agarose gel electrophoresis of PCR analysis and restriction analysis of the pET-3a-SK-C1 plasmid construct. Lane (1 and 3): 100–3000 bp DNA ladder (MR171, Blirt). Lane (2): PCR product using the SK-specific primers at 55 °C annealing temperature. Lane (4): PCR product using the T7 universal primer and SK reverse primer at 55 °C annealing temperature. Lane (5): Undigested pET-3a-SK-C1 plasmid. Lane (6): Digestion of same plasmid using NdeI and BamHI.
8.3 Seed banks development
Clones of BL21 (DE3) bacteria transformed with pET-3a-SK-C1 plasmid construct have been isolated and tested for rSK expression after induction with 2 mM IPTG using 12% SDS-PAGE. One of the clones (lane 4, Fig. 3) showed a high expression rSK band with 47 kDa approximate molecular weight compared to non-induced and other induced bacterial clones.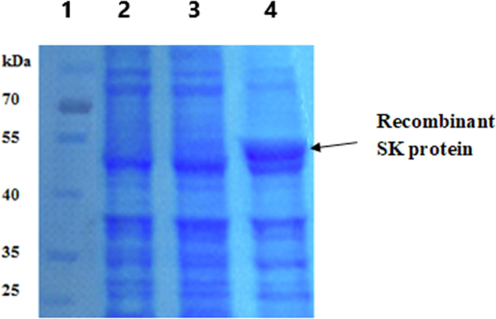
12% SDS-PAGE for detection of rSK protein expression in pET-3a-SK-C1 plasmid construct transformed BL21 (DE3) clones using 2 mM IPTG for 3 h. Lane (1): Excelband prestained protein MW ladder (10–180 kDa, Green BioResearch). Lane (2): non-induced bacteria lysate. Lanes (3 and 4): Induced bacteria lysates.
The clone with a high-level expression of rSK (lane 4, Fig. 3) have been used to prepare glycerol stock (master seed bank) and the 1st and 2nd generations cultures have been used to prepare glycerol stocks (the 1st generation working seed bank and the 2nd generation working seed bank). Analysis of IPTG-induced cultures taken from the three seed banks using the Vitek 2 compact system revealed exactly the same pattern concerning the 47 analyzed biochemical parameters (data not shown).
9 Preparation of rSK protein
Analysis of different induction conditions concerning the pre-induction OD600 revealed that: the highest rSK% (48 %) was attained at OD600 0.6, but the highest post-induction growth (OD600 3.7) was attained at OD600 1.2. Concerning the IPTG optimization, the highest rSK% (49 and 50) were attained using 1 and 1.5 mM IPTG concentrations but the highest growth (OD600 3.5) was attained using the 0.2 mM concentration (Fig. 4)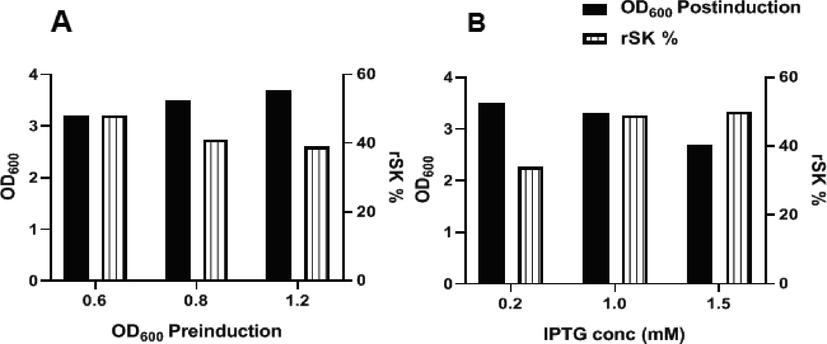
Optimization of rSK expression in cultures from Master seed bank. (A): effect of different pre-induction bacterial OD600 on rSK % and cell growth (measured as OD600 for cultures post-induction) after induction with 1 mM IPTG). (B): effect of induction with different IPTG concentrations on rSK% and cell growth.
Cultures (500 ml) from the three prepared SK seed banks (master, 1st, and 2nd generations working seed banks) were used for the preparation of the rSK using the optimized expression conditions. Results in Fig. 5a showed that a remarkable expression of SK protein in the three cultures. In addition, analysis of rSK% using GelAnalyzer 19.1 software showed mostly equal high expression (approximately 50%) in cultures from all three seedbanks with wet cell weight around 4.2 g/L.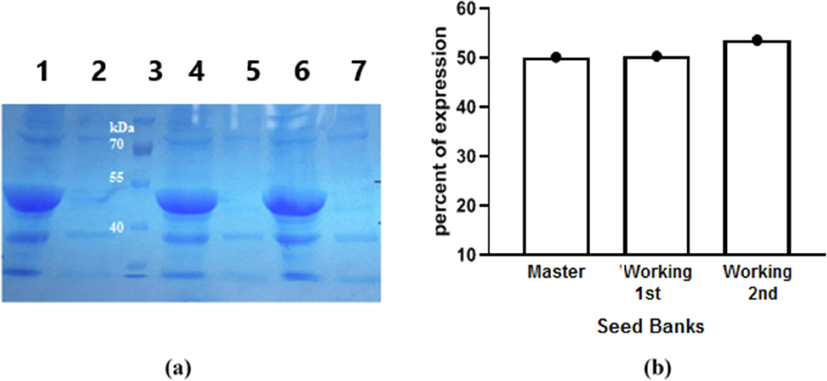
(a): 12% SDS-PAGE for expression of rSK protein in cultures prepared from the three seed banks using 1 mM IPTG as an inducer. Lane (1): Induced: from the master seed bank. Lane (2): Non-induced: from the master seed bank. Lane (3): Excelband prestained protein molecular weight marker (10–180 kDa, Green BioResearch). Lane (4): Induced: working seed bank 1st generation. Lane (5): Non-induced: working seed bank 1st generation. Lane (6): Induced: working seed bank 2nd generation. Lane (7): Non-induced: working seed bank 2nd generation. (b): Analysis of rSK protein percentage to total bacterial proteins (rSK%) in cultures from the three seed banks.
The IBs containing mainly rSK protein were purified successfully, denatured, and refolded following the mentioned protocols. The rSK protein concentration of cross filtered (in binding buffer A) refolding reaction (5 ml) was 147.5 mg/ml contained mainly the rSK protein (lane 3, Fig. 7). The chromatogram in (Fig. 6) shows the purification of rSK using HiTrap® Q FF anion exchange column and linear elution gradient. According to the pI of SK, the protein is anionic in pH above 4, so the pH of buffers used was 7. There were 2 main collected peaks at retention time 1.9 and 13.65 min. A sharp band was detected in the 2nd peak (1.5 ml) at the expected rSK MW as shown in (Fig. 7). The protein concentration in peak 2 was measured as 11.16 mg/ml (approximately a total of 16.75 mg purified rSK, 67 % of protein before purification).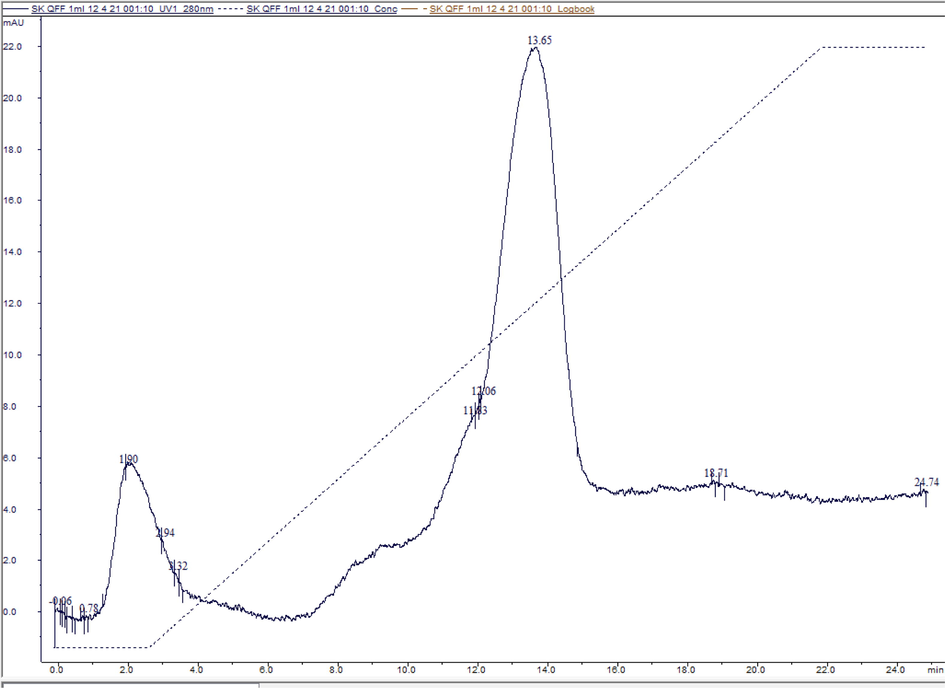
Chromatogram represents rSK purification using Hitrap Q-FF column. The Primary Y-axis represents absorbance UV280 in the Milli absorbance unit (mAU). The X-axis represents time in minutes (min).
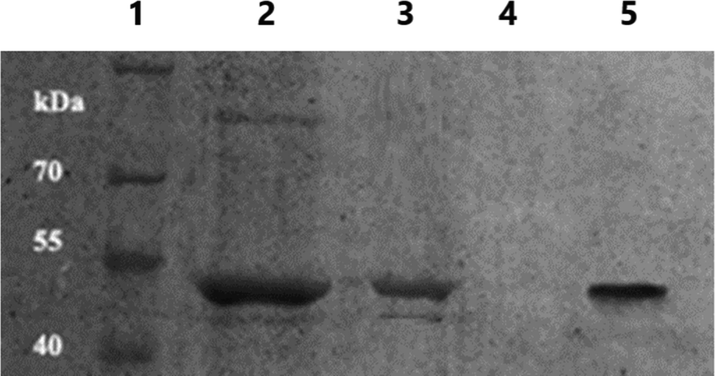
12% SDS-PAGE for different steps in rSK protein preparation and purification. Lane (1): Excelband prestained protein molecular weight marker (10 to 180 kDa, Green BioResearch). Lane (2): induced bacterial cells. Lane (3): purified IBs. Lane (4): chromatography peak 1 at retention time 1.9 min. Lane (5): chromatography peak 2 at retention time 13.65 min.
10 Characterization of rSK
10.1 Enzyme-Linked ImmunoSorbent assay
A standard curve was obtained using Sedonase (Fig. 8). According to this curve, the diluted purified (1ug/ml) rSK was detected and calculated to be 733.26 ng/ml.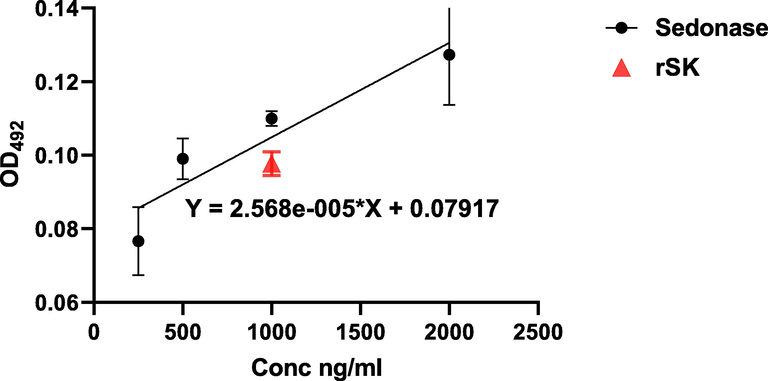
ELISA for SK: The calibration curve prepared using the reference drug (Sedonase) (circle symbol) (Correlation coefficient (r) = 0.94, P < 0.001). The diluted purified rSK sample measurement is represented by the Triangle symbol.
10.2 Enzymatic activity evaluation using casein digestion method
Results obtained showed that the activity of the Sedonase is significantly higher than the prepared rSK at the same tested concentrations (p < 0.05) (Fig. 9). The activity of the purified rSK was calculated according to the standard curve (Fig. 10) to be 1.95 × 10⁶ IU/mg, while the Sedonase had 2.5 × 10⁶ IU/mg.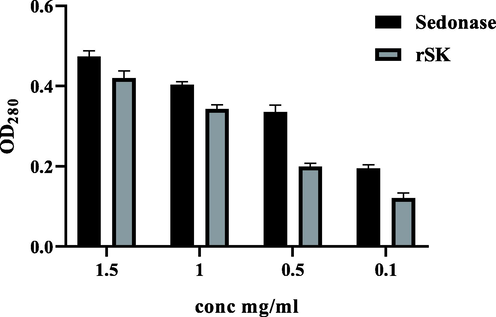
Enzymatic activity using Casein digestion method: Comparison of OD280 readings for Sednoase (refrence drug) and rSK at different concentrations 1.5, 1, 0.5, and 0.1 mg/ml (p < 0.05 for all concentrations).
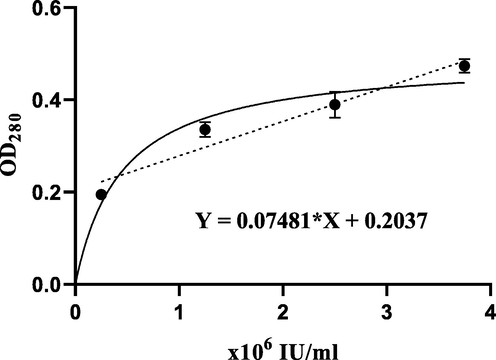
Standard curve for the casein digestion method using Sedonase at different activities. Correlation coefficient (r) = 0.97 (p < 0.001).
10.3 Enzymatic activity evaluation using in vitro blood clot lysis assay
The percentage of clot lysis was calculated for the purified rSK and the reference drug (Sedonase) at different concentrations. The results obtained showed that sedonase had a higher percent of clot lysis activity compared to rSK as shown in (Fig. 11). At concentration 1 mg/ml, the rSK (1.95x10⁶ IU) showed a 62.94 ± 2.3% clot lysis compared to Sedonase (2.5x10⁶ IU) at the same concentration which gave 81.63 ± 3.1%.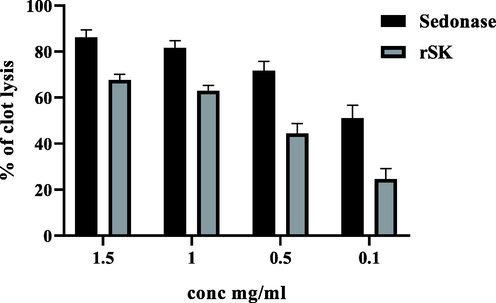
Comparison between clot lysis activity of rSK and Sednase as a reference drug at different concentrations 1.5, 1, 0.5, and 0.1 mg/ml (p < 0.05 for all the concentrations).
11 Discussion
Recombinant therapeutic proteins (also known as biologics) obtained from biotechnological processes are the most common drugs developed in the pharmaceutical industry. They represent a rapidly growing share of the global pharmaceutical market especially biosimilars. Process development for biosimilars (biologics losing their patent protections and other exclusive rights) requires less investment in research and development compared with innovative drugs, offering a lower-cost alternative to expensive drugs and allowing access for a larger sector of patients especially in developing countries (Chiba et al., 2021). This market demand prompted the development of various protein expression hosts (like E. coli, yeast, mammalian cells, and insect cells) and upstream and downstream bioprocessing technologies which are selected depending on the chemical and physical nature of the protein, its post-translational modifications, cost and simplicity of the process and many other factors (Aslanabadi et al., 2018; Puetz and Wurm, 2019; Sharifi and Jalali, 2016).
One of the biosimilar drugs which have been commonly used a long time ago is the streptokinase enzyme secreted by various strains of Streptococci (Freydell et al., 2011). It has been used as a thrombolytic agent in many clinical conditions as described before (El-mongy et al., 2012; Organización Mundial de la Salud (OMS), 2019). But unfortunately, obtaining SK from its bacterial strain has some drawbacks such as the low yields and the pathogenesis of its natural host (Bhardwaj and Angayarkanni, 2015). These problems were the main reasons for establishing another recombinant source with a higher yield and no infectivity (Mahmoudi et al., 2010). Many previous studies on recombinant production of SK were performed in bacteria, yeast, and mammalian cells (Avilán et al., 1997; Tran et al., 2018; Vellanki et al., 2013). Mature SK protein has MW 47 kDa and it contains three structural domains linked by flexible loops with no disulfide bond or post-translational modifications. Consequently, E. coli is considered the optimum host for the high production of rSK (Sharifi and Jalali, 2016; Wang et al., 1999).
Advancements in the area of recombinant protein production made the recombinant proteins yield much higher and the cost much lower, thus allowing the production of such proteins on a cost-effective and competitive industrial scale (Tripathi and Shrivastava, 2019). We aimed in this study to optimize high yield production of active recombinant streptokinase using different approaches like synthetic gene, expression optimization, and other strategies included in this work.
To have high rSK expression, a synthetic gene encoding the open reading frame (ORF) of the mature SK protein (with truncated 26 N-terminal amino acids) from C (beta)-hemolytic streptococci was designed with the exclusion of rare codons (31% of the amino acids of the encoded protein). They were replaced with common E.coli codons for the same amino acids. Also, analysis of the secondary structure for predicted rSK mRNA transcribed in E. coli excludes the presence of RNA secondary structures that lower the expression in the host cells. As the previous expression of rSK as a fusion with large tag proteins affected the production, antigenicity, and function of the enzyme (Mahmoudi et al., 2010), in this work, the synthetic Sk gene has been cloned into pET-3a vector, that has the strong T7 promoter, in the NdeI/BamHI sites to produce native rSK without any additional polypeptide or protein tags. After transformation into TOP10 E.coli, one clone named pET-3a-SK-C1 (Fig. 1) was confirmed for proper SK cloning (right orientation and conserved ends) with PCR and restriction analysis using NdeI and BamHI (Fig. 2) and confirmed for predicted sequence upstream and downstream start codon using DNA sequencing.
After transformation of the pET-3a-SK-C1 construct in BL21 (DE3) E. coli for expression of the rSK protein, selection of the high expression clone using IPTG induction have been made. This clone expresses the rSk protein at the expected molecular weight (approximately 47 kDa) (Fig. 3), Master and working seed banks have been established from this clone to be used for seeding of expression optimization cultures and on the long run for seeding of fermentation and industrial-scale cultures. These seed banks proved to be biochemically identical and stable (using Vitek 2 compact system) and have a stable high level of rSK expression (Fig. 5).
To attain higher expression levels, Expression optimization has been carried out for cultures from the prepared master seed bank. Results (Fig. 4) revealed that the highest expression efficiency (predicted from the percentage of rSK to total cell protein (rSK%) and cultures endpoint growth (OD600)) was obtained when the culture-induced for expression using 1 mM IPTG at mid-exponential phase (OD 600 0.6). To prepare the rSK, 2 X 500 ml cultures from the working seed banks have been induced using the optimized conditions. They gave a high expression of the rSk (rSk% exceeded the 50% in the 2nd generation working bank culture and 4.2 g/L bacterial wet weight) as nonsoluble inclusion bodies (Fig. 5).
To retrieve the native SK protein structure, the nonsoluble inclusion bodies, harboring mainly the rSK protein (Fig. 7), have been purified, denatured using guanidinium Cl, and refolded using rapid dilution method (Okasha et al., 2021; Singh et al., 2015). A high yield of the refolded rSk (737.5 mg/L culture) has been obtained. The advantages of IBs formation which are the enrichment of the produced recombinant protein (which represent partial purification step), the protection of expressed proteins from proteolysis, and the ability to produce proteins that are toxic to E. coli cells compensate for the additional effort required in the downstream processing (Singhvi et al., 2020).
Starting with 25 mg refolded rSK only one purification step using HiTrap® Q FF anion exchange column has been carried out to give around 16.75 mg purified rSK (67 % of the unpurified refolded protein injected into the column) in one peak (Figs. 6 & 7). The developed clone and expression optimization gave approximately 495 mg purified rSK/liter culture. This yield is much higher than that (150 mg of pure rSK protein/liter of culture) reported in a previous study (Jafari and Mirshahi, 2007). In this study, they express the rSK as soluble protein to evade the formation of inclusion bodies and reduce the downstream processing through expression of the rSK fused to maltose-binding protein (SK-MBP) after cloning in the pMAL expression vector. This means the higher productivity of the SK preparation as inclusion bodies over soluble SK expression one. Another study (Mahmoudi et al., 2010) reported high productivity (470 mg purified rSK protein /liter of bacterial culture) but they produced the rSK fused to the polyhistidine tag to enhance expression and increase purification efficiency. In our study, using the synthetic SK gene strategy, expression optimization, and inclusion bodies strategies we managed to get higher rSK productivity for native a.a sequence protein without fusion to any protein or peptides. This prevents any interference of the fused protein/peptide with the immunogenicity and activity of the rSK enzyme (Mahmoudi et al., 2010). Achieving higher rSK production in shake flask will support more cost-effective industrial production of this drug which is the objective of the SK production studies (Aghaeepoor et al., 2019).
Using ELISA (Fig. 8), the antigenic identity (conservation of structural epitope recognized by the used anti-SK antibody) of the expressed rSK protein with commercially used streptokinase (Sedonase) has been confirmed with acceptable quantification potentiality (the concentration of 1 mg/ml purified rSK (measured by Bradford assay) was calculated to be 733.26 µg/ml).
Assessment of the activity of the produced enzymes before delivery to the body is of utmost critical importance for the development of therapeutics (Vachher et al., 2021). In our study, we used two reliable techniques, the casein digestion method and blood clot lysis assay, to evaluate the fibrinolytic activity of the produced rSK (Dubey et al., 2011; El-mongy et al., 2012). Results obtained from the casein digestion method showed that the activity of the purified rSK is lower than the activity of the reference drug Sedonase (native, non-recombinant streptokinase) in all tested concentrations (p < 0.05). At concentration 1 mg/ml, the activity in international units of the prepared rSK was 1.95 × 10⁶ IU/ml which is approximately 78% of Sedonase activity of (2.5 × 10⁶ IU/ml) at this concentration (Figs. 9 and 10). Similar results were obtained in clot lysis assay because Sedonase had a higher percent of clot lysis activity compared to rSK at the tested concentrations. At 1 mg/ml concentration, the rSK had 62.94 ± 2.3% clot lysis activity compared to Sedonase that had 81.63 ± 3.1% clot lysis activity.
The difference in activity between native and recombinant streptokinase commercial drugs have been reported previously and assigned to differences in the structure of the streptokinase protein and difference in N-terminal amino acid residues which are important for plasminogen binding and activation. Establishment of a salt bridge between the 1st amino acid (isoleucine) in native streptokinase and asparagin 740 of plasminogen is necessary to induce an active site in plasminogen by a non-proteolytic mechanism. The incomplete removal of the 1st methionine in recombinant streptokinase produced in E. coli could influence the plasminogen activation and fibrin-dependence. Even non fibrin-dependent assays like chromogenic assay which is the European Pharmacopoeia (EP) method may not determine accurately the potency of rSK (Mahboubi et al., 2012). After scale up of rSK production using feed batch fermentation, mass spectrometry studies will be conducted to determine the presence and percentage of 1st methionine. Also, chromogenic assay will be used for potency determination. Another main reason for structural changes in the prepared SK enzyme may be non optimized refolding. Using lower chemical concentrations in SK refolding step could enhance the biological potency through reduction of randum coils and lowering the hydrophobicity of the rSK molecule (Khadijeh, et al., 2018). After scale up of production, further refolding optimization studies will be conducted guided by fibrin dependent and chromogenic potency assays and HPLC pattern analysis.
12 Conclusions
The adopted strategies like synthetic gene usage, expression optimization and expression of rSK as inclusion bodies yielded high productivity with cost-effective production of rSK with promising thrombolytic activity in shake flask. This allows a more cost-effective industrial production of this biosimilar drug widely used as a thrombolytic agent for human health care especially in developing countries. In the future, the research will progress into scaling up the production of highly purified streptokinase with higher activity through refolding optimization, hoping that the drug can be marketed at low-cost prices to a wide sector of Egyptian patients.
13 Ethics approval and consent of participation
Not applicable.
14 Human and animal rights
No Animals/Humans were used for studies that are base of this research.
15 Availability of data and materials
Available with the corresponding author upon reasonable request.
Funding
This study was funded by the financial support of the national project 31,257 titled “Centre of Excellence in Bioinformatics Guided Development and Characterization Research in Recombinant Pharmaceutical Proteins”, STDF Grants for Centers of Scientific Excellence (STDF-SCSE- Call II) 2019, Science, Technology & Innovative Funding Authority (STDF), Ministry of Higher Education and Scientific Research, Giza, Egypt.
CRediT authorship contribution statement
Ehab El-Dabaa: Conceptualization, Validation, Investigation, Methodology, Validation, Writing – review & editing. Hend Okasha: Methodology, Validation, Writing – review & editing, Formal analysis, Data curation. Safia Samir: Methodology, Validation, Writing – original draft, Writing – review & editing, Formal analysis, Data curation. Hadeer Adel El-Kalamawy: Methodology, Validation, Investigation. Sami Mohamed Nasr: Methodology, Conceptualization, Validation, Investigation, Writing – review & editing. Mohamed Ali Saber: Conceptualization, Validation, Investigation, Review & editing.
Acknowledgment
The authors thank the financial support of the national project 31257, STDF Grants for Centers of Scientific Excellence (STDF-SCSE- Call II) 2019, Science and Technology Development Fund (STDF), Ministry of Higher Education and Scientific Research, Giza, Egypt.
Declaration of Competing Interest
The authors declare that they have no known competing financial interests or personal relationships that could have appeared to influence the work reported in this paper.
References
- Aghaeepoor, M., Akbarzadeh, A., Kobarfard, F., Shabani, A.A., Dehnavi, E., Aval, S.J., Akbari Eidgahi, M.R., 2019. Optimization and high level production of recombinant synthetic streptokinase in E. Coli using response surface methodology. Iran. J. Pharm. Res. 18. 10.22037/ijpr.2019.1100636
- Aslanabadi, N., Safaie, N., Talebi, F., Dousti, S., Entezari-Maleki, T., 2018. The streptokinase therapy complications and its associated risk factors in patients with acute st elevation myocardial infarction. Iran. J. Pharm. Res. 17, 53–63. 10.22037/ijpr.2018.2208
- Production of recombinant streptokinase from Streptococcus pyogenes isolate and its potential for thrombolytic therapy. Saudi Med. J.. 2014;35:1482-1488.
- [Google Scholar]
- Cloning, expression and purification of recombinant streptokinase: Partial characterization of the protein expressed in Escherichia coli. Brazilian J. Med. Biol. Res.. 1997;30:1427-1430.
- [CrossRef] [Google Scholar]
- Exploring the in vitro thrombolytic potential of streptokinase-producing β-hemolytic Streptococci isolated from bovine milk. J. Gen. Appl. Microbiol.. 2015;61
- [CrossRef] [Google Scholar]
- Bhardwaj, S., Angayarkanni, J., 2015. Streptokinase production from Streptococcus dysgalactiae subsp. equisimilis SK-6 in the presence of surfactants, growth factors and trace elements. 3 Biotech 5. 10.1007/s13205-014-0209-x
- Rapid method for protein quantitation by Bradford assay after elimination of the interference of polysorbate 80. Anal. Biochem.. 2016;494
- [CrossRef] [Google Scholar]
- Cell-free protein synthesis: Advances on production process for biopharmaceuticals and immunobiological products. Biotechniques. 2021;70:1-8.
- [CrossRef] [Google Scholar]
- Dubey, R., Kumar, J., Agrawala, D., Char, T., Pusp, P., 2011. Isolation, production, purification, assay and characterization of fibrinolytic enzymes (Nattokinase, Streptokinase and Urokinase) from bacterial sources 10, 1408–1420. 10.5897/AJB10.1268
- El-mongy, M.A., Taha, T.M., Engineering, G., 2012. Strains in a Relatively Low Cost Growth Medium 53, 35–53.
- IPTG can replace lactose in auto-induction media to enhance protein expression in batch-cultured Escherichia coli. Eng. Life Sci.. 2015;15:824-829.
- [CrossRef] [Google Scholar]
- Techno-economic evaluation of an inclusion body solubilization and recombinant protein refolding process. Biotechnol. Prog.. 2011;27
- [CrossRef] [Google Scholar]
- Froger, A., Hall, J.E., 2007. Transformation of Plasmid DNA into E. Coli using the heat shock method. J. Vis. Exp. 10.3791/253
- Structural characterization of recombinant streptokinase following recovery from inclusion bodies using different chemical solubilization treatments. Biotechnol. Reports. 2018
- [CrossRef] [Google Scholar]
- Hidayat, R., Wulandari, P., n.d. Bioscientia Medicina: Journal of Biomedicine & Translational Research Enzyme Linked Immunosorbent Assay (ELISA) Technique Guideline 352–357.
- Production and purification of recombinant streptokinase using pMAL expression vector. Tehran Univ. Med. J.. 2007;65:13-18.
- [Google Scholar]
- Enhancing the translational capacity of E. coli by resolving the codon bias. ACS Synth. Biol.. 2018;7
- [CrossRef] [Google Scholar]
- Mahboubi, A., Sadjady, S.K., Abadi, M.M.S., Azadi, S., Solaimanian, R., 2012. Biological activity analysis of native and recombinant treptokinase using clotlysis and chromogenic substrate assay. Iran. J. Pharm. Res. 11. 10.22037/ijpr.2012.1173
- Mahmoudi, S., Bahador, H.A., Mosayebi, G., Salmanian, A. hatef, 2010. Production of Recombinant Streptokinase in E. coli and Reactivity with Immunized Mice. Pakistan J. Biol. Sci. 13, 380–384. 10.3923/pjbs.2010.380.384
- Recombinant expression of Cec-B peptide in Escherichia coli with a significant anticancer effect on hepatocellular carcinoma. Curr. Pharm. Biotechnol.. 2021;22:1235-1245.
- [CrossRef] [Google Scholar]
- World health organization model list of essential medicines. Ment. Holist. Heal. Some Int. Perspect.. 2019;21:119-134.
- [Google Scholar]
- Recombinant proteins for industrial versus pharmaceutical purposes: a review of process and pricing. Processes. 2019;7
- [CrossRef] [Google Scholar]
- Saber, M.A., Okasha, H., Mohamed, M.M.H.R.M., 2017. Production of recombinant human interferon gamma by batch fermentation in E. coli system. Arab J. Biotech. 20, 21–32.
- Molecular and Biological Characterization of a Prepared Recombinant Human Interferon Alpha 2b Isoform. Appl. Biochem. Biotechnol.. 2019;188:72-86.
- [CrossRef] [Google Scholar]
- Selecting appropriate hosts for recombinant proteins production: Review article. Hormozgan Med. J.. 2016;20
- [Google Scholar]
- Protein recovery from inclusion bodies of Escherichia coli using mild solubilization process. Microb. Cell Fact. 2015
- [CrossRef] [Google Scholar]
- Bacterial Inclusion Bodies: A Treasure Trove of Bioactive Proteins. Trends Biotechnol.. 2020;38:474-486.
- [CrossRef] [Google Scholar]
- Cell-free production of a therapeutic protein: Expression, purification, and characterization of recombinant streptokinase using a CHO lysate. Biotechnol. Bioeng.. 2018;115
- [CrossRef] [Google Scholar]
- Tripathi, N.K., Shrivastava, A., 2019. Recent Developments in Bioprocessing of Recombinant Proteins: Expression Hosts and Process Development. Front. Bioeng. Biotechnol. 10.3389/fbioe.2019.00420
- Vachher, M., Sen, A., Kapila, R., Nigam, A., 2021. Microbial therapeutic enzymes: A promising area of biopharmaceuticals. Curr. Res. Biotechnol. 3, 195–208. 10.1016/j.crbiot.2021.05.006
- Constitutive optimized production of streptokinase in saccharomyces cerevisiae utilizing glyceraldehyde 3-phosphate dehydrogenase promoter of pichia pastoris. Biomed Res. Int.. 2013;2013
- [CrossRef] [Google Scholar]
- An Engineered Rare Codon Device for Optimization of Metabolic Pathways. Sci. Rep.. 2016;6
- [CrossRef] [Google Scholar]
- A simple, effective method for bacterial culture storage: A brief technical report. J. Bacteriol. Virol.. 2010;40
- [CrossRef] [Google Scholar]
- Streptokinase: An Efficient Enzyme in Cardiac Medicine. Protein Pept. Lett.. 2020;27
- [CrossRef] [Google Scholar]


