

Translate this page into:
Optimization of starch-based candy supplemented with date palm (Phoenix dactylifera) and tamarind (Tamarindus indica L.)
⁎Corresponding author. oooluwasina@futa.edu.ng (Olugbenga O. Oluwasina)
-
Received: ,
Accepted: ,
This article was originally published by Elsevier and was migrated to Scientific Scholar after the change of Publisher.
Peer review under responsibility of King Saud University.
Abstract
The various health challenges posed by conventional candies necessitate the development of health-promoting and phytochemicals supplemented varieties. The current study explored medicinal properties of date palm and tamarind in the formulation of a starch-based candy, using response surface method for the production optimization. Experimental design variables include the starch (90–100%), date palm (0–10%), and tamarind (0–10%), while the functional, phytochemical, and antioxidant properties were the responses. The candy modification response results are as follows: pH (2.80–3.00), crude fibre (4.41–6.43%), soluble sugar (91.69–126.96%), total titrable acidity (90.00–120.00%), total phenolics (0.039–0.063 mg GA/mL), total flavonoids (0.0006–0.001 mg RU/mL), vitamin C (0.362–0.516 mg/mL), hydroxyl radical scavenging activities (14.28–26.67%), 1, 1- diphenyl-2-picryhydrazyl (1.12–3.88%) and ferric reducing property (0.09–0.31 mg/mL). The experiments revealed that most of the nutritional properties of the candies increased favorably with the incorporation of date palm and tamarind pulps and decreasing starch content. Significant (p ≤ 0.05) interactive effects were revealed between the diverse variables. The experiments also revealed the positive influence of the date palm and tamarind fruit pulps on the functional, phytochemical, and antioxidant properties of starch-based candies; hence demonstrating the possibility of developing nutraceutical based-candies with a more beneficial health effect.
Keywords
Antioxidant
Candy
Date-palm
Response surface methodology
Starch
Tamarind

1 Introduction
Food is vital for human existence and its health-promoting effects are without doubt. Candies as food materials are confectionery products that have sweet tastes because they contain white sugar which is about 99.70% sucrose (Durrani et al., 2011). Although the high sugar content of candies helps in preventing microbiological spoilage (Rawat, 2015), it has attendant health-related problems such as a high surge in body mass and obesity (Malik et al., 2006; Daniels et al., 2010), oral plagues (Touger-Decker and van Loveren, 2003), increase blood pressure, diabetes and related heart diseases (Nguyen et al., 2009; Malik et al., 2010; Welsh et al., 2011; Pollock et al., 2012). In response to consumer demand, food manufacturers have geared towards the production of organic-based health-promoting foods, without sacrificing taste, texture, and cost.
The nutritional benefits of date palm (Phoenix dactylifera L.) have made it a fruit of choice for many people who desire sweet taste. It is rich in both micro-and macro-minerals, fibre, nicotinic acid, small amounts of protein (Singh et al., 2013; Awolu and Olabiran, 2019) and vitamins (Al-Farsi et al., 2005; Khan et al., 2008). Date palm possesses free radical scavenging activities, immunomodulatory activities (Allaith, 2008; Saafi et al., 2009) and ferric antioxidant property (Awolu and Olabiran, 2019). It also has a protective influence against some life-threatening diseases (Vyawahare et al., 2012). Tamarind (Tamarindus indica L.) fruit pulp contains carbohydrate sugars, protein, lipids, and vitamins. Various healthy drinks and confectionaries have been produced from it (Obasi et al., 2013). Tamarind also has antimicrobial and anti-inflammatory properties, and it has been used for the treatment of intestinal ailments, skin infections, and sore throats (Hirun et al., 2015; Soradech et al., 2016). Furthermore, the antioxidant properties of the crude extracts of tamarind pulp have been reported (Lim et al., 2013; Buchholz and Melzig, 2016). Trifoliate yam tuber has been reported to be rich in starch, fiber, phytochemicals, with high hypoglycemic activity (Ogbunugafor et al., 2014).
Response surface methodology (RSM) is a statistical software developed for products and process (Awolu and Layokun, 2013; Awolu et al., 2015) optimizations. Common designs deployed for the product optimization processes are the optimal mixture and simple lattice, while central composite and Box-Behnken are the designs for process optimization (Awolu and Layokun, 2013; Awolu et al., 2015). In both process and product optimization, the major model factors considered are p-value (preferably at less than 0.05), lack of fit, R squared, and adjusted R squared values for model reliability. The visual presentation of the optimization results is either by contour or 3D plots (Awolu et al., 2015; Awolu and Olokunsusi, 2017).
This study is aimed at the development of candy with date palm fruit and tamarind pulp using a response surface method and assessing its nutritional, functional, and antioxidant properties. In addition, there has not been any publication on the optimization of the trifoliate yam starch, tamarind and date palm as raw materials for producing functional candies.
2 Materials and methods
2.1 Materials
Trifoliate yam tubers (Dioscorea dumetorum) were obtained from the Federal University of Technology Akure’s research farm. The date palm (Zaghloul cultivar) was purchased from an open market in Jega, Kebbi State, while tamarind was purchased from King’s Market in Osogbo, Osun State, Nigeria. These materials were authenticated at the Department of Crop Soil and Pest Management, Federal University of Technology Akure, Ondo State.
2.2 Isolation of starch from trifoliate yam
Starch was isolated from the tuber using a method previously developed by our research group (Oluwasina et al., 2016). Briefly, damaged tubers were sorted out from the collection and the good ones were washed with water to remove soil particles. They were peeled, cut, and blend for 2 min in a warring blender (Marlex, CM/L 7962804) at 1800 rpm with exactly 2 L of distilled water. It was then sieved and allowed to settle for 24 h. The obtained sediment was re-dissolved in 1 L of distilled water and the process was repeated three times. The resulting material was subjected to drying at 50 °C until constant weight was obtained. The samples were store for immediate use.
2.3 Acid thinned starch
Acid thinned starch was used because of its slow release of glucose in the body which will indirectly prevent negative insulin response that could lead to diabetic. For this preparation, starch (1 g) was treated with hydrochloric acid (10 mL/1.5 M) at 40 °C for 2 h under stirring and sodium hydroxide (5 mL/1 M) was added to halt the reaction. The pH was then adjusted to 7 using sodium hydroxide (0.1 M) after cooling. Deionized water (500 mL) was used for the washing of the product (thrice) and the dried sample was obtained after 48 h of drying (45 °C/oven) (Atichokudomchai and Varavinit, 2003). The sample was turned to powder and kept before analysis.
2.4 Preparation of date palm and tamarind pulps
The fruit samples (date palm and tamarind) were cleaned of foreign materials. The seeds were removed from the flesh and the pulps (30% w/w) were prepared with distilled water. Samples were kept in a freezer before use.
2.5 Experimental design and candy preparation
Candy preparation (Table 1) optimization experiment was designed using response surface methodology (trial version 8.0.3.1, Stat-Ease Inc., Minneapolis USA). The optimal mixture design of the RSM was used according to Awolu et al., 2015. The variables were starch (A) (90–100%), date palm pulp (B) (0–10%) and tamarind pulp (C) (0–10%). The responses were all the properties evaluated in the study. Where A: starch, B: date palm and C: tamarind.
Runs
Starch (g)
Date palm (g)
Tamarind (g)
1
94.9456
4.9836
0.0708
2
91.5653
6.7268
1.7079
3
100
–
–
4
90
2.4196
7.5804
5
94.9456
4.9836
0.0708
6
96.826
1.3858
1.7882
7
90
10.0000
–
8
90
10.0000
–
9
93.6603
3.1187
3.2210
10
94.9456
4.9836
0.0708
11
92.4141
–
7.5859
12
90
4.9927
5.0073
13
94.9172
–
5.0828
14
90
–
10.0000
15
90
4.9927
5.0073
16
94.9172
–
5.0828
To prepare the candy, starch was added to water (50 °C/100 mL) and boiled with constant stirring until gelatinization. It was then allowed to boil for about 10 min at an optimum temperature of 120 °C and cooled to 60 °C. Sugar (5 g), date palm pulp, and tamarind pulp were added and allowed to boil for about 5 min. The system was allowed to cool to about 30 °C and other ingredients such as citric acid (0.5 g), color (0.2 g), and flavor (1 g) were added and heated (60 °C) for about 2 min. After cooling to 45 °C, it was poured in the molds. The resulting candies were allowed to solidify and kept in a freezer before analysis. For the experimental responses, antioxidant properties such as ferric reducing activity, hydroxy free radical scavenging activity, and 1, 1- diphenyl-2-picryhydrazyl reducing activity were determined. Quality characteristics such as phytochemicals (total phenol and flavonoids), pH, total titrable acidity, crude fibre, soluble sugar, and vitamin C were also determined.
2.6 Analyses of candy
pH and total titrable acidity
Candy (10% in distilled water) was subjected to a pH test (pH-016A benchtop pH meter) of three replicates. Into distilled water (50 mL) was added candy sample (2 g), stirred until it dissolved, boiled, and titrated against NaOH (0.1 M) with phenolphthalein indicator to a persistent faint pink coloration (Sulieman et al., 2015). The acidity was calculated from the following equation,
2.7 Crude fibre
A 2 g defatted candy (after 8 h hexane extraction) was added to a hot H2SO4 solution (200 mL/1.25 M) and the mixture was boiled for 30 min. The solid content was obtained by filtration, washed to neutral pH with hot water, and then boiled (30 min) with NaOH (200 mL/1.25 M). The mixture was sieved and washed successively with H2SO4 solution (100 mL/0. 5 M), distilled water (200 mL), and ethanol (100 mL/98%). The residue was put in a weighted ash crucible and dried in an oven (3 h/105 °C). The crucible with its content was then weighed after cooling ( , before subjecting to furnace ashing (550 °C/5h) (Madhu et al., 2017). The crucible with its content was weighed again after cooling ( ) and the crude fibre (triplicate value) was determined as,
2.8 Determination of soluble sugar
Candy sample (0.1 g) was dissolved in distilled water (20 mL), and the liquid portion was transferred into a volumetric flask (100 mL) and was made up to the mark. To the liquid candy (1 mL) was added distilled water (1 mL), phenol (1 mL/5%) and concentrated sulfuric acid (5 mL) successively, followed by shaking and resting for 10 min. The mixture was incubated in a water bath (20 min, 30 °C), and absorbance was taken at 490 nm on a spectrophotometer (DuBois et al., 1956). This same procedure was used for reference solution preparation, but the candy was not used.
2.9 Preparation of candy for phytochemical and antioxidant analyses
An aliquot solution of 10% candy in distilled water was used.
2.9.1 Determination of vitamin C, total phenolics and flavonoid
The aliquot solution of 10% candy (200 µL) was mixed with trichloroacetic acid (300 µL/13.3%) and 2,4-dinitrophenylhydrazine (75 µL) and was incubated at 37 °C for 3 h, before adding H2SO4 solution (500 µL). The absorbance (Ab) was then read at 520 nm, with ascorbic acid as the reference (Benderitter et al., 1998). Folin ciocalteau’s chemical (0.5 mL/10%) and sodium carbonate (2.5 mL/7.5%) were added successively to aliquot solution of 10% candy (0.2 mL), incubated (45 °C/1 h) and the absorbance taken (700 nm) (Sun et al., 2007). Gallic acid (mg/mL) was used as the reference phenol. For the flavonoid determination, an aliquot solution of 10% candy (0.2 mL) was mixed with NaNO3 (0.3 mL/5%), and allowed to stand for 6 min before aluminium trichloride (6 mL of 10%) was added. An incubation period (5 min) was allowed, before the addition of NaOH (1 M, 2 mL) and distilled water (2.1 mL). The mixture was then subjected to incubation for 15 min and the absorbance was read at 510 nm (Zhishen et al., 1999).
2.9.2 Determination of antioxidant activities of 1, 1- diphenyl-2-picryhydrazyl
An aliquot solution of the 10% candy (1 mL) and 1, 1- diphenyl-2-picryhydrazyl (DPPH) solution (0.4 Mm, 1 mL) were reacted together. A reference sample containing methanol (1 mL) and DPPH solution (2 mL) was also prepared. After the dark incubation of all the solutions (30 min), their absorbance (Ab) values were obtained at 516 nm (Brand-Williams et al., 1995).
2.9.3 Ferric reducing activity
To an aliquot solution of the 10% candy (0.1 mL), phosphate buffer (0.25 mL/ 200 mM, pH 6.6) and potassium ferricyanide (0.25 mL /1%) were sequentially added, followed by incubation (50 °C/20 min). Trichloroacetic acid (0.25 mL/10%) was then added and the mixture was centrifuged (2000 rpm/10 min). The supernatant from centrifugation (1 mL) was mixed with distilled water (1 mL) and ferric chloride (0.2 mL/ 0.1%), and the absorbance (Ab) was measured at 700 nm. Distilled water was used as blank while ascorbic acid was the standard (Pulido et al., 2000).
2.9.4 Hydroxyl radical scavenging activity
Chemical reaction was developed between aliquot solution of 10% candy (1 mL, test sample) safranin (1 mL/ 1.14 mM), EDTA (0.5 mL/ 0.04 M), Fe2+ (0.5 mL/ 0.04 M) and H2O2 (2 mL/3%), with addition of enough phosphate buffer solution (67 mM, pH 7.4) to produce 5 mL blend. This was followed by incubation (37 OC/30 min) and absorbance (Ab) measurement at520 nm for the test sample solution (Ai), blank solution ((A0) deprived of the candy), and the solution Ac (without the candy, EDTA, Fe2+ and H2O2) (Li et al., 2007). Hydroxy radical scavenging activity (%) was obtained as follows,
2.10 Statistical analysis
The obtained data were analyzed using SPSS 20.0, with the means compared by Duncan’s multiple range tests. The response model and regression equation were generated using DOS (10.0 (Stat-ease).
3 Results and discussion
3.1 Physicochemical properties of candy
Candy's physicochemical properties as presented (Table 2) had crude fibre values from 4.41 to 6.43%. Experimental run 3 recorded the lowest value (4.41%) and the highest was run 7 (6.43%). The crude fibre content of 6.43% could be because the run 7 has the highest quantity of date palm in its production. The date palm has been reported to have a reasonable amount of crude fiber (9.40%) according to El-Sharnouby et al., (2012). It can also be generally deduced from the results that both fruits (date palm and tamarind) contributed to the fibre content of the candies, as those produced with their addition recorded higher crude fiber content than that of run 3. The crude fibre contents recorded for all the candies are higher than 2.24% recorded by Manjula and Suneetha (2014) for pumpkin candies and also higher than 2.01% and 4.01% recorded by Obasi et al. (2013) for chewable- and non-chewable- velvet tamarind candies. The high crude fibre content of these candies is desirable for better human digestion. Atasie et al. (2009) noted that crude fibre-rich foods help to prevent constipation, piles, appendicitis, and cancer. The ANOVA results of the data from the response surface method analysis, revealed the significant (p ≤ 0.05) differences between the model (special quadratic) and its terms [linear mixture, AB, AC, BC, AB2C, and ABC2, except A2BC]. The relationship between the crude fibre and model terms obtained from the regression equation is given in Eq. (1). The R2 and adjusted R2 values were 0.9801 and 0.9573 respectively, suggesting a good candy formulation and an indication of the adequacy of the model to reveal the relationship between the experimental variables and the responses (Nath and Chattopadhyay, 2007; Awolu et al., 2015). The 3D graph (Fig. 1a) shows the effect of acid-thinned starch (A), date palm (B), and tamarind (C) proportions on crude fibre content. Results presented in the graph show that the crude fibre content increases with decreasing variable A (starch) from 100 to 90%, while increasing variable B (date palm) and C (tamarind) from 0 to 10%. From the graph, at a prediction point of 4.47% crude fibre, 99.31%, 0.33%, and 0.36% of A, B and C were predicted to be used, respectively. Likewise, at fibre content of 6.00 and 6.09%, the predicted samples used are 94.16% of A, 0.25% of B, and 5.59% of C; 90.70% of A, 6.56% of B and 2.74% of C, respectively. It can be deduced from the 3D graph that the date palm and tamarind fruits particularly enhanced the crude fibre content of the candy.
Values are mean of three replicates ± standard deviation and means with different letters are significantly different at P < 0.05 (columnwise). TTA – total titrable acidity.
Sample
Crude fibre (%)
Soluble sugar (100 µg/mL)
pH
TTA (%)
Run 1
6.11d,e ± 0.29
124.48f ± 0.87
2.90a,b ± 0.05
96.00b,c ± 1.00
Run 2
6.00c,d,e ± 0.19
119.36e ± 0.52
2.90a,b ± 0.01
108.00d ± 1.00
Run 3
4.41a ± 0.39
91.69a ± 0.88
2.85a ± 0.09
90.00a ± 2.00
Run 4
5.83b,c,d ± 0.37
114.09c ± 2.87
2.80a ± 0.10
114.00e ± 4.00
Run 5
6.23d,e ± 0.10
124.36f ± 0.06
2.90a,b ± 0.08
96.00b,c ± 3.00
Run 6
5.55b,c ± 0.15
115.93d ± 1.16
3.00c ± 0.18
99.00c ± 3.00
Run 7
6.43e ± 0.39
120.58e,±1.61
2.90a,b ± 0.10
114.00e ± 4.00
Run 8
6.41e ± 0.37
120.99e ± 0.87
2.90a,b ± 0.03
114.00e ± 2.00
Run 9
6.38e ± 0.02
104.01b ± 2.27
3.00c ± 0.10
93.00a,b ± 3.00
Run 10
6.12d,e ± 0.30
124.01f ± 0.41
2.90a,b ± 0.03
96.00b,c ± 3.00
Run 11
6.05d,e ± 0.05
125.82f,g ± 0.35
2.85a ± 0.05
118.67e,f ± 1.54
Run 12
6.08d,e ± 0.16
104.25b ± 0.41
2.83a ± 0.03
108.00d ± 3.00
Run 13
5.50b ± 0.10
126.40i ± 0.12
2.80a ± 0.01
108.00d ± 3.61
Run 14
6.01c,d,e ± 0.23
92.91a ± 0.24
2.90a,b ± 0.01
120.00f ± 1.00
Run 15
6.08d,e ± 0.08
104.54b ± 0.12
2.80a ± 0.01
108.00d ± 1.00
Run 16
5.70b,c,d ± 0.03
126.96i ± 0.34
2.80a ± 0.02
108.00d ± 3.46
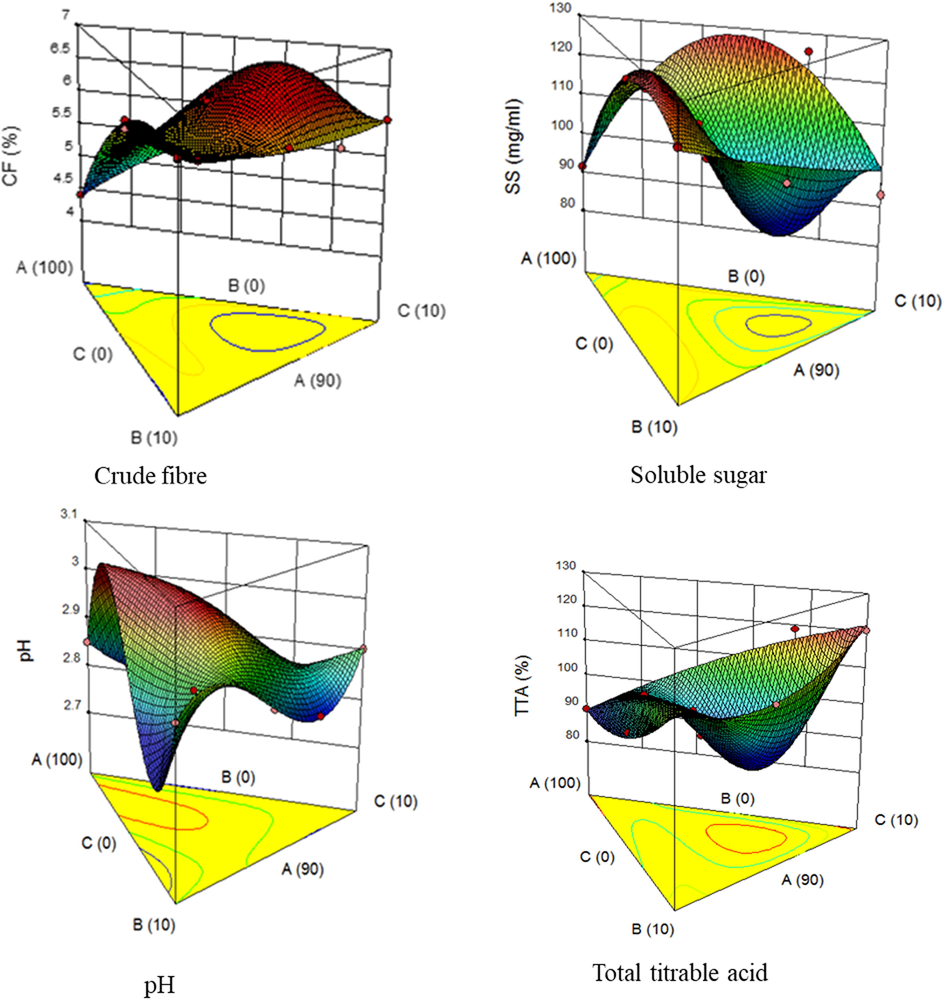
3D plot showing the effect of acid thinned starch, date palm and tamarind on crude fibre, soluble sugar, pH and total titrable acidity. Where A – Yam starch, B – Date palm pulp, C – Tamarind pulp.
The candy soluble sugar had values ranging from 91.69 to 126.96 100 µg/mL with experimental run 16 having the highest soluble sugar (126.96 100 µg/mL), followed by experimental run 13 (126.40 100 µg/mL), 11 (125.82 100 µg/mL), 1 (124.48 100 µg/mL), 5 (124.36 100 µg/mL), and 10 (124.01 100 µg/mL). The least soluble sugar value was recorded in experimental run 3 (91.69 100 µg/mL). The low value recorded in experimental run 3 may be due to the absence of fruit samples (date palm and tamarind) in the formulation. High soluble sugar in experimental runs 16, 13, 11, 1, 5, and 10 could make them consumers’ choice because of their potential sweetness. Although, candies with high soluble sugar would be good sources of energy (Rosa et al., 2009), but, experimental run 3 would be a better choice for people that require food with low sugar content. The ANOVA revealed the significance of the model (special quadratic) and the model terms (AB and AC) (p ≤ 0.05), and the insignificance of the linear model, BC, A2BC, AB2C, and ABC2 (P ˃ 0.05). The relationship between the soluble sugar and model terms by the regression equation is given in Eq. (2). The R2 and adjusted R2 values were 0.8994 and 0.7845 respectively, an indication of not too good candy formulation. The effect of acid-thinned starch (A), date palm (B), and tamarind (C) on the candies produced was shown by the 3D plot presented in Fig. (1b). The result from the 3D graph shows that soluble sugar increases with increasing variable A (starch) from 90 to 100% and also variable B (date palm) and C (tamarind) from 0 to 10%. Given consideration to the various prediction points on the 3D graph, when the soluble sugars are 126.04, 120.09, 120.12 and 104.88 100 µg/mL, the predicted samples used are 94.11% of A, 0.82% of B, 5.07% of C; 92.44% of A, 0.05% of B, 7.51% of C; 90.08% of A, 9.75% of B, 0.17% of C; 98.74% of A, and 0.69% of B, 0.57% of C, respectively. From the various predicted values, it could be deduced that date palm and tamarind have much higher effects on soluble sugar, while starch only slightly influenced it.
The pH ranged from 2.8 to 3.0, with experimental runs 4, 13, and 16 having the lowest pH values. On the other hand, experimental runs 6 and 9 recorded the highest pH values. The pH values of the candies are responsible for the taste of the food and all the candies are acidic. The acidic nature of the candies aligns with the acidic nature of most of the natural fruits (Bamise and Oziegbe, 2013). The lower pH values recorded for experimental runs 4, 13, and 16 could be due to the higher quantity of tamarind pulp incorporated compared to the other variables. The observed pH values in this study are similar to those reported by Masmoudi et al. (2010), which ranged from 3.0 to 3.5 for candies prepared using dates juice and a lemon by-product. Masmoudi et al. (2010) proposed that the firmness of candy increases with decreasing pH from 3.5 to 3.0, while Endress and Mattes (2003) suggested that candy becomes more rigid when pH is below 3.5. The ANOVA results suggested a no significant difference between model (cubic) and the terms of the model [linear mixture, AB, AC, BC, ABC, AB (A-B), and BC (B-C)], (p ≤ 0.05), except AC (A-C). The formulation is adjudged to be good because of the closeness of R2 (0.9960) and adjusted R2 (0.9900) to 1. The 3D plot shows the effect of acid thinned starch (A), date palm (B), and tamarind (C) on pH as shown in Fig. (1c). The result from the 3 D graph shows that pH decreases with decreasing variable A (starch) from 100 to 90% while increasing variable B (date palm) and C (tamarind) from 0 to 10%. Considering different prediction points on the 3D graph, at 3.00 predicted pH, 97.51% of A (starch), 1.42% of B (date palm), and 1.07% of C (tamarind) was also predicted to be used for the formulation. It was also discovered that at predicted pH of 2.81 and 2.82, the predicted samples used were 90.18% of A, 2.24% of B, 7.58% of C, and 92.43% of A, 6.88% of B, 0.69% of C respectively. The pH and model terms relationship as deduced from the regression equation is presented as follows,
The total titrable acidity (TTA) ranged between 90 and 120%, with experimental runs 3 and 14 having the lowest and highest values, respectively. The absence of date palm and tamarind in the formulation of experimental run 3 could be responsible for its low pH value. In connection with oral health, experimental run 3 candy, with the lowest total titrable acidity, is probably the best since acidity and sweetness are implicated in dental problems (Sovik et al., 2015). In a study on pineapple candy with different sugar levels, total titrable acidity of pineapple was found to be 0.69%, whereas those of pineapple-based candies ranged from 0.59% to 0.6% (Kumar and Kirad, 2013). The differences in our report and that of Kumar and Kirad (2013), may be due to the nature of raw materials used, formulation approach and candy preparation methods. The combination of date palm and tamarind could have triggered a synergistic reaction that probably resulted in increased acidity of the candy. The special quartic-model and other model terms are significant (p ≤ 0.05) as shown by ANOVA. It can be predicted that the candy formulation model was a good one because of the values of R2 (0.9902) and adjusted R2 (0.9789) which are close to a whole number. The 3D influence of acid thinned starch (A), date palm (B), and tamarind (C) on total titrable acidity is shown in Fig. (1d). The result from the 3D graph shows that the TTA content increases with decreasing variable A (starch) from 100 to 90% while increasing variable B (date palm) and C (tamarind) from 0 to 10%. From the graph, some of the predicted values of TTA are 119.31, 105.77 and 90.75%, while the predicted samples used are 90.65% of C, 0.06% of B and 9.29% of C; 93.10% of A, 6.34% of B and 0.56% of C; 99.15% of A, 0.69% of B and 0.16% of C respectively. The higher predicted TTA values recorded for some candies are due to the presence of the fruit samples which is justified by the high TTA of the fruits (date palm and tamarind). The regression equation is presented in Eq. (4).
3.2 Phytochemicals and vitamin C
Results for the total phenolic content of the candies, presented in Table 3, show parameter variation from 0.039 to 0.063 mg GA/mL. Experimental run 6 (0.039 mg GA/mL) recorded the lowest value for total phenolic content followed by experimental run 3 (0.040 mg GA/mL), while the highest result was recorded by experimental run 14 (0.063 mg GA/mL). Although the addition of date palm and tamarind caused an increase in the candy phenol value. The ANOVA from the response surface method analysis, revealed no significant difference between the special quartic-model and the model terms. The no significant difference outcome could be supported by the R2 (0.5356) and adjusted R2 (0.0048) values, which are low and far from a whole number. The phenolic content and model terms bond as expressed by the regression equation is shown in Eq. (5). The effect of acid thinned starch, date palm, and tamarind on the candy produced was shown by the 3D plot presented in Fig. (2a). The result from the 3D graph shows that total phenol content slightly increases with increasing variable B (date palm) and C (tamarind) from 0 to 10% while decreasing variable A (starch) from 100 to 90%. Given consideration to the various prediction points on the 3D graph, when the total phenol contents are 0.041, 0.056, 0.051 and 0.062 mg GA/mL, the predicted samples used are 98.60% of A, 0.65% of B and 0.75% of C; 90.42% of A, 4.92% of B and 4.66% of C; 90.15% of A, 8.23% of B and 1.62% of C; 92.14% of A, 0.70% of B and 7.16% of C, respectively.
Values are mean of three replicates ± standard deviation and means with different letters are significantly different at P < 0.05 ((columnwise).).
Sample
Phenol (mg GA/mL)
Flavonoid (mg RU/mL)
Vit. C (mg/100 mL)
Run 1
0.046a,b ± 0.006
0.0006a ± 0.00006
0.505 h,i ± 0.002
Run 2
0.051b,c,d ± 0.001
0.0009a,b ± 0.00006
0.472 g ± 0.002
Run 3
0.040a,±0.001
0.0008a ± 0.00006
0.437e ± 0.005
Run 4
0.050b,c ± 0.006
0.0008b ± 0.00010
0.516 k ± 0.001
Run 5
0.045a,b ± 0.005
0.0006a ± 0.00010
0.500 h ± 0.003
Run 6
0.039a ± 0.002
0.0008a ± 0.00010
0.362a ± 0.002
Run 7
0.052b,c,d ± 0.007
0.0010a,b ± 0.00006
0.478 g,h ± 0.004
Run 8
0.051b,c,d ± 0.007
0.0010a,b ± 0.00006
0.485 g ± 0.004
Run 9
0.051b,c,d ± 0.003
0.0008a ± 0.00006
0.410c,d ± 0.002
Run 10
0.047a,b ± 0.005
0.0008a ± 0.0001
0.509i,j ± 0.003
Run 11
0.042a ± 0.001
0.0010a,b ± 0.00006
0.444e,f ± 0.003
Run 12
0.053b,c,d,±0.002
0.0008a ± 0.00058
0.416d ± 0.01
Run 13
0.059c,d,e ± 0.002
0.0010a,b ± 0.0001
0.405b,c ± 0.006
Run 14
0.063e ± 0.005
0.0010a,b ± 0.00006
0.447f ± 0.01
Run 15
0.052b,c,d,±0.006
0.0009a,b ± 0.00015
0.417d ± 0.006
Run 16
0.058c,d,e,±0.005
0.0008a ± 0.0010
0.400b ± 0.006
Table 3 shows that the total flavonoid content of the candies ranges between 0.0006 and 0.001 mg RU/mL. Experimental runs 7, 8, 11, 13, and 14 recorded the highest values of 0.001 mg RU/mL, while experimental runs 1 and 5 recorded the lowest value of 0.0006 mg RU/mL of total flavonoid. From the response surface analysis, the quadratic - model and linear mixture and AB-model term have a significant relationship, as shown by the ANOVA. Although, the R2 (0.7294) and adjusted R2 (0.5940) results suggest that the formulation was not a good one. The 3D graph is presented in Fig. 2b. The result from the 3D graph shows that total flavonoid content insignificantly increases with increasing variable B (date palm) and C (tamarind) from 0 to 10% while decreasing variable A (starch) from 100 to 90%. Given consideration to the various prediction points on the 3D graph, when the total flavonoid contents were 0.00096, 0.00082 and 0.00079 mg RU/mL, the predicted samples used were 90.35% of A, 0.20% of B and 9.45% of C; 91.23% of A, 5.02% of B and 3.75% of C; 99.58% of A, 0.21% of B and 0.21% of C respectively. The total flavonoid and model terms interrelation as presented by the regression equation is shown in Eq. (6).
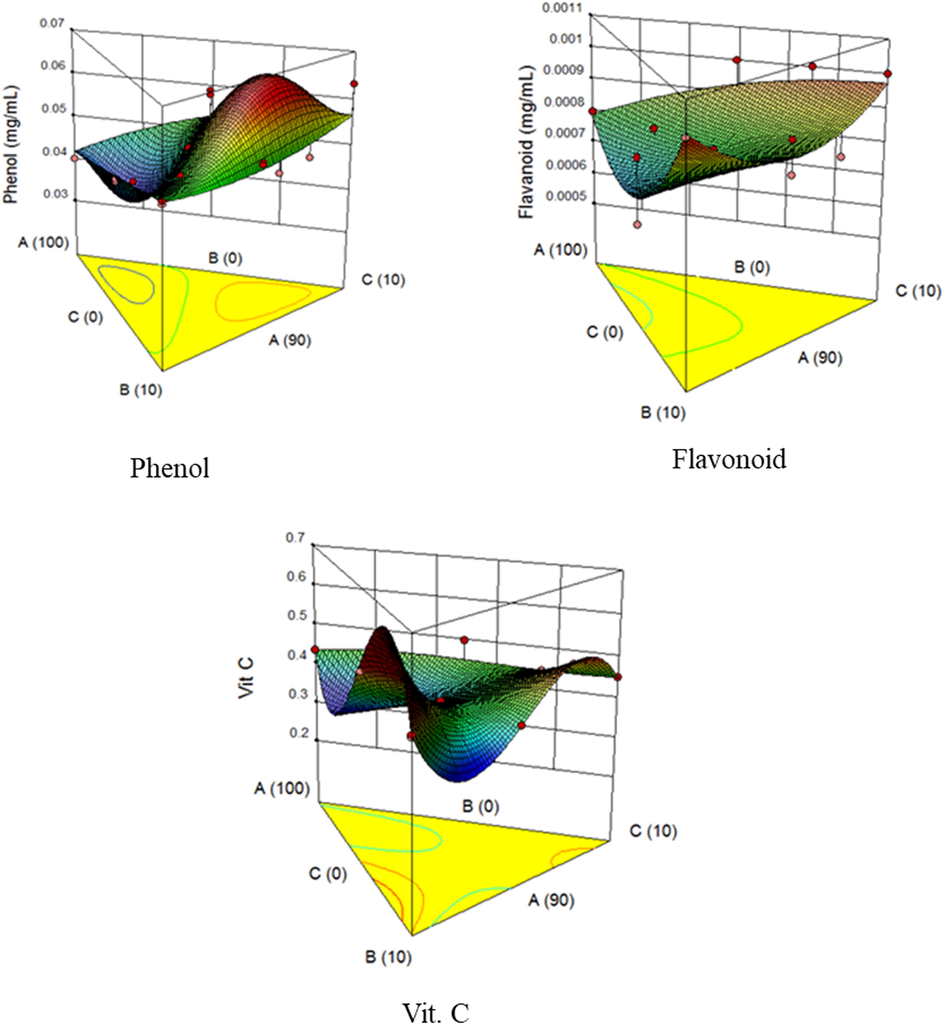
3D plot showing the effect of acid thinned starch, date palm, and tamarind on the total phenol, flavonoids and vitamin C. Where, A – Yam starch, B – Date palm, C – Tamarind.
Vitamin C has been shown to promote human health and is potent in controlling and preventing various diseases (Simon et al., 2001). Vitamin C contents (Table 3) revealed the highest value for the experimental run 4 (0.516 mg/100 g), while experimental run 6 had the lowest (0.362 mg/100 g). The non-inclusion of date palm and tamarind pulp may be the reason for the lowest value obtained for experimental run 3. The results obtained for the candies are higher than 0.36 mg/100 g recorded by Okudu and Ogubuike (2016) for vitamin C content of tiger nut candy. The results are within the range of 0.09–1.19 mg/100 g recorded by Obasi and Ugwu (2015) for vitamin C content of tiger nut milk candies and milk. The non-significance of the cubic-model and the model terms except for AB (A-B) and BC (B-C) was revealed by the regression ANOVA. This probably might be the reason for the low values of R2 (0.8541) and an R2- adjusted (0.6352). The 3D plot was presented in Fig. 2c. Results from the 3D graph shows that the effects of the variables (starch, date palm, and tamarind) on vitamin C were not consistent, though date palm and tamarind show more influence on vitamin C content. From the graph, some of the predicted values of vitamin C are 0.49, 0.43, 0.38, 0.32 and 0.42 mg/100 g and the predicted samples used are 90.18% of A, 3.21% of B, 6.61% of C; 91.71% of A, 4.55% of B, 3.74% of C; 90.40% of A, 6.85% of B, 2.75% of C; 98.08% of A, 1.60% of B, 0.32% of C; and 99.00% of A, 0.25% of B and 0.75% of C respectively. The inconsistency could also be justified by the insignificance of the model (p ≥ 0.05). Vitamin C and model terms association is given by the regression equation is presented in Eq. (7).
3.3 Antioxidant activities of candy
The antioxidant activities for the candies produced are presented in Table 4. Natural antioxidants can be used as food products preservative and human-health promoter (Nanditha and Prabhasankar, 2008; Awolu and Olabiran, 2019). The •OH results (Table 4) extended from 14.28 (experimental run 4) to 26.67% (experimental run 14). From the response surface analysis, significance relation. The cubic-model and the model terms [AB, AC, BC, ABC, AB (A-B), and BC (B-C)] were ascertained by the model ANOVA. The •OH action and model terms association as predicted by the regression equation is shown in Eq. (8). The R2 and adjusted R2 values are 0.9877 and 0.9693 respectively. The high values of R2 and adjusted R2 show that the model is good. The ANOVA results indicate that the independent variables enhanced •OH scavenging ability of the candy products. The 3D plot (Fig. 3a) showed that date palm and tamarind fruits promote the hydroxyl scavenging ability of the candy. The result from the 3D graph shows that OH scavenging ability of the candy products increases with increasing variable B (date palm) and C (tamarind) from 0 to 10% while decreasing variable A (starch) from 100 to 90%. Considered the various prediction points on the 3D graph, when the OH scavenging ability of the candies are 24.38, 20.74 and 18.20%, the predicted samples used are 90.36% of A, 0.11% of B and 9.53% of C; 90.18% of A, 9.62% of B and 0.20% of C; 97.99% of A, 1.07% of B and 0.94% of C respectively.
Values are mean of three replicates ± standard deviation and means with different letters are significantly different at P < 0.05 (column). Where, •OH - hydroxyl radical scavenging activity, DPPH – 1, 1- diphenyl-2-picryhydrazyl, FRAP – Ferric reducing activity.
Samples
•OH (%)
DPPH (%)
FRAP (mg/mL)
Run 1
22.61e,f ± 2.61
1.39a,b ± 0.04
0.21e,f,g ± 0.01
Run 2
21.52d,e,f,±1.52
2.48e,f ± 0.28
0.28j ± 0.01
Run 3
19.57c,d,e,f ± 0.44
1.25a,b ± 0.54
0.09a ± 0.00
Run 4
14.28a ± 0.95
2.42d,e ± 0.79
0.21e,f ± 0.00
Run 5
22.76f ± 4.06
1.12a ± 0.05
0.22 g,h ± 0.01
Run 6
16.60a,b,c ± 3.56
1.71a,b,c ± 0.08
0.15b,c ± 0.00
Run 7
19.28c,d,e,f ± 0.58
1.81b,c ± 0.28
0.31 k ± 0.00
Run 8
19.35c,d,e,f ± 0.65
1.66a,b,c ± 0.13
0.31 k ± 0.01
Run 9
15.00a,b ± 0.07
1.99c,d ± 0.00
0.19d ± 0.00
Run 10
22.68e,f ± 2.68
1.29a,b ± 0.06
0.22f,g ± 0.01
Run 11
20.37d,e,f,±1.53
2.81e ± 0.05
0.21d,e ± 0.00
Run 12
16.45a,b,±2.68
2.94e ± 0.59
0.31 k ± 0.00
Run 13
19.13c,d,e,f ± 0.58
1.38a,b ± 0.05
0.23 h ± 0.00
Run 14
26.67 g ± 0.29
3.88f ± 0.26
0.25i ± 0.00
Run 15
18.05b,c,d,±1.09
3.79f ± 0.35
0.31 k ± 0.00
Run 16
18.99c,d,e ± 3.52
1.15a ± 0.18
0.23 g ± 0.01
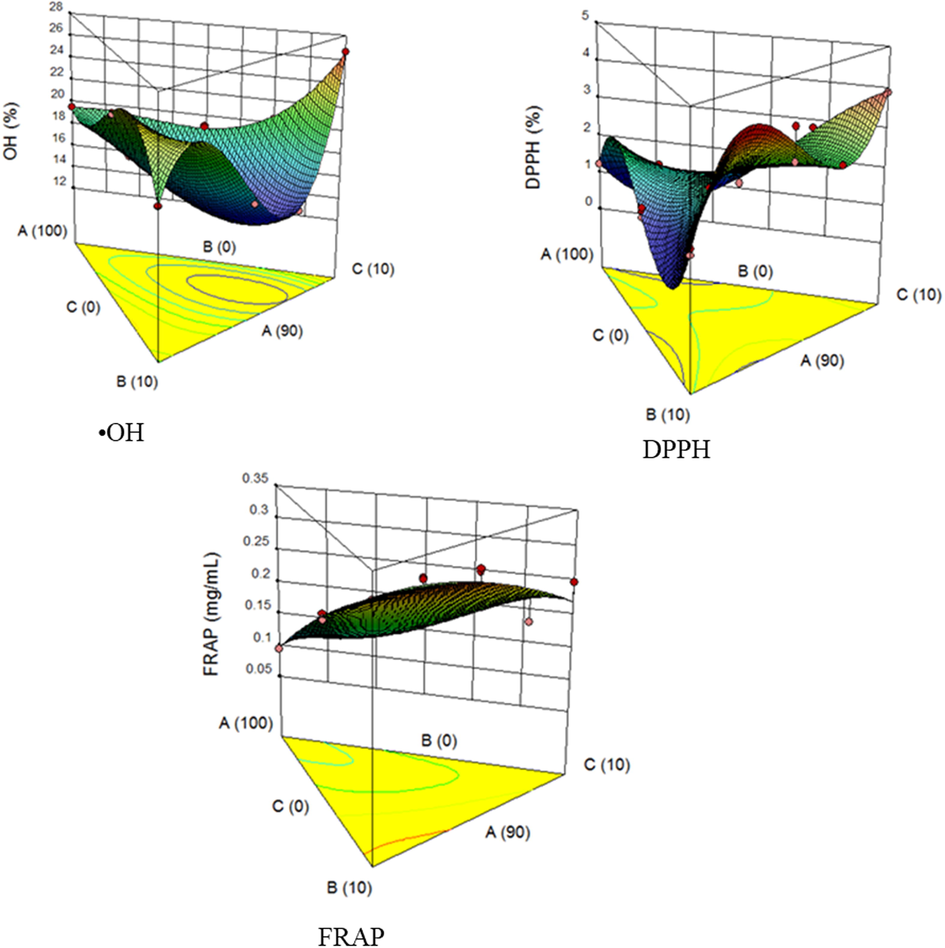
3D plot showing the effect of acid thinned starch, date palm and tamarind on the •OH, DPPH and FRAP antioxidant activities Where, A – Yam starch, B – Date palm, C – Tamarind.
Results obtained for the DPPH activity had experimental run 5 having the lowest value (1.123%) and experimental run 14 the highest value (3.88%). From the response surface analysis, cubic-model and the model terms [linear mixture, AC, AB(A-B) and BC(B-C)] had a significant relationship, while the model terms [AB, BC, ABC, and AC(A-C)] were insignificant, as presented by the ANOVA. The regression equation expressing the relationship between DPPH scavenging assay and model terms is shown in Eq. (9). The closeness between R2 (0.9605) and adjusted R2 (0.9012) and their nearness to 1, is a suggestion of a significant model and good formulation, respectively. The effect of acid-thinned starch, date palm, and tamarind on the DPPH scavenging assay of the candy produced is shown by the 3D plot presented in Fig. 3b. The result from the 3D graph shows that the DPPH scavenging assay of the candy products increases with increasing variable B (date palm) and C (tamarind) from 0 to 10% while decreasing variable A (starch) from 100 to 90%. Given consideration to the different prediction points on the 3D graph, when the DPPH scavenging assay of the candies is 2.98, 3.24, 1.31 and 1.28%, the predicted samples used were 91.02% of A, 4.86% of B, 4.12% of C; 90.24% of A, 0.48% of B, 9.28% of C; 92.74% of A, 6.46% of B, 0.80% of C; and 99.64% of A, 0.14% of B, 0.22% of C respectively.
The FRAP values obtained for the different processed products of the candy are presented in Table 4, which shows variation from 0.095 to 0.313 mg/mL, with experimental run 7 recording the highest FRAP value and experimental run 3 the least. The least value recorded for the experimental run 3 may be attributed to the non-inclusion of fruit pulps (date palm and tamarind) in its formulation. From the response surface analysis, the ANOVA revealed that the special quartic-model and the model terms [linear mixture and AC] were significant (p ≤ 0.05) except for the following model terms [AB, BC, A2BC, AB2C, and ABC2]. The R2 (0.9162) and adjusted R2 (0.8205) are close to 1, suggesting a good formulation. The 3D plot, presented in Fig. 3c shows that the ferric reducing ability of the candy products increases with increasing variable B (date palm) and C (tamarind) from 0 to 10% while decreasing variable A (starch) from 100 to 90%. Considering the different prediction points on the 3D graph, when the ferric reducing ability of the candies are 0.23, 0.21, and 0.13 mg/mL, the predicted samples used are 90.93% of A, 0.06% of B, 9.01% of C; 92.53% of A, 1.30% of B, 6.17% of C; and 99.10% of A, 0.09% of B, 0.81% of C, respectively. The regression equation expressing the relationship of the term coefficients with the FRAP is expressed in Eq. (10).
4 Conclusion
This research is focused on the production of health-promoting candies by utilizing the nutraceutical potentials of date palm and tamarind. The results indicate that candies produced have an appreciably high amount of crude fiber, soluble sugar, titrable acidity, vitamin C, phytochemicals, and antioxidant activities. The high content of crude fibre of the candies indicates that its consumption could help in the digestion process and the overall bowel health. The low values recorded for the pH of the candies could help to improve the firmness of the candies. The candies could be a good energy source because of its high soluble sugar. Obtained results also signify that the candies have considerable antioxidant activities, which would be useful in fighting oxidative stress.
Funding
This research did not receive any specific grant from funding agencies in the public, commercial, or not-for-profit sectors.
Declaration of Competing Interest
The authors declare that they have no known competing financial interests or personal relationships that could have appeared to influence the work reported in this paper.
References
- Compositional and sensory characteristics of three native sun-dried date (Phoenix dactylifera L.) varieties grown in Oman. J. Agric. Food Chem.. 2005;53(19):7586-7591.
- [Google Scholar]
- Antioxidant activity of Bahreini date palm (Phoenix dactylifera L.) fruit of various cultivars. Int. J Food Sci. Tech.. 2008;43:1033-1040.
- [CrossRef] [Google Scholar]
- Proximate analysis and physico-chemical properties of groundnut (Arachis hypogaea L.) Pakistan J. Nutr.. 2009;8(2):194-197.
- [Google Scholar]
- Characterization and utilization of acid-modified cross-linked tapioca starch in pharmaceutical tablets. Carbohydr. Polym.. 2003;53:263-270.
- [CrossRef] [Google Scholar]
- Optimization of two-step transesterification production of biodiesel from neem (Azadirachta indica) oil. Int. J. Energy Environ. Eng.. 2013;4:1-9.
- [CrossRef] [Google Scholar]
- Optimization of the extrusion process for the production of ready-to-eat snack from rice, cassava and kersting's groundnut composite flours. LWT-Food Sci. Technol.. 2015;64:18-24.
- [CrossRef] [Google Scholar]
- Optimisation and evaluation of the effect of Bambara groundnut addition on the nutritional quality and functional properties of Amaranth Grain-based composite flour. Acta Univ. Cibiniensis, Ser. E Food Technol.. 2017;21(2):43-52.
- [CrossRef] [Google Scholar]
- Supplementation of rice flour with carrot, date palm and defatted soybean flours for enhanced nutritional, antioxidants and physicochemical properties. Agr. Food Sci.. 2019;6:134-144.
- [Google Scholar]
- Laboratory analysis of pH and neutralizable acidity of commercial citrus fruits in Nigeria. Adv. Behav. Biol.. 2013;7:72-76.
- [CrossRef] [Google Scholar]
- Studies by electron paramagnetic resonance of the importance of iron in the hydroxyl scavenging properties of ascorbic acid in plasma: effects of iron chelators. Fundam. Clin. Pharmacol.. 1998;12(5):510-516.
- [Google Scholar]
- Medicinal plants traditionally used for treatment of Obesity and diabetes Mellitus - screening for pancreatic lipase and α-amylase inhibition. Phytothe. Res.. 2016;30:260-266.
- [CrossRef] [Google Scholar]
- Use of free radical method to evaluate antioxidant activity. LWT-Food Sci. Technol.. 1995;28:25-30.
- [Google Scholar]
- Impact of water intake on energy intake and weight status: a systematic review. Nutr.. 2010;68:505-521.
- [CrossRef] [Google Scholar]
- Colorimetric method for determination of sugars and related substances. Anal. Chem.. 1956;28(3):350-356.
- [Google Scholar]
- Development and quality evaluation of honey based carrot candy. J. Food Sci. Technol.. 2011;48(4):502-505.
- [CrossRef] [Google Scholar]
- Nutritional quality of biscuit supplemented with wheat bran and date palm fruits (Phoenix dactylifera L.) Food Nutr. Sci.. 2012;3:322-328.
- [CrossRef] [Google Scholar]
- Rheological characterization of gum and jelly products. In: Voragen F., Schols H., Visser R., eds. Advances in Pectin and Pectinase Research. Dordrecht: Springer Netherlands; 2003. p. :449-465.
- [CrossRef] [Google Scholar]
- Characterization of freeze-dried gallic acid/xyloglucan. Drug Develop. Indus. Pharm.. 2015;41(2):194-200.
- [Google Scholar]
- Physio-chemical characterization of date varieties using multivariate analysis. J. Sci. Food Agr.. 2008;88:1051-1059.
- [CrossRef] [Google Scholar]
- Effect of different levels of sugar in the preparation of pineapple (Ananas comosus L.) candy. World Res. J. Biotech. 2013;1:01-03.
- [Google Scholar]
- Synthesis, Characterization and antioxidant activity of naringenin schiff base and its Cu(II), Ni(II), Zn(II) complexes. Chem. Pharm. Bull.. 2007;55(1):26-28.
- [Google Scholar]
- In Vivo Biochemical and gene expression analyses of the antioxidant activities and hypocholesterolaemic properties of Tamarindus indica fruit pulp extract. PLoS ONE. 2013;8(7):e70058.
- [CrossRef] [Google Scholar]
- Estimation of crude fibre content from natural food stuffs and its laxative activity induced in ratsestimation of crude fibre content from natural food stuffs and its laxative activity induced in rats. Int. J. Pharm. Res. Health Sci.. 2017;5(3):1703-1706.
- [CrossRef] [Google Scholar]
- Intake of sugar-sweetened beverages and weight gain: a systematic review. Am. J. Clin. Nutr.. 2006;84(274–288)
- [CrossRef] [Google Scholar]
- Sugar-sweetened beverages and risk of metabolic syndrome and type 2 diabetes: a meta-analysis. Diabetes Care. 2010;33(11):2477-2483.
- [Google Scholar]
- Formulation and development of functional confectionery by incorporating pumpkin juice. JFAV.. 2014;4:47-52.
- [Google Scholar]
- Preparation and characterization of jellies with reduced sugar content from date (Phoenix dactylifera L.) and lemon (Citrus limon L.) by-products. Fruits. 2010;65(1):21-29.
- [Google Scholar]
- Antioxidants in bakery products: a review. Crit. Rev. Food Sci. Nutr.. 2008;49(1):1-27.
- [Google Scholar]
- Optimization of oven toasting for improving crispness and other quality attributes of ready to eat potato-soy snack using response surface methodology. J. Food Eng.. 2007;80(4):1282-1292.
- [Google Scholar]
- Sugar-sweetened beverages, serum uric acid, and blood pressure in adolescents. J. Pediatr.. 2009;154(6):807-813.
- [Google Scholar]
- Production and evaluation of Velvet Tamarind (Dialium Guineese Wild) Candy. Eur. J. Food Sci. Tech.. 2013;1:1-8.
- [Google Scholar]
- Obasi, N.E., Ugwu, V.C., 2015. Quality characteristics of candies produced from tiger nuts tubers (Cyperus esculentus) and melon seeds (Colocynthis citrullus. L) milk blend. GJSFR-D.15, 42–58.
- Dioscorea dumetorum-fed rats exhibited decreased body weight, blood glucose, and insulin in STZ-induced diabetes. FFHD. 2014;4(2):87.
- [CrossRef] [Google Scholar]
- Okudu, H.O., Ogubuike, L.A., 2016. Evaluation of chemical composition of candy developed from tigernut (Cyperus esculentus) milk. AJFST.7, 27–31. https://doi.org/10.14303/ajfst.2016.006.
- Physicochemical properties of cassava starch and starch-keratin prepared biofilm. Songklanakarin J. Sci. Technol.. 2016;38:349-355.
- [Google Scholar]
- Greater fructose consumption is associated with cardiometabolic risk markers and visceral adiposity in adolescents. J. Nutr.. 2012;142(2):251-257.
- [Google Scholar]
- Antioxidant activity of dietary polyphenols as determined by a modified ferric reducing/antioxidant power assay. J. Agric. Food Chem.. 2000;48(8):3396-3402.
- [Google Scholar]
- Food spoilage: microorganisms and their prevention. Asian J. Plant Sci. Res.. 2015;5:47-56.
- [Google Scholar]
- Soluble sugars: Metabolism, sensing and abiotic stress: a complex network in the life of plants. Plant Signal. Behav.. 2009;4(5):388-393.
- [Google Scholar]
- Phenolic potent and antioxidant activity of four date palm (Phoenix dactylifera L.) fruit varieties grown in Tunisia. Int. J. Food Sci. Tech.. 2009;44:2314-2319.
- [CrossRef] [Google Scholar]
- Relation of serum ascorbic acid to mortality among US adults. J. Am. Col. Nutr.. 2001;20:255-263.
- [CrossRef] [Google Scholar]
- Utilization of date palm fruits for making delicious biscuits. Ann. Arid Zone.. 2013;52:125-127.
- [Google Scholar]
- Development of wax-incorporated emulsion gel beads for the encapsulation and intragastric floating delivery of the active antioxidant from Tamarindus indica L. Molecules.. 2016;21:380-393.
- [CrossRef] [Google Scholar]
- Sour sweets and acidic beverage consumption are risk indicators for dental erosion. Caries Res.. 2015;49(3):243-250.
- [Google Scholar]
- Physicochemical characteristics of local varieties of tamarind (Tamarindus indica L) in Sudan. Int. J. Plant Res.. 2015;5:13-18.
- [CrossRef] [Google Scholar]
- Antioxidant activities of different colored sweet bell peppers (Capsicum annuum L.) J. Food Sci.. 2007;72(2):S98-S102.
- [Google Scholar]
- Phoenix dactylifera: an update of its indigenous uses, phytochemistry and pharmacology. Int. J. Pharmacol.. 2012;7:1-8.
- [Google Scholar]
- Consumption of added sugars and indicators of cardiovascular disease risk among US adolescents. Circulation. 2011;123(3):249-257.
- [Google Scholar]
- The determination of flavonoid contents in mulberry and their scavenging effects on superoxide radicals. Food Chem.. 1999;64(4):555-559.
- [Google Scholar]


