

Translate this page into:
Optimization study by Box-Behnken design (BBD) and mechanistic insight of CO2 methanation over Ru-Fe-Ce/γ-Al2O3 catalyst by in-situ FTIR technique
⁎Corresponding author. wazelee@kimia.fs.utm.my (Wan Azelee Wan Abu Bakar)
-
Received: ,
Accepted: ,
This article was originally published by Elsevier and was migrated to Scientific Scholar after the change of Publisher.
Peer review under responsibility of King Saud University.
Abstract
The utilization of carbon dioxide for methanization reactions in the production of synthetic natural gas (SNG) is of increasing interest in energy-related issues. The use of CO2 as a raw material in methanization reactions in the formation of SNG is of increasing concern associated with energy problems. The effect of three independent process parameters (calcination temperature, ceria loading and catalyst dosage) and their interactions in terms of conversion of CO2 was considered by response surface methodology (RSM). Box-Behnken design (BBD) revealed that the optimized parameters were 1000 °C calcination temperature, 85%wt ceria loading and 10 g catalyst dosage, which resulted in 100% conversion of CO2 and 93.5% of CH4 formation. Reaction intermediate study by in situ FTIR showed that carboxylate species was the most active species on the catalyst surface. In-situ FTIR experiments revealed a weak CO2 adsorption, that exist namely as carboxylate species over the trimetallic catalyst. As a result, dissociated hydrogen over ruthenium reacts with surface carbon, leading to *CH, which subsequently hydrogenated to produce *CH2, *CH3 and finally to the desired product methane. The use of in situ-FTIR study indicated that the CO2 methanation mechanism does not involve CO as a reaction intermediate. The more detailed mechanism of CO2 methanation pathways involved over Ru-Fe-Ce/γ-Al2O3 catalyst is discussed in accordance with IR-spectroscopic data. The better catalytic activity and stability over Ru-Fe-Ce (5:10:85)/γ-Al2O3 catalyst calcined at 1000 °C showed the presence of moderate basic sites for CO2 adsorption.
Keywords
Carbon dioxide
BBD
FTIR

1 Introduction
The catalytic hydrogenation of CO2 to CH4, known as the Sabatier reaction, as reported by Sabatier and Senderens in 1902, is a significant catalytic process (Sabatier and Senderens, 1902). The formation of CH4 from CO2 hydrogenation occurs in two possible pathways (a) in the process of RWGS shift, the cleavage of C—O bond results in the formation of CHx species via *HCOH, *H2CO2 or *H3CO intermediates, then CHx species undergo subsequent hydrogenation reactions to form CH4. Detailed studies of CO2 methanation reaction by Xu et al. (2016) revealed that the formation of CH4 was not seen until the appearance of formate species. They suggested that formate possibly may be a critical intermediate of the methanation reaction. Their point of view was supported by several other groups (Kustov and Tarasov, 2014; Schild et al., 1991; Wang et al., 2015). (ii) In direct cleavage of the C—O bond, the formation of CH4 occurs via *CO2 dissociates and forms *CO and *O on various noble metal-based catalysts. *CO undergoes a dissociation reaction to produce *O and *C, which is then hydrogenated to form CH4. Research conducted by Karelovic and Ruiz (2013) revealed the following statements. First, COads species were observed at lower temperature when RWGS did not exist. Second, CO was not detected even at 200 °C. Third, until the temperature increased to 180 °C, formate was not accompanied by COads species. Hence, they concluded that the formate species had little effect on the reaction. Similarly, the H-assisted pathway of CO dissociation over Fe and Co catalysts was proposed by Ojeda et al. (2010). Likewise, Solymosi and Pásztor (1987) conducted a spectroscopic study over supported Rh catalyst. They found that dissociation of CO on Rh may contribute to the formation of Hads. Moreover, various intermediates products were observed for the hydrogenation of CO. Thus, in both pathways, the cleavage of C—O bond in HxCO species is a very important step, and probably defines the overall selectivity of CH4 in the CO2 hydrogenation reaction.
In present work, the main objective of using RSM method was to obtain the best optimal conditions for experimental design. In mechanistic reactions, the interactions of CO2 at the cerium oxide and iron oxide interface that can tune the reaction mechanisms were studied. Adsorption properties of CO2 depending on the reaction temperature were studied in IR studies. In addition, the results of the FTIR studies are summarized in terms of the cleavage of the C—O bond, and the formation of the C—H bond, which gives an idea of the activation and conversion of CO2 to methane. The results are related to promote the direct route of CO2 reduction of methane.
2 Experimental
2.1 Catalyst synthesis
The Ru/Fe/Ce/γ-Al2O3 catalyst was synthesized by incipient wetness impregnation method. A fixed amount of Cerium nitrate [Ce(NO3)3·6H2O] (Sigma-Aldrich) 5 g, requisite amount of iron nitrate [Fe(NO3)3·9H2O] (QRëC) and ruthenium chloride [RuCl3·H2O] (Acros Organics) were dissolved in 15 mL distilled water with constant stirring for 30 min. 10 g of γ-Al2O3 support was immersed into the catalyst solution for 30 min. Next, the supported catalyst was transferred on glass wool and aged for 24 h at 90 °C. Then, it was calcined at 1000 °C for 5 h at a heating rate of 10 °C min−1.
2.2 Catalytic performance
The FTIR in situ method was used to study the nature of surface species during methanation of CO2 using Ru/Fe/Ce/γ-Al2O3 catalyst. Infrared spectra (64 scans per spectrum, resolution 4 cm−1) were obtained with the help of FTIR (Brand: Nicolet Avatar 670 DGTS spectrometer) as shown in Fig. 1. For this study we used a cell of FTIR spectrometer (Brand: Nicolet Avatar 670 DGTS) equipped with KBr windows. Before the study, the catalyst was reduced in H2 flow at 300 °C for 1 h, after which it was cooled down to 50 °C and background spectra were produced. Then, the reaction mixture (vol%, CO2: H2 = 1:4) was fed and the spectra were obtained again. The gas hourly space velocity (GHSV) was adjusted to 636 mL g-1 h−1. The spectra were recorded at intervals of 2–3 min for half an hour until it became constant. The obtained spectra were represented after background correction, and subtraction of CO2 gaseous spectra.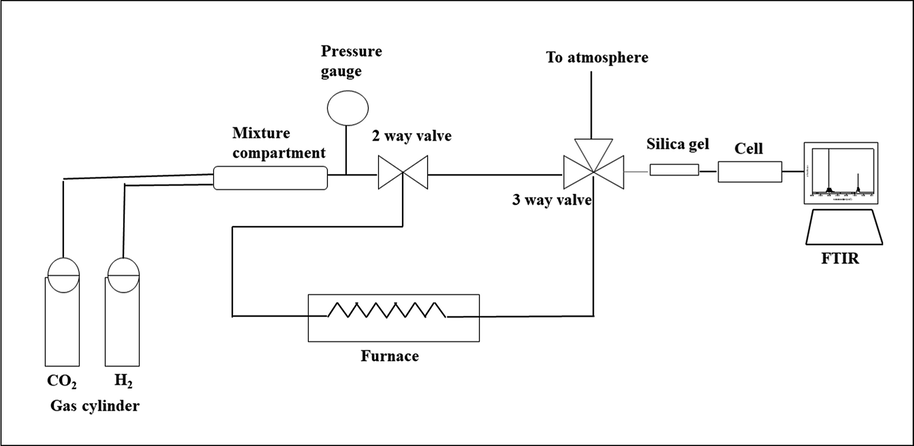
Systematic diagram of the homebuilt reactor.
2.3 Response surface methodology (RSM)
In recent years, response surface methodology (RSM) is the prevailing optimization method in use. It is a set of statistical and mathematical methods beneficial for the development, improvement, and optimization of processes. It explains the impact of independent variables, individually or in combination with each other, on the processes (Toemen et al., 2017; Rosid et al., 2018). This methodology not only analyzes the influence of independent variables, but also creates an empirical model describing the appropriate quantity of process. The experimental setup and statistical study were executed using Design-Expert software (version 7.1.6, stat-ease Inc., Minneapolis, USA). The BBD (Box-Behnken design) three-level, three-factor design was used, comprising of 15 experimental runs. In this study, three variables were included: (X1) calcination temperature (°C), (X2) Cerium load wt% and (X3) catalyst dosage, as shown in Table 1. Each variable varied over three levels of −1, 0, +1. The generalized second-order polynomial model employed in the RSM is presented in Eq. (1):
3 Results and discussion
In this present study, 15 experiments were conducted under the Box-Behnken design (BBD) using Design-Expert software (version 7.1.6, Stat-Ease Inc., Minneapolis, USA) to validate the experimental results.
3.1 Optimization of Ru/Fe/Ce/γ-Al2O3 by RSM method
In this study, independent variables were: (i) Calcination temperature °C (X1), (ii) Ce load wt% (X2) and (iii) catalyst dosage (g) (X3), as shown in Table 1. The conditions for each process parameter varied at three levels −1, 0, +1.
Process variables
Code
Level Range
−1
0
+1
Calcination temp. (°C)
X1
900
1000
1100
Loading of Ce (wt%)
X2
80
85
90
Catalyst dosage (g)
X3
7
10
13
According to the Box-Behnken design (BBD), experimental design and corresponding results are presented in Table 2. Based on the RSM analysis, the quadratic model for CO2 conversion is shown the following Eq. (2).
No
Factor Variables
CO2 conversion (%)
Standard
Run
X1
X2
X3
Actual
Predicated
11
1
0
−1
+1
96.37
96.83
10
2
0
+1
−1
56.85
56.39
1
3
−1
−1
0
22.33
22.32
14
4
0
0
0
100
99.35
5
5
−1
0
−1
27.11
27.48
2
6
+1
−1
0
69.11
69.02
12
7
0
+1
+1
75.50
75.87
7
8
−1
0
+1
44.25
43.80
15
9
0
0
0
98.63
99.35
13
10
0
0
0
99.43
99.35
4
11
+1
+1
0
4.16
4.17
3
12
−1
+1
0
36.68
36.77
9
13
0
−1
−1
86.19
85.83
8
14
+1
0
+1
50.15
49.78
6
15
+1
0
−1
35.15
35.60
In this study, the following terms were statistically significant (i) calcination temperature (X1), (ii) Ce load (X2), (iii) catalyst dosage (X3), (iv) calcination temperature2 (X12), (v) Ce load2 (X22), (vi) catalyst dosage2 (X32), and (vii) calcination temperature - Ce load (X1X2). Other model terms, including X1X3 and X2X3 have p-value of 0.1792 and 0.0016, which means that these terms do not have a significant impact on the model. Table 3 shows that the model p-value was lower 0.001, that indicates the high importance of the model. Moreover, Table 3 shows that the F-value is 3338.07 which indicates the high significance of the model. The probability (p-value) of most of the factors and model term is <0.005. Thus, the model is of great importance, and all three independent variables were considered as model terms.
Source
Sum of squares
DF
Mean square
F-Value
p-value
Model
14111.58
9
1567.95
3338.07
<0.0001a
X1
99.40
1
99.40
211.63
<0.0001
X2
1270.33
1
1270.33
2704.45
<0.0001
X3
464.67
1
464.67
989.25
<0.0001
X1X2
1572.12
1
1572.12
3346.95
<0.0001
X1X3
1.14
1
1.14
2.44
0.1792b
X2X3
17.94
1
17.94
38.18
0.0016b
X12
10341.55
1
10341.55
22016.48
<0.0001
X22
659.08
1
659.08
1403.14
<0.0001
X32
194.90
1
194.90
414.94
<0.0001
Residual
2.35
5
0.47
Lack of Fit
1.40
3
0.47
0.99
0.5391b
Pure Error
0.95
2
0.47
Cor Total
14113.93
14
3.2 Model reliability analysis
A comparison of the actual and predicted CO2 conversion results for the Ru/Fe/Ce/γ-Al2O3 catalyst is depicted in Fig. 2.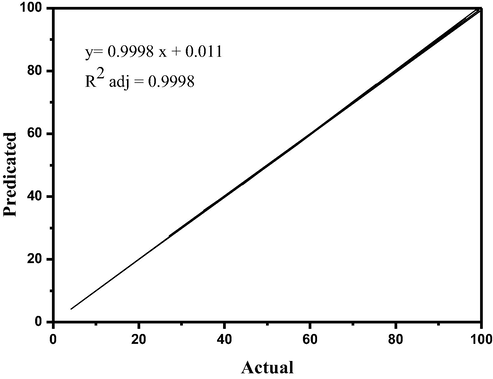
Comparison of actual and predicted CO2 conversion results.
As can be seen from Fig. 2, there is a very strong convergence between the predicted values and the experimental values for CO2 conversion. It is noteworthy that Fig. 2 shows both the reliability of the variance analysis and the regression model validity. The high value of R2 = 0.9998 from Table 4, which means high accuracy and good suitability of the model.
Source
Result
Standard deviation
0.69
Mean
60.13
C.V. (%)
1.14
Press
24.55
R2
0.9998
Adj-R2
0.9995
Pred-R2
0.9983
Adeq. precision
170.096
Table 4 shows that the value of Pred-R2 = 0.9983 logically coincides with adj-R2 = 0.9995, and also difference is 0.0015, indicating the adequacy of the model applied (Huang et al., 2014). Moreover, the low value of co-efficient of variation (C.V.% = 1.14) reflects the fact that this model proves high reliability and good fitness.
Table 5 shows the parameters for optimization process variables to achieve maximum CO2 conversion. The main purpose to choose cerium loading as a crucial parameter in the RSM calculation due to the large capacity for storage and release of oxygen by means of redox process Ce4+ ↔ Ce3+, it also enhanced the thermal stability of alumina support and improved the dispersion of noble metals (Kašpar et al., 1999). It is established that the mobility of surface oxygen species in CeO2 is higher in comparison with other metal oxides (Braja, 2003). Thus, 99.99% of CO2 conversion was achieved under optimal conditions of calcination temperature of 1004.16 °C at a load of Ce 84.54 wt% and catalyst dosage of 9.80 g, which were determined by RSM for this model. The RSM values were close to the experimental value (99.70%) and therefore confirmed the experimental optimization.
Response
Goal
Lower Limit
Upper Limit
Predicated results
Experiment verified conditions
X1
Calcination temperature (°C)
In range
900
1100
1004.16
1000
X2
Ce load (wt%)
In range
80
90
84.54
85
X3
Catalyst DOSAGE (g)
In range
7
13
9.80
10
Y
Conversion of CO2 (%)
Target
90
100
99.99
99.70
The 3D response surface curves were constructed for the CO2 conversion model (Fig. 3). The surface plots were constructed as a function of two of the factors. Fig. (3a-c) shows the mutual effects of variables in the CO2 conversion. The interaction of calcination temperature and Ce load at CO2 conversion is shown in Fig. 3a. Fig. 3a shows a graph of the dependence between calcination temperature and CO2 conversion, signifying that the calcination temperature has a significant effect on CO2 conversion. As the calcination temperature rises from 900 to 1000 °C, CO2 conversion also increases. Meanwhile, with temperature increases from 1000 to 1100 °C, CO2 conversion is reduced by sintering effect. Therefore, the catalyst with cerium load (85 wt%) and calcined at 1000 °C had the highest CO2 conversion values.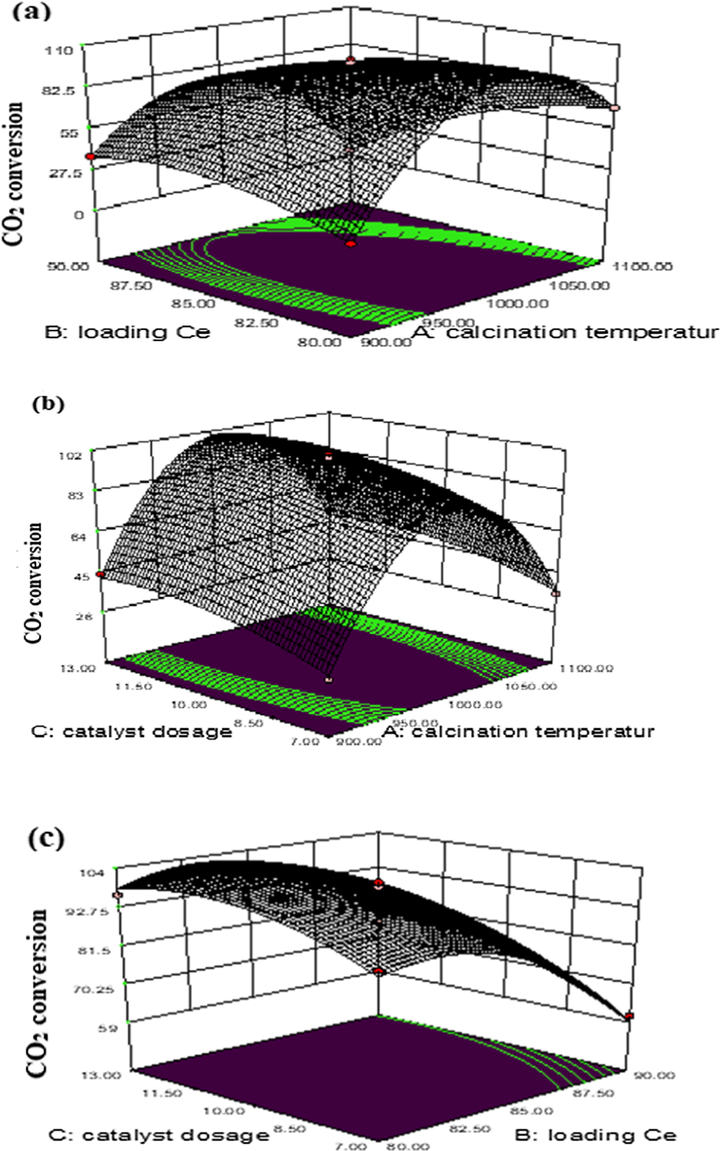
RSM plots of the combined (a) calcination temperature (°C) vs Ce load (wt%), (b) calcination temperature (°C) vs catalyst dosage (g), and (c) Loading Ce (wt%) vs catalyst dosage (g) on CO2 conversion.
Fig. 3b shows that the interactions between calcination temperature and catalyst dosage during CO2 conversion is significant. Fig. 3b shows that the maximum conversion took place with the catalyst dosage of 10 g. Fig. 3a shows that the increase in calcination temperature after 1000 °C resulted in diminution in CO2 conversion over the Ru/Fe/Ce/γ-Al2O3 catalyst. Fig. 3c illustrates the effect of interaction between cerium load and catalyst dosage on CO2 conversion. Hence, the catalyst with 85 wt% cerium load and catalyst dosage (10 g) gave the maximum conversion value of CO2 (100%) at a reaction temperature of 300 °C.
3.3 Methanation activity
A promising method of obtaining synthetic natural gas is the conversion of CO2 to CH4 by methanation reaction. The data of catalytic activity for methanation with FTIR over Ru/Fe/Ce (5:10:85)/γ-Al2O3 catalyst at different temperatures were obtained. Before the test, the catalyst was exposed to H2 atmosphere for 30 min at 300 °C. Then, it was cooled down to room temperature. The values were recorded after 20 min in steady-state conditions for each temperature. The conversion of CO2 to methane started at around 150 °C, and maximum reaction rate was around 275 °C. The maximum CH4 production was increased to 93.5% after the reaction temperature was raised to 275 °C. Further increase in temperature, resulting in lower methane production.
The data supporting the suggested view on CO2 methanation over Ru/Fe/Ce (5:10:85)/γ-Al2O3 catalyst were acquired by in situ FTIR spectroscopy. In Fig. 4, the data on CO2/H2 (1:4) conversion in contact with Ru/Fe/Ce(5:10:85)/γ-Al2O3 at temperatures of 50–300 °C are given. At reaction temperate of 150 °C, only 2.20% of CH4 is produced over the Ru/Fe/Ce (5:10:85)/γ-Al2O3 catalyst, that was calcined at 1000 °C for 5 h. It is noteworthy that the peak relating to CH4 at 3015.28 cm−1 was not detected, as shown in Fig. 4 because it was too small to be noticed. The conversion of CO2 to methane increases rapidly between temperatures at 200 and 250 °C, while it remains much more stable after reaching a catalyst reaction temperature of 275 °C. Methane selectivity (93.5%) is reduced to 89.8% after reaching the reaction temperature of 280 °C and 92.8% at 290 °C. The results show that at a reaction temperature of 275 °C, a maximum CH4 production of 93.5% was observed. The selectivity towards methane was achieved 90.88%, whereas a small proportion of 9.12% was detected as a by-product. Hence, at this temperature, intensity peak of CH4 was appeared and higher occurred.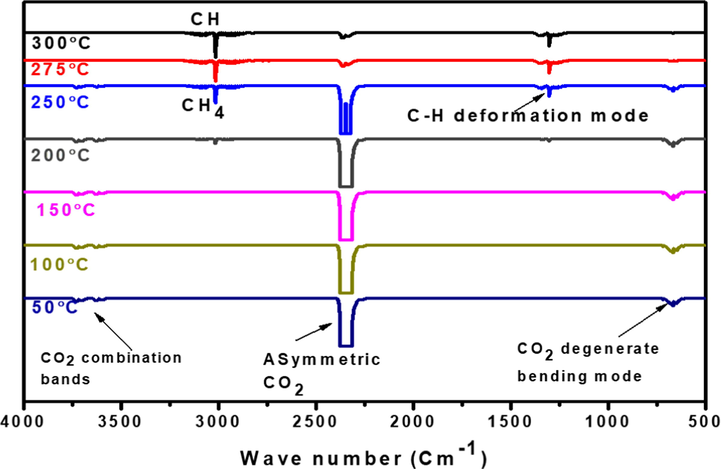
FTIR spectra of gaseous phases at different reaction temperatures of CO2/H2 methanation reaction over Ru/Fe/Ce (5:10:85)/γ-Al2O3 catalyst calcined at 1000° C for 5 h.
The FT-IR absorption bands assigned to the vibrational modes ν(C⚌O) and ν(C—H) species appear at 2358 cm−1 and 3016 cm−1 respectively. These bands were assigned to monitor the presence of CO2 and CH4. Degenerate bending modes of CO2 starts at a reaction temperature of 150 °C, corresponding to a peak assigned at around 680 cm−1, and intense peak at 2351 cm−1, which corresponds to its asymmetric mode of stretching (Stevens et al., 2008). The weak feature observed between 3600 and 3800 cm−1 was attributed to –OH stretching mode due to surface water, which is due to the excitation of two modes (Toemen et al., 2017; Jean, 2013). Starting from the reaction temperature of 200 °C, CH4 was identified in the gas phase, which is characterized by roto-vibrational bands centered at 3016 and 1305 cm−1, attributed to C-H modes of stretching and deformation modes (Nakamoto, 1997). Analysis of the region 2000–1700 cm−1 showed that there was no trace of CO species.
3.4 Adsorption studies
Fig. 5 demonstrates the IR-spectra of CO2 on Ru/Fe/Ce (5:10:85)/γ-Al2O3 in CO2 methanation reactions at 50–300 °C. To further study, the adsorbed species behavior on the surface of the Ru/Fe/Ce(5:10:85)/γ-Al2O3 catalyst in the region between 4000 and 450 cm−1, in situ FTIR CO2 adsorption spectra at different temperatures were recorded. The postulated mechanism of CO2/H2 methanation follows the mechanism of Langmuir Hinshelwood, which initially involves the adsorption of CO2 and H2 gases on the surface of catalyst (Langmuir, 1918). The analysis of surface species formed on Ru/Fe/Ce(5:10:85)/γ-Al2O3 catalyst shows absence of 1504 cm−1 (monodentate carbonate), 1567, 1289, 1014, 856 cm−1 (bidentate carbonate), 1462, 1351 cm−1 (poly dentate carbonates) and 1413, 1218 cm−1 (hydrogen carbonate) species (Binet et al., 1999; Yoshikawa et al., 2014). Similarly, the bands assigned to hydrogen carbonates were also absent on the surface of these samples as features at 3616, 1594, 1220 and 1060 cm−1 (Daturi et al., 2000). The bands assigned to 1790, 1735, 1218–1087 cm−1 (formate species) are also absent (Pan et al., 2014; Li and Domen, 1990).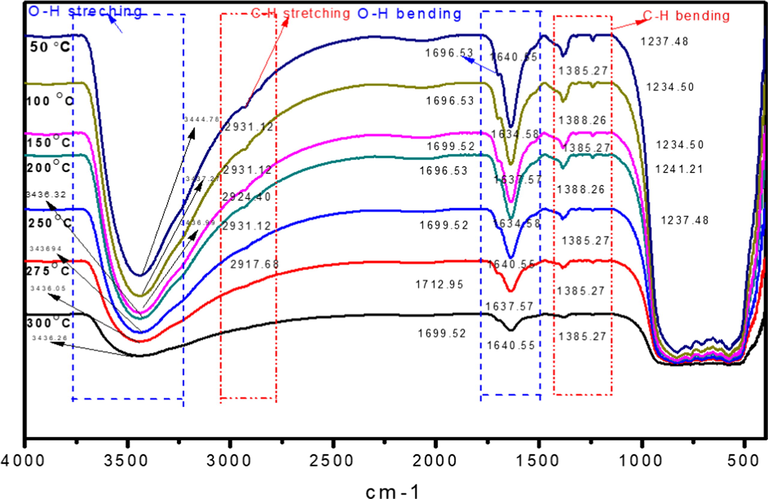
FTIR spectra of adsorption species on Ru/Fe/Ce (5:10:85)/γ-Al2O3 surface at different reaction temperatures calcined at 1000 °C for 5 h.
The deformation band due to hydroxyl group (–OH) at (1640 cm−1) begin to form at 100 °C, it further increases in intensity to a reaction temperature of 290 °C. The adsorbed water has similar properties. The sites for the formation of surface Ce carboxylate group is available during the reaction at reaction temperature of 100 °C. This data indicates that carboxylate specie is formed on the Ru/Fe/Ce(5:10:85)/γ-Al2O3 catalyst surface, when a mixture of CO2/H2 (1:4) is contacted on catalyst surface during methanation reaction. The catalyst Ru/Fe/Ce (5:10:85)/γ-Al2O3 showed two broad O-H regions at 3434 and 1635 cm−1, that were assigned to stretching and bending vibration of adsorbed water on γ-Al2O3 support (Muñoz-Murillo et al., 2018). The presence of OH groups highlights the participation of OH groups in the reaction of CO2 methanation (Karelovic and Ruiz, 2013). Both bands did not display significant variations throughout the reaction temperature. When the reaction temperature was 100 °C, a band appeared at 1641 cm−1 (—OH) bonding with a shoulder at around 1701 cm−1 corresponding to carboxylate species adsorbed on catalyst surface, as represented in Fig. 5. There is no change in the intensity of carboxylate peak. It shows that carboxylate species adsorption on the surface of very fast. The C—H stretching was started at a reaction temperature of 150 °C, at which a small amount of methane was detected at this temperature as shown in Fig. 5. When the temperature increased from 150 to 275 °C, carboxylate species were hydrogenated by dissociation of hydrogen atoms on the surface of Ru to the formation of hydrocarbon, that lead to the formation of hydrocarbons and finally methane. CO2 methanation does not take place through CO intermediate. This further proves that when the CO species was detected in the mechanistic study in the gaseous study.
3.5 CO2 dissociative methanation reaction
The mechanism of reaction, that could consider all these observations, is presented in Fig. 6. The interface of the Ru/Fe/Ce (5:10:85)/γ-Al2O3 catalyst offers multiple sites for the adsorption of intermediates reaction products. In this study, formation of CH4 occurs via the direct cleavage of the C—O bond. In the direct cleavage of the C—O bond pathway, *CO2 is subjected to a dissociation reaction to form *C and *O, or *C and *CO2, followed by hydrogenation of *C to *HC, which is subsequently hydrogenated to produce *CH2, *CH3 and finally the desired product CH4(g) (Weatherbee and Bartholomew, 1982).
Step 1: *CO2 → *CO2–
Step 2: *CO2– → *C + *O
Step 3: *C + *H → *CH
Step 4: *O + *H → *OH
Step 5: *CH + *H → *CH2
Step 6: *OH + *H → *H2O
Step 7: *CH2 + *H → *CH3
Step 8: *CH3 + *H → CH4 (gas)
* represents adsorbed species.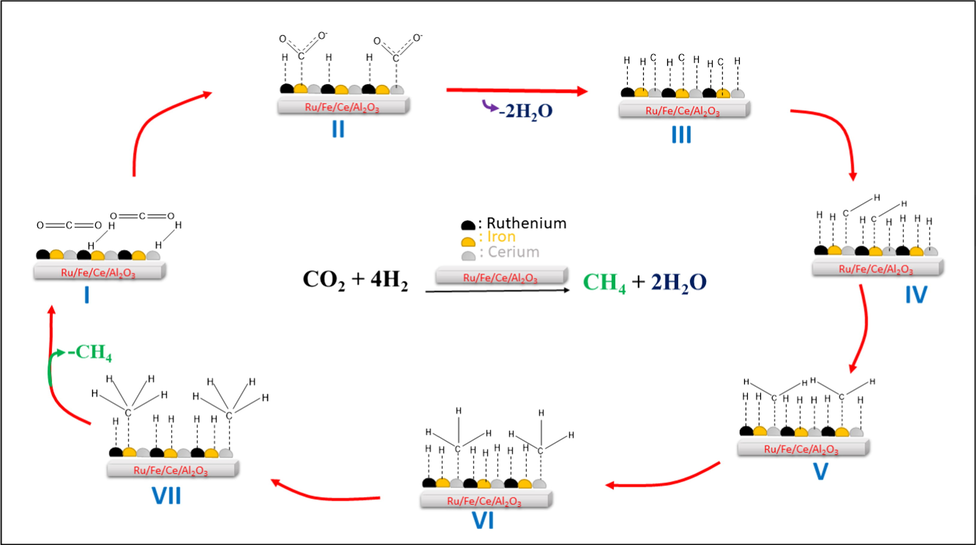
Proposed reaction pathways for CO2 methanation on Ru/Fe/Ce (5:10:85)/γ-Al2O3 catalyst with plausible intermediates.
The proposed pathway for CO2 activation and methanation on Ru/Fe/Ce (5:10:85)/γ-Al2O3 is shown in Fig. 6. For the methanation CO2 on Ru/Fe/Ce (5:10:85)/γ-Al2O3, Ru metal sites facilitates to the dissociation of molecular H2, and the spillover of H atoms from Ru metal sites to cerium oxide that formed carboxylate on its surface surfaces.
The CO2 methanation over Ru/Fe/Ce (5:10:85)/γ-Al2O3 catalyst proceeds via bending of straight chain CO2 on Fe (Choe et al., 2001). Adsorption of CO2 on the CeO2 and Fe2O3 surface and stepwise hydrogenation to methane through carboxylate intermediates by spilling hydrogen from Ru. In sum, it can be assumed that in the process of methanation CO directly dissociated to carbon (C) and O. Then, at the next stage, hydrogenation of Cad occurred. In situ IR method provide direct observation of intermediate products on the catalyst surface.
3.6 Stability test
The Ru/Fe/Ce (5:10:85)/γ-Al2O3 catalyst, calcined at 1000 °C, performed with excellent stability. The stability test graph is shown in Fig. 7.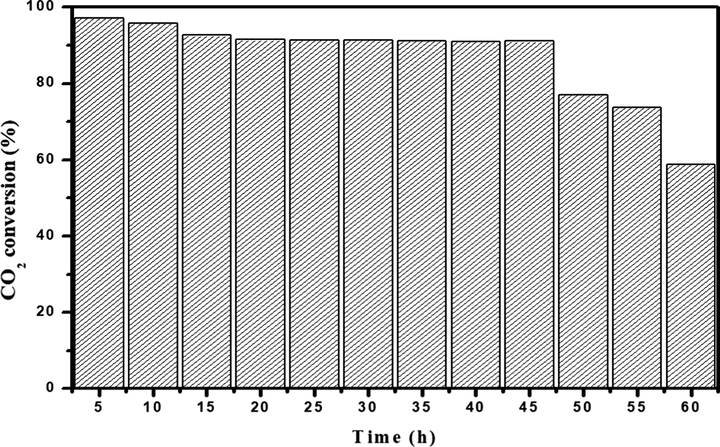
Stability test result of Ru/Fe/Ce (5:10:85)/γ-Al2O3 catalyst calcined at 1000 °C for CO2 methanation at 275 °C, CO2/H2 = 1:4.
Ru/Fe/Ce (5:10:85)/γ-Al2O3 catalyst, calcined at 1000 °C, was subjected to stability testing at 275 °C because of its relatively outstanding catalytic performance in CO2 methanation. This is illustrated in Fig. 7, the catalyst showed the best stability for CO2 conversion within 45 h, with little or no significant reduction in CO2 conversion (more than 90%). The catalyst’s high stability can be ascribed to its relatively moderate basicity and homogenous ruthenium distribution on the support. The Ru/Fe/Ce (5:10:85)/γ-Al2O3 catalyst, calcined at 1000 °C, maintains good stability during the experimental period. The results of the catalytic study showed that the Ru/Fe/Ce (5:10:85)/γ-Al2O3 catalyst, calcined at 1000 °C, has a high potential for CO2 methanation due to excellent activity and stability in reaction conditions. The better catalytic performance of Ru/Fe/Ce (5:10:85)/γ-Al2O3 catalyst could be attributed to lower iron content that led to the highest selectivity of methane formation (Kang et al., 2011), as compared to our previous work where methane formation was much lower due to high content of iron under similar reaction conditions (Ab Halim et al., 2015), and with similar content of ruthenium (Bakar et al., 2015).
4 Conclusion
The data obtained from in situ FTIR studies have shown that CO2 methanation occurs on Ru-Fe-Ce/γ-Al2O3 catalyst took place via the adsorption of CO2 on surface of ceria and iron, and then stepwise hydrogenation leads to CH4 formation through carboxylate intermediate by the hydrogen spilled over from Ru surface.
Acknowledgement
The authors are grateful to acknowledge the Universiti Teknologi Malaysia (UTM) for the financial support provided under Vote no 18H76.
References
- CO2/H2 methanation over M*/Mn/Fe-Al2O3 (M*: Pd, Rh, and Ru) catalysts in natural gas; optimization by response surface methodology-central composite design. Clean Technol. Environ. Policy. 2015;17(3):627-636.
- [Google Scholar]
- The effect of noble metals on catalytic methanation reaction over supported Mn/Ni oxide based catalysts. Arabian J. Chem.. 2015;8(5):632-643.
- [Google Scholar]
- IR study of polycrystalline ceria properties in oxidised and reduced states. Catal. Today. 1999;50(2):207-225.
- [Google Scholar]
- Structural, redox and catalytic chemistry of ceria based materials. Bull. Catal. Soc. India. 2003;2:122-134.
- [Google Scholar]
- Adsorption and dissociation reaction of carbon dioxide on Ni (111) surface: molecular orbital study. Appl. Surf. Sci.. 2001;181(3–4):265-276.
- [Google Scholar]
- Surface FTIR investigations on CexZr1-xO2 system. Surf. Interface Anal.: Int. J. Dev. Appl. Tech. Anal. Surf., Interfaces Thin Films. 2000;30(1):273-277.
- [Google Scholar]
- Optimization and evaluation of chelerythrine nanoparticles composed of magnetic multiwalled carbon nanotubes by response surface methodology. Appl. Surf. Sci.. 2014;292:378-386.
- [Google Scholar]
- Introduction to molecular vibration and infrared spectroscopy. Chemistry. 2013;362:1-9.
- [Google Scholar]
- Co-methanation of CO and CO2 on the NiX-Fe1-X/Al2O3 catalysts; effect of Fe contents. Korean J. Chem. Eng.. 2011;28(12):2282-2286.
- [Google Scholar]
- Mechanistic study of low temperature CO2 methanation over Rh/TiO2 catalysts. J. Catal.. 2013;301:141-153.
- [Google Scholar]
- Use of CeO2-based oxides in the three-way catalysis. Catal. Today. 1999;50(2):285-298.
- [Google Scholar]
- Hydrogenation of carbon dioxide: a comparison of different types of active catalysts. Mendeleev Commun.. 2014;24(6):349-350.
- [Google Scholar]
- The adsorption of gases on plane surfaces of glass, mica and platinum. J. Am. Chem. Soc.. 1918;40(9):1361-1403.
- [Google Scholar]
- Maruya K-i, Onishi T. Spectroscopic identification of adsorbed species derived from adsorption and decomposition of formic acid, methanol, and formaldehyde on cerium oxide. J. Catal.. 1990;125(2):445-455.
- [Google Scholar]
- Selective CO methanation with structured RuO2/Al2O3 catalysts. Appl. Catal. B. 2018;236:420-427.
- [Google Scholar]
- Infrared and Raman spectra of inorganic and coordination chemistry. In: Part A: Theory and Applications in Inorganic Chemistry (fifth ed.). New York: Wiley; 1997.
- [Google Scholar]
- CO activation pathways and the mechanism of Fischer-Tropsch synthesis. J. Catal.. 2010;272(2):287-297.
- [Google Scholar]
- Insight into the reaction route of CO2 methanation: Promotion effect of medium basic sites. Catal. Commun.. 2014;45:74-78.
- [Google Scholar]
- Characterization and modelling optimization on methanation activity using Box-Behnken design through cerium doped catalysts. J. Cleaner Prod.. 2018;170:278-287.
- [Google Scholar]
- Carbon dioxide hydrogenation over nickel/zirconia catalysts from amorphous precursors: On the mechanism of methane formation. J. Phys. Chem.. 1991;95(16):6341-6346.
- [Google Scholar]
- Analysis of the IR-spectral behavior of adsorbed CO formed in H2+ CO2 surface interaction over supported rhodium. J. Catal.. 1987;104(2):312-322.
- [Google Scholar]
- In situ Fourier transform infrared (FTIR) investigation of CO2 adsorption onto zeolite materials. Energy Fuels. 2008;22(5):3070-3079.
- [Google Scholar]
- CO2/H2 methanation technology of strontia based catalyst: physicochemical and optimisation studies by Box-Behnken design. J. Cleaner Prod.. 2017;146:71-82.
- [Google Scholar]
- Mechanism of CO2 hydrogenation on Pd/Al2O3 catalysts: kinetics and transient DRIFTS-MS studies. ACS Catal.. 2015;5(11):6337-6349.
- [Google Scholar]
- Hydrogenation of CO2 on group VIII metals: II. Kinetics and mechanism of CO2 hydrogenation on nickel. J. Catal.. 1982;77(2):460-472.
- [Google Scholar]
- Influence of pretreatment temperature on catalytic performance of rutile TiO2-supported ruthenium catalyst in CO2 methanation. J. Catal.. 2016;333:227-237.
- [Google Scholar]
- Synthesis and analysis of CO2 adsorbents based on cerium oxide. J. CO2 Util.. 2014;8:34-38.
- [Google Scholar]


