

Translate this page into:
Performance of graphene Oxide/SiO2 Nanocomposite-based: Antibacterial Activity, dye and heavy metal removal
⁎Corresponding authors. Sasandan@gmail.com (Sasan Dan), hbagheri@uk.ac.ir (Hamidreza Bagheri)
-
Received: ,
Accepted: ,
This article was originally published by Elsevier and was migrated to Scientific Scholar after the change of Publisher.
Abstract
Nanocomposite materials have been successfully applied to remediation of organic and inorganic contaminants from polluted water. The present study investigates the synthesis, characterizations, and adsorptive performances of graphene oxide/SiO2 nanocomposite-based adsorbent. Graphene oxide/SiO2 was used for the adsorption of methylene blue (MB) and Cr (VI) ion from wastewater. Furthermore, the antibacterial activity performance of synthesized nanocomposite was studied. The adsorption consideration has been performed by various adsorption parameters in our laboratory. X-ray crystallography (XRD), Scanning electron microscope (SEM), Energy Dispersive X-ray Analysis (EDX) and, thermal gravimetric analysis (TGA) methods were applied in the characterization, morphological structure, crystallinity, and thermal stability of graphene oxide/SiO2. Maximum capacities of adsorption of graphene oxide/SiO2-based adsorbent had been evaluated by the Langmuir isotherm model for MB and Cr (VI) ion as 555.50 and 181.81 mg/g, respectively. Generally, adsorption experiments revealed that the performances of graphene oxide/SiO2 nanocomposite for all adsorbents have been found in the order MB > Cr (VI). Furthermore, antibacterial activity study against gram-positive and gram-negative bacteria showed and proved that graphene oxide/SiO2 composite showed a remarkable ability to kill bacteria.
Keywords
Antibacterial
Chromium
Graphene oxide
Nanocomposite
SiO2
Water treatment

1 Introduction
Contaminants from various industrial engineering processes, like fine chemical production, metal smelting, gas and oil production, and mining, are a potential threat to valuable and scarce drinking water resources, especially in developing areas (Omer et al., 2022; Elsayed et al., 2022; Yusop et al., 2022). Wastewater treatment methods to eliminate multiple contaminants from water resources, are vital for the sustainable water supply in addition to socio-economic development, human well-being, and sustaining livelihoods (Zhang et al., 2022; Zhang et al., 2022; Bagheri et al., 2021). Dyes are chemical substances that can attach themselves to fabrics or surfaces to impart color. Dyes are considered one of the primary contaminants that may be found in the water and have an injurious influence on the environment and human life. The discharge of dyes into waters has a negative impact on the environment because of contaminants even, at low concentration values, coupled with producing the color of the receiving water (Lai and Wong, 2021; Bagheri et al., 2021; Halim and Yong, 2018). Many dyes are mutagenic, carcinogenic and, toxic for human life, and they are the primary reason for cancer diseases in the liver, urinary bladder and, kidney. Moreover, dyes may cause skin irritation and respiratory disease. Therefore, the removal of them from water is a too important aim (Mohammadzadeh et al., 2022; Wang et al., 2022). Dyes can be classified in terms of color, structure and application techniques. But, because of the color nomenclature complexities of the chemical structure system, classification according to application and their solubility is often favorable. Reactive, basic, acidic, direct, and acid dyes are instances of soluble ones, while vat, Sulphur, disperse, and azo dyes are instances of insoluble ones (Chen et al., 2022; Jiang et al., 2021; Banivaheb et al., 2021). Methylene blue (MB) is a heterocyclic compound applied as a medication and as a dye and it was first synthesized in 1876 with the chemical formula C16H18N3SCl. After that, MB was used as inactivated and stained microbial species and antidote to cyanide and carbon monoxide poisoning (Liu and Ying, 2022). MB appears as dark green powder at room temperature but is a blue color in water, and can absorb light at around 665 nm. MB inharmonious influences on human health and the environment. Some of the mentioned problems are irritation of the esophagus, throat, stomach, and mouth, nausea, diarrhea, dizziness, gastrointestinal pain, and headache (Dan et al., 2021; Bagheri et al., 2021; Mo et al., 2022). Therefore, controlling water contamination caused based on the MB dye is vital.
Pollution of aquatic systems with heavy and toxic metals has become a primary, issue universally because of their damaging and persistence influence on human health and marine life. (Wan et al., 2022). Waste streams from power generation facilities and electroplating, mining operations, and tanneries may include heavy and toxic metals at amounts above the discharge limits. The wastewater streams include heavy and toxic metals like copper, nickel, mercury, lead, cadmium, and chromium (Cr) (Anastopoulos et al., 2017). Cr is a hard metal, a steel-grey and lustrous metallic element extensively distributed in the crust of Earth. Cr is a leading industrial metal applied in processes and diverse products (e.g., Cr is an anticorrosive and anti-biofouling) (Liu et al., 2008). At lots of locations, Cr, as the most toxic trace element has been released in the environment or to ground/surface waters because of leakage, poor storage, and unfair removal practices or its widespread use in industrial uses. Groundwater is the primary drinkable water source throughout the world. Cr is present in remarkable concentrations in many natural groundwater sources applied for public water supply (Almeida et al., 2019; Wang et al., 2022; Tan et al., 2022). Due to Cr's carcinogenic influence on human health, is unwanted in natural water supplies. Cr (VI), Cr (III) and Cr0 are the most common forms of Cr that is present in the background. Cr (III) occurs obviously in the environment, and is a vital nutrient, while Cr0 and Cr (VI) are usually produced using chemical processes (Prabu et al., 2022). The total concentration of Cr (VI) in drinkable water must be less than 5 × 10⁻⁵ g/L, due to Cr (III) can be easily oxidized to Cr (VI) using free chlorine. Many tries have been made to treat wastewaters using traditional techniques like adsorption onto active carbon, membrane separation, reverse osmosis, ion exchange, lime coagulation, and chemical precipitation (Herath et al., 2022). Nonetheless, the mentioned physicochemical methods show serious disadvantages like toxic metallic sludge generation, high operational cost, and low performance in low concentrations. Several techniques like membrane separation, advanced oxidation, coagulation and adsorption are applied to remove the dyes and heavy metals from wastewater (Tan et al., 2022; Dovi et al., 2022; Sheth et al., 2022; Chen et al., 2022).
Graphite is the most popular carbon allotropic, and it is a natural mineral. Graphite contains sp2 hybridized carbon element layers that are stacked with van der Waals forces. The carbon atoms' single layers firmly packed in a two-dimensional honeycomb crystal framework is called graphene (Li et al., 2020; Ge et al., 2019; Pei and Cheng, 2012). Graphene is a type of promising and novel carbon material, and it has attracted remarkable attention as a special adsorbent because for its high capacity of adsorption. Graphene shows a unique anisotropic treatment with regarding electrical and thermal conductivity properties. It is very conductive into direction parallel to graphene layers due to its in-plane character, but graphite indicates weak conductivity in a direction vertical to layers due to the weak van der Waals forces interactions among them (Thakur and Kandasubramanian, 2019; Almoisheer et al., 2019; Cao et al., 2021). Graphene and Graphene oxide and their composites have good chemical stability, significant pore volume, exceedingly flexibility and large theoretical specific surface area that makes it an appropriate promise to adsorb the material. Graphene and composite-based graphene can be used to absorb several pollutants from water, like heavy metals, pesticides, antibiotics and dyes (Gupta et al., 2022; Radwan et al., 2022). Functionalization of graphene oxide and graphene lead to their surface modification and can be adjusted to be reactant specific for several organic entities. Silicon dioxide (SiO2) nanoparticles with graphene oxide have enhanced physical and chemical properties compared with graphene oxide-like surface area. Many methods are applied for dye removals like membrane separation, chemical oxidation, media filtration, electro-sorption, photocatalytic methods, microbial degradation, distillation, ion exchange, precipitation and adsorption methods. Based on the low cost, highly effective and simplicity factors, adsorption is considered one of the most impressive and eco-friendly methods for water treatment (Liu et al., 2020; Kumar et al., 2016; Dan et al., 2022).
Many researches have been performed to remove MB from wastewater using composite based on graphene and graphene oxide. The more details of obtained results are given by Thakur and Kandasubramanian (Thakur and Kandasubramanian, 2019). Liu et al. (Liu et al., 2020) designed a porous SiO2-graphene oxide membrane to remove MB dye. They investigated the capability of SiO2-graphene oxide with various SiO2 loadings (SiO2-graphene oxide mass ratio was 0, 0.5, 1, 2, 3, and 5) and different volumes of MB. The obtained results show increasing MB solution volume leads to improve dye removal capability of SiO2-graphene oxide membrane with SiO2-graphene oxide mass ratio equal to 1 and 2. Moreover, through various MB concentrations (10–40 ppm), the dye removal efficiency of SiO2-graphene oxide membrane with SiO2-graphene oxide mass ratio equal to 2 was better. Wu et al., (Wu et al., 2016) used Fe3O4-graphene@mesoporous SiO2 to remove MB dye. At the first step, they decorated Fe3O4 nanoparticles onto graphene after that, mesoporous SiO2 was deposited on the surface of the Fe3O4-graphene composite. The obtained results indicate the increasing of pH solution leads to improvement in MB adsorption, and high values of pH are advantageous to adsorption of MB. Indeed, there is competition adsorption between hydrogen ions and positive MB ion. At high pH values, the number of H+ decreases and MB ions are adsorbed on active sites. Furthermore, the influence of dosage of Fe3O4-graphene@mesoporous SiO2 on adsorption of MB shows increasing behavior. To better understand MB adsorption mechanisms, Moreover, Wu et al., (Wu et al., 2016) studied adsorption isotherms and kinetics. The adsorption isotherms and kinetics were considered with Langmuir correlation and pseudo-second-order equation, respectively. Almoisheer et al. (Almoisheer et al., 2019) prepared GO/SiO2/single-wall carbon nanotubes (SWCNTs) composite to adsorb of Congo red dye synthetic wastewater. The obtained results indicate using SWCNT and SiO2 gives a lower capacity Congo red dye adsorption at all pH ranges. Initial concentration of Congo red dye had an enormous influence on the adsorption and increasing the initial concentration of dye leads to an increase in Congo red dye adsorption. Also, the uptake of Congo red dye increases by contact time because active sites are considerably available. Almoisheer et al. (Almoisheer et al., 2019) used the Langmuir equation and pseudo-second-order and first-order to describe kinetics and adsorption process.
Many methods are presented in the literature for the synthesis of a nanocomposite based on a graphene oxide/SiO2. In this communication, we reported a new and simple process to synthesize the GO/SiO2 and employed three ways to investigate the performance of the new nanocomposite. Firstly, the graphene oxide was prepared based on the modified Hummer method, and afterward, the GO/SiO2 nanocomposite was synthesized. The characterization of synthesized graphene oxide and graphene oxide/SiO2 nanocomposite was investigated by various analyses i.e., X-ray diffraction (XRD), scanning electron microscope (SEM) and Fourier transforms infrared spectroscopy (FTIR). To examine the performance of the obtained GO/SiO2 nanocomposite, it was used of removing the MB dye and Cr ion from the aqueous environment. The effecting adsorption parameters like contact time, adsorbent dosage, solution pH, and initial MB dye concentration, were considered. Furthermore, the adsorption kinetics of MB dye and Cr ion were studied, using four isotherms i.e., Temkin, Flory-Huggins, Freundlich, and Langmuir isotherm. In addition, in the other method of investigation of the obtained nanocomposite, an antibacterial test was carried out.
2 Material method
Graphite powder (purity over 99.5 % and mean particle size less than 50 µm), sulfuric acid (H2SO4), phosphoric acid (H3PO4), and Hydrochloric acid (HCl) these chemicals were purchased at analytical grade from Merck Company and used without any further purification. Hydrogen peroxide (H2O2), potassium permanganate (KMnO4), Silica Nanoparticles (purity over 99.5 % and mean particles size less than 20 nm), sodium hydroxide (NaOH), MB (C16H18ClN3S) and Potassium Dichromate (K2Cr2O7) analytical grade were obtained from Sigma Aldrich company and applied as received. Furthermore, deionized water was consumed in all of the experiments and all other chemicals and solvents were at analytical stage.
2.1 Graphene oxide synthesis
Graphene oxide (GO) was synthesized using graphite powder according to a novel method based on an improved hummer approach that is presented in the previous work (Arabpour et al., 2021). Synthesis was carried out in a reaction flask, at first 0.375 g of graphite powder was added to the flask, followed by the addition 45 mL sulfuric acid and 5 mL phosphoric acid in an ice bath. After mixing for 15 min, 2.25 g KMnO4 was added for 3 hs. The mixture was placed in the ultrasonic bath for 47 min at 31 °C. The synthesis solution cooled down to room temperature, then 60 mL of deionized water containing 1.5 mL 30 % hydrogen peroxide was added to the mixture, while adding the mixture's color changed to a dark yellow solution. The obtained product was washed with HCl 5 % and centrifuged till it reached neutral pH and dried in a vacuum oven at 50 °C until reached constant weight.
2.2 Graphene oxide SiO2 nanocomposite synthesis
Graphene oxide/SiO2 nanocomposite (GO/SiO2) was synthesized according to a two solvent mixture (water–ethanol) system. In order to maintain a homogenous mixture of ethanol–water with 1:1 ratio, Graphene oxide was dispersed and sonicated in water containing 1 % sodium dodecyl sulfate (SDS). SDS is used as a surfactant to reduce the agglomeration process. SiO2 nanoparticles were dispersed in ethanol via ultrasonic agitation. Equal amount of each solution was added to an Erlenmeyer in order to keep the 1:1 ratio of ethanol water and 2:1 ratio of graphene-SiO2 Nano particles then the homogenous mixtures were mixed and stirred at T = 85 °C for 6 hs. The resulted product was centrifuged and placed in a vacuum oven at T = 50 °C to reach constant weight. The samples were collected and stored for further use and characterization.
2.3 Adsorption process
To study the adsorption capacity of the synthesized nanocomposite, organic dye MB and Cr (VI) ion have been applied. Batch method adsorption has been used to perform the experiments. In the first step, to minimize the error, a stock solution with a 500 ppm concentration of each pollutant was provided in the deionized water. The adsorption investigations were performed using GO/SiO2 nanocomposite as an absorbent (in the form of powder) in an incubator shaker. Rotation speed set at 150 rpm and the temperature kept at room temperature in a glass bottle for a predetermined time. For the batch experiments, a desired proportion of the composite was weighted and rigorously mixed with 30 mL of the dye solutions (pH and concentrations of the solution; were determined and adjusted previously). After the adsorption process continued for the predetermined time, the resulted suspension samples had to be filtered to remove the GO/SiO2 nanocomposite from the samples. Samples were filtered and analyzed to specify dye concentration via UV–vis spectrophotometer methodology (Varian Cary 50 UV–vis Spectrophotometer) at 664 nm as λ max of MB and Cr (VI) ion concentration via atomic absorption methodology. The amount of the pollutant adsorbed is calculated as following (Arabpour et al., 2021):
2.3.1 Influence of solution pH
For pH studies, the total volume was set to 30 mL. Solutions initial concentration for MB set to 100 ppm and for Cr (VI) set to 40 ppm. pH values range varied from 2 to 8. The pH of the adsorption medium was adjusted via sodium hydroxide or hydrochloric acid (1 M), and the adsorbent dose of 7.5 mg of GO/SiO2 was used to determine optimum pH.
2.3.2 Isotherm study
The dye initial concentration-effect was studied using different initial concentrations of MB varying from 25 to 300 ppm for dye removal, and for Cr (VI) removal, initial concentration ranged from 10 to 150 ppm. Furthermore, 10 mg of GO/SiO2 nanocomposite was used as adsorbent at pH = 7.
2.3.3 Kinetic study
To study the kinetic of adsorption, the time of adsorption changed in the range 0–120 min. the kinetic studies were also conducted at various initial concentrations of MB (50, 75, 100 ppm) and Cr (VI) ion concentration of (20, 40, 100 ppm) using 10 mg of GO/SiO2 adsorbent at pH = 7 and 3, respectively for MB dye and Cr (VI) ion removal. To calculate the amount of adsorbed pollutants at the anytime,
is measured by the following (Arabpour et al., 2021):
in which is the initial concentration of pollutant (ppm); is the concentration of pollutant in solution (ppm) at the time of .
2.3.4 Antibacterial assay
An antibacterial activity of the nanocomposite is considered to determine its ability of it to reduce the bacterial contamination in the pollutant waters. Bacterial activity was studied against two different bacterial strains, Staphylococcus aureus (ATCC 25923) and Escherichia coli (ATCC 11229), gram-positive and gram-negative, respectively, via the diffusion method. We used nutrient agar to culture the bacterial strains for 24 hs at T = 37 °C. To prepare a sterilized agar medium, agar is solved in sterilized water at T = 45 °C and poured in a leveled pert dish to solidify. Afterward solidification, wells were made in the agar medium and 50 mg of samples (10 % solution in sterilized water) were taken and added to the wells. Followed by, sparing of the bacterial cells by adding 100 μL of 108 Colony-forming units (CFU)/mL solution. Petri dishes were then placed in the shaker incubator for 24 hs at T = 37 °C. Bacterial activity was measured via the zone inhibition method.
3 Results and discussion
3.1 Structural characterization
Structural information of synthesized nanocomposite can be obtained by XRD. The XRD spectra of the GO and GO/SiO2 are represented or presented in Fig. 1. The X-ray crystallography pattern of GO indicated prominent diffraction peaks at 2θ (i.e. 10.57°) that correspond to the graphite layer structure of the graphene. Which indicates a sharp diffraction height at about 10.57° and a broad one in the region of 15-25°. The peak at 10.7° should be assigned for the stacked GO Nano sheets (Arabpour et al., 2021), the other one should be given for amorphous SiO2 (Banivaheb et al., 20211), which indicates that the synthesis reaction of nanocomposite has been successfully done.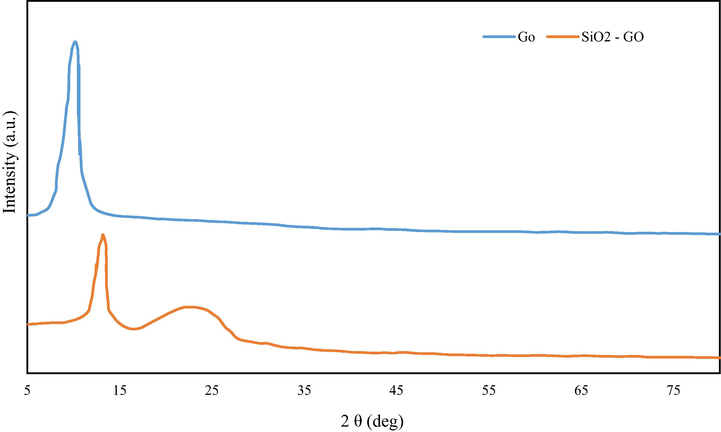
The XRD spectral of GO and synthesized GO/SiO2 nanocomposite.
To investigate the morphological features of the synthesized nanocomposite and proves that the synthesized reaction was successfully carried out, the SEM analysis was performed on both raw Graphene oxide and synthesized GO/SiO2 nanocomposite. Fig. 2 represents the SEM analysis at different magnifications for both graphene oxide and nanocomposite.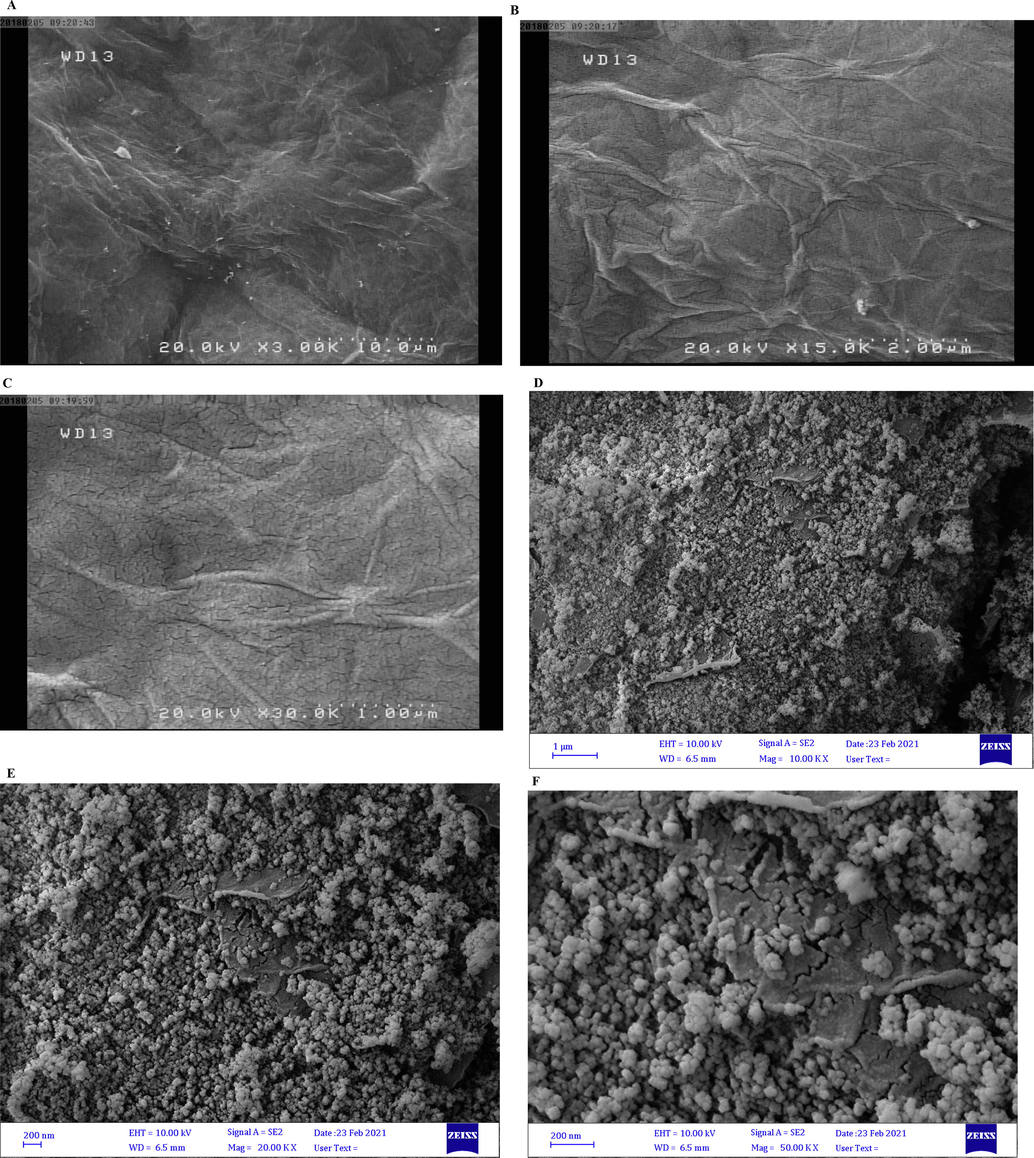
The SEM images of synthesized (A-C) GO and (D-F) GO/SiO2 nanocomposite at different magnifications of the synthesized nanocomposite.
As can be seen, graphene oxide indicates a raging structure which is due to the Nano graphite layers’ formation over each other in the structure of graphene oxide. As shown in Fig. 2 D-F, the SiO2 nanoparticles are evenly distributed at the surface of the graphene determining the coating and synthesis of the nanocomposite has been successfully done. Comparing the structure of raw graphene oxide and synthesized composite determines that the addition of SiO2 nanoparticles between the graphene oxide layer structure changes the internal structure of the graphene oxide into a more porous structure. Nano particles create a hollow space between the graphene oxide planes. To prove the existence of SiO2 nanoparticles on graphene sheets, Energy Dispersive X-ray (EDX) analysis can be applied. Fig. 3 represents the EDX analysis of synthesized GO/SiO2 nanocomposite, in which the existence of SiO2 nanoparticles and their distribution among the graphene Nano sheets can be proved.
The EDX analysis of the synthesized GO/SiO2 nanocomposite.
Another analysis that is used to characterize the synthesized GO/SiO2 nanocomposite is thermal gravimetric analysis (TGA), which considers the thermal stability of the compound. According to Fig. 4, TGA chart for GO indicates the degradation trend as the temperature increases, in which the GO exhibits a slow weight loss reduction due to the water evaporation in temperatures lower than T = 150 °C, as the temperature increases to T = 200 °C the surface functional groups of graphene sheets decompose (Arabpour et al., 2021 Mar 1). At higher temperatures over T = 600 °C, the carbonyl and phenol functional groups that exist in the structure of graphene destroy and result in a massive weight loss. The total weight loss of graphene is equal to 82.61 %, as for nanocomposite, the whole weight loss is highly reduced to 23 % proves the existence of SiO2 nanoparticles in the structures increased the thermal stability of the composite.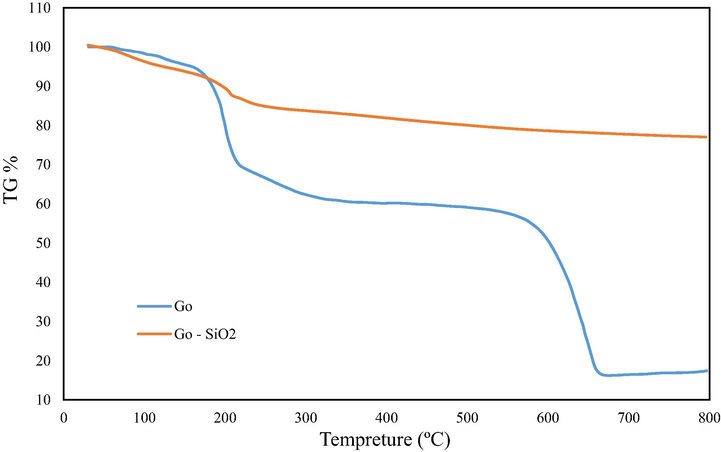
The thermal gravimetric analysis of graphene and synthesized nanocomposite.
3.2 Adsorption study
The concentration of pollutants, MB dye, and Cr (VI) ion in the waste waters are varied and depends on the source of the pollution. For this reason, the effect of the initial concentration of the adsorption process is one of the main factors of study the structure of the adsorbent. In this work, initial concentration of MB and Cr (VI) ion varied from 25 to 300 and 10 to 150, respectively. As can be seen in Fig. 5A, as the initial concertation increases, the adsorption capacity of the adsorbent increase until it reaches a plateau.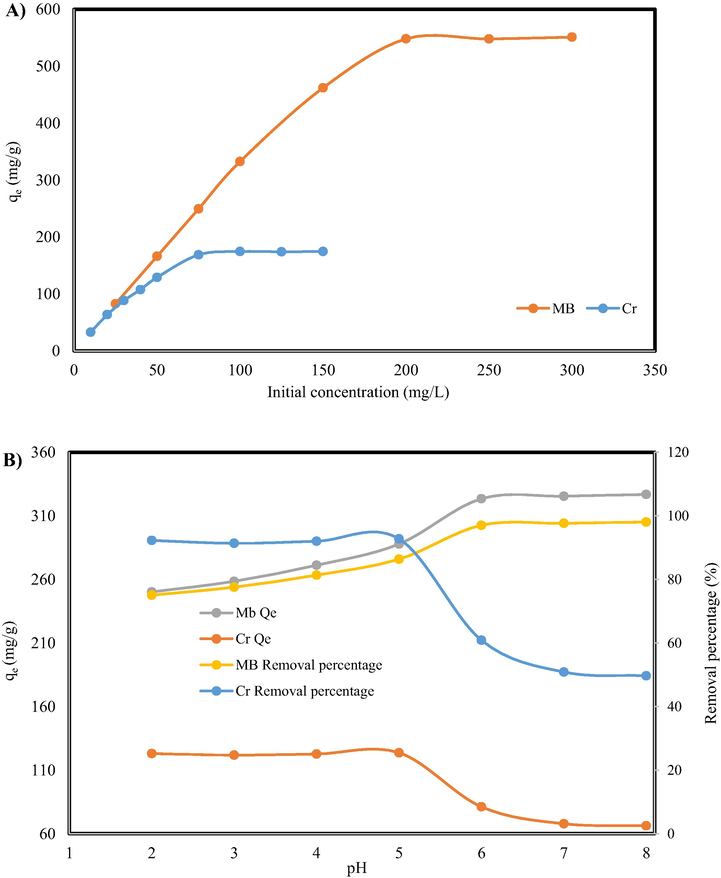
The effect of A) initial concentration, B) pH on removal of MB and Cr by GO/SiO2 nanocomposite.
3.2.1 pH dependency
MB and Cr (VI) solution form strongly depends on the pH of the solution; therefore, the first step is to obtain the value of optimum pH for the pollutant removal. The effects of pH (varying from 2 to 8) of the MB and Cr (VI) solution on the adsorption process are shown in Fig. 5 B. The capacity of adsorption of nanocomposites for removal of the MB from solution increased remarkably from 250.13 to 325.45 mg/g as the pH increased from 2 to 6; beyond the pH = 6, the adsorption capacity reached a plateau and remained fixed until pH = 8. The maximum dye removal, nearly to 100 % dye removal, was obtained at pH > 6, in which most of the carboxylic groups in the nanocomposite structure are activated and ionized interact with the dye structure in the solution and therefore improve the MB adsorption capacity of the GO/SiO2 nanocomposite. As for the Cr (VI) removal, it can be seen that the adsorption capacity decreases from 123 to 66 as the pH increases from 2 to 8. Cr (VI) form in the solution varies as the pH of the solution changes from acidic to basic. Different forms of Cr (VI) exist in the solutions are H2Cr2O7, HCr2O7-, Cr2O72-, and CrO42-. Therefore, the adsorption process capacity changes at different pHs due to the variation of Cr (VI) form (Lv et al., 2012).
The adsorption process on GO/SiO2 can be described by two proposed mechanisms: 1) graphene oxide Nano sheets experience a negative electrostatic charge due to the existence of carboxylic functional groups (–COO-) that can create an electrostatic link with positively charged molecules of MB and Cr (VI) ions and 2) the second adsorption purposed mechanism for the MB removal, rely on the role of SiO2 and its structural OH functional groups. MB is a dye that have several active functional groups, these functional groups can interact with hydroxyl functional group of SiO2. This interaction results in a hydrogen bond between SiO2 and MB which increases the adsorption of MB. As for Cr (VI) ion, as the form of the Cr (VI) varies in different pHs, surface interaction and complexation are the mechanism that controls the adsorption process.
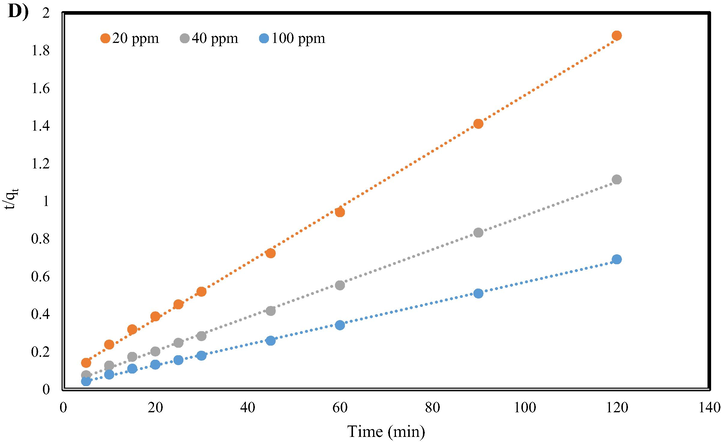
3.2.2 Kinetics studies
The adsorption time is one of the essential parameters that affect the adsorption process. Consequently, to consider the influence of contact time on the MB dye and Cr (VI) ion adsorption on the GO/SiO2 nanocomposite and to investigate the adsorption mechanism, two kinetic models, including a pseudo-first-order kinetic model as well as a pseudo-second-order kinetic model, were applied at different initial concentrations. The equations related to these two kinetic models are given as following (Lin and Wang, 2009; Simonin, 2016):
Eq. (3) is pseudo-first-order and Eq. (4) is pseudo-second-order model. Also,
and
(mg/g) express the quantity of pollutant absorbed on the surface of GO/SiO2 adsorbent and equilibrium condition, respectively. The values of k1 (min−1) and k2 (g.mg−1.min−1) as constants of pseudo-first/second-order models for the adsorption of MB and Cr (VI) on the synthesized nanocomposite are given in Table 1. Correspondingly, the behavior of Pseudo-first/second-order model for adsorption of MB dye and Cr (VI) ion on the synthesized nanocomposite are shown in Fig. 6. As can be seen, the pseudo-second-order kinetic model is the desired model for the adsorption of both MB and Cr (VI) because of the higher correlation regression coefficient (given in Table 1). Thus, the adsorption of MB dye and Cr (VI) ion on the surface of GO/SiO2 is based on chemisorption or chemical adsorption.
Kinetic model
Parameter
MB
(50 ppm)MB
(75 ppm)MB
(100 ppm)Cr (VI)
(20 ppm)Cr (VI)
(40 ppm)Cr (VI)
(100 ppm)
Pseudo-first-order
K1
−0.108
−0.120
−0.083
−0.052
−0.109
−0.077
qe (Exp.)
166.210
249.470
332.580
63.856
107.683
173.846
qe (Calc.)
162.960
341.970
365.090
39.47
98.129
109.395
R2
0.9600
0.8720
0.9420
0.9942
0.9360
0.94620
Pseudo-second-order
K2
0.0018
0.0009
0.0004
0.0028
0.0032
0.0017
qe (Exp.)
166.210
249.470
332.580
63.856
107.683
173.846
qe (Calc.)
172.410
263.150
357.140
67.110
111.110
181.810
R2
0.9985
0.9983
0.9970
0.9991
0.9991
0.9989
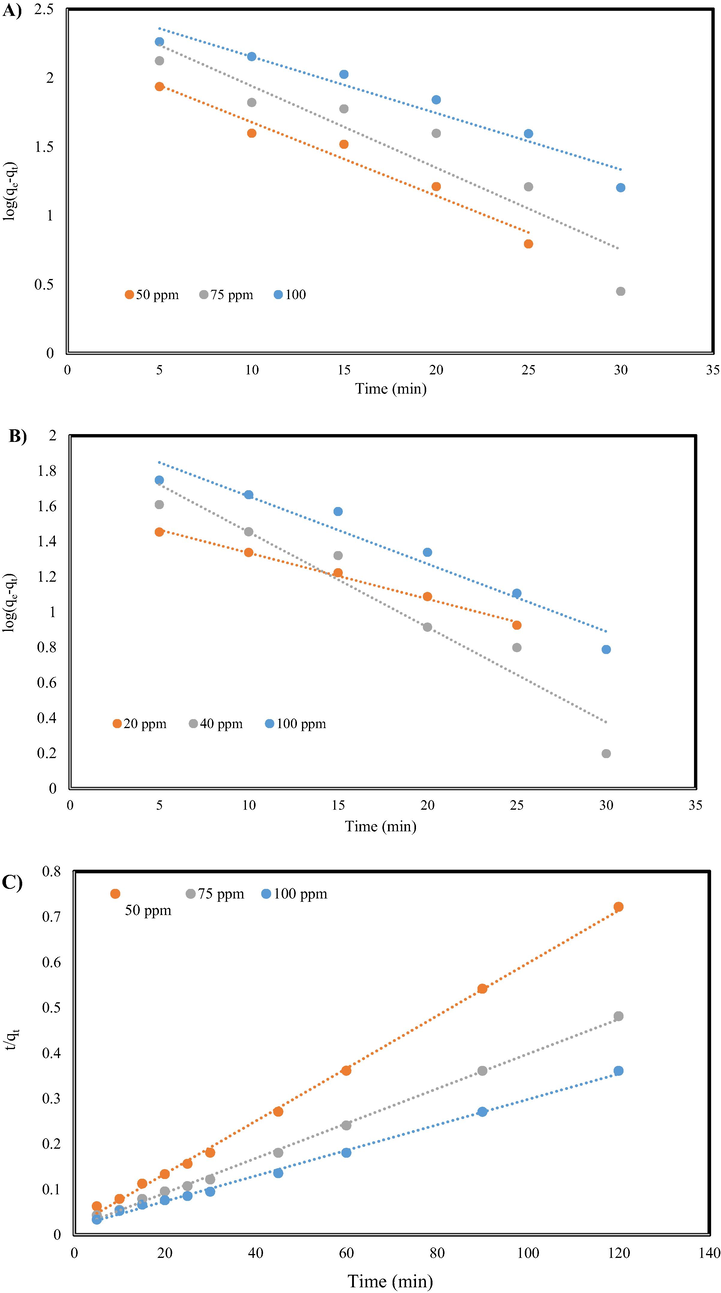
Pseudo-first-order model for A) MB and B) Cr (VI) and Pseudo-second-order kinetics model for C) MB dye and D) Cr ion adsorption.
Pseudo-first-order model for A) MB and B) Cr (VI) and Pseudo-second-order kinetics model for C) MB dye and D) Cr ion adsorption.
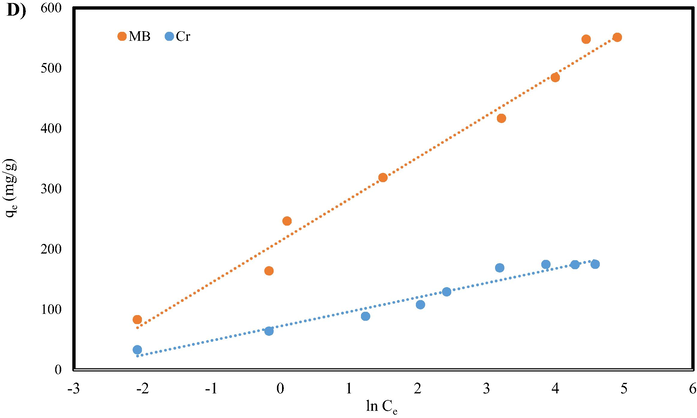
3.2.3 Isotherm study
Adsorption isotherms are one the most valuable and common ways to apply the GO/SiO2 nanocomposite as an absorbent. This mathematical modeling describes how the adsorption process carries out, and adsorbate (MB dye and Cr (VI) ions) interacts with absorbents (GO/SiO2). The maximum adsorption capacity of GO/SiO2 for MB can be obtained using equilibrium isotherms at different initial concentrations. Isotherm studies for MB and Cr (VI) adsorption was carried out using four isotherm models i.e., Temkin, Flory-Huggins, Freundlich, and Langmuir models.
The Langmuir model studies the layer interaction of adsorption, determining the monolayer coverage of adsorbate over a homogenous adsorbent surface (Banivaheb et al., 2021). The linear form of the Langmuir isotherm equation can be given as follows (Banivaheb et al., 2021; Mazzotti, 2006):
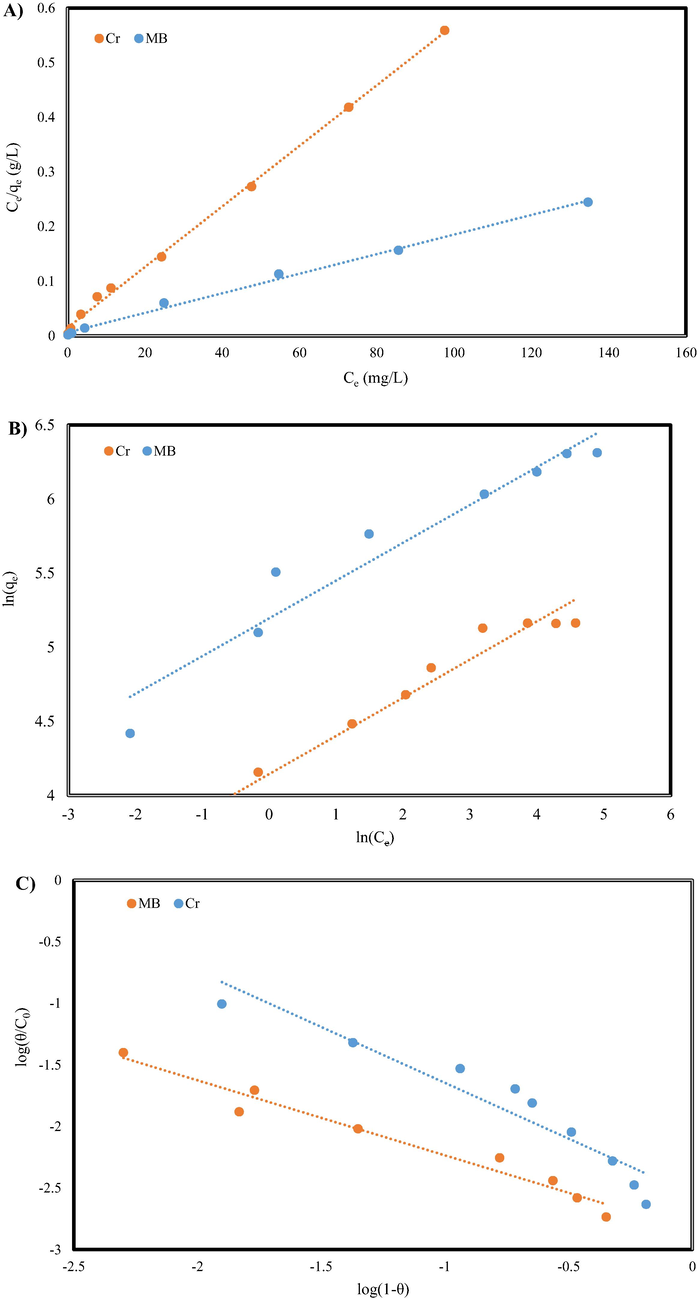
The various isotherm model for MB and Cr (VI) adsorption: A) Langmuir, B) Freundlich, C) Flory-Huggins, and D) Temkin.
The various isotherm model for MB and Cr (VI) adsorption: A) Langmuir, B) Freundlich, C) Flory-Huggins, and D) Temkin.
Isotherm model
Isotherm constants
MB
Cr (VI)
Langmuir
qm (mg/g)
555.500
181.810
b
0.290
0.364
R2
0.996
0.998
RL
0.007–0.700
0.010–0.670
Freundlich
1/n
0.255
0.257
Kf
180.314
63.030
R2
0.935
0.967
Flory-Huggins
Ka
−2.843
−2.552
n
−0.609
−0.907
R2
0.961
0.908
Temkin
AT
21.786
20.582
B
69.286
23.903
bT
34.967
101.357
R2
0.984
0.954
If the separation factor constant is equal to 1, the isotherm is linear, if 0 < < 1 the adsorption process exhibits desirable adsorption, if > 1, it represents an undesirable adsorption conditions, and = 0 indicates an irreversible adsorption process (Arabpour et al., 2021; Mazzotti, 2006). The values results calculated in the this communication were found out in the range of 0.003–1.00, determining that MB dye adsorption and Cr (VI) ion by the GO/SiO2 nanocomposite is favorable (0 < RL < 1).
The interaction between the molecules of adsorbed dyes and representation of the multilayer adsorption is explained and determines using the Freundlich isotherm at the equilibrium state. General form and linear form of the Freundlich isotherm is presented as follows (Yang, 1998):
To calculate the constant, and 1/n, ln against as to be plotted. The estimated data are shown in Table 2.
Another important note in the adsorption process is how much of the adsorbent surface is covered by the adsorbate molecules. This parameter is studied and determined using the Flory-Huggins adsorption isotherm. The Flory-Huggins adsorption isotherm formula is as follows (Shikuku and Mishra, 2021 Jun):
In which the degree of surface coverage is represented by θ = (1- Ce/Co), the number of dye molecules settled in adsorption sites on the adsorbents surface is shown by the n parameter, and the equilibrium adsorption coefficient is described by . To calculate the constants, first, we have to plot vs , then and n can be calculated from the slope and intercept of the plot. Fig. 7 shows the behavior of Flory-Higgins isotherm vs experimental data. The values of R2 are quite low hence, Flory-Higgins equation is not suitable for the MB dye adsorption and Cr (VI) ion on the GO/SiO2 nanocomposite.
One of the most accurate and precise isotherms that express adsorbent-adsorbate interaction is Temkin isotherm (Gowda et al., 2022). The Temkin isotherm equation is represented as follows (Gowda et al., 2022):
In the Temkin isotherm equilibrium binding constant is shown by (L/g), the Temkin isotherm constant represented by and R is the universal gas constant, and temperature is indicated by T, and B means the constant associated heat of sorption (J/mol). To determine and calculate the Temkin constants values and , versus must be plotted, and the constants are extracted from the slope and intercept of the plot (see Fig. 7). The results are tabulated in Table 2.
To determine the governing isotherm on the adsorption, process, isotherms have to be compared and judged by their applicability. One of the factors that determine the accuracy of the isotherm is the correlation between mathematical data and experimental data; for this purpose, is correlation coefficients i.e., R2. The higher values of R2 determine the higher correlation between the mathematical and experimental data. The R2 values are in the range of 0.999–1.000 show that the adsorption experimental data of MB dye and Cr (VI) ions on the GO/SiO2 nanocomposite were well fitted in the Langmuir model.
A comparison between raw materials adsorption, the synthesized Nanocomposite and other adsorbents' maximum capacity is shown in Table 3. As shown in the table addition of Nano silica to graphene oxide structure with 2:1 ratio of GO-SiO2 decreased the adsorption capacity of MB due to the lowering the free space between the GO planes. As for Cr (VI) removal existence of SiO2 increased the adsorption capacity of the adsorbent. Silica Nano particles also shown a low adsorption capacity, due to the agglomeration of the Nano particle in the adsorption process, while in the nanocomposite structure they are fixed on the Graphene oxide planes and show removal activity. As can be seen, the synthesized Nano composite achieved a higher adsorption capacity than to other adsorbents. It is proved that the nanocomposite structure synthesized using a novel method using ultrasonic resulted in a homogenous nanocomposite that interacts and adsorb pollutants better and more efficient compared to other adsorbents.
Adsorbent
Pollutant
Q max (mg/g)
Reference
Carbon from the banana stem
MB
101.01
(Misran et al., 2022)
activated magnesium silicate
MB
99.92
(Kaya-Özkiper et al., 2022)
PPy-Fe3O4-SW
MB
666.66
(Sarojini et al., 2022)
PPy-Fe3O4-SW
Cr (VI)
0.44
(Sarojini et al., 2022)
Fe3O4-Bone Activated Carbon
Cr (VI)
27.86
(Sánchez-Ponce et al., 2022)
Biochar
Cr (VI)
58.54
(Thangagiri et al., 2022)
GO
MB
1474
This study
GO
Cr (VI)
38.97
This study
SiO2
MB
26.72
This study
SiO2
Cr (VI)
17.59
This study
GO/SiO2
MB
555.50
This study
GO/SiO2
Cr (VI)
181.81
This study
3.3 Antibacterial study
The antibacterial activity of synthesized GO/SiO2 nanocomposite was performed via the zone inhibition. The inhibition zone is an area on the agar gel plate where microbial growth is averted by an antibacterial agent placed on the gel. In this method, if the samples applied to the test have antibacterial activity, the microorganism growth will diminish and stop at places the sample is placed. The quality of the antibiotic is measured by the inhibition zone size and clarity (Banivaheb et al., 2021 Aug 1). Clearer and larger inhibition zones indicate more effective compounds. The activity of the GO and GO-SiO2 were determined and obtained results are tabulated in Table 4. As can be seen by the addition of SiO2 to graphene oxide structure, the antibacterial activity of the compound is increased. This phenomenon can be described according to previous studies. Metallic nanoparticles are positively charged due to their nanostructures. When this positive charge interacts with the bacterial cell two common phenomena occurs: I) Silica nanoparticles has a positive charge, as the nanoparticles interact with the bacteria physical properties of the bacteria cell membrane are disturbed and interfered. This interfere and disruption results in the varying the permeability of the cell wall of the bacteria that sabotages the normal osmosis process that keeps the bacteria alive. This misbalance destroys the bacteria and inhibits its growth. II) Another proven mechanism is when a positively charged nanomaterial contacts the cell membrane, it destroys the cell surface resulting in leaking intercellular fluid and proteins, that result in the destruction of the Bactria.
Inhibition zone (mm)
GO
GO-SiO2
Staphylococcus aureus
16
19
Escherichia coli
15
18
4 Conclusions
The synthesized nanocomposite graphene oxide/SiO2 adsorbent was found as a well-organized adsorbent for MB and Cr (VI) ion and with excellent the antibacterial activity. The graphene oxide was synthesized based on a novel method, and its properties, and characterization of it were studied using SEM, and TGA analyses. After that, graphene oxide/SiO2 nanocomposite was synthesized based on a simple and new producer and SEM, EDX, and XRD analyses were performed to investigate the structure of the nanocomposite. The performance of graphene oxide/SiO2 nanocomposite was studied using two methods: removal of dye and heavy metal ion from polluted water and an antibacterial activity test. The overall investigation indicates the high capacity of graphene oxide/SiO2-based nanocomposite adsorbent in industrial conditions of treatment of wastewater polluted by MB and Cr (VI) ion. The adsorptive performance of graphene oxide/SiO2 nanocomposite was found more effective in the removal of MB in comparison to Cr (VI) ion. Antibacterial activity of synthesized nanocomposite increases its application in water treatment plants as a suitable and efficient adsorbent. In addition, using four isotherm models i.e., the Temkin, Flory-Huggins, Freundlich, and Langmuir models, the kinetic of adsorption was investigated and the obtained results indicated the Langmuir model had acceptable conformity with experimental data of dye and ion removal.
Declaration of Competing Interest
The authors declare that they have no known competing financial interests or personal relationships that could have appeared to influence the work reported in this paper.
References
- Chromium removal from contaminated waters using nanomaterials–a review. TrAC Trends Anal. Chem.. 2019;1(118):277-291.
- [Google Scholar]
- Synthesis of graphene oxide/silica/carbon nanotubes composite for removal of dyes from wastewater. Earth Syst. Environ.. 2019;3(3):651-659.
- [Google Scholar]
- A review for chromium removal by carbon nanotubes. Chem. Ecol.. 2017;33(6):572-588.
- [Google Scholar]
- Preparation and optimization of novel graphene oxide and adsorption isotherm study of methylene blue. Arab. J. Chem.. 2021;14(3):103003
- [Google Scholar]
- Ionic liquid excess molar volume prediction: A conceptual comparison. J. Mol. Liq.. 2021;15(336):116581
- [Google Scholar]
- Particle size design of acetaminophen using supercritical carbon dioxide to improve drug delivery: Experimental and modeling. J. Environ. Chem. Eng.. 2021;9(6):106384
- [Google Scholar]
- Numerical solution of particle size distribution equation: Rapid expansion of supercritical solution (RESS) process. Particuology.. 2021;1(57):201-213.
- [Google Scholar]
- Synthesis of modified chitosan TiO2 and SiO2 hydrogel nanocomposites for cadmium removal. J. Saudi Chem. Soc.. 2021;25(8):101283
- [Google Scholar]
- Extraction-like removal of organic dyes from polluted water by the graphene oxide/PNIPAM composite system. Chem. Eng. J.. 2021;1(405):126647
- [Google Scholar]
- One-Step ultraviolet laser-induced fluorine-doped graphene achieving superhydrophobic properties and its application in deicing. ACS Appl. Mater. Interfaces. 2022;14(3):4647-4655.
- [Google Scholar]
- Biodegradation performance and anti-fouling mechanism of an ICME/electro-biocarriers-MBR system in livestock wastewater (antibiotic-containing) treatment. J. Hazard. Mater.. 2022;15(426):128064
- [Google Scholar]
- Synthesis, characterization and absorption study of chitosan-g-poly (acrylamide-co-itaconic acid) hydrogel. Polym. Bull.. 2021;78(4):1887-1907.
- [Google Scholar]
- Synthesis of chitosan-g-itaconic acid hydrogel as an antibacterial drug carrier: optimization through RSM-CCD. Polym. Bull.. 2022;79(10):8575-8598.
- [Google Scholar]
- High-capacity amino-functionalized walnut shell for efficient removal of toxic hexavalent chromium ions in batch and column mode. J. Environ. Chem. Eng.. 2022;10(2):107292
- [Google Scholar]
- Effective removal of anionic dyes from aqueous solutions by novel polyethylenimine-ozone oxidized hydrochar (PEI-OzHC) adsorbent. Arab. J. Chem.. 2022;15(5):103757
- [Google Scholar]
- Insight into the enhanced sludge dewaterability by tannic acid conditioning and pH regulation. Sci. Total Environ.. 2019;20(679):298-306.
- [Google Scholar]
- Adsorption of methylene blue by silver nanoparticles synthesized from Urena lobata leaf extract: kinetics and equilibrium analysis. Mater. Chem. Phys.. 2022;1(288):126431
- [Google Scholar]
- Charge-driven interaction for adsorptive removal of organic dyes using ionic liquid-modified graphene oxide. J. Colloid Interface Sci.. 2022;1(607):1973-1985.
- [Google Scholar]
- Integrating two-stage up-flow anaerobic sludge blanket with a single-stage aerobic packed-bed reactorfor raw palm oil mill effluent treatment. Malays J Sustain Agric.. 2018;2:15-18.
- [Google Scholar]
- Production of polyacrylonitrile/ionic covalent organic framework hybrid nanofibers for effective removal of chromium (VI) from water. J. Hazard. Mater.. 2022;5(427):128167
- [Google Scholar]
- Facile synthesis of layer-by-layer decorated graphene oxide based magnetic nanocomposites for β-agonists/dyes adsorption removal and bacterial inactivation in wastewater. J. Alloy. Compd.. 2021;25(870):159414
- [Google Scholar]
- A novel alkali activated magnesium silicate as an effective and mechanically strong adsorbent for methylene blue removal. J. Hazard. Mater.. 2022;15(424):127256
- [Google Scholar]
- Natural and waste hydrocarbon precursors for the synthesis of carbon based nanomaterials: graphene and CNTs. Renew. Sustain. Energy Rev.. 2016;1(58):976-1006.
- [Google Scholar]
- Use of graphene-based materials as carriers of bioactive agents. Asian J. Pharm. Sci.. 2021;16(5):577-588.
- [Google Scholar]
- A novel nanocomposite based silica gel/graphene oxide for the selective separation and recovery of palladium from a spent industrial catalyst. Chem. Eng. J.. 2020;15(386):123947
- [Google Scholar]
- Comparison between linear and non-linear forms of pseudo-first-order and pseudo-second-order adsorption kinetic models for the removal of methylene blue by activated carbon. Front. Environ. Sci. Eng. China. 2009;3(3):320-324.
- [Google Scholar]
- Treatment of CrVI-Containing Mg(OH)2 Nanowaste. Angew. Chem.. 2008;120(30):5701-5704.
- [Google Scholar]
- Theoretical study of novel B-C-O compounds with non-diamond isoelectronic. Chin. Phys. B. 2022;31(2):026201
- [Google Scholar]
- A multifunctional hierarchical porous SiO2/GO membrane for high efficiency oil/water separation and dye removal. Carbon. 2020;30(160):88-97.
- [Google Scholar]
- Highly active nanoscale zero-valent iron (nZVI)-Fe3O4 nanocomposites for the removal of chromium (VI) from aqueous solutions. J. Colloid Interface Sci.. 2012;369(1):460-469.
- [Google Scholar]
- Equilibrium theory based design of simulated moving bed processes for a generalized Langmuir isotherm. J. Chromatogr. A. 2006;1126(1–2):311-322.
- [Google Scholar]
- Alex. Eng. J.. 2022;61:1946.
- Separation of lattice-incorporated Cr (vi) from calcium carbonate by converting microcrystals into nanocrystals via the carbonation pathway based on the density functional theory study of incorporation energy. Environ. Sci. Nano. 2022;9(5):1617-1626.
- [Google Scholar]
- Solvent Extraction of Nickel and Zinc from Nitric Acid Solution Using D2EHPA: Experimental and Modeling. J. Solution Chem.. 2022;51(4):424-447.
- [Google Scholar]
- Insights into recent advances of chitosan-based adsorbents for sustainable removal of heavy metals and anions. Arab. J. Chem.. 2022;15(2):103543
- [Google Scholar]
- Feasibility of magnetic nano adsorbent impregnated with activated carbon from animal bone waste: Application for the chromium (VI) removal. Environ. Res.. 2022;1(203):111813
- [Google Scholar]
- Electrospun polycaprolactone nanofibrous webs containing Cu-Magnetite/Graphene oxide for cell viability, antibacterial performance, and dye decolorization from aqueous solutions. Arab. J. Sci. Eng.. 2022;47(1):303-318.
- [Google Scholar]
- Potential Use of Low-Cost Agri-Food Waste as Biosorbents for the Removal of Cd (II), Co (II), Ni (II) and Pb (II) from Aqueous Solutions. Separations.. 2022;9(10):309.
- [Google Scholar]
- Application of a polymer-magnetic-algae based nano-composite for the removal of methylene blue–characterization, parametric and kinetic studies. Environ. Pollut.. 2022;1(292):118376
- [Google Scholar]
- Investigating chromium Cr (VI) removal using imidazolium based ionic liquid-chitosan composite adsorptive film. J. Mol. Liq.. 2022;1(347):118317
- [Google Scholar]
- Adsorption isotherm modeling for methylene blue removal onto magnetic kaolinite clay: a comparison of two-parameter isotherms. Appl Water Sci. 2021;11(6):1-9.
- [Google Scholar]
- On the comparison of pseudo-first order and pseudo-second order rate laws in the modeling of adsorption kinetics. Chem. Eng. J.. 2016;15(300):254-263.
- [Google Scholar]
- Electric field applications enhance the electron transfer capacity of dissolved organic matter in sludge compost. Environ. Technol. 2022:1.
- [Google Scholar]
- Effect of ventilation quantity on electron transfer capacity and spectral characteristics of humic substances during sludge composting. Environ. Sci. Pollut. Res.. 2022;19:1-6.
- [Google Scholar]
- Graphene and graphene oxide-based composites for removal of organic pollutants: a review. J. Chem. Eng. Data. 2019;64(3):833-867.
- [Google Scholar]
- Removal of hexavalent chromium by biochar derived from Azadirachta indica leaves: batch and column studies. Chemosphere. 2022;1(286):131598
- [Google Scholar]
- Enhancement of desulfurization by hydroxyl ammonium ionic liquid supported on active carbon. Environ. Res.. 2022;7:113637
- [Google Scholar]
- Co-hydrothermal carbonization of organic solid wastes to hydrochar as potential fuel: a review. Sci. Total Environ.. 2022;12:158034
- [Google Scholar]
- Tourmaline enhanced methane yield via regulating microbial metabolic balance during anaerobic co-digestion of corn stover and cow manure. Bioresour. Technol.. 2022;1(359):127470
- [Google Scholar]
- Facile synthesis of Fe3O4-graphene@ mesoporous SiO2 nanocomposites for efficient removal of Methylene Blue. Appl. Surf. Sci.. 2016;15(378):80-86.
- [Google Scholar]
- Statistical mechanical study on the Freundlich isotherm equation. J. Colloid Interface Sci.. 1998;208(2):379-387.
- [Google Scholar]
- Conversion of teak wood waste into microwave-irradiated activated carbon for cationic methylene blue dye removal: Optimization and batch studies. Arab. J. Chem.. 2022;15(9):104081
- [Google Scholar]
- Ni (NO3) 2-induced high electrocatalytic hydrogen evolution performance of self-supported fold-like WC coating on carbon fiber paper prepared through molten salt method. Electrochim. Acta. 2022;14:140553
- [Google Scholar]
- Experimental and DFT studies of flower-like Ni-doped Mo2C on carbon fiber paper: a highly efficient and robust HER electrocatalyst modulated by Ni(NO3)2 concentration. J. Adv. Ceram.. 2022;11(8):1294-1306.
- [Google Scholar]


