Translate this page into:
pH-responsive berberine release from metal-organic framework based nanocarriers by regulating oxidative stress for targeted therapy of oral squamous cell carcinoma
⁎Corresponding author. tianfei.louise@163.com (Fei Tian),
⁎⁎Corresponding author at: 10 Poyanghu Road, West Area, Tuanbo New Town, Jinghai District, Tianjin, China. zhaojing_tju@tjutcm.edu.cn (Jing Zhao)
-
Received: ,
Accepted: ,
This article was originally published by Elsevier and was migrated to Scientific Scholar after the change of Publisher.
Abstract
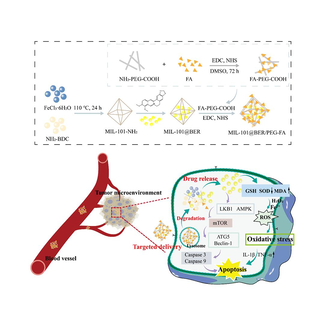
Scheme 1. Schematic illustration of the preparation procedure of MIL-101@BER/PEG-FA NPs and chemo-dynamic therapy for oral squamous cell carcinoma.
Abstract
Excessive generation of reactive oxygen species (ROS) induces cellular oxidative stress damage, resulting in mitochondrial dysfunction and subsequent promotion of apoptosis. Induction of oxidative stress damage through chemo-dynamic therapy within the tumor microenvironment (TME) represents a promising therapeutic strategy for cancer treatment. Herein, folic acid-polyethylene glycol (FA-PEG)-modified MIL-101 NPs loaded with berberine (BER) were constructed to develop a nanoplatform based on the modulation of oxidative stress for the treatment of Oral squamous cell carcinoma (OSCC). Comprehensive characterizations based on TEM, DLS, XRD, FTIR, TGA and UV–vis spectroscopy confirmed the successful synthesis of MIL-101/PEG-FA with uniform size, high drug loading efficiency (32.59 %) and superior pH-responsive drug release (Ber release of 24.44 % and 70.22 % within 96h at pH 7.4 and 5.0, respectively). Cellular experiments revealed that MIL-101/PEG-FA achieved the pH-responsiveness release of the BER in the TME, thereby improving the bioavailability of BER. Moreover, Fe3+ in MIL-101(Fe) showed strong ability to consume GSH and provide a continuous supply of H2O2, which decreased SOD activity, and contributed to the generation of MDA, thereby increasing the production of toxic ROS in CAL27 cells. Meanwhile, MIL-101@BER/PEG-FA up-regulated inflammatory cytokine levels (TNF-α and IL-1β), promoted inflammatory response in TME, induced CAL27 cells apoptosis by regulating the LKB1/AMPK pathway. Finally, MIL-101@BER/PEG-FA showed good efficiency against OSCC in vivo. Consequently, MIL-101/PEG-FA can be applied as a nanocarrier platform for the treatment of OSCC.
Keywords
Metal organic framework
Oxidative stress
Oral squamous cell carcinoma
Berberine
Tumor microenvironment

1 Introduction
Malignant tumors are one of the most lethal diseases and rank among the three leading causes of death from human diseases. Oral squamous cell carcinoma (OSCC) is the most common malignant tumor of the head and neck region, accounting for approximately 90 % of malignant tumors of the oral and maxillofacial region (Mannelli et al., 2018). OSCC has a poor prognosis, frequent lymph node metastasis, significant regional recurrence rate, and a 5-year survival rate of less than 50 % (Zhang et al., 2015). Currently, the management of OSCC primarily revolves around surgical intervention complemented by adjuvant chemotherapy and radiation therapy (Eid et al., 2014). However, patients with intermediate-advanced OSCC often encounter tissue defects and functional impairments due to extensive lesions, deep infiltration, and the potential risk of distant metastasis associated with surgical interventions. Unfortunately, due to the severe toxic side effects associated with conventional treatments for OSCC and the dearth of targeted therapeutics that effectively impede OSCC growth, it is imperative to enhance the diversity and efficacy of therapeutic modalities for diagnosing and treating OSCC (Chen et al., 2016).
Berberine (BER) is a natural active ingredient isolated from plants such as Coptidis Rhizoma or Phellodendri Chinensis Cortex. It has a variety of pharmacological effects such as antibacterial, anti-inflammatory, anti-tumor, and treatment of cardiovascular diseases (Li-Weber, 2013; Li et al., 2015). Studies have shown that BER has a significant anti-tumor effect and can inhibit the activity of human colon cancer, lung cancer, gastric cancer, lung adenocarcinoma, tongue cancer, liver cancer, breast cancer and other tumor cells (Uma Maheswari et al., 2023; Cai et al., 2021; Liu et al., 2022; Lin et al., 2023). However, the limitations of BER, such as its poor water solubility, low oral bioavailability and utilization, rapid hepatic metabolism, inadequate gastrointestinal absorption, and limited bioavailability pose significant challenges to its clinical application. At present, there is no report on the nano-preparation of BER in the treatment of OSCC. Therefore, it is necessary to develop a nanocarrier platform capable of enhancing the bioavailability and anticancer efficacy of BER, thus offering significant prospects for investigating the therapeutic potential of BER in OSCC.
Nanoplatforms are widely used in the treatment of cancer (Ouyang et al., 2023; Sun et al., 2023). Metal organic frameworks (MOFs) are novel nanoplatforms composed of metal ions and organic ligands with the advantages of high loading, adjustable particle size, easy surface modification, and good biocompatibility (He et al., 2019; Wuttke et al., 2017), improvement of the therapeutic effect on diseases by designing MOFs with different properties through various modifications applied in different fields (Li et al., 2022, 2023; Chen et al., 2024). As a new nano-drug delivery system, many pH-responsive MOFs are used as carriers for cancer therapy, triggering drug release under the endogenous stimulation of the tumor microenvironment (TME) to achieve the purpose of treating tumors (Ni et al., 2020). As an important subclass of the MOF family, the Vassil skeleton (MIL) is a known potential carrier for anticancer drugs. MIL-101 (C24H12ClFe3O13) has the characteristics of easy modification, which can be modified with various functional groups or ions on the structure, thereby increasing the action time of drugs on cancer cells and reducing the generation of tumor drug resistance (Chedid and Yassin, 2018). Folic acid (FA) can be used as a ligand for active targeted drug delivery, modified on drug carriers to deliver the drug into tumor cells, where it is cyto-phagocytosed to produce antitumor effects (Marchetti et al., 2014). Polyethylene glycol (PEG) is a hydrophilic macromolecule, which is often used for surface modification of nano-delivery systems (Veronese and Pasut, 2005; Liu et al., 2022). PEGylated nanomaterials enter the TME, and PEG will be degraded to expose the drug carrier to the cells, releasing the drug to achieve the effect of treating tumors (Lee et al., 2003; Kim et al., 2008, 2009). Bo Li et al. (Li et al., 2022) designed a tumor microenvironment-activated metal–organic framework-based nanoplatform DSF@MOF-199@FA to further promote apoptosis through efficient generation of reactive oxygen species (ROS) and elimination of glutathione (GSH). Yingwei Li et al. (Yang et al., 2021) constructed PEG-modified Cu-Pd@MIL-101 depleting GSH and inducing the conversion of hydrogen peroxide (H2O2) to the more toxic hydroxyl radicals (·OH) to achieve enhanced therapeutic tumor treatment. Therefore, it is a potential anticancer strategy to construct a nanoplatform based on loading anticancer drugs by regulating oxidative stress of TME to induce tumor cell apoptosis.
ROS is the reduction products of oxygen molecules, including ·OH, H2O2, and negative superoxide ions (O2–) (Cairns et al., 2011). High levels of ROS are highly cytotoxic, inducing cellular damage and death, and affecting cancer progression in an apparently paradoxical manner (Reczek et al., 2017). Abnormal levels of oxidative stress are associated with the development of several diseases (Ren et al., 2023; Hu et al., 2024). The level of oxidative stress within the TME is closely related to tumor development, recurrence and metastasis (Trachootham et al., 2009). Therefore, exacerbating oxidative stress is expected to improve antitumor efficacy by modulating redox levels in the TME. GSH is a key responsive substance in the antioxidant system, which inhibits potential ROS accumulation. Drug-induced oxidative stress to kill tumor cells is one of the main tumor treatment strategies (Ozben, 2007). Studies have demonstrated that a diverse range of chemotherapeutic agents can induce significant oxidative stress in tumor cells (Conklin, 2004; Barrera, 2012). Therefore, regulating the level of oxidative stress in the TME is a promising strategy for antitumor therapy. In recent years, nano-formulations have shown more advantages in tumor therapy and have been widely used in targeted tumor therapy to improve anticancer efficacy by targeting to the TME and controlling the release of drugs within the tumor.
In this study, we designed PEG-modified MIL-101 that coupled FA on the surface to achieve targeting ability and pH-responsiveness, simultaneously loaded with the anticancer drug BER, which aggravated the oxidative stress in the TME. We characterized the morphology and structure of the nanomaterials which showed strong pH-responsiveness, dispersibility and biocompatibility. MIL-101@BER/PEG-FA could effectively achieve controlled pH-responsive releasing BER into the TME, which caused mitochondrial dysfunction by depleting intracellular GSH and increasing intracellular ROS levels in OSCC cells. We also proved that effective accumulation of BER could enhance the therapeutic effect for OSCC, which promoted the release of inflammatory factors (TNF-α, IL-1β). MIL-101@BER/PEG-FA had a significant anticancer effect and promoted OSCC cells apoptosis by regulating the LKB1/AMPK pathway thereby activating the expression of autophagy genes (ATG5, Beclin-1) and apoptosis-related genes (Caspase 3, Caspase 9). In addition, we investigated that our prepared MIL-101@BER/PEG-FA significantly promoted anti-tumor effect in vivo compared to BER and demonstrated effectiveness in OSCC treatment. Thus, the nano-loaded platform (MIL-101/PEG-FA) based on pH-responsive degradation in the TME, which provided a new strategy for OSCC therapy.
2 Experimental section
2.1 Materials
FeCl3·6H2O, 2-Aminoterephtalic acid (NH2-BDC), N-hydrox-ysuccinimide (NHS), 1-(3-dimethylaminoproply)-3-ethylcarbodiimide hydrochloride (EDC), Methylene blue (MB), Glutathione (GSH), Berberine (BER), Folic acid (FA), and NH2—PEG—COOH were purchased from Aladdin (Shanghai, China). Ethanol absolute, N, N- dimethylformamide (DMF), and Dimethyl sulfoxide (DMSO) were purchased from Concord (Tianjin, China). Reduced Glutathione Content Assay Kit, Hydrogen Peroxide (H2O2) assay kit, Total Superoxide Dismutase (T-SOD) assay kit, and Malondialdehyde (MDA) assay kit were purchased from Nanjing Jiancheng (Nanjing, China). Cell Counting Kit-8 (CCK-8), 2′,7′-Dichlorofluorescin diacetate (DCFH-DA), Mitochondrial Membrane Potential Assay Kit with JC-1, and Calcein AM/PI live/dead cell staining kit were purchased from Beijing Solarbio Science & Technology Co., Ltd. Enzyme-linked immunosorbent assay (ELISA) kits for TNF-α and IL-1β were purchased from Jiangsu Meimian Industrial Co., Ltd. RNAsimple Total RNA Kit, FastQuant RT Kit (with gDNase), and SuperReal fluorescence quantitative premixing kit were purchased from TIANGEN (Beijing, China).
2.2 Preparation of materials
2.2.1 Synthesis of MIL-101 NPs
Fe-MIL-101-NH2 nanoparticles (MIL-101 NPs) were synthesized by solvothermal method (Cabrera-Garcia et al., 2019). 360 mg of NH2-BDC and 1 g of FeCl3·6H2O were dissolved in 24.3 mL DMF, mechanically stirred for 30 min, and heated at 120 °C for 24h. The resulting product was collected by centrifugation at 12,000 rpm for 10 min, and purified by washing three times with DMF and anhydrous ethanol. Finally, the purified product was activated after drying under vacuum (100 °C, 24 h).
2.2.2 Synthesis of MIL-101@BER NPs
The activated MIL-101 NPs (20 mg) were dissolved in 10 mL of deionized water: DMF (1:1) solution, ultrasonic for 30 min, and then added to 10 mL of 50 % DMF containing BER (20 mg). The mixture was magnetically stirred for 24 h, subsequently washed three times with deionized water to obtain MIL-101@BER.
2.2.3 Synthesis of MIL-101@BER/PEG-FA NPs
Dissolve the FA solution (0.5 mg/mL) using ultrasonication, followed by addition of EDC and NHS (0.3 mmoL). Mix the activated carboxyl group for 3 h, drops of NH2-PEG-COOH solution (0.5 mg/mL) were added to the FA solution, and the reaction was carried out for 72 h to prepare FA-PEG-COOH. Then the FA-PEG-COOH was dialyzed for 72 h in a dialysis bag (MW, 1000 DA). MIL-101@BER (0.5 mg/mL) was dissolved in DMSO, and activated FA-PEG-COOH solution (0.5 mg/mL) was added. After 12 h of stirring in the dark, the free FA-PEG-COOH, EDC and NHS were removed by centrifugation, wash with water three times, and then vacuum dry the prepared MIL-101@BER/PEG-FA.
2.3 Optimization of MIL-101@BER
2.3.1 Single-factor and response surface examination
The drug loading efficiency and encapsulation efficiency of BER on MIL-101 were investigated by single factor. The MIL-101 solution was mixed with BER solution of different concentrations, and the mixture was ultrasonicated and stirred. After the drug loading, the mixture was centrifuged and dried in vacuum. The control variable method was used to investigate the changes of drug loading efficiency and encapsulation efficiency of MIL-101@BER under different conditions of rotation speed (200, 300, 400, 500, 600 rpm), temperature (15, 25, 30, 35, 45 °C), drug loading time (12, 24, 36, 48, 60 h), and drug loading ratio (5:1, 3:1, 2:1, 1:1, 1:2, 1:3, 1:5). Based on the results of single factor investigation, response surface methodology was used to investigate the effect of different conditions on drug loading rate of MIL-101@BER. The drug loading ratio X1 (2:1, 1:1, 1:2), drug loading time X2 (12, 24, 48 h) and drug loading temperature X3 (15, 25, 35 °C) were used as the factors for three-factor three-level response surface optimization.
2.3.2 Optimal preparation conditions and validation of MIL-101@BER
According to the results of response surface optimization, drug loading was performed under optimal conditions, and the drug loading efficiency and encapsulation efficiency of the material were determined using UV–vis spectrophotometry. Subsequently, three replicates of the experiment were conducted to assess process stability.
2.4 Characterization
The particle size and potential of nanoparticles were detected by DLS (Thermo Fisher, USA); The surface morphology of nanoparticles was observed by TEM; UV–vis spectrophotometer (Cary 60, USA) recorded the ultraviolet spectra of the samples; The structural composition of the nanoparticles was detected by FT-IR; The temperature-mass relationship of nanoparticles in the range of 0 − 800 °C was detected by TGA; XRD was used to analyze the crystal structure of nanoparticles.
2.5 Drug loading and release characteristic
The feasibility of MIL-101 as a nano drug carrier was evaluated by investigating the release of BER loaded material in buffer solutions with different pH values. In this experiment, MIL-101@BER and MIL-101@BER/PEG-FA were dissolved in PBS buffer solutions with pH 5.0 and 7.4, and solutions with different pH values were added to dialysis bags (MW 3500 Da), which were placed in PBS buffer solutions with the same pH value and placed in a shaker at 37 °C with a speed of 110 rpm to avoid light shock. At the predetermined time points of 2, 4, 6, 8, 10, 12, 24, 36, 48, 60, 72, 84, and 96 h, 3 mL of buffer solution was taken and the corresponding pH buffer solution was made up. The absorbance of BER was detected at 345 nm, and the concentration of BER was calculated. The cumulative release was calculated according to the following formula: Dn is the release degree of the samples taken at different time points, Cn is the concentration of the samples taken at different time points, V is the volume of the release medium, X is the dilution factor, M is the total weight of the initial drug, D is the cumulative release degree.
2.6 ·OH generation ability
·OH generation ability of MIL-101 and MIL-101@BER/PEG-FA at pH 6.5 was detected by MB degradation experiment. ·OH generated by the material was analyzed according to the fading degree of MB, and ·OH could make the blue color of MB solution become lighter. MIL-101@BER and MIL-101@BER/PEG-FA (100 µg/mL) were incubated with PBS (pH 6.5) containing GSH (10 mM), MB (10 µg/mL) and H2O2 (10 mM) at 37 °C for 30 min, and the absorbance of the solution at 665 nm was determined by UV–vis.
2.7 Cell culture
CAL27 cells and KB cells were cultured in 10 % heat-inactivated fetal bovine serum (FBS), 1 % penicillin and streptomycin (PS), and 90 % Dulbecco's Modified Eagle's Medium (DMEM) solution, and the cells were cultured in a cell incubator at 37 °C and 5 % CO2.
2.8 Cytotoxicity study
CCK8 method was used to detect the cytotoxicity of MIL-101, MIL-101/PEG-FA and the anti-tumor activity of MIL-101@BER and MIL-101@BER/PEG-FA. CAL27 and KB cells were seeded in 96-well plates at a density of 1 × 10⁴/mL for 24 h. Incubated with different concentrations of drugs for 24 and 48 h. 100 μL of CCK-8 solution was added and incubated at 37 °C for 2 h. The absorbance of each group at 450 nm wavelength was detected by using Microplate reader.
2.9 Cellular uptake study
Due to the weak fluorescence of BER, it was substituted with the fluorescent agent rhodamine 6G (R6G), and the drug loading method remained consistent with that described in “2.2″ section.
The cellular internalization of MIL-101@R6G/PEG and MIL-101@R6G/PEG-FA was employed to assess the targeting efficacy of FA. CAL27 and KB cells were seeded in 12-well plates at a density of 2 × 10⁵/mL for 24 h, and then were treated with MIL-101@R6G/PEG and MIL-101@R6G/PEG-FA for 1, 2, 4, and 6 h. The cells were fixed with 4 % paraformaldehyde for 30 min, the nuclei were positioned with 10 µg/mL of Hoechst 33342 solution for 30 min. The fluorescence in each group of cells was detected using an automated cell imaging system. The average fluorescence intensity was quantified utilizing Image J software.
2.10 Detection of oxidative stress indicators
2.10.1 Measurement of GSH、MDA、SOD、H2O2 levels in vitro
CAL27 cells were incubated in 6-well plates (1 × 10⁶/mL) for 24 h, and co-cultured with PBS, 5-FU, BER, MIL-101@BER, and MIL-101@BER/PEG-FA solutions for 24 h, the cells were digested with trypsin, followed by 2–3 washes after centrifugation. Subsequently, they were resuspended in PBS and mechanically disrupted under ice bath conditions. After centrifugation at 14000 r/min for 15 min, the supernatant was collected and the changes in GSH, MDA, SOD, and H2O2 levels in each group were detected by the kit.
2.10.2 Intracellular ROS measurement
To detect the effect of MIL-101@BER/PEG-FA on the changes in intracellular ROS levels in CAL27 cells, we used DCFH-DA probe to detect the levels of ROS. CAL27 cells were seeded in 12-well plates (2 × 10⁵/mL), and the cells were incubated in PBS, 5-FU, free BER, MIL-101@BER, and MIL-101@BER/PEG-FA solutions for 8 h, and stained with DCFH-DA (10 μM) for 30 min. Hoechst 33,342 (10 µg/mL) was added to each group to locate the nucleus for 30 min. The fluorescence in each group was detected by a fully automatic cell imaging system. The average fluorescence intensity was calculated by Image J software.
2.11 Enzyme-linked immunosorbent assay (ELISA)
CAL27 cells were seeded in 6-well plates (1 × 10⁶/mL) and co-cultured with PBS, 5-FU, BER, MIL-101@BER, and MIL-101@BER/PEG-FA solutions for 24 h. After trypsin digestion and centrifugation, the cells were subjected to ultrasonic cell disruption following PBS washing. After centrifugation at 14,000 r/min for 15 min, the supernatant was collected and the levels of TNF-α and IL-1β in the cells were quantified following the instructions provided by the Elisa kit.
2.12 Mitochondrial membrane potential (MMP) measurement
To analyze the effect of MIL-101@BER/PEG-FA on mitochondrial function of CAL27 cells, Mitochondrial Membrane Potential (MMP) Assay Kit with JC-1 was used to determine the MMP. The cell culture and grouping conditions were consistent with those described in “2.10.2″ section. Cells in each group were incubated with JC-1 staining solution for 30 min, followed by two washes using JC-1 staining buffer (1 × ). The MMP within each group of cells was assessed utilizing a fully automated cell imaging system.
2.13 Quantitative real-time polymerase chain reaction (qRT-PCR) analysis
The expression of LKB1, AMPK, mTOR, Caspase 3, and Caspase 9 in CAL27 cells was detected by qRT-PCR. Total mRNA of CAL27 cells was extracted and purified according to the RNAsimple Total RNA Kit. The mRNA concentration was detected by a microprotein nucleic acid analyzer. The mRNA was reversed to cDNA according to the FastQuant RT Kit (with gDNase). The expression of each gene in the cells was detected according to the SuperReal fluorescence quantitative premix kit. The data were processed by relative quantitative method. The primer sequence was designed by Primer 5.0 software (Table 1).
Gene
Forward primer
Reverse primer
LKB1
TGACCTGCTGAAAGGGATGC
CCTCCTCTTCTGGGACCTGT
AMPK
TCACAGGCATATGGTGGTCC
GGGCCTGCATACAATCTTCCT
mTOR
TGGAACTCCGAGAGATGAGTC
GCATTCCCACCTTCCACTCC
Beclin-1
CAGGATGGTGTCTCTCGCAG
GTCCCCAGTGACCTTCAGTC
ATG5
TGCTATTGATCCTGAAGATGGGG
TCAATCTGTTGGCTGTGGGA
Caspase 3
ACTCCACAGCACCTGGTTAT
ATGGCACAAAGCGACTGGAT
Caspase 9
CGGCTGGTGGAAGAGCTG
AGCCTGCCCGCTGGATG
GADPH
CTGGGCTACACTGAGCACC
AAGTGGTCGTTGAGGGCAATG
2.14 Live/Dead staining in vitro
The cell culture and grouping conditions were consistent with those described in section “2.10.2″. Cells in each group were incubated with Calcein AM (2 μM) for 30 min, PI (5 μM) were incubated for 15 min in the absence of light. The fluorescence ratio of live/dead cells was detected by a fully automated cell imaging system.
2.15 Hemolysis experiment
Fresh blood was collected from black mice, followed by centrifugation at 4 °C °C and 3000 rpm for 10 min. The resulting supernatant was then discarded. The red blood cells were washed with PBS for 3 times, and 5 mL of PBS was added to make a 2 % red blood cell suspension. MIL-101 and MIL-101/PEG-FA were accurately weighed and dissolved in ultrasonic solution to prepare a 1 mg/mL stock solution. Subsequently, the stock solutions of both groups were further diluted to obtain working solutions with concentrations of 25, 50, 100, 200, 400, and 1000 μg/mL. Deionized water was used as positive control group, and PBS was used as negative control group. 200 µL erythrocyte suspension containing working solution shaken at 37 °C (100 rpm) for 8 h, centrifuged at 4 °C at 3000 rpm for 10 min, and 200 µL supernatant was absorbed and added into a 96-well plate. The absorbance at 541 nm was detected by a microplate reader. The experiment was repeated 3 times, and the HP was calculated as follows: HP (%) = (As-Ac2) / (Ac1-Ac2) × 100.
HP was hemolysis percentage; As represented the absorbance value of supernatant in each experimental group, Ac1 and Ac2 represented the absorbance value at 541 nm in positive control group and negative control group, respectively.
2.16 Construction of tumor model
BALB/c male nude mice (4–6 weeks old) were purchased from Beijing HFK Bioscience Co., Ltd. All animal experiments were approved by the Laboratory Animal Ethics Review Committee of Tianjin University of Traditional Chinese Medicine. For the mouse oral cancer model, the BALB/c male nude mice were subcutaneously injected 100 μL of CAL27 cells (1 × 10⁷/mL) to construct the model. The mice were experimented until the tumor volume reached 80–100 mm3. The tumor-bearing mice were randomly divided into control, BER, and MIL-101@BER/PEG-FA groups for in vivo experiments.
2.17 Statistical analysis
All data were expressed as mean ± SD of at least three independent experiments. ANOVA test was used to compare the significance of the difference between the two groups (P<0.05).
3 Results and discussion
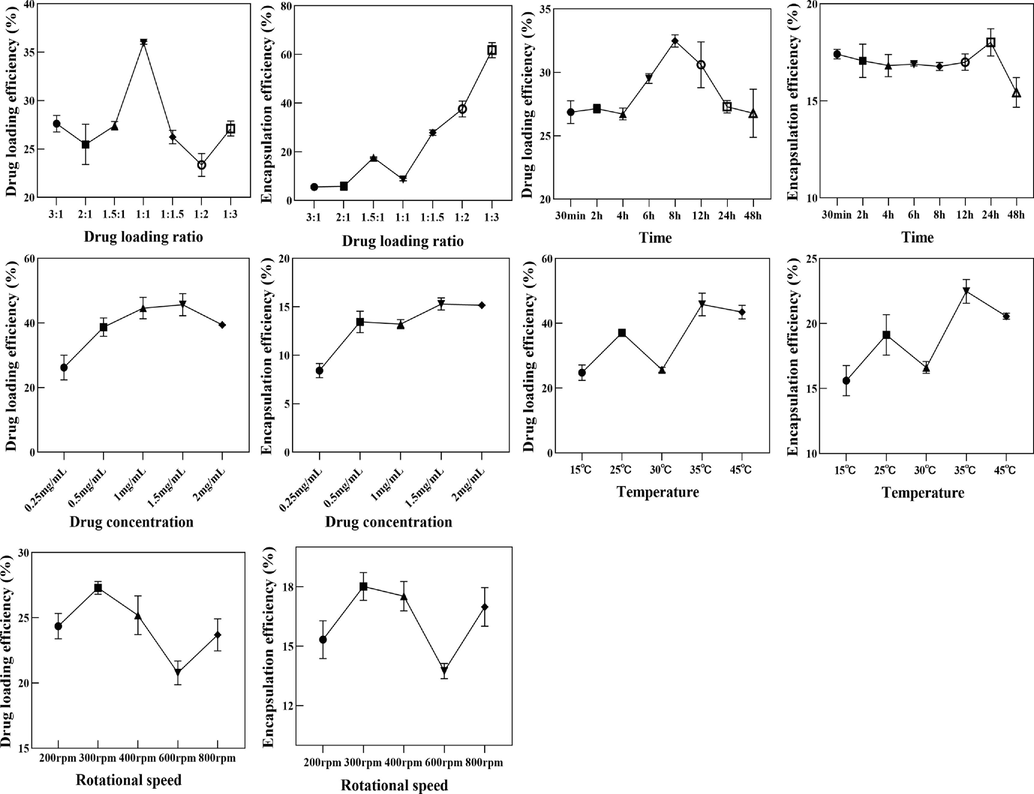
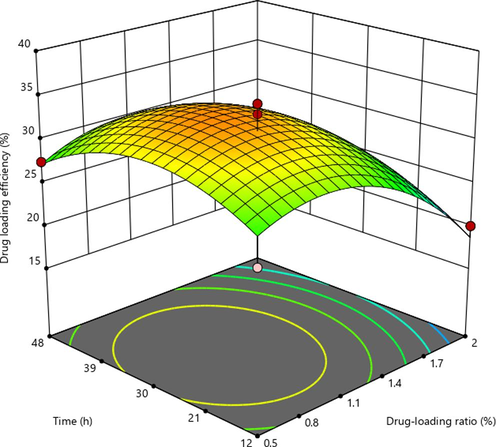
3.1 Single factor and response surface analysis
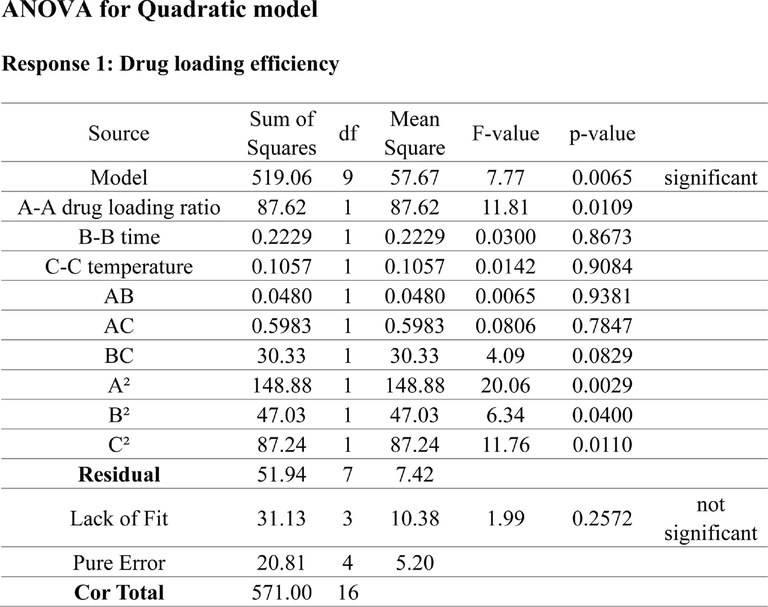
The results of single factor experiment were shown in Fig. S1. The drug loading efficiency (Y) of MIL-101 were analyzed by using Design-Expert12 software. The regression equation model and the significance test results of each factor were shown in Table S1. The quadratic multiple regression equation was Y (drug loading efficiency) = 33.33–3.97X1 + 0.3014X2 + 1.82X3 + 0.7084X1X2 − 0.5038X1X3 + 2.16X2X3 − 5.52X12 − 4.11X22 − 2.80X32 (P<0.01, R2 = 0.9039). (X1: drug loading ratio, X2: time, X3: temperature). The predictive fitting degree R2 was −0.3257 and the corrected fitting degree R2 was 0.7803, the predictive fitting degree was ≤ the corrected fitting degree, indicating that the model was accurate and could be used for the analysis and prediction of drug loading results. The results of Tab. S1 showed that X1, X12, and X22 had significant differences (P<0.05). As shown in Fig. S2, the three-dimensional response surface had a large radian, which was consistent with the results of variance analysis of the model.
3.2 Synthesis and characterization of the nanocomposites
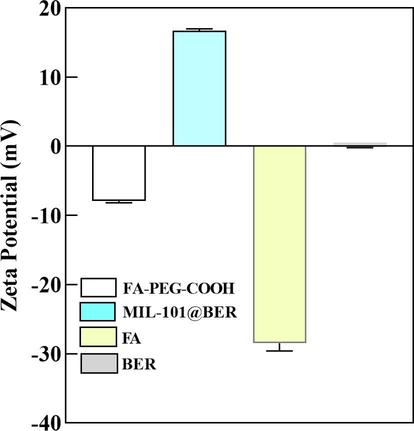
MIL-101 was observed under TEM as a regular octahedron with an average particle size of 162.09 nm (Fig. 1A). After the surface modification of MIL-101 with PEG-FA, MIL-101/PEG-FA retained its octahedral structure identical to that of MIL-101 by TEM, while exhibiting an increased average particle size of 185.16 nm (Fig. 1B). In addition, the hydrodynamic particle sizes of MIL-101 and MIL-101/PEG-FA detected by DLS were 189.68 and 219.04 nm, respectively (Fig. 1C). Due to the high scattering intensity of DLS on larger particles, the disparity between TEM and DLS results arises from variations in particle solubility in water, leading to disparate dispersion characteristics. Moreover, the potential of MIL-101 particles was 34.81 mV, and the potential of MIL-101/PEG-FA decreased to −8.58 mV after PEG-FA surface modification (Fig. 1D). The potential of FA and BER was −27.95 and −0.15 mV, respectively (Fig. S3).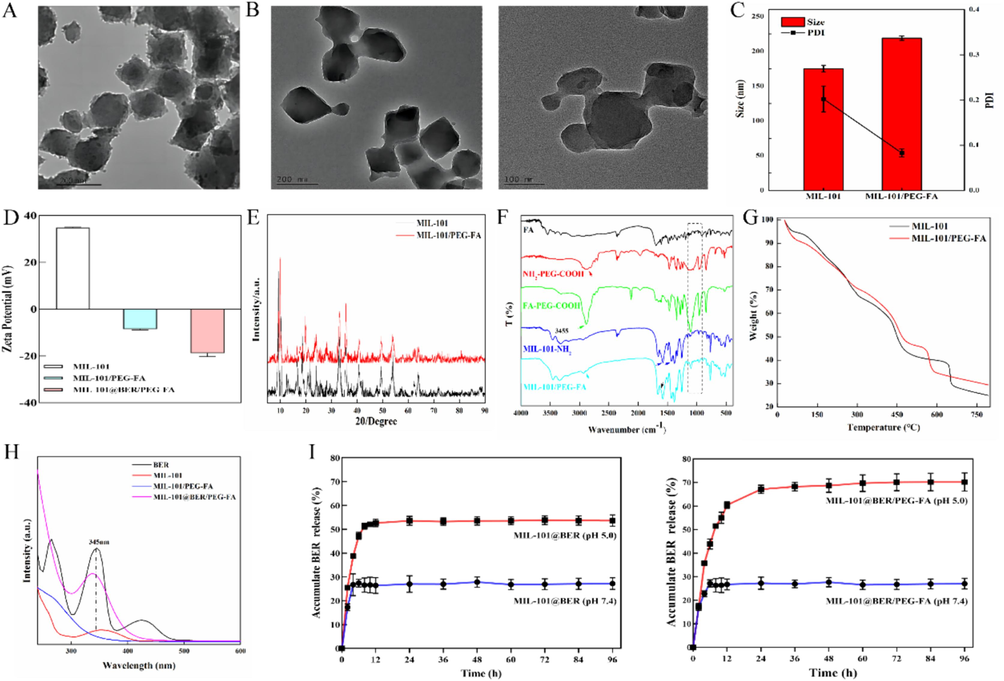
Characterization of MIL-101/PEG-FA. (A) and (B) TEM images of MIL-101 NPs and MIL-101/PEG-FA NPs. (C) Particle size and (D) Surface charge of NPs detected by DLS. (E) XRD pattern, (F) FT-IR spectra, (G) TGA curves, and (H) UV–vis of nanomaterial drug loading of nanocomposite. (I) Drug release characteristic of MIL-101@BER and MIL-101@BER/PEG-FA at pH 5.0 and 7.4.
As shown in Fig. 1E, after surface modification of PEG-FA, the characteristic diffraction peaks of MIL-101/PEG-FA are basically the same as those of MIL-101, indicating that modification of PEG-FA on the surface of MIL-101 does not affect the crystal structure.
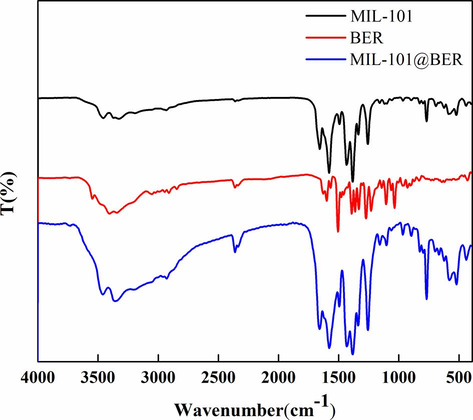
The spectral changes of FA, NH2—PEG—COOH, MIL-101-NH2, FA-PEG-COOH and MIL-101/PEG-FA were detected by FT-IR. Fig. 1F showed that the C—N and C—O stretching vibration of carboxylate appeared at 1295, 1405 and 1511 cm−1, indicating the presence of 2-aminoterephthalate anion in the skeleton. N—H stretching vibration appeared at 3237 and 3455 cm−1, indicating the presence of primary amine groups (Liu et al., 2018; Liu et al., 2022). 1623, 1070, and 1529 cm−1 correspond to the —COOH, C—O—C, and —NH2 of FA, respectively. 1743, 1068, and 1614 cm−1 correspond to the —COOH, C—O—C and —NH2 of NH2—PEG—COOH, respectively. MIL-101/PEG-FA had a C—O—C characteristic peak corresponding to PEG and FA near 1070 cm−1, a carbonyl characteristic peak at 1635 cm−1, and an enhanced amide I band. These spectral performances indicated that FA-PEG-COOH was successfully connected to the surface of MIL-101-NH2 through amide bonds. Meanwhile, C—O—C characteristic peaks and C—N stretching vibration peaks of BER appear at MIL-101@BER at 1074 and 1353 cm−1, indicating that MIL-101 was successfully loaded BER (Fig. S4).
TGA was used to detect the thermogravimetric changes of MIL-101. Fig. 1G showed that the weight of MIL-101 changed significantly in the range of 0 − 200 °C °C and 250 − 500 °C, and the decrease may be related to the loss of solvent and skeleton dissociation in the nanoparticles. After PEG-FA modification, the TG of MIL-101/PEG-FA decreased by 18.8 % and 29.05 %, respectively. At 550 − 600 °C, the TG of MIL-101/PEG-FA decreased by 10.61 %, which may be related to the decomposition of PEG-FA.
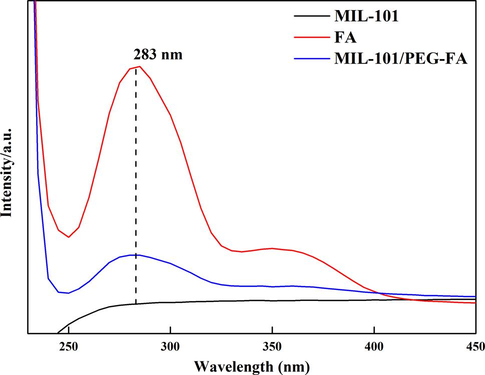
The ultraviolet absorbance of MIL-101, MIL-101@BER and MIL-101@BER/PEG-FA were detected by UV–vis. MIL-101 showed a broad peak in the range of 300–400 nm, and a strong peak at 345 nm after MIL-101 and MIL-101/PEG-FA loaded BER, indicating successful embedding of BER (Fig. 1H). Furthermore, we detected the ultraviolet absorbance of MIL-101, FA and MIL-101/PEG-FA to analysis whether FA was successfully modified on the surface of MIL-101. Fig. S5 showed that FA and MIL-101/PEG-FA had a strong peak at 283 nm, MIL-101 showed no peak.
In order to analyze the effect of modified PEG-FA on the release and pH responsiveness of MIL-101 loaded BER, the release of BER in MIL-101@BER and MIL-101@BER/PEG-FA was detected in PBS solutions (pH 7.4 and pH 5.0), respectively. As shown in Fig. 1I, the coating of PEG-FA on MIL-101 could prevent premature drug release. At pH 5.0, the release rate of MIL-101@BER was 7.08 % lower than that of MIL-101@BER/PEG-FA within 12 h, and the release rate of MIL-101@BER/PEG-FA reached a relative equilibrium state (70.22 %) in 96 h. The release rate of MIL-101@BER in PBS (pH 7.4 and pH 5.0) was 31.80 % and 54.35 %, respectively. The release amount of MIL-101@BER was higher than that of MIL-101@BER/PEG-FA (pH 7.4), which was related to the pH responsiveness of PEG-FA. The above results demonstrated the potential application value of MIL-101@BER/PEG-FA as a pH-responsive nanocarrier platform.
3.3 Cell experiments
3.3.1 Cytotoxicity and cellular uptake
The cytotoxicity of nanocarriers MIL-101 and MIL-101/PEG-FA in CAL27 and KB cells was evaluated by CCK-8 method. As shown in Fig. 2 (A, B, C and D), all nanocarriers in the concentration of 0–200 μg/mL, the survival rates of CAL27 and KB cells were above 80 % at 24 and 48 h, indicating that MIL-101/PEG-FA had good biocompatibility and low toxicity.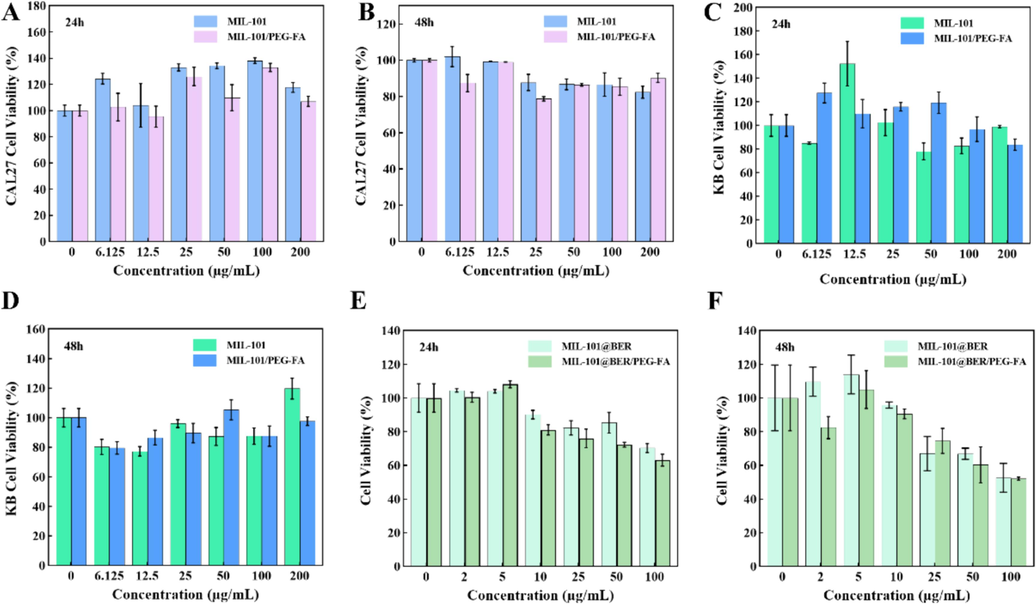
Cell viability of CAL27 and KB cells cultured with different concentrations of NPs for (A C) 24 h and (B D) 48 h. (E) and (F) Cell viability of CAL27 cells cultured with different concentrations of MIL-101@Ber and MIL-101@Ber/PEG-FA (24 and 48 h).
The anti-oral cancer effects of MIL-101@BER and MIL-101@BER/PEG-FA were examined. As shown in Fig. 2 (E and F), the activity of CAL27 was effectively inhibited in a concentration-dependent manner by MIL-101@BER and MIL-101@BER/PEG-FA, leading to a gradual decrease in the survival rate of CAL27 cells with increasing concentration. The cell survival rates of MIL-101@BER and MIL-101@BER/PEG-FA (100 μg/mL) were 70.30 % and 63.12 %, respectively, at 24 h; the survival rates decreased to 48.23 % and 38.94 %, respectively, at 48h. The anti-cancer efficacy of MIL-101@BER/PEG-FA was enhanced, attributed to its pH-responsive behavior that facilitated the expedited release of BER within the TME.
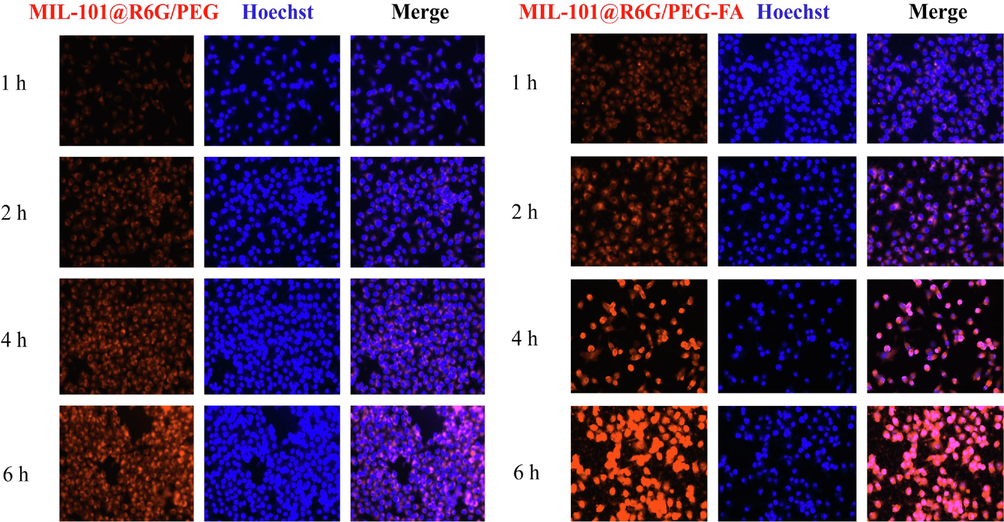
To investigate the targeting efficiency of MIL-101/PEG-FA as a nanocarrier, we substituted BER with the fluorescent probe “R6G” to assess the cellular uptake of MIL-101@R6G/PEG and MIL-101@R6G/PEG-FA in CAL27 and KB cells. As shown in Fig. 3 (A and B), the red fluorescence intensity in the cells of MIL-101@R6G/PEG and MIL-101@R6G/PEG-FA groups exhibited a time-dependent increase, indicating temporal dependence in the cellular uptake of the material by CAL27 and KB cells (Fig. S6). The intracellular red fluorescence intensity of MIL-101@R6G/PEG-FA group was significantly enhanced (P<0.05) compared to MIL-101@R6G/PEG, indicating the targeted effect of FA and its promotion on the uptake of MIL-101@R6G/PEG-FA by CAL27 and KB cells. Therefore, MIL-101/PEG-FA can serve as a promising targeted delivery system for OSCC treatment.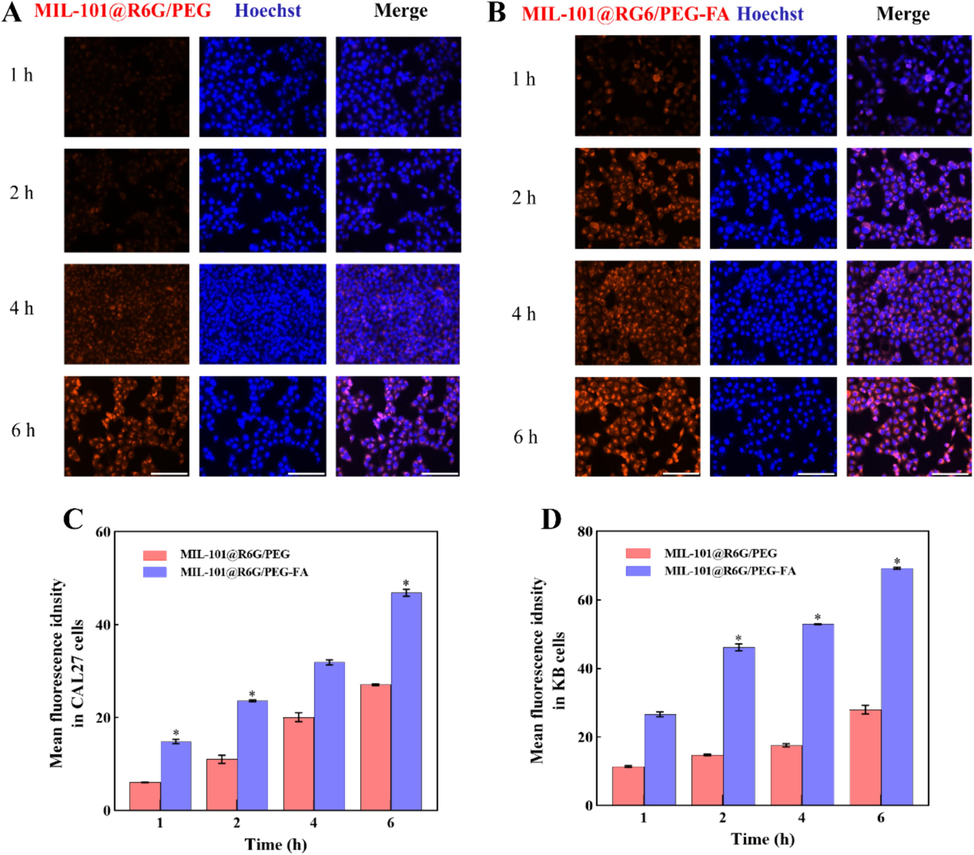
The cellular uptake of materials by CAL27 and KB cells. (A and B) Fluorescence images of CAL27 cells incubated with MIL-101@R6G/PEG and MIL-101@R6G/PEG-FA for 1, 2, 4, and 6 h. (C and D) Quantification of the mean fluorescence intensity of CAL27 and KB cells. (MIL-101@R6G/PEG vs. MIL-101@R6G/PEG-FA, *P<0.05). Scar bar = 100 μm.
3.3.2 MIL-101@BER/PEG-FA promoted oxidative damage
GSH is the most important antioxidant to maintain tumor redox homeostasis. Excessive GSH in the TME can scavenge ·OH, reduce the level of oxidative stress, and protect the antioxidant capacity of tumor cells. Therefore, consuming GSH to promote ·OH production, aggravate oxidative stress and promote apoptosis of tumor cells is an effective method for the treatment of tumors. As shown in Fig. 4A, after coculture with MIL-101@BER/PEG-FA, the intracellular abundance of GSH in the tumor microenvironment effectively reduced Fe3+ to Fe2+, leading to significant consumption of GSH. This synergistic effect surpassed that of MIL-101@BER and free BER (P<0.001). Meanwhile, Fe2+ mediated Fenton reaction can induce the generation of ROS and Fe3+.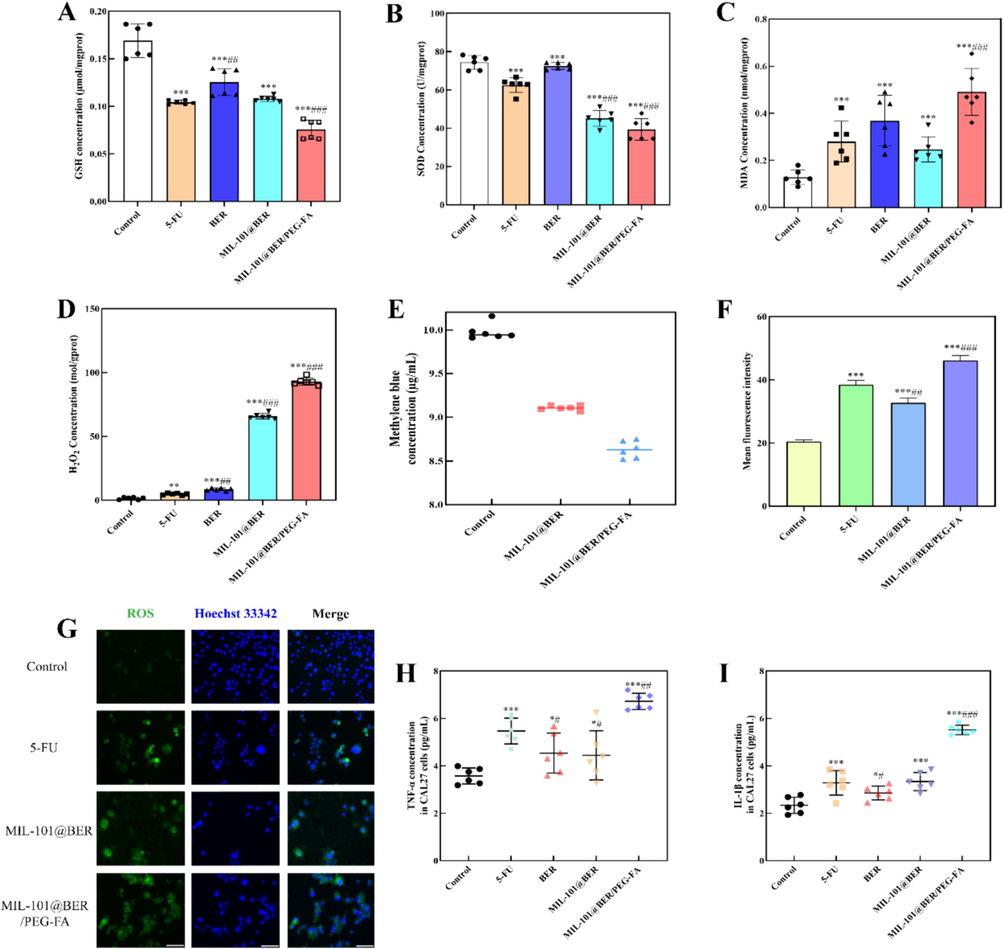
Oxidative stress indicators levels of CAL27 cells incubated with different groups. (A) GSH, (B) SOD, (C) MDA and (D) H2O2 levels of CAL27 cells. (E) The changes of MB concentration in MIL-101@BER and MIL-101@BER/PEG-FA. (F) and (G) ROS fluorescence image and average fluorescence degree. (H) and (I) TNF-α and IL-1β levels in CAL27 cells. Values are represented as mean ± standard ((Vs. Control, *P<0.05, **P<0.005, ***P<0.001, Vs. 5-FU, #P<0.05, ##P<0.005, ###P<0.001). Scar bar = 100 μm.
SOD can remove oxygen free radicals and reduce the damage caused by oxygen free radicals. As a biomarker for lipid peroxidation, MDA serves as an indicator of the extent of cellular damage caused by ROS. The cellular levels of SOD and MDA can serve as indirect indicators of in vivo oxygen free radical metabolism, enabling the assessment of cellular oxidative stress levels. It was observed a significant reduction of SOD in MIL-101@BER/PEG-FA-treated CAL27 cells (P<0.001) (Fig. 4B). Moreover, the content of lipid peroxidation index MDA was detected, the results showed that MIL-101@BER/PEG-FA promoted MDA accumulation with statistically significant differences (P<0.001) (Fig. 4C). The decreased concentration of SOD and the accumulation of MDA further exacerbated the intracellular oxidative imbalance.
H2O2, as the main component of ROS, has toxic effects on cells and can be used as the main target for tumor specific diagnosis and treatment·H2O2 concentration was significantly increased in CAL27 cells treated with 5-FU, BER, MIL-101@BER and MIL-101@BER/PEG-FA (P<0.05) (Fig. 4D), and MIL-101@BER/PEG-FA had the most significant effect, which effectively promoted the accumulation of H2O2, and Fe2+ converts H2O2 into more toxic ·OH. As shown in Fig. 4E, the concentration of MB in MIL-101@BER and MIL-101@BER/PEG-FA solution decreased by 8.97 % and 13.72 % respectively, which might be associated with the dissociation of Fe3+ from MIL-101 and subsequent reduction of Fe2+ facilitated by GSH. Thus, more ·OH was produced, which promoted the degradation of MB.
The TME exhibits a robust redox homeostasis, which, when disrupted, leads to tumor cell damage and apoptosis induction. Elevated levels of ROS in tumor tissues are essential for maintaining normal physiological processes. However, excessive ROS concentrations can disrupt redox homeostasis and facilitate tumor cell death (Kumari et al., 2018). MIL-101@BER/PEG-FA had effectively consumed high concentration of intracellular GSH, regulated SOD and MDA activities, promoted H2O2 production in CAL27 cells, and caused redox homeostasis imbalance. As shown in Fig. 4 (F, G), It was observed that co-culturing with MIL-101@BER/PEG-FA led to a significant and statistically meaningful increase in intracellular ROS levels (P<0.001). The production of ROS could also be promoted by MIL-101@BER; however, its impact was significantly inferior to that of MIL-101@BER/PEG-FA due to the absence of targeting and pH responsiveness. In the TME, MIL-101@BER/PEG-FA demonstrated pH responsiveness and targeting capabilities, thereby augmenting the therapeutic efficacy of BER. Therefore, we concluded that MIL-101@BER/PEG-FA consumed GSH and produced Fe2+ through the dissociated Fe3+, which down-regulated SOD level and induced the generation of peroxide product MDA. Fe2+ promoted the generation of ROS, significantly damaged the redox homeostasis in tumor cells, and greatly increased the level of intracellular oxidative stress, ultimately leading to tumor cell damage.
3.3.3 MIL-101@BER/PEG-FA promoted CAL27 cells inflammation
Oxidative stress is frequently accompanied by inflammatory response, which can potentiate the production and release of inflammatory cytokines through diverse mechanisms. ROS and lipid peroxides have the capacity to elicit the secretion of cytokines such as TNF-α and IL-1β (Park et al., 2010). TNF-α is a major inflammatory response factor, involved in a variety of immune and physiological processes, and is associated with inflammation, injury, apoptosis and tumor induction (Wang et al., 2019). IL-1β can be used as a cancer biomarker, and its expression has been shown to be up-regulated in a variety of malignant tumors (Arranz et al., 2017). Excessive inflammation leads to cell damage and tissue destruction. As shown in Fig. 4 (H; I), compared with the control group, the levels of intracellular inflammatory factors (TNF-α, IL-1β) were significantly increased in CAL27 cells treated with 5-FU, BER, MIL-101@BER and MIL-101@BER/PEG-FA (P<0.05). MIL-101@BER/PEG-FA induced the high level of intracellular oxidative stress, which promoted the secretion of inflammatory factors TNF-α and IL-1β (P<0.005), significantly increased the level of intracellular inflammation in CAL27, and aggravated the injury of tumor cells.
3.3.4 MIL-101@BER/PEG-FA aggravated mitochondrial damage
The mitochondria play a pivotal role in the generation of ROS, redox molecular metabolites, regulation of cellular signaling and apoptosis, as well as bioanabolism. Excessive ROS can damage DNA structure and cause mitochondrial dysfunction, thus inducing cell apoptosis (Xie et al., 2022). As a result, ROS-induced apoptosis is often accompanied by disruption of the linear membrane potential. High intracellular ROS levels can lead to oxidative stress, which can lead to mitochondrial damage. The normal growth of cancer cells is closely related to mitochondrial homeostasis, and the decrease of MMP means that the cell is about to die. We employed the JC-1 probe to localize within CAL27 cells for monitoring alterations in MMP under distinct treatments. Subsequently, a remarkable enhancement in green fluorescence was observed upon MMP reduction, facilitating the analysis of cellular mitochondrial damage. As shown in Fig. 5, after the co-incubation of 5-FU, BER, MIL-101@BER and MIL-101@BER/PEG-FA with CAL27 cells, the green fluorescence intensity increased, the intracellular red fluorescence intensity decreased. Consequently, the MMP underwent a reduction, leading to mitochondrial dysfunction. MIL-101@BER/PEG-FA effectively targeted CAL27 cells, facilitating the release of BER in the TME, which significantly exacerbated intracellular oxidative stress damage and induced mitochondrial dysfunction.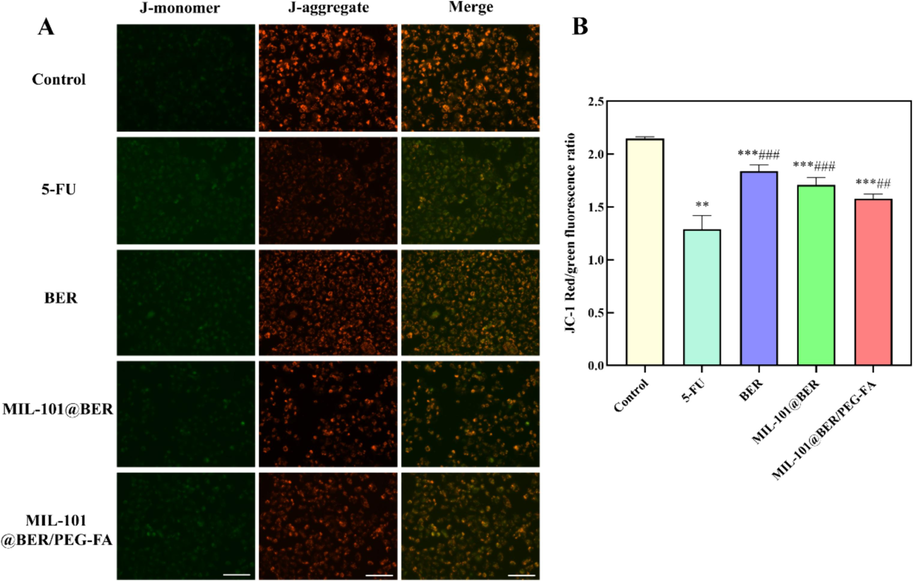
Effects of MIL-101@BER/PEG-FA on MMP of CAL27 cells. Values are represented as mean ± standard ((Vs. Control, *P<0.05, **P<0.005, ***P<0.001, Vs. 5-FU, #P<0.05, ##P<0.005, ###P<0.001). Scar bar = 100 μm.
3.3.5 MIL-101@BER/PEG-FA activated autophagy by regulating LKB1/AMPK pathway
To explore the mechanism of MIL-101@BER/PEG-FA in the treatment of OSCC, we detected the expressions of LKB1, AMPK, mTOR, ATG5, Beclin-1, Caspase 3 and Caspase 9 genes in CAL27 cells, and analyzed the role of LKB1/AMPK pathway in the treatment of OSCC. The LKB1/AMPK pathway plays a crucial role in the regulation of apoptosis and autophagy, with LKB1 promoting autophagy through AMPK activation (Park et al., 2023). Moreover, AMPK exerts its tumor-suppressive effects by enhancing the p53 pathway, inhibiting the mTOR pathway, and facilitating apoptosis among other mechanisms (Luo et al., 2005). The results demonstrated a significant upregulation of LKB1 and AMPK genes in CAL27 cells treated with 5-FU, BER, MIL-101@BER, and MIL-101@BER/PEG-FA (P<0.05) (Fig. 6). Additionally, the expression of mTOR gene was significantly inhibited (P<0.001), leading to an upregulation of autophagy-related genes (ATG5, Beclin-1) and apoptosis-related genes (Caspase 3, Caspase 9). Consequently, autophagy was activated to induce apoptosis in CAL27 cells. Meanwhile, it was evident that MIL-101@BER/PEG-FA effectively facilitated the targeted delivery of BER to CAL27 cells and augmented its anti-tumor efficacy by activating mitochondrial autophagy and inducing apoptosis in CAL27 cells through modulation of the LKB1/AMPK pathway.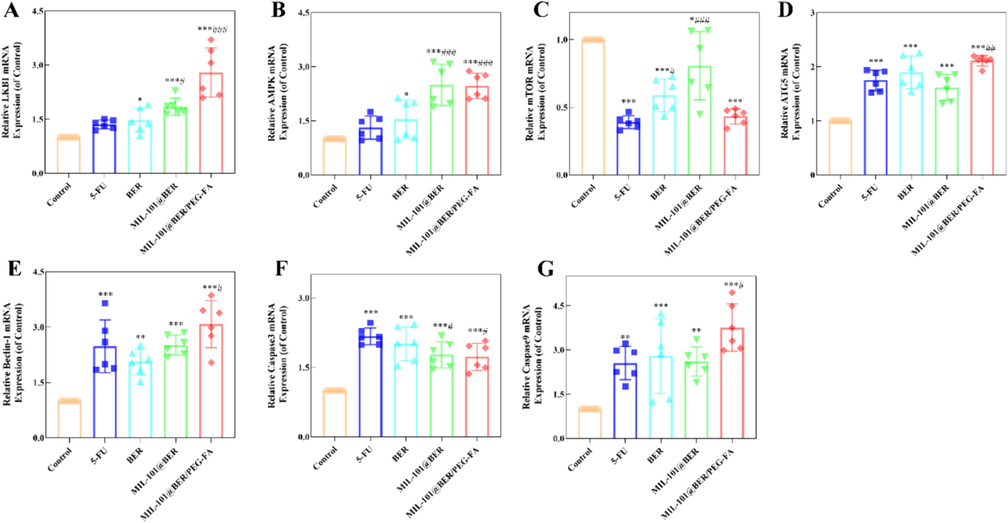
Analysis of LKB1/AMPK pathway in MIL-101@BER/PEG-FA-treated CAL27 cells. Values are represented as mean ± standard ((Vs. Control, *P<0.05, **P<0.005, ***P<0.001, Vs. 5-FU, #P<0.05, ##P<0.005, ###P<0.001).
3.3.6 Effect of MIL-101@BER/PEG-FA on apoptosis of CAL27 cells
To further evaluate the antitumor effect of MIL-101@BER/PEG-FA. We analyzed the killing effect of MIL-101@BER/PEG-FA on CAL27 cells using Calcein AM/PI staining to assess cell viability and mortality rates. In Fig. 7, after treating CAL27 cells with 5-FU, BER, MIL-101@BER, MIL-101@BER/PEG-FA, the intracellular red fluorescence intensity significantly increased, indicative of an augmented incidence of cellular deaths. MIL-101@BER/PEG-FA increased the concentration of BER in tumor cells and induced the expression of apoptosis-related genes Caspase 3 and Caspase 9. The increase of dead cells indicated that MIL-101@BER/PEG-FA promoted cells death.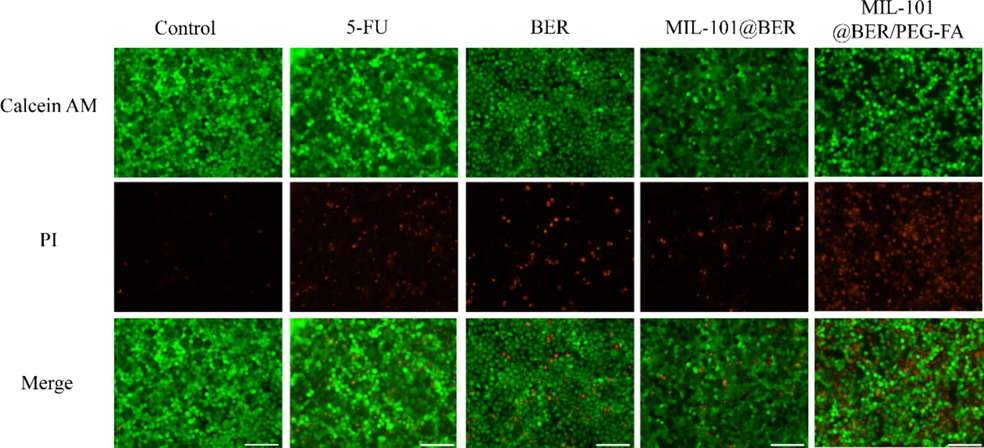
Calcein AM and propidium iodide (PI) staining of CAL27 cells in different groups. Scar bar = 100 μm.
3.4 Biocompatibility of MIL-101/PEG-FA
In order to further validate the in vitro biosafety of MIL-101/PEG-FA nanoparticles, we conducted a hemolysis test to assess their potential toxicity. As shown in Fig. 8, the hemolysis rates of MIL-101 and MIL-101/PEG-FA nanoparticles were detected in the concentration range of 25–1000 µg/mL. The hemolysis rates of 25 µg/mL were 0.59 % and 1.94 %, respectively. The hemolysis rates of 1000 µg/mL were 4.29 % and 4.83 %, respectively, and the hemolysis rates were less than 5 %. Therefore, MIL-101 and MIL-101/PEG-FA exhibited favorable biocompatibility, thereby establishing a solid foundation for subsequent animal experimentation.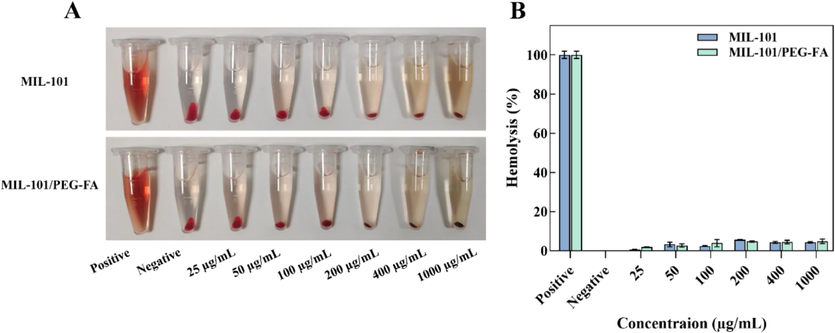
Hemolytic effects of MIL-101 and MIL-101/PEG-FA.
3.5 Antitumor efficacy assays in vivo
To evaluate the in vivo anti-tumor effect of MIL-101@BER/PEG-FA, we constructed CAL27 tumor-bearing mice. Nude mice were divided into three groups of PBS, BER, and MIL-101@BER/PEG-FA, and the drug was injected around the tumors. The treatment effect was shown in Fig. 9, after 10 days of treatment, the tumor volume was 537.57 mm3 in the control group. BER and MIL-101@BER/PEG-FA were effective in inhibiting the tumor growth as compared to the control group, with the tumor volume being 204.54 and 152.66 mm3, respectively. Meanwhile, the nude mice treated with MIL-101@BER/PEG-FA showed slow tumor growth and the strongest inhibitory effect, which further determined that FA was effectively targeted to promote the release of BER in the tumor tissues, thus achieving the anti-tumor effect.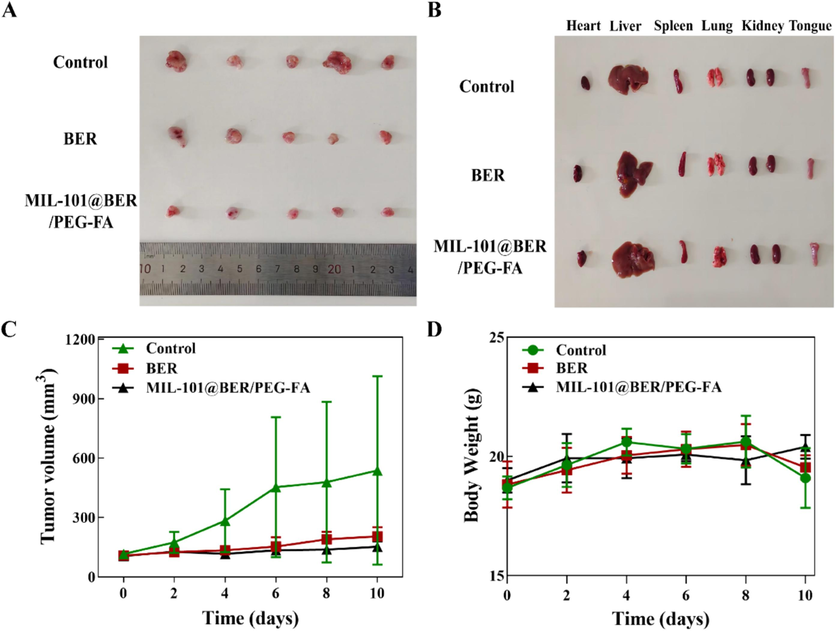
In vivo anticancer effect of the MIL-101@BER/PEG-FA in CAL27 tumor-bearing mice. (A) Tumor images of mice in control, BER, and MIL-101@BER/PEG-FA after 10 days of treatment. (B) Heart, liver, spleen, lungs, kidneys and tongue images of mice in control, BER, and MIL-101@BER/PEG-FA after 10 days of treatment. (C) Tumor growth curves in 10 days of treatment. (D) Changes of body weight of tumor-bearing mice during treatment.
4 Summary and discussion
In conclusion, we successfully constructed a MIL-101/PEG-FA loaded with BER to induce oxidative stress in OSCC cells. As a nanocarrier platform, MIL-101/PEG-FA achieved pH responsiveness, targeting, and good biocompatibility, which could accurately deliver BER to CAL27 cells to enhance the anti-tumor effect. In the TME, MIL-101@BER/PEG-FA was degraded, Fe3+ was reduced to Fe2+ under the high concentration of GSH, which promoted the conversion of H2O2 into more toxic ·OH to induce the generation of ROS and GSH depletion, controlled release of BER regulated the levels of SOD and MDA, further broke redox balance, thereby aggravating oxidative stress damage and inducing mitochondrial dysfunction of CAL27 cells. Meanwhile, MIL-101@BER/PEG-FA promoted the expression of inflammatory cytokines (IL-1β, TNF-α) which aggravated inflammation of CAL27 cells. In addition, the results of RT-PCR showed that MIL-101@BER/PEG-FA induced the activation of LKB1/AMPK pathway, up-regulated the levels of autophagy-related genes (ATG5, Beclin-1) and apoptosis-related genes (Caspase 3, Caspase 9) to activate mitochondrial autophagy, thereby inducing apoptosis of CAL27 cells. Therefore, we analyzed that MIL-101@BER/PEG-FA could induce apoptosis in CAL27 cells by exacerbating oxidative stress-induced damage, impairing mitochondrial function, and activating autophagy. Notably, we explored the antitumor activity of MIL-101@BER/PEG-FA, demonstrating pronounced efficacy in inhibiting tumor growth in CAL27-bearing mice.
CRediT authorship contribution statement
Mengyuan Li: Writing – original draft, Software, Methodology, Data curation, Conceptualization. Jingwen Yao: Methodology, Formal analysis. Jiaming Ge: Methodology, Formal analysis. Jinling Guo: Methodology. Lin Ma: Supervision. Zheng Li: Methodology. Xiangli Han: Data curation. Ming Liu: Software, Methodology. Fei Tian: Writing – review & editing, Software. Jing Zhao: Writing – review & editing, Supervision, Funding acquisition.
Acknowledgments
This work was supported by the National Natural Science Foundation of China [grant numbers 81973699, 82274361].
Declaration of competing interest
The authors declare that they have no known competing financial interests or personal relationships that could have appeared to influence the work reported in this paper.
References
- Interleukin-1β as emerging therapeutic target in hematological malignancies and potentially in their complications. Blood Rev.. 2017;31:306-317.
- [CrossRef] [Google Scholar]
- Oxidative stress and lipid peroxidation products in cancer progression and therapy. ISRN Oncol.. 2012;2012:137289
- [CrossRef] [Google Scholar]
- Amino modified metal-organic frameworks as pH-responsive nanoplatforms for safe delivery of camptothecin. J. Colloid Interface Sci.. 2019;541:163-174.
- [CrossRef] [Google Scholar]
- Construction of a multifunctional nano-scale metal-organic framework-based drug delivery system for targeted cancer therapy. Pharmaceutics. 2021;13:1945.
- [CrossRef] [Google Scholar]
- Recent trends in covalent and metal organic frameworks for biomedical applications. Nanomaterials (Basel).. 2018;8:916.
- [CrossRef] [Google Scholar]
- Chen, W., Zheng, R., Baade, P.D., (2016). Cancer statistics in China, 2015. CA: a cancer journal for clinicians 66(2), 115–132.
- Intelligent identification of cerebrospinal fluid for the diagnosis of Parkinson’s disease. Anal. Chem.. 2024;96:2534-2542.
- [CrossRef] [Google Scholar]
- Chemotherapy-associated oxidative stress: impact on chemotherapeutic effectiveness. Integr. Cancer Ther.. 2004;3:294-300.
- [CrossRef] [Google Scholar]
- Chemotherapy for oral and maxillofacial tumors: an update. Oral Maxillofac Surg Clin North Am.. 2014;26:163-169.
- [Google Scholar]
- Recent progress in nanoscale metal-organic frameworks for drug release and cancer therapy. Nanomedicine (Lond).. 2019;14:1343-1365.
- [CrossRef] [Google Scholar]
- Inflammation-targeted nanomedicines alleviate oxidative stress and reprogram macrophages polarization for myocardial infarction treatment. Adv. Sci (Weinh). 20242308910
- [CrossRef] [Google Scholar]
- Doxorubicin-loaded polymeric micelle overcomes multidrug resistance of cancer by double-targeting folate receptor and early endosomal pH. Small. 2008;4:2043-2050.
- [CrossRef] [Google Scholar]
- In vivo evaluation of doxorubicin- loaded polymeric micelles targeting folate receptors and early endosomal pH in drug-resistant ovarian cancer. Mol. Pharm.. 2009;6:1353-1362.
- [CrossRef] [Google Scholar]
- Reactive oxygen species: a key constituent in cancer survival. Biomark. Insights. 2018;13
- [CrossRef] [Google Scholar]
- Poly(L-histidine)-PEG block copolymer micelles and pH-induced destabilization. J. Control. Release. 2003;90:363-374.
- [CrossRef] [Google Scholar]
- Berberine regulates AMP-activated protein kinase signaling pathways and inhibits colon tumorigenesis in mice. Mol Carcinog.. 2015;54:1096-1109.
- [CrossRef] [Google Scholar]
- Embedding multiphoton active units within metal-organic frameworks for turning on high-order multiphoton excited fluorescence for bioimaging. Angew. Chem. Int. Ed.. 2022;61:e202206755
- [CrossRef] [Google Scholar]
- A tumor microenvironment-activated metal-organic framework-based nanoplatform for amplified oxidative stress-induced enhanced chemotherapy. J. Biol. Chem.. 2022;299:102742
- [CrossRef] [Google Scholar]
- Unlocking efficient high-order multiphoton-excited fluorescence of metal-organic framework via octupolar module in situ formation. Adv. Funct. Mater.. 2023;33:2305391
- [CrossRef] [Google Scholar]
- Dimeric oxyberberine CT4-1 targets LINC02331 to induce cytotoxicity and inhibit chemoresistance via suppressing Wnt/β-catenin signaling in hepatocellular carcinoma. Arch Toxicol.. 2023;97:1627-1647.
- [CrossRef] [Google Scholar]
- Brain glucose activated MRI contrast agent for early diagnosis of Alzheimer's disease. Anal. Chem.. 2022;94:16213-16221.
- [CrossRef] [Google Scholar]
- Berberine for gastric cancer prevention and treatment: multi-step actions on the Correa's cascade underlie its therapeutic effects. Pharmacol. Res.. 2022;184:106440
- [CrossRef] [Google Scholar]
- Facile synthesis of g-C3N4/amine-functionalized MIL-101(Fe) composites with efficient photocatalytic activities under visible light irradiation. J. Mater. Sci. Mater. Electron.. 2018;29:17591-17601.
- [CrossRef] [Google Scholar]
- Adsorption behavior and adsorption mechanism of glyphosate in water by amino-MIL-101(Fe) J. Phys. Chem. Solids.. 2022;161:110403
- [CrossRef] [Google Scholar]
- Targeting apoptosis pathways in cancer by Chinese medicine. Cancer Lett.. 2013;332:304-312.
- [Google Scholar]
- AMPK, the metabolic syndrome and cancer. Trends Pharmacol. Sci.. 2005;26
- [CrossRef] [Google Scholar]
- Classification of tongue cancer resection and treatment algorithm. J Surg Oncol.. 2018;117:1092-1099.
- [CrossRef] [Google Scholar]
- Targeted drug delivery via folate receptors in recurrent ovarian cancer: a review. Onco. Targets Ther.. 2014;7:1223-1236.
- [CrossRef] [Google Scholar]
- Nanoscale metal-organic frameworks for cancer immunotherapy. Acc. Chem. Res.. 2020;53:1739-1748.
- [CrossRef] [Google Scholar]
- Hydrogen-bonded organic frameworks chelated manganese for precise magnetic resonance imaging diagnosis of cancers. Nano. Lett.. 2023;23:8628-8636.
- [CrossRef] [Google Scholar]
- Oxidative stress and apoptosis: impact on cancer therapy. J. Pharm. Sci.. 2007;96:2181-2196.
- [CrossRef] [Google Scholar]
- Dietary and genetic obesity promote liver inflammation and tumorigenesis by enhancing IL-6 and TNF expression. Cell. 2010;140:197-208.
- [CrossRef] [Google Scholar]
- Redefining the role of AMPK in autophagy and the energy stress response. Nat. Commun.. 2023;14:2994.
- [CrossRef] [Google Scholar]
- A CRISPR screen identifies a pathway required for paraquat-induced cell death. Nat. Chem. Biol.. 2017;13:1274-1279.
- [CrossRef] [Google Scholar]
- Imine-linked covalent organic framework modulates oxidative stress in alzheimer's disease. ACS Appl. Mater. Interfaces.. 2023;15:4947-4958.
- [CrossRef] [Google Scholar]
- Magnetic resonance diagnosis of early triple-negative breast cancer based on the ionic covalent organic framework with high relaxivity and long retention time. Anal. Chem.. 2023;95:8267-8276.
- [CrossRef] [Google Scholar]
- Targeting cancer cells by ROS-mediated mechanisms: a radical therapeutic approach? Nat. Rev. Drug Discov.. 2009;8:579-591.
- [CrossRef] [Google Scholar]
- CD44 tagged hyaluronic acid-chitosan liposome carrier for the delivery of berberine and doxorubicin into lung cancer cells. Int. J. Biol. Macromol.. 2023;253:126599
- [CrossRef] [Google Scholar]
- PEGylation, successful approach to drug delivery. Drug Discov. Today. 2005;10:1451-1458.
- [CrossRef] [Google Scholar]
- Effects of jiedu hugan prescription on TLR3/TNF-α/JNK2 signaling pathway of drug-induced hepatotoxicity rats. Chin. J. Inf. Tradit. Chin. Med.. 2019;26:60-65.
- [CrossRef] [Google Scholar]
- Validating metal-organic framework nanoparticles for their nanosafety in diverse biomedical applications. Adv. Healthc. Mater.. 2017;6:1600818
- [CrossRef] [Google Scholar]
- Electron transfer between cytochrome c and microsomal monooxygenase generates reactive oxygen species that accelerates apoptosis. Redox. Biol.. 2022;53:102340
- [CrossRef] [Google Scholar]
- Multienzyme-mimic ultrafine alloyed nanoparticles in metal organic frameworks for enhanced chemodynamic therapy. Small. 2021;17:2005865
- [CrossRef] [Google Scholar]
- The effects of geography on survival in patients with oral cavity squamous cell carcinoma. Oral Oncol.. 2015;51:578-585.
- [CrossRef] [Google Scholar]
Appendix A
Supplementary data
Supplementary data to this article can be found online at https://doi.org/10.1016/j.arabjc.2024.105935.
Appendix A
Supplementary data
The following are the Supplementary data to this article: