

Translate this page into:
Pharmacokinetics and bioequivalence study of rhein as the main metabolite of diacerein
⁎Corresponding author. samahsabour@gmail.com (Samah Abdelsabour Mohammed)
-
Received: ,
Accepted: ,
This article was originally published by Elsevier and was migrated to Scientific Scholar after the change of Publisher.
Peer review under responsibility of King Saud University.
Abstract
A simple, rapid and fully-validated liquid chromatographic method (RP - HPLC) with fluorescence detection was developed for the analysis of rhein (as the main metabolite of diacerein) in human plasma. The separation was performed using an ODS C18 column with a mobile phase consisted of acetonitrile:methanol:phosphate buffer pH 6.8 and the flow rate was1.0 mL/min. The flourimetric detection was performed at 2 excitation wavelengths ʎex = 440 nm & 338 nm and one emission wavelength at ʎem = 520 nm. The developed method was validated according to Food and Drug administration (FDA) guidelines for bioanalytical method validation. The pharmacokinetic parameters of the test and the reference were determined and the analysis of variance (ANOVA) between parameters of the two brands was calculated. The relative bioavailability was found to be 89%. This method was successfully applied for the routine bioequivalence analysis of diacerein in plasma.
Keywords
Rhein
Diacerein
Bioequivalence
HPLC flourimetry

1 Introduction
Diacerein (DIA) is 4,5-Bis (acetyloxy)-9,10-dioxo-2 anthracenecarboxylic acid (Fig. 1). It is a novel anti-inflammatory drug used for the treatment of osteoarthritis (Toegel et al., 2007) and it is used for the treatment of rheumatoid arthritis when used in combination with other drugs (Nicolas et al., 1998). Diacerein is a di-acetylated derivative of rhein” a molecule with an anthraquinone ring which is actually the active metabolite of diacerein” (Tamura and Ohmori, 2001). It exerts its pharmacological action through its effect on prostaglandin through inhibition of interleukin-1 (IL-1) synthesis and release in vitro (Spencer and Wilde, 1997; Debord et al., 1994). It decreases IL-1 induced activities so shows a disease-modifying - effect in experimental models of osteoarthritis and in human subjects with finger joint and knee osteoarthritis (Verbruggen, 2006). Rhein (Fig. 2) was commonly determined in plasma by liquid chromatographic-tandem mass LC/MS/MS (Yi et al., 2006; Jiang et al., 2012; Layek et al., 2008). Some determinations of rhein were developed using reversed phase high performance liquid chromatography with ultraviolet detection RP-HPLC/UV (Chakrabarty et al., 2008; Yaroshenkoa et al., 2014; Ojha et al., 2009; Tang et al., 2007) these determinations required multi-steps preparation of plasma and time consumption. For bioequivalence studies, a short time of analysis and a simple plasma extraction method are required. The aim of the present work is to determine rhein in human plasma with high sensitive and simple analytical HPLC method with a new type of detection and to apply this method for a bioequivalence evaluation of the drug in two brands. Complete validation of the method was performed according to FDA requirements.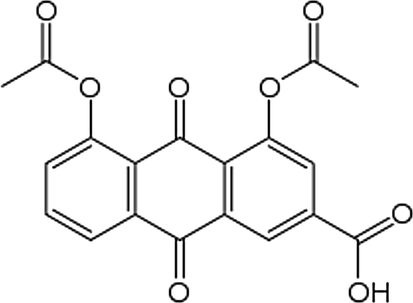
Chemical structure of diacerein.
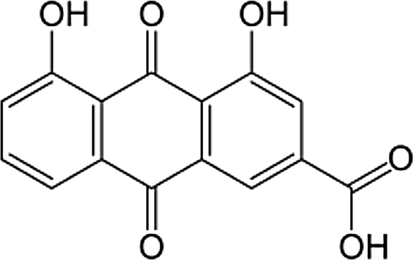
Chemical structure of rhein.
2 Experimental
2.1 Chemicals and reagents
Standards of rhein 99.56% and ranitidine 100.37% (as an internal standard IS) were purchased from Sigma-Aldrich (Steinheim, Germany), Acetonitrile and methanol (HPLC grade) were purchased from E. Merck (Darmstadt, Germany). Phosphoric acid was purchased from Sigma Aldrich (USA). Purified water (18.2 MΩ/ Cm) was processed using an ELGA Pure Lab Classic water polisher and deionizing unit (Marlow, UK). Blank human plasma was purchased from VACSERA (Giza, Egypt) and was stored frozen at −80 °C. All solvents of mobile phase were of HPLC grade and were filtered through 0.45 μm filters (HNWP membrane filters, Millipore).
2.2 Stock solutions
Stock solutions of rhein (500.00 µg/mL) and (IS) ranitidine (1.00 mg/mL) were prepared in methanol. Both solutions were stored at 2–8 °C.
2.3 Standards of the calibration curve and quality control (QC) samples
Standards of rhein and QC samples were prepared from its stock solution (500.00 µg/mL in methanol). Standards for the calibration curve were prepared in blank plasma at concentration range of 0.145–5.00 μg/mL. The three quality control samples (Q.C.) were at levels of (0.5, 2.00 and 4.00 µg/mL). Standards and QC samples were stored frozen at −80 °C with the clinical samples to be analyzed.
2.4 Sample preparation
600.00 µL of ranitidine standard solution was added to 200 µL rhein plasma solutions, homogenized by vortex for 15 min and centrifuged for 10 min at 12 × 103 rpm. Then, 100 µL of clear supernatant was injected into the HPLC apparatus after filtration. The peaks were detected by a fluorescence detector and were interpreted in the form of reported peaks areas. Responses of rhein referred to ranitidine were recorded.
2.5 Chromatographic condition
The separation was performed on an Agilent HPLC 1200 equipped with an autosampler and a fluorescence detector. 100 µL of the sample was injected on the system using an ODS C18 column 5 μm (4.6 mm i.d. × 150 mm) which was maintained at 35 °C. The mobile phase was acetonitrile:methanol:phosphate buffer pH 6.8 (20:10:70 v/v/v) and it was pumped with a flow rate of 1.0 mL/min. Rhein and IS were detected at two excitation wavelengths λex = 440 nm for rhein and 338 nm for IS and one emission wavelength at λem = 520 nm for both rhein and IS.
2.6 Method validation
The validity of the method was checked according to the items of FDA guidance for bio-analytical method validation (US Food and Drug Administration, 2018). The method was valid over the concentration range 0.145.00–5.00 µg/mL using six calibration standards. The analyte stability was tested using QC samples for multiple freeze-thaw cycles, on the bench at room temperature (short-term stability), or frozen at −80 °C (long-term stability). The extraction recovery of rhein was calculated by comparing the peak areas of the extracted plasma standards with the peak areas of rhein in the solvent at the corresponding concentrations. The method specificity was evaluated by screening six lots of blank human plasma.
2.7 Clinical study design
The study protocol was approved by The Institutional Ethics Committee (Modern science and art university, 6 October City, Egypt). The committee confirmed that the study was performed in accordance with the International Conference of Harmonization (ICH) guidelines (ICH, good clinical practice, 1996). 24 healthy subjects with a mean age group 18–45 years and average weight of 65.8 ± 6.1 kg were included in the study. Each Subject was given a single oral dose of 50 mg of diacerein (Osteorin 50 mg hard gelatin capsule (Medizen, Alex., Egypt)) and the reference capsules (Zondar 50 mg hard gelatin capsule (Mazalpharmaceutique, Quimper, France) under a fasting condition. The study was conducted as 12 × 2 single dose, randomized, open, and complete crossover design with one week washout period. Key exclusion criteria included; use of prescription or non-prescription drugs, vitamins, or dietary supplements within seven days or five half-lives (whichever was longer) before the first dose of study medication, except for acetaminophen at doses of ≤1 g/day; any clinically significant disease or drug allergies; febrile illness within five days before the first administration of study medication; sensitivity to heparin or heparin-induced thrombocytopenia; a positive test result for a drug of abuse; regular consumption of alcohol and excessive tobacco or nicotine use (equivalent to five cigarettes per day). Blood sample (5 mL) was collected at 0.00 h and 0.33, 0.66, 1.0, 1.33, 1.66, 2.0, 2.5, 3.0, 4.0, 6.0, 8.0, 10.0, 12.0 and 24.0 h of post drug administration. Samples were collected in 6 mL vacationer tubes (BD Diagnostics, Franklin Lakes, NJ) using heparin as an anticoagulant and were then centrifuged at 4500 rpm for 5 min. to separate the plasma. Plasma samples were transferred to 2 mL polypropylene cryogenic tubes (labeled retention sample and analysis, respectively) and immediately stored at −80 °C.
2.8 Pharmacokinetic and statistical analysis
Non compartmental pharmacokinetic analysis was performed using Kinitica version 5 software and the following pharmacokinetic parameters were calculated: maximum plasma concentration = Cmax, time to reach Cmax following drug administration = Tmax, area under the plasma concentration-time curve = AUC0−t, area under the plasma concentration-time curve from time 0 (administration) extrapolated to infinity = AUC0-inf, terminal elimination rate constant = Ke, and elimination half-life = t½.For the purpose of bioequivalence analysis AUC0-t, AUC0-∞ and Cmax were considered as primary variables. Bioequivalence of the two brands was assessed by means of an Analysis Of Variance (ANOVA) for crossover design and calculating 90% confidence interval of the ratio of test/reference using Ln-transformed data. The formulation was considered bioequivalent when the difference between two compared parameters was found statistically insignificant (p > 0.05) and confidence interval for these parameters fell within 80–125% (Guidance for Industry, 2001; Bolton and Bon, 2009).
3 Results and discussion
3.1 Method development
As the assay of drugs in human plasma is an important issue for bioequivalence studies, a simple procedure based on direct protein precipitation was applied for the determination of rhein in human plasma. Many solvent mixtures were tested for extraction of rhein from plasma by precipitation, such as acetonitrile, diethyl ether- chloromethane (4:1), ethyl acetate and methanol. All were evaluated for recovery and sample clean up. The higher percent of extracted rhein from plasma was obtained by using methanol which avoids the use of chlorinated alkane or other toxic irritant compounds as in the previously reported methods “tetra butyl ethyl ether (Yaroshenkoa et al., 2014), ethyl acetate (Ojha et al., 2009) diethyl ether (Tang et al., 2007)”. To decrease the steps of plasma preparation, the stock solution of the IS in methanol was used as the extraction solvent. Ranitidine was chosen as an IS because it has the same emission wavelength as rhein (λem = 520 nm) but with different excitation wavelength (λ ex = 440 nm for rhein) and (λex = 338 nm for ranitidine). 600 µL of the IS solution (1 mg/mL ranitidine dissolved in precipitating solvent “methanol”) was added to 200 µL plasma, homogenized by vortex for 15 min and centrifuged for 10 min at 12 × 103 rpm. Then, 100 µL of clear supernatant was injected into the HPLC system.
3.2 Chromatographic condition
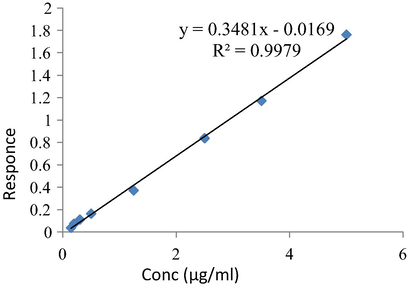
Separation of ionizable analytes such as acids and bases depends on the pH of the mobile phase and the used chromatographic condition. To optimize the efficiency of the proposed HPLC method, the effects of several chromatographic parameters were investigated. These included the type of organic modifier, the concentration, and pH of the buffer and the organic modifier-buffer ratio. These parameters were optimized based on the peak shape, peak intensity/area, peak resolution and retention times for the analytes on the ODS C18 (150 × 4.6 mm, 5 µm) column. The best resolution between rhein and IS was obtained by using a mobile phase consisted of acetonitrile:methanol:0.05 M phosphate buffer (pH 6.8 adjusted with dilute orthophosphoric acid) in the ratio of 20:10:70 v/v/v, respectively. The mobile phase was pumped at a flow rate 1.0 mL/min. Fluorescence rather than UV detection of rhein was chosen to increase the sensitivity of rhein during the separation. [λex = 440 nm, for rhein and λex = 338 nm for ranitidine] and (λem = 550 nm for both rhein and IS), as shown in the chromatogram, Fig. 3. The choice of this way of detection is the first applied in the research field. The main achievement for this application is the chance for the use of many internal standards having the same emission or excitation as the analyte substance. The elution was at retention times of 4.7 min and 1.8 min for rhein and IS respectively and the total run time was 5.50 min. This short run time is considered as an advantage of this method over all previously reported HPLC-UV methods (run time = 12 min) (Chakrabarty et al., 2008), 8 min (Yaroshenkoa et al., 2014; Tang et al., 2007) 20 min (Ojha et al., 2009). The analytical method was validated according to FDA guidelines for bio-analytical method validation (Guidance of industry, 2018). This is considered as an advantage of the developed method over all reported HPLC methods as that all items of bio-analytical method validation were not covered by the periviously reported methods (Chakrabarty et al., 2008; Yaroshenkoa et al., 2014; Ojha et al., 2009; Tang et al., 2007). The plotting of Peak area versus concentration of rhein was linear over the concentration range of 0.146–5.00 µg/mL (r2 = 0.9979), Fig. 4.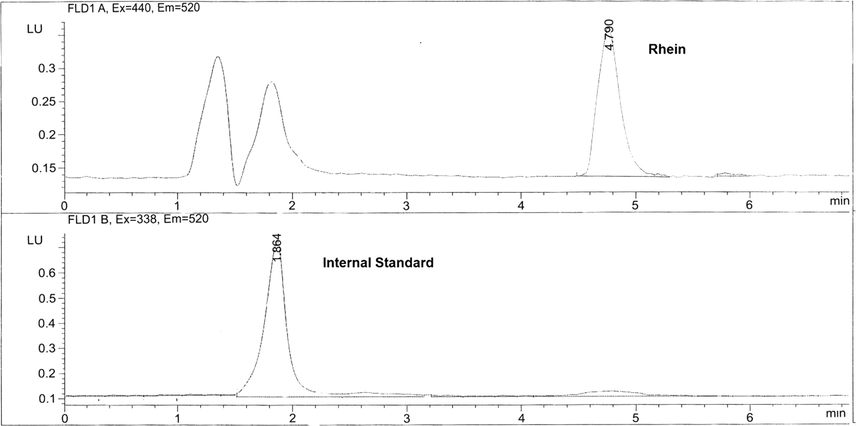
Chromatogram of separation of rhein and IS in human plasma.
Calibration curve of rhein in plasma.
3.3 Method validation
3.3.1 System suitability
All items of system suitability parameters as resolution, tailing factors and number of theoretical plates were tested and the data of system suitability are shown in Table 1. (IS) internal standard. N = Number of theoretical plates. K′ = Capacity factor.
Item
Ranitidine (IS)
Rhein
N
10,454
42,896
K′
10.57
12.99
Tailing factor (T)
0.89
1.05
% of RSD of 6 injections
0.605
0.879
3.3.2 Linearity
The calibration curve was linear over the concentration range of 0.145–5.00 μg/mL with a correlation coefficient (r) consistently ≥0.997. The slope of the calibration curve was 0.3481, Fig. 4.
3.3.3 The lower limit of quantification
The lower limit of quantification (LLOQ) was found to be 0.145 μg/mL. It is lower than that of the reported HPLC method (Chakrabarty et al., 2008).
3.3.4 Accuracy and precision
The accuracy and the intra- and inter-assay precision of the low quality control (LQC), medium quality control (MQC) and high quality control (HQC) sample concentrations are shown in Tables 2 and 3. All the results are within the acceptance criteria. The intra- and inter-day precision were ≤4.00% RSD at the HQC and ≤3.7% RSD for all the QC sample concentrations. (Guidance of industry, 2018).
Conc. of rhein (µg/mL)
Mean
SD
C.V.%
Accuracy%
0.145
0.153
0.004
2.847
105.517
0.2
0.221
0.004
1.526
110.5
0.3
0.32
0.022
5.909
106.667
0.5
0.529
0.037
7.061
105.8
1.25
1.212
0.026
2.314
96.96
2.5
2.452
0.013
0.517
98.08
3.5
3.413
0.013
0.366
97.5143
5
5.056
0.129
2.55
101.12
4
3.862
0.089
2.291
96.55
Intraday precision of rhein
LQC
MQC
HQC
Mean recovery
0.46
2.20
3.94
SD
0.03
0.08
0.095
RSD%
1.94
3.76
2.432
Mean Recovery%
92.0
110.00
98.60
Interday precision of rhein
LQC
MQC
HQC
Mean recovery
0.56
2.29
3.8193
SD
0.012
0.096
0.153
RSD%
2.056
3.7
4.008
Mean recovery%
113.00
114.50
95.48
3.3.5 Selectivity
Fig. 5 depicts chromatograms showing (a) spiked plasma extract containing rhein (5 μg/mL) and the IS; (b) blank plasma extract containing IS; (c) plasma extract of a healthy human volunteer 2.5 h after a single oral dose of 50 mg diacerein. There was no co-eluting interference in the plasma sample drawn from a healthy human volunteer.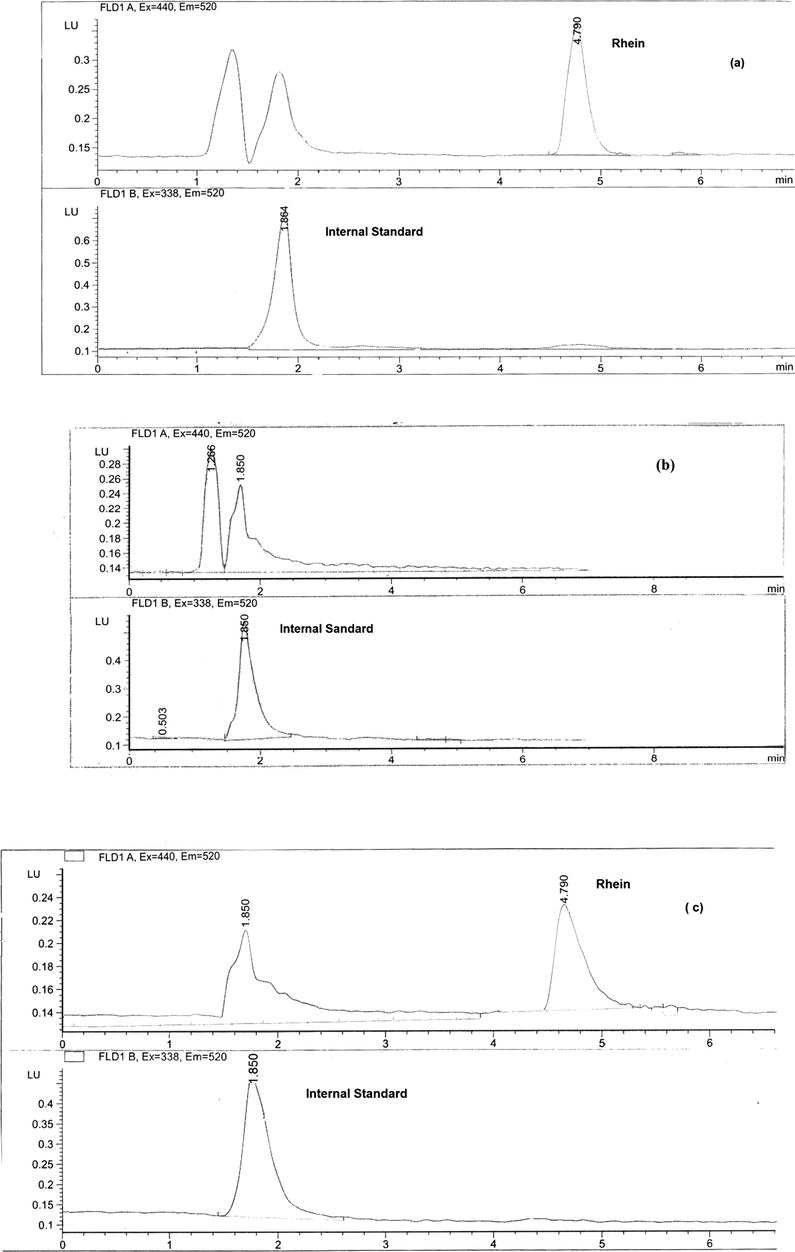
Chromatograms of (a) spiked plasma extract containing rhein (5 μg/ml) and the IS; (b) blank plasma extract with the internal standard; (c) plasma extract of a healthy human volunteer 2.5 h after a single oral dose of 50 mg diacerein with internal standard.
3.3.6 Recovery
Extraction efficiencies of rhein from plasma were 108.98 ± 8.18%, 99.71 ± 4.39% and 87.41 ± 4.33% at the low, medium and high QC sample concentrations, respectively. Table 4.
Absolute Recovery (%)
SD
RSD%
LQC
108.98
8.92
8.18
MQC
99.71
4.38
4.39
HQC
87.41
3.78
4.33
3.3.7 Stability
The stability of the stored plasma samples at low and high QC concentrations are shown in Table 5. The results are all acceptable according to the acceptance criteria.
Sample no.
HQC (4.00 mcg/mL)
LQC (0.50 mcg/mL)
Initial
24 h at room temp.
Initial
24 h at room temp.
Mean
3.562
3.569
0.450
0.428
SD
0.047
0.067
0.029
0.026
CV%
1.314
1.871
6.540
6.063
Accuracy%
89.049
89.225
90.056
85.564
Stability%
100.20
95.011
The analyte stability was determined after three freeze and thaw cycles. Three aliquots of each LQC and HQC sample were stored at −80 °C for 24 h and thawed unassisted at room temperature. When completely thawed, the samples were reforozen for 24 h under the same conditions. Three freeze and thaw cycles were repeated. The obtained results were presented in Tables 6 and 7.
Analytical concentration (0.500 µg/mL) rhein (LQC)
Replicates (N = 3)
Average conc. measured (µg/mL)
Recovery (%)
(1)
(2)
(3)
Zero time
0.58
0.61
0.61
0.60
Cycle one
0.56
0.56
0.61
0.58
96.52
Cycle two
0.56
0.54
0.53
0.54
90.37
Cycle three
0.56
0.54
0.53
0.55
90.86
Analytical concentration (4.00 µg/mL) rhein (HQC)
Replicates (N = 3)
Average conc. measured (µg/mL)
Recovery (%)
(1)
(2)
(3)
Zero time
3.79
3.66
3.64
3.70
Cycle one
3.79
3.66
3.64
3.70
95.79
Cycle two
3.95
4.08
4.06
4.03
104.43
Cycle three
3.73
3.73
3.73
3.73
96.74
3.4 Application of bioequivalence study
The importance of the bioequivalence study is to ensure that generic formulations are safe and effective. The two formulations of the drug are considered bioequivalent when the rate and extent to which the active drug becomes available at the site of drug action are equivalents (Chow and Liu, 1992).
The plasma concentration-time profile of rhein from 24 healthy human volunteers under fasting condition is shown in Fig. 6 The maximum peak concentration Cmax of both brands, the time it was attained to reach Tmax, the time the drug was detectable MRT and other pharmacokinetic parameters of rhein for the two brands of diacerein are shown in Table 8. AUC0-t, AUC0-∞, are important parameters for bioequivalence estimation (Grahnen, 1984), however, Cmax and Tmax are important for the determination of therapeutic behavior of the drug (Westlake, 1988). The relative bioavailabilty of rhein on the basis of the reference was 89%. The statistical comparison for both mean and standard deviation of AUC0-t, AUC0-∞and Cmax of the two brands did not show significant different. There was no significant difference between the results after the application of analysis of variance (ANOVA) test for these two parameters (AUC and Cmax). ANOVA was applied after log-transformation of the data, with a p value greater than 0.5 and 90% confidence intervals. The ANOVA results showed that the ratios of AUC0-t, AUC0-∞ and Cmax of the two brands are within the acceptable range of “80–125%”, Table 9.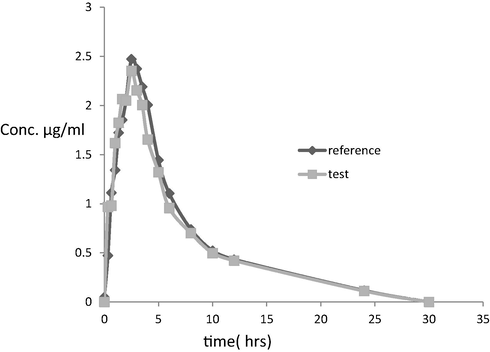
Plasma concentration–time profile after a single oral dose of 50 mg of diacerein (Osteorin 50 mg hard gelatin capsule) and the reference capsules (Zondar 50 mg Hard gelatin capsule) to a 24 healthy human volunteer, in the fasting state.
Pharmacokinetic parameters
Zondar 50 mg hard gelatin capsule (reference)
Osteorin 50 mg hard gelatin capsule (test)
Cmax
2.928 ± 0.638
3.084 ± 0.745
*Tmax
2.5 ± 0.689*
2.25 ± 1.054
AUC0–t
17.909 ± 5.496
15.859 ± 3.862
AUC0–∞
14.525 ± 4.091
13.364 ± 3.744
T1/2
4.038 ± 2.023
4.409 ± 1.971
Kel
0.204 ± 0.078
0.185 ± 0.069
MRT
7.246 ± 3.644
6.831 ± 2.348
AUC0–t
AUC0–∞
Cmax
AVOVA (p-value)
0.354878
0.226654
0.482307
4 Conclusion
A relatively simple, accurate, precise and rapid method suitable for the use in bioequivalence studies to determine rhein as the immediate metabolite of diacerein in plasma was developed and validated. This method has several advantages compared to previously reported methods, such as extraction of rhein by direct precipitation of protein plasma and the use of IS dissolved in the same precipitating solvent “methanol” which decreases the steps of the extraction. A short run time of about 5.50 min “rhein (4.7 min) and IS (1.8 min)” was achieved compared to previously reported run times, the current relatively short run time has the advantage of facilitating and enhancing the efficiency of processing large numbers of plasma samples obtained from pharmacokinetics/bioavailability/bioequivalence studies in healthy human subjects. The use of the fluorescence detection of the drug and IS using the same emission wavelength and different excitation wavelengths was applied for the first time in this work. This type of measurement allows the use of many other different and cheaper IS which decrease the overall cost of the bioequivalence study.
References
- Bolton, S. and Bon C. (Eds.), 2009. Experimental design in clinical trial. Pharmaceutical Statistics Practical and Clinical Applications, vol. 80, fifth ed. Marcel Dekker Inc., New York, pp. 384–443.
- Arzneimittelforschung. 2008;58(8):405-409.
- Design and Analysis of Bioavailability and Bioequivalence Studies. New York: Marcel Dekker; 1992.
- Eur. J. Drug Metab. Pharmacokin.. 1994;19(1):13-19.
- Bioanlytical Method Validation. Rockville, Maryland: U.S. Department of Health and Human Services. Food and Drug Administration, Center for Drug Evaluation and Research, CDER; 2018.
- Statistical Approaches in Establishing Bioequivalence. Rockville, Maryland: U.S. Department of Health and Human Services. Food and Drug Administration, Center for Drug Evaluation and Research, CDER; 2001.
- ICH harmonised tripartite guideline, good clinical practice, (E6)R1, 1996, US.
- J. Pharmac. Biomed. Anal.. 2012;57(5):19-25.
- Biomed. Chromatogr.. 2008;22:616-624.
- Clin. Pharmacokin.. 1998;35:347-359.
- J. Chromatogr. B. 2009;877(11–12):1145-1148.
- Jpn. J. Pharmacol.. 2001;85:101-104.
- Biomed. Chromatogr.. 2007;21:1186-1190.
- BMC Mol. Biol.. 2007;8 -2199-8-13.1471-2199
- US Food and Drug Administration, 2018. Guidance for Industry: Bioanalytical Method Validation (last accessed on 02/11/2008).
- Rheumatology (Oxford). 2006;45(2):129-138.
- Bioavailability and bioequivalence of pharmaceutical formulations. In: Peace K.E., ed. Biopharmaceutical Statistics for Drug Development. New York: Marcel Dekker; 1988. p. :329-352.
- [Google Scholar]
- J. Anal. Chem.. 2014;69(8):793-799.
- J. Chromat.. 2006;1:50-55.


