

Translate this page into:
Pharmacophore model-aided virtual screening combined with comparative molecular docking and molecular dynamics for identification of marine natural products as SARS-CoV-2 papain-like protease inhibitors
⁎Corresponding author. nchellappan@jazanu.edu.sa (Neelaveni Thangavel)
-
Received: ,
Accepted: ,
This article was originally published by Elsevier and was migrated to Scientific Scholar after the change of Publisher.
Peer review under responsibility of King Saud University.
Abstract
Targeting SARS-CoV-2 papain-like protease using inhibitors is a suitable approach for inhibition of virus replication and dysregulation of host anti-viral immunity. Engaging all five binding sites far from the catalytic site of PLpro is essential for developing a potent inhibitor. We developed and validated a structure-based pharmacophore model with 9 features of a potent PLpro inhibitor. The pharmacophore model-aided virtual screening of the comprehensive marine natural product database predicted 66 initial hits. This hit library was downsized by filtration through a molecular weight filter of ≤ 500 g/mol. The 50 resultant hits were screened by comparative molecular docking using AutoDock and AutoDock Vina. Comparative molecular docking enables benchmarking docking and relieves the disparities in the search and scoring functions of docking engines. Both docking engines retrieved 3 same compounds at different positions in the top 1 % rank, hence consensus scoring was applied, through which CMNPD28766, aspergillipeptide F emerged as the best PLpro inhibitor. Aspergillipeptide F topped the 50-hit library with a pharmacophore-fit score of 75.916. Favorable binding interactions were predicted between aspergillipeptide F and PLpro similar to the native ligand XR8-24. Aspergillipeptide F was able to engage all the 5 binding sites including the newly discovered BL2 groove, site V. Molecular dynamics for quantification of Cα-atom movements of PLpro after ligand binding indicated that it exhibits highly correlated domain movements contributing to the low free energy of binding and a stable conformation. Thus, aspergillipeptide F is a promising candidate for pharmaceutical and clinical development as a potent SARS-CoV-2 PLpro inhibitor.
Keywords
Consensus scoring
Marine natural products
Molecular docking
Molecular dynamics
Pharmacophore model
SARS-CoV-2 PLpro

- CMNPD
-
comprehensive marine natural product database
- DCCM
-
dynamic cross-correlation matrix
- H
-
hydrophobic
- HBA
-
hydrogen bond acceptor
- HBD
-
hydrogen bond donor
- MD
-
molecular dynamics
- MMGBSA
-
molecular mechanics generalized Born and surface area continuum solvation
- MW
-
molecular weight
- ns
-
nanoseconds
- PI
-
positive ionization
- PCA
-
principal component analysis
- PLpro
-
SARS-CoV-2 papain-like protease
- ps
-
picoseconds
- TG
-
Total gain
Abbreviations
1 Introduction
Ensemble of steric and electronic characteristics of a ligand that encodes for optimal binding to a specific macromolecular target is known as the pharmacophore model. Pharmacophore modeling is a robust technique that enables the virtual screening of huge compound libraries by applying the unique pharmacophore model as the filter to identify hits against a target under investigation. Structure-dependent pharmacophore models require a 3D structure of a ligand-bound macromolecular target for extraction of essential chemical features of the ligand, based on interaction points on the target (Muhammed and Esin, 2021). The pharmacophore model can be represented in a 3D or 2D fashion. A typical 3D pharmacophore model illustrates the ligand’s functional groups or atoms patterns for molecular perception as spheres with varying radii and colours. The sphere’s radii show the degree of deviation of the steric or electronic feature in the generated pharmacophore model from the native position (Gaurav et al., 2014). Different pharmacophore modeling software uses different colours and feature templates for chemical characteristics influencing ligand binding like hydrogen bond acceptor and donor, positive and negative ion centre, and hydrophobic rings, or groups. The 2D models are simple and easy to interpret as they exemplify the ligand pharmacophoric features using letter codes like HBD, HBA, H, and PI for hydrogen bond donor, hydrogen bond acceptor, hydrophobic, or aromatic ring contacts, and positive ionization contact, respectively (Qing et al., 2014). Virtual screening facilitated by a pharmacophore modeling approach results in a minimum number of hits from a large data of compounds which reduces the work up in the sequential molecular docking phase (Prachayasittikul et al., 2015). Moreover, as the hits bear required pharmacophoric features for the best possible interaction with the chosen target, the lead identification process is expected to have an enhanced success rate.
Authentic data sources like protein data bank (PDB) for 3D structures of biological macromolecules with bound bioactive enrich the process of pharmacophore model generation. Freely accessible compound libraries like DrugBank, PubChem, ChEMBL, and ZINC permit data mining and high-throughput virtual screening in the drug discovery process (Kaserer et al., 2015). The Comprehensive Marine Natural Product Database (CMNPD) is one such publicly available data source for harnessing the goodness of the natural products of marine origin (Lyu et al., 2021). This database supplies 3D structures of natural compounds of marine origin and enables query-based search for data mining. It also provides the available bioactive conformations, physico-chemical properties, ADMETox characteristics, and biological activity data of the compounds present in the dataset.
SARS-CoV-2 spread has been curtailed by vaccines and to date, no new drug is approved for clinical use. Extensive research is necessary to invent a broad range of small molecules targeting different phases in the lifecycle of the coronavirus. It is important to be prepared with prospective ligands that bind to different coronavirus targets to combat future pandemics. SARS-CoV-2 papain-like protease (PLpro) is a proteolytic enzyme that breakdown two polyproteins namely Pp1a and Pp1b into non-structural proteins, which interacts with host cellular components supporting virus replication. PLpro also interferes with host immunity due to its deubiquitinating property. PLpro elicits a deubiquitinating activity by deletion of ubiquitin and other related ubiquitins, especially the ISG15 from host proteins. Removal of ubiquitin and its related molecules from host proteins dysregulates the anti-viral defence and interferon-mediated inflammatory, immune responses. PLpro inhibition is critical to inhibiting coronavirus replication and improving host immunity. Recent research has shed light on ligand’s structural requirements for exhibiting potent SARS-CoV-2 PLpro inhibition by binding to multiple binding sites including a newly identified binding groove (Shen et al., 2022). Therefore, we aimed to develop a receptor structure-based pharmacophore model that encodes for potent SARS-CoV-2 PLpro inhibition and to apply the developed model for virtual screening of marine natural product database for identification of hits. The identified hits were subjected to comparative molecular docking, a benchmarking procedure for docking. To improve the docking results and active compound selection, consensus scoring was employed. We also predicted the inhibitor interactions and stability of the best inhibitor in complex with SARS-CoV-2 PLpro (will be referred to as PLpro) by binding interaction analysis and molecular dynamics (MD) study, respectively.
2 Material and methods
Structure-based pharmacophore modeling, virtual screening, comparative molecular docking, and molecular dynamics simulation studies were applied in sequence to predict hit compounds from CMNPD. The scheme of work is illustrated in Fig. 1.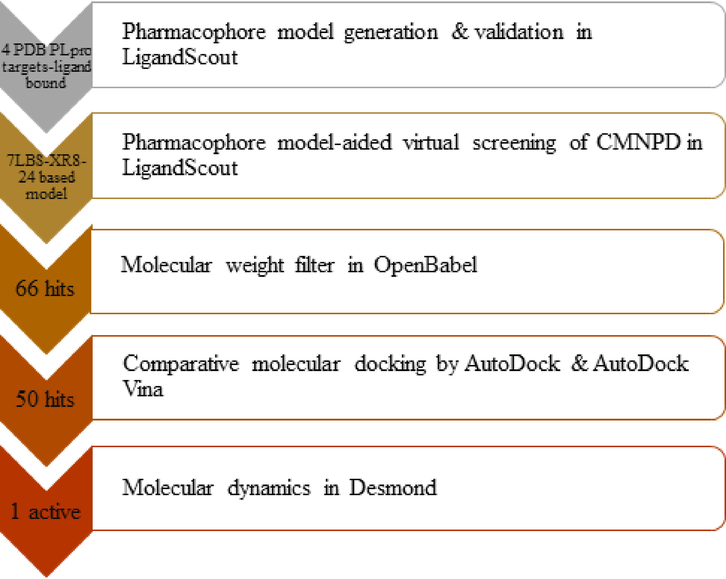
Scheme of work.
2.1 Pharmacophore-aided virtual screening
2.1.1 Pharmacophore model generation
The main goal of the study was to generate a receptor structure-based pharmacophore model depicting the characteristic steric and electronic features of ligands, facilitating their binding to multiple binding sites on PLpro. Hence, we chose the recently reported 3D X-ray crystalline structures of PLpro receptor bound to potent inhibitors available in PDB ( https://www.rcsb.org). The PDB IDs of 3D structures of PLpro are: 7LBS (native ligand: XR8-24), 7LOS (native ligand: XR8-65), 7LLZ (native ligand: XR8-69), and 7LLF (native ligand: XR8-83) (Shen et al., 2022). These PDB structures were directly fetched into LigandScout 4.4.8. software using their codes (Wolber & Langer, 2005). LigandScout can be accessed through a valid license on Inte: Ligand [http:// www.inteligand.com/ligandscout/download.shtml]. All four receptor-ligand structures were visualized in structure-based modeling perspective mode, checked for missing atoms in the ligand structures, and four pharmacophore models were generated individually. To select a suitable pharmacophore model for virtual screening, all 4 models were evaluated against a set of known actives derived from literature (Shen et al., 2022). Known active compounds were carefully chosen based on their experimentally determined PLpro inhibition constant (IC50) ranging from 0.1 to 5.7 μM provided possess structural characteristics necessary for exhibiting multiple binding site modalities. Pharmacophore models were evaluated against the actives using the screen pharmacophore mode under the structure-based perspective. During the process, every model was optimized manually by varying the degree of tolerance of pharmacophoric features under consideration. We varied the features by increasing or decreasing the tolerance, and weightage, adding or excluding exclusion volume spheres, and omitting a minimum number of features to increase the sensitivity of the models (Opo et al., 2021). The optimum pharmacophore model is the one that identified maximum hits among the actives, which was considered for further study (Luo et al., 2021).
2.1.2 Pharmacophore model validation
The pharmacophore model obtained by optimization in Section 2.1.1 has to be validated by evaluation of its ability to distinguish active compounds from decoys (Temml et al., 2017). The structures of 23 known actives identified from the literature were drawn in ChemDraw Ultra 10.0 and the smiles were copied to OpenBabelGUI ( https://openbabel.org/wiki/OpenBabelGUI) to convert into a single sdf file of actives (O’Boyle et al., 2013). Decoys for PLpro are available in the DEKOIS.2.0 database (Bauer et al., 2013). These property-matched decoys were recently generated and validated for PLpro binding (Ibrahim et al., 2020). The decoy set consisted of 720 compounds in a single sdf file prepared for screening. Actives and decoys sets were processed to ldb (library in local database) files in LigandScout using create screening database module, which is the only accepted format by the software. Actives and decoys sets were loaded in the ldb formats. The 7LBS model was optimized for sensitivity by increasing the tolerance of positive ionizable area, two of the hydrophobic interactions of alkyl groups to 0.3 Å, and decreasing the tolerance of hydrogen bond donor and acceptor features to 0.3 Å. Exclusion volume spheres were also added. The optimized pharmacophore model was copied to the screening perspective. The pharmacophore-fit score was set as the scoring function, match all query features was the screening mode, get the best matching conformation was the retrieval mode, and maximum number of omitted features was 2. Boolean expression was set to choose the optimized pharmacophore model depicted as {1} and the screening was initiated. After the run, results were analyzed in LigandScout by retrieving the receiver operating characteristic curve (ROC) constructed based on the ratio of actives and decoys identified by the pharmacophore model. The area under the curve (ROC-AUC) is used to estimate the detecting power of the model A pharmacophore model is said to be valid if it exhibits an AUC > 0.5 and will have excellent detective capacity if it is near 1. Early enrichment factors (EF) at 1, 5, 10, and 100 % also reveal the early detection of actives and support model validation (Kirchmair et al., 2008).
2.1.3 Pharmacophore model aided virtual screening
The CMNPD facilitates the download of chemical structures in sdf format ( https://www.cmnpd.org/). The entire database is available for download and all compounds were downloaded. The sdf file contained 47,451 marine natural compounds which were then converted to a ldb file in LigandScout during which 1,320 duplicates were removed. LigandScout generates 25 conformers for each compound. The iconFast mode for fast, high throughput generation of high-quality conformers was chosen to create the database for screening. The optimized pharmacophore model was fed to the screening perspective. CMNPD and decoy libraries were loaded to the screening mode and screening was conducted adopting the scoring, query, matching, and omitted features as mentioned in Section 2.1.2. The results were visualized in the library view, ROC was constructed, and the validity was assessed based on ROC-AUC. The data of resultant initial hits were saved as a sdf file and further refinement in OpenBabelGUI applying a molecular weight filter of ≤ 500 was carried out. The compounds with molecular weight ≤ 500, known from OpenBabelGUI results were chosen manually to align to the pharmacophore model in LigandScout. This refined hit library was stored in sdf and xls formats for the next stage of molecular docking studies. The sdf files can be saved to retain 2D or 3D coordinates of the selected conformation of the ligands. The minimum energy conformer was chosen for all ligands and the sdf file was written with 2D and 3D coordinates separately.
2.2 Comparative molecular docking
Pharmacophore model-aided virtual screening in LigandScout does not dock compounds to the target, rather it picks the prospective compounds with the potential to bind to the reference points (amino acids) identified through the receptor-ligand structure used as the starting point for modeling (Opo et al., 2021). Consequently, molecular docking of identified pharmacophoric hits to PLpro is required to i) downsize the number of hits and predict the most bioactive compound ii) predict the binding affinity iii) retrieve the predicted bioactive conformation, and iv) explore the binding interactions. Screening of compounds by docking supports decision-making in drug discovery. The prediction accuracy is a significant factor that influences the quality of virtual screening results. The final hit from docking shall be promoted to subsequent preclinical testing, hence the predictive efficiency of docking engines must be reliable and valid. Docking engines search for binding conformations and estimates the binding affinity of ligands using characteristic search algorithms and scoring functions (Gaillard, 2018). Docking engines must be capable of differentiating a prospective binder and a non-binder compound, which improves the detection accuracy leading to decreased false positives and false negatives. Benchmarking molecular docking or comparative docking is a strategy that compares and validates docking results from a minimum of two docking engines functioning on different search algorithms and scoring functions. To enable this process of validation, docking is performed on a specific macromolecular system and ligand sets containing decoy and active compounds (Vieira and Sousa, 2019). Therefore, we decided to utilize a comparative molecular docking strategy for docking the 50-refined hits from virtual screening to PLpro against known decoys from DEKOIS 2.0. library. We used two docking engines AutoDock 4.2.1. and AutoDock Vina 1.1.2. for docking (Morris et al., 2009; Trott & Olson, 2010).
2.2.1 Processing of PLpro and ligand structures
The PLpro structure used for docking was 7LBS which contains a native ligand. MGL tools was used to prepare the target structure. The native ligand, water molecules, and other non-standard residues were removed. Gasteiger charges and polar hydrogens were added. The energy-minimized target structure was saved in pdbqt format. For the hits and decoys, the sdf file containing the 3D coordinates of the minimum energy structure obtained in LigandScout was used. These structures in sdf were then converted to individual pdbqt files applying OpenBabelGUI. The native ligand XR8-24 structure saved in PDB was converted to pdbqt in OpenBabelGUI and was included in the docking study for comparison with ligands.
2.2.2 Molecular docking
The binding site of PLpro was identified according to the literature by highlighting the residues Asp164, Arg166, Glu167, Pro248, Tyr264, Gly266, Tyr268, Tyr273, and Pro299 (Shen et al., 2022). This created a grid box with dimensions of 9 Å X 8 Å X 35 Å, and size of 30 Å in X, Y, and Z coordinates. This docking grid covered only the binding sites and not the whole surface of the target. Same docking coordinates were applied for docking in both docking engines. All other docking parameters were kept at default for both docking engines. Chiefly, in AutoDock the genetic algorithm runs were 10, and in AutoDock Vina the number of conformers generated was 10 at exhaustiveness of search 8 with an energy difference of 3 kcal/mol. The binding affinities in terms of binding energy (ΔG in kcal/mol) for the hits and decoys were predicted by both docking engines. The conformer with minimum binding energy, the one with the highest negative value was chosen for binding interaction analysis, individual, and consensus scoring. PLpro bound to the predicted best inhibitor was visualized for the binding site engagement in UCSF Chimera 1.13.1. ( https://www.cgl.ucsf.edu/chimera/download.html) (Pettersen et al., 2004). Binding interaction analysis was performed in Discovery Studio 2016 ( https://discover.3ds.com/discovery-studio-visualizer-download).
2.2.3 Benchmarking molecular docking
Benchmarking procedures to assess the predictive potential of docking engines based on individual scoring and consensus scoring was applied.
2.2.3.1 Individual scoring
Benchmarking molecular docking is a comparative evaluation of the predictive capacity of AutoDock and AutoDock Vina. Benchmark analysis was performed using Screening Explorer, an online tool ( http://stats.drugdesign.fr/) (Empereur-Mot et al., 2016). Screening Explorer needs the docking results with ligand IDs, their predicted binding energy scores, and tags for active compounds or decoys as 1 or 0, respectively. These inputs are used for the generation of ligand rankings by Screening Explorer. Based on the ranks predictiveness curve, ROC, and enrichment curves are constructed. From the ROC curve AUC-ROC, Boltzmann-Enhanced Discrimination of ROC (BEDROC), and Robust Initial Enhancement (RIE) values are calculated. Enrichment factors (EF) are calculated from the enrichment curve. The Predictiveness curve was graphed with compound ranks on the X-axis and probability of activity on the Y-axis, indicating the potential of the docking engine’s scoring function in discriminating actives and decoys. A measure called total gain (TG) that relates the discriminative power to the score variation was calculated from the predictiveness curve (Empereur-Mot et al., 2015). Partial metrics like EF at 1 %, 5 %, and 10 % were implemented, which measures the early recognition of actives at a specific threshold. All the metrices mentioned in this section were applied to evaluate the predictive power of the docking engines used in the study.
2.2.3.2 Consensus scoring
Consensus scoring improves the active compound detection from docking generated hit compounds list. We applied established metrices of consensus scoring like minimum and average of ranks, maximum and average of Z scores, and maximum and average of normalized scores. Consensus scoring was performed in Screening Explorer. The input files in Section 2.2.3.1 were utilized for consensus scoring. Screening Explorer allows individual and consensus scoring at the same time. The results of benchmarking docking based on individual and consensus scoring and binding interaction analysis were considered to decide the active compound. The structure of the docked complex of PLpro with the active thus obtained was carried over to the next stage of molecular dynamics.
2.3 Molecular dynamics
The structure of PLpro docked to the predicted active compound was investigated for stability by MD under a physiologically simulated environment. The changes in the target protein’s conformation and movements upon ligand binding that influences its stability can be monitored by MD (Hollingsworth and Dror, 2018). Desmond 5.9 ( https://www.deshawresearch.com/) was employed for carrying out MD simulation analysis. The 7LBS-active compound docked complex was submerged into an orthorhombic cube imbibed with TIP3P solvent water, buffers, and NaCl was also added as counterions to neutralize charges. Desmond’s forcefield with the simple point charge model and OPLS criterion was applied to minimize the energy of the whole system prepared above. The submerged system was heated slowly, varying the temperature from 0 to 300 K in the NVT package. Then the system was equilibrated to apply an NPT package of 300 K temperature and 1 atm pressure and maintained throughout the MD run. MD of the 7LBS-active compound complex was performed for 50 ns and the trajectories were recorded and analyzed for stability. The RMSD and RMSF of PLpro as a result of ligand binding were predicted. The molecular mechanics generalized Born surface area energy (MMGBSA) in OPLS 2005 forcefield was calculated from three of the monitored trajectories from the final 50 ps of simulation and the mean value with standard deviation is reported (Tuccinardi, 2021). The MMGBSA energy was calculated from the formula:
ΔGbinding = G-docked – (G-protein + G-ligand) where ΔGbinding = binding free energy, G-docked, G-protein, and G-ligand are the free energies of the docked complexes, protein, and ligand, respectively.
The dynamic cross-correlation matrix (DCCM) was constructed for all Cα backbone atoms of PLpro from MD trajectory snapshots obtained over the final 50 ps of simulation (Yu and Dalby, 2020). The principal component analysis (PCA) was performed with the above system containing explicit water molecules and from the MD trajectory of the final 50 ps of simulation (David and Jacobs, 2014). DCCM and PCA were carried out using an essential python script in Desmond (Bharadwaj et al., 2021). Together, MMGBSA, DCCM, and PCA predicted from the MD simulation trajectories helped to exploit the protein’s domain movements and essential dynamics during ligand binding (Genheden and Ryde, 2015; Pierdominici-Sottile and Palma, 2015).
3 Results and discussion
3.1 Pharmacophore-aided virtual screening
SARS-CoV-2 pandemic had a devastating impact on the human community since 2019. The current global environment has improved a lot due to massive COVID-19 vaccination programs. Drug discovery strategies to exploit existing drugs, investigational and experimental compounds as anti-SARS-CoV-2 drugs have played a significant role in recent times. Among these, high-throughput computational screening techniques like molecular docking, network pharmacology, and virtual screening of large databases centred on divergent chemical concepts have taken the lead. Pharmacophore model-aided virtual screening is one such technique, that relies on the pharmacophoric description of ligands of concern. A pharmacophore model collectively represents the structural attributes for a ligand to complement a biological macromolecule’s binding site to bring on maximum binding and favorable pharmacological response. The structural coordinates of a receptor and its complementary ligand that bring about expected biological behaviour are used to construct a structure-based pharmacophore model. A particular pharmacophore model is applied to filter hit compounds from databases containing a large number of compounds. Utilizing natural resources for discovering drugs has always been rewarding. Natural compounds surprise scientists with their novel chemical structures and they also possess a wide range of biological properties. Natural products of marine origin remain unexplored for their potential therapeutic activities. Consequently, we performed pharmacophore manoeuvres on CMNPD to identify potential hits targeting the inhibition of SARS-CoV-2 PLpro. These hits were then filtered applying a molecular weight filter of ≤ 500 and then processed by molecular docking. A comparative molecular docking of these hits and decoys on two docking platforms yielded one active compound. The final active compound in complex with PLpro was analyzed for its stability by molecular dynamics. The results of the processes are discussed step-by-step.
3.1.1 Pharmacophore model generation
We used LigandScout 4.4.8. software for structure-based pharmacophore model generation. LigandScout is advanced molecular design software that functions on a graphical user interface (GUI) and is robust in creating 3D and 2D structure-based and ligand-based pharmacophore models. LigandScout automatically generates 3D pharmacophore models applying unique algorithms that deduce and interpret ligands and their target structure environment from PDB files. It also enables visualization, alignment, and manual refining of pharmacophore models to understand and optimize models for improved prediction accuracy (Seidel et al., 2017).
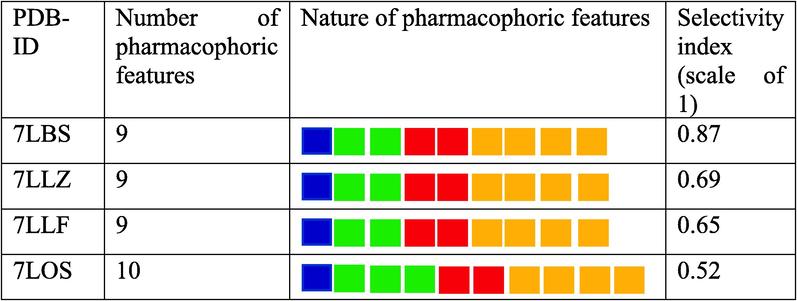
Recent PDB depositions of PLpro 3D structures with IDs 7LBS, 7LOS, 7LLZ, and 7LLF were chosen for pharmacophore model generation. We chose these PLpro structures with ligands because the chemistry of ligands is proposed to encourage cooperative binding that strengthens the binding to multiple binding sites resulting in a potent inhibitory activity (Shen et al., 2022). Each structure has a ligand bound to it that guided the pharmacophore generation. Four pharmacophore models containing the essence of the corresponding ligand characteristics were generated by applying default settings. We hand-picked a set of 23 active compounds having the chemistry supporting cooperative binding to PLpro and experimental inhibition constant, IC50 in the range of 0.1 to 5.7 μM from the literature to evaluate the selectivity index, i.e., the number of actives retrieved to the total number of actives (Luo et al., 2021; Shen et al., 2022). During this process of evaluation, the pharmacophoric features of all 4 models were manually optimized to improve the number of actives retrieved. After several attempts, the pharmacophore model derived from 7LBS was ranked 1 because it exhibited a better selectivity profile than other models, as shown in Table 1. The final optimized 7LBS model was obtained by choosing the screening mode to match all pharmacophoric features, decreasing the tolerance of HBD, and HBA by 0.3 Å, increasing the tolerance of two hydrophobic features of the alkyl groups by 0.3 Å, increasing the tolerance of PI group by 0.3 Å, and permission to omit a maximum of 2 features. We also added exclusion volume coats to the model. Exclusion volume spheres increase the sensitivity of pharmacophore models because these areas are forbidden for the ligand to interact and they pose a stereochemical constraint for ligand binding (Spitzer et al., 2010). Hence, the exclusion volume spheres in our refined pharmacophore model present a barrier to binding to non-specific ligands (Seidel et al., 2010). Fig. 2 represents the structure-based pharmacophore model derived from the structure of PLpro-7LBS and its complementary ligand XR8-24.
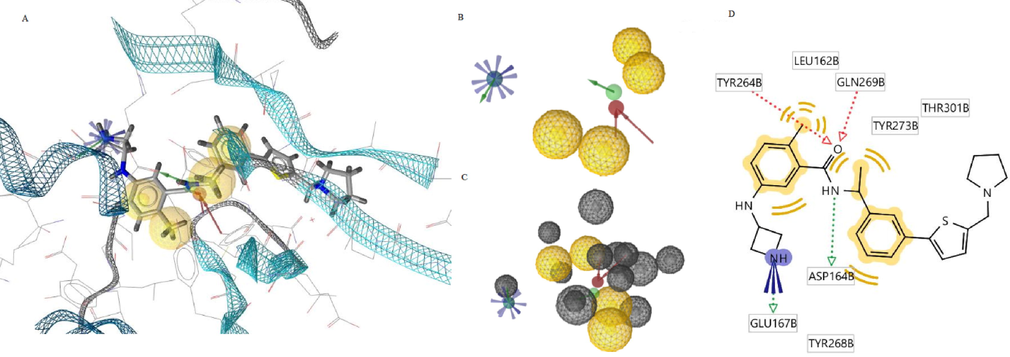
A) 7LBS-XR8-24-based pharmacophore model at the PLpro active site B) Optimized pharmacophore model in 3D C) Optimized view of the model with exclusion volume coats D) 2D depiction of the model showing the interacting residues of PLpro.
3.1.2 Pharmacophore features analysis
Fig. 2A provides the complete view of native ligand XR8-24 bound to the active site of PLpro and the native pharmacophore model aligned to the XR8-24 structure. Fig. 2B is the optimized pharmacophore model in 3D and Fig. 2C shows the optimized model with the exclusive volume coats. Fig. 2D is the two-dimensional depiction of the optimized pharmacophore model with reference points, i.e., the interacting amino acid residues of PLpro. The model derived from the key structural elements of XR8-24 in a 3D chemical space consisted of 9 features. According to the model in Fig. 2B, a positive ionization centre, 2 hydrogen bond donors, 2 hydrogen bond acceptors, and 4 hydrophobic features in a particular geometry are essential for the ligand to recognize multiple binding sites on PLpro ensuring binding cooperativity and potent inhibition. Exclusion volume spheres in Fig. 2C contemplates the steric nature of the target’s binding site and confer additional stereochemical constraint for binding of ligands enhancing ligand selectivity by the target macromolecule. It is impressive to view the model in 2D because it is a simplified version of 3D. In the 2D depiction of the model, Fig. 2D shows the native ligand structure besides the deduced pharmacophoric characteristics. Typically, pharmacophore models consider the binding site characteristics and its geometry while mapping the pharmacophore features of a ligand and the 2D model proposes the interacting binding site residues. In the PLpro-XR8-24-based model, the interacting residues are Leu162, Asp164, Glu167, Tyr264, Tyr268, Gln269, Tyr273, and Thr301. A viewer can understand from the 2D diagram that the positive ionization centre is an ionized or protonated amine proposed to interact with Asp164 through a hydrogen bond and ionic bond. Any ligand to bind to PLpro may require keto oxygen providing the scope of hydrogen bond acceptor atom for two hydrogen bonds, as specified in the model. There is a need for a hydrogen bond donor group like –NH for any ligand to leverage binding to multiple sites on PLpro. Four hydrophobic areas, in particular, phenyl rings or alkyl groups in the ligand shall provide excellent binding and PLpro inhibition according to the model. Therefore, the generated model supports the study with knowledge about ligand’s structural elements crucial for the predicted interaction pattern with PLpro.
3.1.3 Validation of the pharmacophore model
Validation of the predicted pharmacophore model is critical to determine its effectiveness and reliability in distinguishing active compounds from decoys. Certain quality indicators like ROC, AUC-ROC, and EF are universally accepted for pharmacophore model validation (Kaserer et al., 2015; Kirchmair et al., 2008). LigandScout enables model validation in screening mode when a set of actives and decoys are loaded into the screening window. The 23 active compounds explained in Section 2.1.1 were utilized for model validation. DEKOIS 2.0 library provided 720 decoy structures for screening against the known actives. The actives and decoys libraries were screened using the pharmacophore template created in LigandScout. The predicted pharmacophore model was able to identify 20 out of 23 actives and 37 out of 720 decoys. All decoys had only one hydrophobic feature matched with the model and a pharmacophore-fit score ranging from 15.22 to 15.63. The native ligand XR8-24 was retrieved at rank 1 with all matched features and a pharmacophore fit score of 97.18 indicating the accuracy of the model. Table S1 has the details of the total actives and decoys, retrieved actives and decoys during model validation. ROC for model validation is a plot of specificity vs sensitivity. Specificity is plotted on the X-axis indicates the false positives or decoys retrieved, hence ROC close to zero on the X-axis indicates the high accuracy of the model. Sensitivity, on Y-axis, represents the true positives or actives retrieved, therefore, the higher the value on X-axis, the higher the accuracy. The dotted line in ROC represents random prediction. ROC closer to the axis-Y and the greater the AUC-ROC, the greater the prediction accuracy (Kirchmair et al., 2008; Luo et al., 2021). Fig. 3 is the ROC curve for pharmacophore model validation that reveals the model’s predictive ability is well above random prediction. AUC-ROC (AUC1% = 1.00) and EF values (EF1% = 24.3) on the curve indicate our pharmacophore model has high predictive accuracy, sensitivity, and specificity. Thus, it is a reliable model for the virtual screening of CMNPD.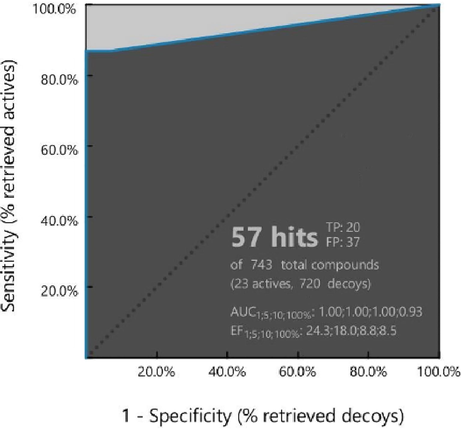
Pharmacophore model validation. ROC metrics indicate the accuracy and reliability of the model.
3.1.4 Pharmacophore model-aided virtual screening
The prepared CMNPD for virtual screening was made up of 46,131 marine natural compounds. The decoy set containing 720 decoys was used against the CMNPD in virtual screening to evaluate the reliability of the results. So, the final dataset for virtual screening had a total of 46,851 compounds. LigandScout has an impressive protocol for screening large databases by applying the validated pharmacophore template. The screening protocol attempts to search ligands by matching all pharmacophoric features preferably, when it fails, it omits a maximum of two features and refines the search on each ligand until it gets a single pharmacophore feature match. The pharmacophore model-aided virtual screening of CMNPD in LigandScout yielded 66 hit compounds. Table S2 has information about 66 hit compounds including their pharmacophore-fit scores and matching pharmacophoric features. In a nutshell, virtual screening retrieved a total of 103 hits, which included 66 hits and 37 decoys. The AUC-ROC at 1, 5, 10, and 100 % are 1.00, 0.77, 0.70, and 0.57, respectively. The EF at 1, 5, 10, and 100 % are 24.3, 12.6, 6.2, and 3.3, respectively. AUC and EF values are good and acceptable. Therefore, virtual screening results are valid and the protocol was successful in retrieving hit compounds in alignment with the model.
Physicochemical properties of chemical compounds influence their biological activity. Molecular weight, lipophilicity, rotational bonds, and number of hydrogen bond donors or acceptors are important molecular descriptors that significantly affect ionization, absorption, distribution, metabolism, excretion, toxicity, and binding affinity properties of drugs. Lipinski’s rule of 5 is a key to deciding the oral bioavailability of drugs and an MW ˃ 500 may result in poor oral absorption (Bunally et al., 2019). Accordingly, to downsize the number of hits, we filtered the initial 66-hit library through a molecular weight filter of ≤ 500, which yielded 50 hits. When we attempted to apply a rotational bond filter and ADME filter, the number of hits was reduced but the results obtained in sequential molecular docking were not fruitful. Hence, we proceeded with 50 hit compounds having a molecular weight of less than 500. Table S3 contains information about 50 hit compounds and their MW. Fig. 4 shows 50 hits of MW less than 500, aligned to the pharmacophore model.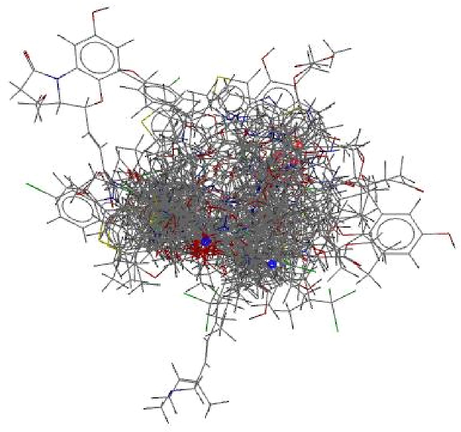
Virtual screening results show 50 hit compounds aligned to the pharmacophore model.
3.2 Comparative molecular docking
It is imperative to apply and evaluate different docking engines on the same macromolecular target and accept results from the reliable docking engine. Comparative docking is a strategy, which utilizes two or more docking engines for docking followed by performance evaluation based on suitable benchmarking metrices. Benchmarking docking included two methods: i) use of active and decoy compounds and ii) use of two docking engines that work on different search algorithms and scoring functions (Ibrahim et al., 2020). AutoDock and AutoDock Vina were chosen for docking the 50 hit compounds to PLpro structure, 7LBS. Both docking software is free for academic use. AutoDock predicts docked poses accurately and is the most widely used software. AutoDock searches conformations based on the Lamarckian genetic algorithm and scores the active conformation based on empirical scoring of free energy. AutoDock Vina is said to be a fast performer and is suitable for the virtual screening of large databases. It applies a global–local-gradient optimization search method and empirical free energy-based scoring function (Palacio-Rodríguez et al., 2019). Both docking engines have a few similarities like the input macromolecule and ligand format in pdbqt, definition of binding site as a grid box, and calculation of atom pair interactions at all distances. Finally, both docking engines scores and ranks the docked poses based on predicted binding energy (ΔG, Kcal/mol) (Guedes et al., 2018).
3.2.1 Benchmarking molecular docking
The hit library for molecular docking, generated by pharmacophore-based virtual screening contained marine natural compounds that are relatively small, as it is a library that has been filtered based on MW. The decoys from DEKOIS 2.0 were used for benchmarking. Therefore, 50 hits from virtual screening and 720 decoys were docked to 7LBS using both docking engines. The performance of AutoDock and AutoDock Vina were compared for their predictive ability and their accuracy to select active compounds at top ranks. Conventional evaluation metrices of individual and consensus scoring were applied for performance evaluation (Empereur-Mot et al., 2015; Empereur-Mot et al., 2016).
3.2.1.1 Individual scoring
The binding energy scores obtained from both docking engines were almost similar in the range of −9.9 to −6.4 kcal/mol for active compounds. Fig. S1 shows the distribution of scores for all actives and decoys and their corresponding ranks allotted by the two docking engines. Fig. 5 shows the predictiveness curve, ROC, and enrichment curves obtained from individual scoring. The predictiveness curve provides the probability of activity [P(act)] based on the scores and corresponding ranks of actives. The P(act) for AutoDock was 0.573 and AutoDock Vina was 0.715 at a set threshold of 0.01. Both docking engines identified the native ligand XR8-24 at the first position in the active compound list. None of the hit compounds had a score greater than the native ligand. Table 2, is the top 1 % rank list retrieved from two docking engines, has 6 actives each, out of which 3 compounds were enriched, but with different ranks. Table 3 shows the structures of 3 compounds that enrich the top 1 % rank list from AutoDock and AutoDock Vina. From Fig. 5 it is understood that both docking engines retrieved active compounds with early enrichment and possess good predictive power, AutoDock Vina scored a better position though. The metrices calculated from Fig. 5A, 5B, and 5C are reported in Table 4 under individual scoring. To reach an agreement between the results and to improve active compound selection, we attempted consensus scoring.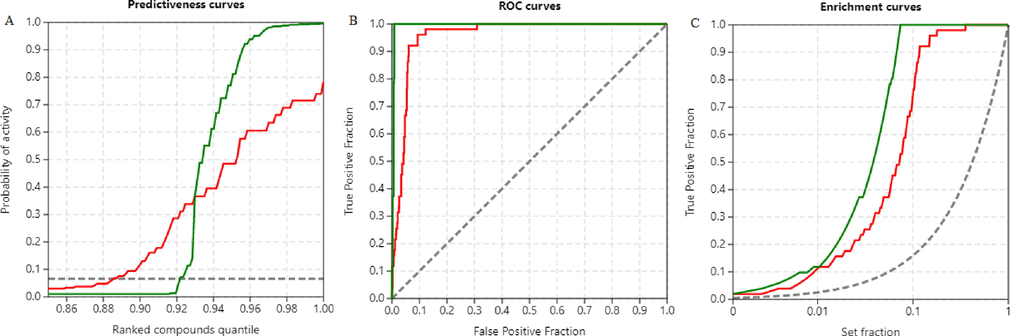
Comparative molecular docking results based on individual scoring. Red. AutoDock, green. AutoDock Vina. A) Predictiveness curves B) ROC curves C) Enrichment curves.
AutoDock
AutoDock Vina
Compound retrieved
Predicted binding energy (ΔG, kcal/mol)
Compound retrieved
Predicted binding energy (ΔG, kcal/mol)
XR8-24
−9.8
XR8-24
−9.9
CMNPD23373
−9.8
CMNPD28766
−9.9
CMNPD30040
−9.8
CMNPD13919
−9.8
CMNPD28766
−9.7
CMNPD7007
−9.8
CMNPD13919
−9.6
CMNPD24799
−9.7
CMNPD1441
−9.6
CMNPD23373
−9.7
Individual scoring - global metrices
Individual scoring- partial metrices
Docking engine
ROC-AUC
TG
RIE
BEDROC
EF1%
EF5%
EF10%
AD
0.957
0.680
6.99
0.630
11.34
7.56
7.36
AV
0.993
0.918
9.98
0.901
13.23
13.13
9.82
Consensus scoring - global metrices
Consensus scoring - partial metrices
Metrices
ROC-AUC
RIE
BEDROC
EF1%
EF5%
EF10%
Min of ranks
0.974
7.74
0.699
5.67
8.75
8.64
Average of ranks
0.991
9.93
0.896
11.34
11.34
9.82
Max of Z scores
0.995
10.32
0.931
13.53
13.13
9.82
Average of Z scores
0.981
9.02
0.814
11.34
11.14
8.83
Max of normalized scores
0.974
8.08
0.729
9.45
9.15
8.85
Average of normalized scores
0.992
9.91
0.894
11.34
12.73
9.82
3.2.1.2 Consensus scoring
Consensus scoring ensures fairness between scores of two docking engines and reduces the discrepancies due to outliers. Screening Explorer applies i) normalization of scores ii) standardization of scores, and iii) ranking-dependent methods for consensus scoring. For both docking engines, all 3 of the consensus scoring were carried out. A consensus selection of the best active compound arising from different scoring functions is possible based on the maximum of Z and normalized scores, and the minimum of ranks. The dominance or shortfall of scoring functions, if any, are balanced by implementing averages of ranks, Z, and score values. Fig. 6 shows the ROC and enrichment curves from consensus scoring.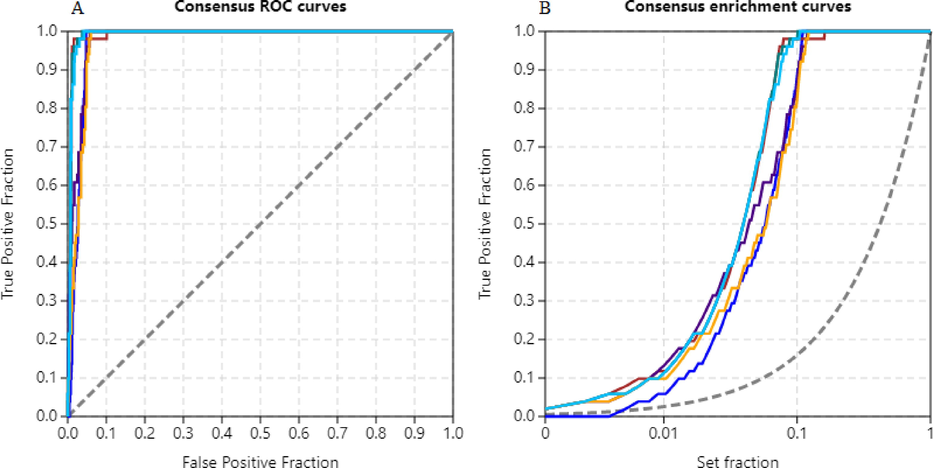
Consensus scoring of AutoDock and AutoDock Vina results. A) ROC curves, B) Enrichment curves, blue (minimum of ranks), red (average of ranks), purple (maximum of z scores), green (average of Z scores), yellow (maximum of normalized scores), and cyan (average of normalized scores).
3.2.1.3 Consensus scoring guided active compound selection
Individual scoring results indicated that both AutoDock and AutoDock Vina have performed well in retrieving the actives. The high ROC-AUC values in Table 4 indicate both docking engines are able to discriminate actives from decoys and high BEDROC values indicate successful early recognition of actives. The higher BEDROC and EF1% for AutoDock Vina than AutoDock indicate the predictive power of Vina. RIE is the normalized BEDROC. The high total gain values obtained from the predictiveness curve show that there exists relevant score variation in differentiating the actives and decoys and the results are reproducible. As both docking engines performed well and three compounds were enriched early in the 1 % list at different positions, we considered checking consensus scores for any improvement in compound selection. Table 4 shows the individual and consensus scores of AutoDock and AutoDock Vina.
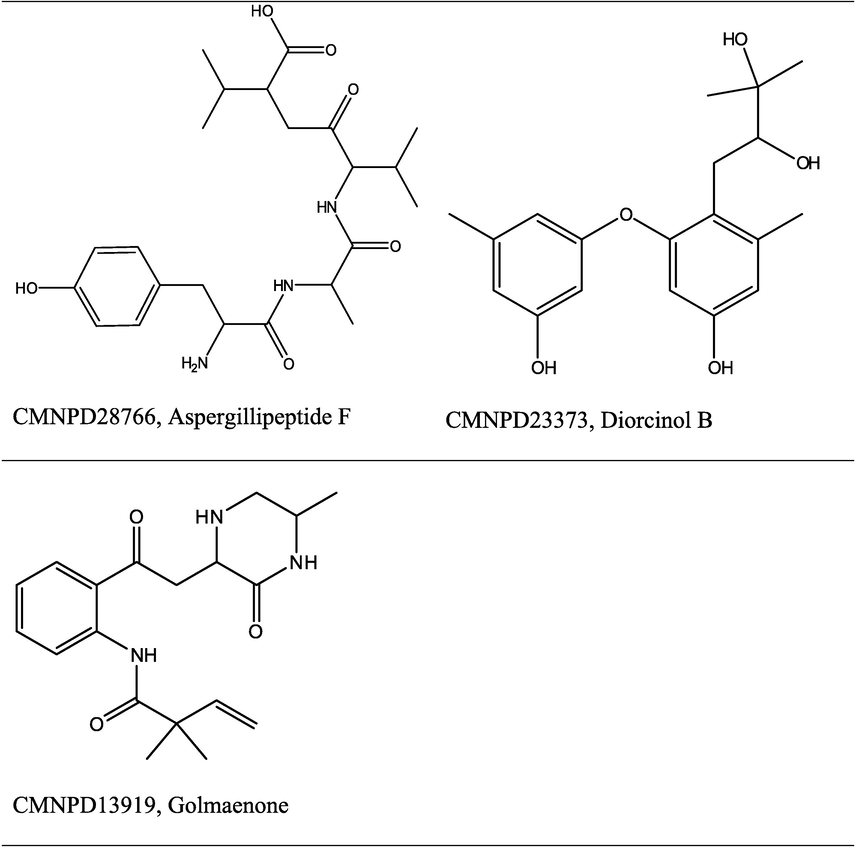
Consensus scoring results indicate that scoring with a maximum of Z scores can improve active compound selection. In Table 4, the ROC-AUC, BEDROC, and EF1% of consensus maximum of Z scores are higher than any other consensus or individual parameter. Therefore, a compound retrieved within the 1 % threshold by both docking engines and having maximum Z scores (less deviation from mean value) in both docking engine predicted scores is the best choice of active compound (Kim et al., 2019). Analysis of Z scores for binding energy values in Table 2 indicated that CMNPD28766 is the best active compound to have potent SARS CoV-2 PLpro inhibitory activity, because it was retrieved by both docking engines within the top 1 % rank and also exhibits lesser deviation from the mean score than the other two enriched compounds in the list, CMNPD23373, and CMNPD13919. Thus, consensus scoring improved the docking results and has guided active compound selection from the docking-based active compound list.
3.2.1.4 Active compound properties and pharmacophore model alignment
CMNPD28766, is aspergillipeptide F. SwissADME predicted molecular properties of aspergillipeptide F: MW – 450.53 g/mol, HBA – 7, HBD – 6, rotatable bonds – 14, lipophilicity (Log P) – 2.41, pharmacokinetic properties: GI absorption low, BB permeation low, the substrate of p-glycoprotein, not an inhibitor of CYP1A2, CYP2C19, CYP2C9, CYP2D6, CYP3A4, bioavailability score 0.55, and drug-likeness properties: Lipinski’s violation – 1 (HBA, HBD > 5), lead likeness violation – 2 (MW > 350, rotatable bonds > 7), synthetic accessibility – 3.98 (easy). No PAIN or structural alert from ADME. Collectively, predicted molecular and ADME properties indicate that aspergillipeptide F has good drug-likeness (up to 1 Lipinski’s violation is acceptable) and is less toxic (Daina et al., 2017). Chemically aspergillipeptide F is described in the literature as a linear tetrapeptide (Carroll et al., 2019; Liu, 2017). It was reported from the fungi Aspergillus sp. of the South China sea. No biological activities have been reported for aspergillipeptide F. CMNPD28766 pharmacophore-fit score is 75.916 in LigandScout pharmacophore model-aided virtual screening. Interestingly, this compound topped the pharmacophore-fit score list of compounds possessing MW less than 500 g/mol. CMNPD28766 had 7 out of 9 pharmacophoric features matched with the pharmacophore model. Fig. 7A and 7B show the pharmacophore features alignment of aspergillipeptide F (CMNPD28766) with the 3D and 2D pharmacophore models respectively. Aspergillipeptide F possesses a positive ionization centre, 2 HBA, 1 HBD, and 3 hydrophobic features aligned to the structure-based pharmacophore model. When compared to the developed pharmacophore model, 1 HBD and 1 hydrophobic feature are absent in the aspergillipeptide F derived model.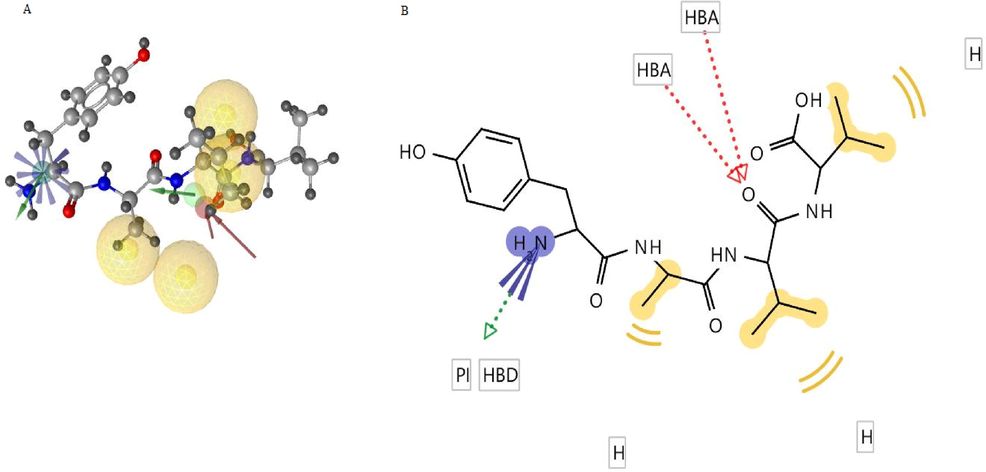
A) CMNPD28766, aspergillipeptide F aligned to 3D pharmacophore model B) 2D depiction of aspergillipeptide F pharmacophore model interaction features.
3.2.1.5 Binding interaction analysis
Native ligand XR8-24 was included along with hit compounds for docking and its active conformation generated by the developed docking protocol was aligned to the native PDB conformer. Fig. 8A shows the superposed native and redocked conformers of XR8-24 that exhibited an RMSD of 0.764 Å. The active conformations of native ligand XR8-24 and aspergillipeptide F in the active site of PLpro are shown in 3D in Fig. 8B. The RMSD between these two conformers was 1.056 Å indicating an acceptable fit of aspergillipeptide F into the same binding site of XR8-24. Fig. 8C is the 3D illustration of the binding sites occupied by aspergillipeptide F. Fig. 9A and 9B represent the 2D interaction diagrams of XR8-24 and aspergillipeptide, respectively. The SARS-CoV-2 PLpro catalytic binding site is a triad of Cys111, His272, and Asp286 residues. GRL0617 is the prototype of SARS-CoV-2 PLpro non-covalent inhibitors and is a peptide (Osipiuk et al., 2021; Shen et al., 2022). Shen et al. (2022) aimed to develop potent PLpro inhibitors using GRL0617 as the lead and demonstrated that ligand XR8-24 undergoes non-covalent binding to multiple binding sites implementing binding cooperativity leading to enhanced in-vitro anti-viral potency than GRL0617. Shen et al. (2022) concluded that there are five binding sites far from the active catalytic triad residues of PLpro that needs to be occupied for potent inhibition. Site I, Glu167, and Asp164 are crucial for PLpro binding to its substrate ubiquitin/ISG15. Site II is surrounded by Arg166 which interacts with ubiquitin. The compounds designed by this research group failed to interact with site II, except Zn-3–56 which lacked the characteristic azetidine of other compounds and ZN-3–56 also exhibited improved in-vitro activity than GRL0617. Site III, the BL2 loop featuring Gln269 and Tyr268 also plays a significant role in substrate binding. Site IV is hydrophobic due to Leu162, Tyr264, and Tyr273. In addition, a new binding site V, named BL2 groove formed by the hydrophobic residues Pro248 and Pro299 was identified. Non-covalent inhibitors are capable of PLpro inhibition by engaging site V without accessing the active catalytic triad site. Engaging site V blocks the access of the catalytic site of PLpro to its substrate ubiquitin/ISG.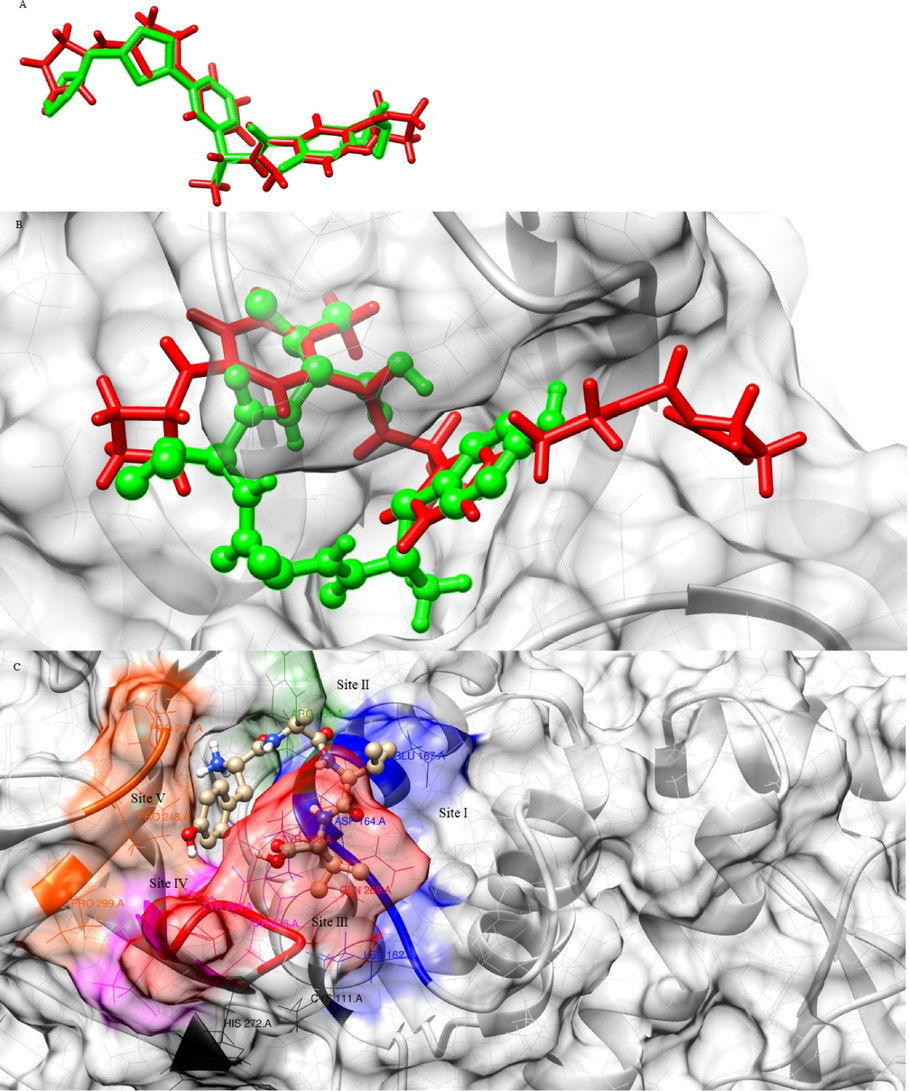
A) Superposed native and redocked conformations of XR8-24, red (native), green (redocked), B) Superposed active conformations of XR8-24 (stick) and aspergillipeptide F (ball and stick) inside the binding pocket of PLpro, C) Aspergillipeptide F conformation engaging all five binding sites of PLpro.
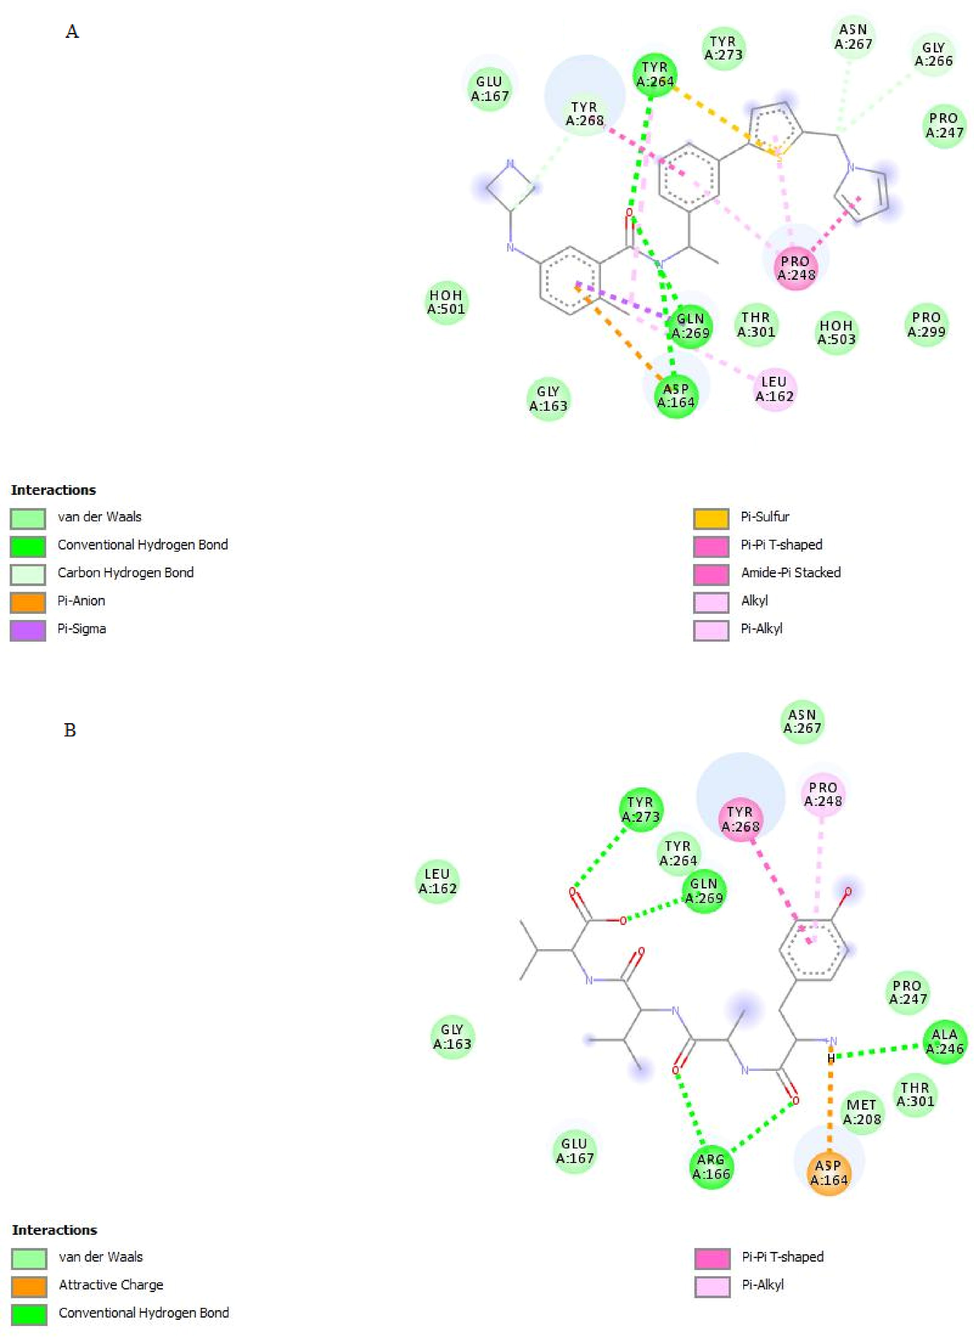
2D interaction diagrams of A) XR8-24B) aspergillipeptide F with PLpro active site residues.
CMNPD23373 and CMNPD13919 were unable to bind to all 5 binding sites. We compared the binding interactions of XR8-24 and aspergillipeptide F as shown in Fig. 9A and 9B. XR8-24 has 5 rings and interacts in a double ‘U’ conformation and aspergillipeptide F interacts in a single ‘U’ shaped conformation as it has only one ring. The most significant observation is that the LigandScout-predicted 7LBS-XR8-24-based model in Fig. 2, proposed electrostatic interactions through the positive ionization centre and HBD in the azetidine ring of XR8-24 with Glu167 of site I, but the active conformation of XR8-24 lacked electrostatic interactions and exhibited van der Waal’s interactions. Similarly, aspergillipeptide F also interacted with Glu167 through van der Waal’s interactions. The fascinating phenomenon was that aspergillipeptide F behaved according to the predicted pharmacophore model and the ionized primary amine in the side chain established an ionic interaction with Asp164 and a hydrogen bond with Ala246. Ionic hydrogen bonds play an important role in biomolecule recognition by receptors; hence it is suggested that the pharmacophore model was effective in predicting a suitable pharmacophore for molecular recognition by SARS-CoV-2 PLpro (Meot-Ner, 2005). Asp164 of site I binds through a Pi-anion bond to XR8-24.
XR8-24 established 3 hydrogen bonds whereas aspergillipeptide formed 5 hydrogen bonds (4 HBA and 1 HBD atoms). The developed pharmacophore model in Fig. 2D proposed four hydrogen bonds taking into account 2 HBA and 2 HBD groups of ligands. Interestingly, aspergillipeptide F interacted through its HBA ‘O’ atoms of the amide chain to form 2 hydrogen bonds with Arg166 of site II. Designing compounds that can block site I and site II simultaneously was reported to be difficult and harnessing natural compounds proved effective (Shen et al., 2022). XR8-24 lacks interaction with Arg166 which suggests the significance of the structural motif of aspergillipeptide F. XR8-24 and aspergillipeptide F (HBA ‘O’ atom of –COOH), both formed a hydrogen bond with Site III residue Gln269. Site IV Tyr264 interacted by forming a hydrogen bond with XR8-24 whereas Tyr273 of site IV interacted through a hydrogen bond with aspergillipeptide F (HBA ‘O’ atom of –COOH).
The predicted pharmacophore model in Fig. 2D proposed 4 hydrophobic interactions and in Fig. 7B, the model for aspergillipeptide F predicted 3 hydrophobic interactions. The chemical features of active poses of XR8-24 and aspergillipeptide F involved in binding are compared in Table 5. Molecular docking has predicted 2 hydrophobic interactions, besides van der Waal’s interactions. As per the developed model, methyl and 2 isopropyl groups of aspergillipeptide F were predicted to involve in hydrophobic interactions. Molecular docking also predicted the contributions of methyl and 1 isopropyl group of aspergillipeptide F towards hydrophobic interactions. However, the phenyl ring of aspergillipeptide F contributes significantly to hydrophobic interactions. Hydrophobic interactions were almost similar in XR8-24 and aspergillipeptide F, the most significant interaction being the Pi-Pi T-shaped interaction with Tyr268. Interactions of XR8-24 and aspergillipeptide F with Gln269 and Tyr268 lead to BL2 loop closure. Also, van der Waal’s interaction with Asn267 supports BL2 loop closure. The closure of the BL2 loop blocks the access of substrates to the active site, thus blocking the PLpro protease activity resulting in inhibition of virus replication. Pi-alkyl interaction of aspergillipeptide F with Pro248 of site V closes the BL2 groove, blocks the access of PLpro active site to ubiquitin/ISG15, and inhibits the deubiquitinating activity of PLpro, thus improving host anti-viral immunity.
Nature of interactions
Chemical features
XR8-24
Aspergillipeptide F
Hydrogen bond
Oxygen (acceptor) and nitrogen (donor) of the amide
Carboxylic acid oxygens (acceptor), keto oxygens (acceptor)of peptide, and nitrogen (donor) of amine
Electrostatic π-anion
Phenyl
Absent
π-sulfur
Sulfur of thiophene
Absent
Van der Waal’s
Azetidine, phenyl, pyrrole, thiophene, and aliphatic methyl
Phenyl, aliphatic isopropyl, and methyl
Hydrophobic
Phenyl, pyrrole, and methyl
Phenyl
Attractive charge (ionic)
Absent
Protonated amine
The interatomic distances for the charged interactions of aspergillipeptide F with PLpro range between 1.82 and 2.96 Å and hydrophobic interactions occurred at a distance of 2.44–4.46 Å suggesting stable interactions. Amide or peptide linkages have been associated with greater PLpro binding than other moieties (De Vita et al., 2020; Osipiuk et al., 2021; Pang et al., 2021; Shen et al., 2022). Molecular docking results are in favour of peptide linkages in aspergillipeptide F. Together, pharmacophore model-aided virtual screening along with consensus molecular docking was successful in retrieving a natural compound of marine origin with the potential of SARS-CoV-2 PLpro inhibition similar to synthetic potent non-covalent inhibitor XR8-24.
Thus, explored in-silico binding interactions delineate the mode of action of aspergillipeptide F as an anti-SARS-CoV-2 compound. Consequently, we proceeded to verify the stability of the aspergillipeptide F-PLpro complex and essential dynamics of PLpro during aspergillipeptide F binding by molecular dynamics simulation studies.
3.3 Molecular dynamics
During MD simulation, counter ions were added to neutralize charges (42Na+ and 42Cl- ions for PLpro) and 0.15 M NaCl salt level was utilized to simulate the physiological condition of the human system. Proteins undergo structural fluctuations or conformational changes on ligand binding. RMSD and RMSF are commonly used to measure these fluctuations as a measure of conformational stability. RMSD estimates the structural fluctuation from the 1st frame of MD trajectory taken as the reference structure to the chosen MD trajectory structure, in this study the structure at the final 50 ps of simulation. Divergence from the initial RMSDs indicates initial conformational changes of protein and ligand. Later when the system gets equilibrated, RMSDs of the protein and ligand fluctuate around an average RMSD indicating a stable conformation (Martínez, 2015). The retrospective MD analysis to measure RMSD of aspergillipeptide F-PLpro complex indicated that the bound system has undergone initial conformational changes as shown in Fig. 10A. After 20 ns, the system got equilibrated and settled over an average and stable conformer at an RMSD of 2 Å. RMSF measures the movement of macromolecule’s Cα-atoms at a specific time of MD run to an average structure (Patel et al., 2022). Fig. 10B displays the RMSF of PLpro Cα-atoms in complex with aspergillipeptide F in which Thr265 has fluctuated the most, > 4 Å from the average structure. The RMSF values of other residues are below 2 Å suggesting a favorable conformation and good stability of the complex. Fig. 10C shows the radius of gyration of PLpro Cα-atoms during the 50 ns MD run. Initially, upon ligand binding radius of gyration was slightly high which decreased after 15 ns and was maintained around an average of 22.25 ± 0.012 Å (2.22 nm) indicating good compactness and stability of the macromolecule. Compactness determines the protein’s kinetics and degree of folding, therefore the low radius of gyration of PLpro indicates favorable stability (MIu et al., 2008). A plot of an average number of hydrogen bonds maintained during the MD run, Fig. 10D suggested the presence of 4 ± 0.545 hydrogen bonds indicating a good fit into the binding sites and stability of the complex.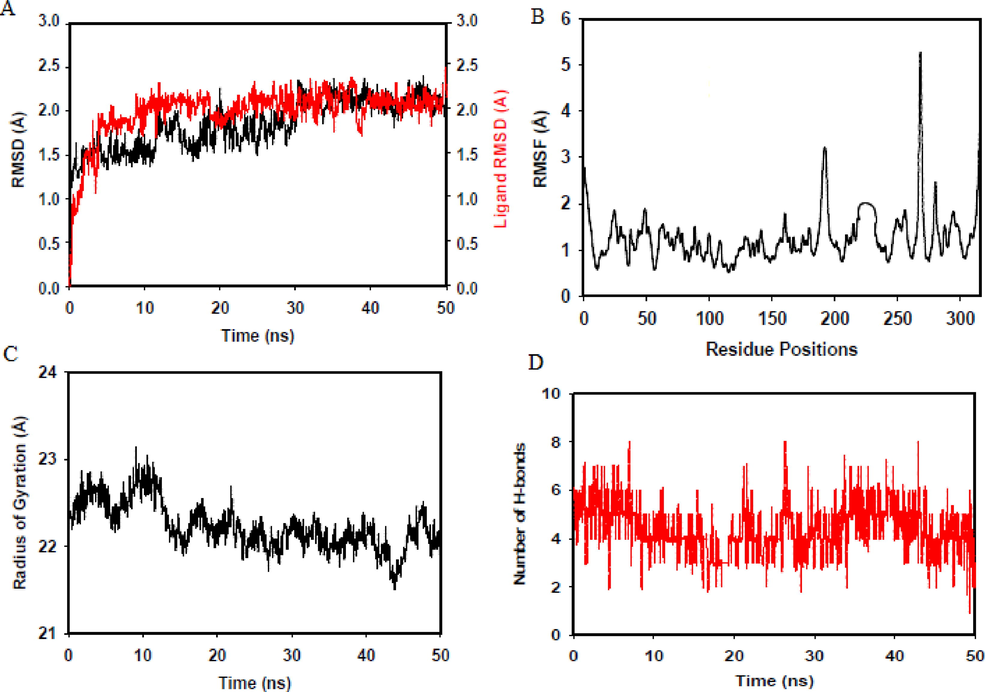
A) RMSD of aspergillipeptide F-PLpro complex, B) RMSF of PLpro on ligand binding, C) Radius of gyration of PLpro after ligand binding, D) Number of hydrogen bonds maintained during MD run.
The MMGBSA energy and the contributing free energies of the aspergillipeptide F-PLpro system was calculated from the final 50 ps trajectories. The more negative values indicate a stabilizing influence and positive values suggest a destabilizing contribution to the total free energy of the system (Pang et al., 2021). ΔGbinding = −58.08 ± 9.45; ΔGbindLipo = −14.44 ± 2.08; ΔGbindvdW = −34.37 ± 6.17; ΔGbindCoulomb = −26.44 ± 8.69 ΔGbindSolvGB = 28.14 ± 7.42 and ΔGbindCovalent = 5.22 ± 1.28 Kcal/mol. The docked aspergillipeptide F-PLpro system was stabilized by ΔGbindCoulomb, ΔGbindvdW, and ΔGbindLipo. Van der Waal’s interactions have been a critical contributor to the total binding free energy. This is in good correlation with molecular docking results that suggested a good number of van der Waal’s interactions with critical binding site residues.
DCCM and PCA of MD trajectories are complementary to RMSD and RMSF in analysing the essential dynamics of proteins during ligand binding. Recent studies have utilized DCCM and PCA to analyse the protein motions in the ligand-bound form (Bharadwaj et al., 2021; Shafie et al., 2021). DCCM quantified the dynamics of Cα-atoms movements from the final 50 ps of MD trajectories. The correlation between the movements of pairs of atoms was estimated by measuring their covariance. Fig. 11A is the contour map of the covariance matrix (DCCM), with cross correlation-coefficient values indicated on the right. Positive (correlated movements) and negative (anti-correlated movements) values in the map indicate the directions of movements of pair of atoms in the same or opposite directions, respectively. The blue colour indicates + 1, demonstrating correlated movements and have alike period and phase. The intense blue color off-diagonal blocks indicate highly correlated atom pairs’ nearest-neighbor movements resulting in a stable conformation (Yu and Dalby, 2020). Three well-defined blue square blocks correspond to three structural domains of PLpro. The domain correlations obtained from MD analysis show that the D1 domain has residues 1–50 that conform to two distinct β-sheets and a helical turn (red, Fig. 11B). Residue numbers 51–180 also had correlated motion and folded into 6 α-helices (teal, Fig. 11B), forming the D2 domain. Domain D3 has the largest cross-correlation of residues 181–300, shaped into 6 pairs of β and 1 α-helix antiparallel sheets (magenta, Fig. 11B). All through the analyzed time scale of trajectories for domain correlation, prominent and substantial cross-correlation peaks are present, and weak correlation and anti-correlation peaks are seen dispersed in the matrix indicating the stability of PLpro domains and binding sites. These results are in correlation with the low RMSD, RMSF, and MMGBSA energy of the ligand-bound system.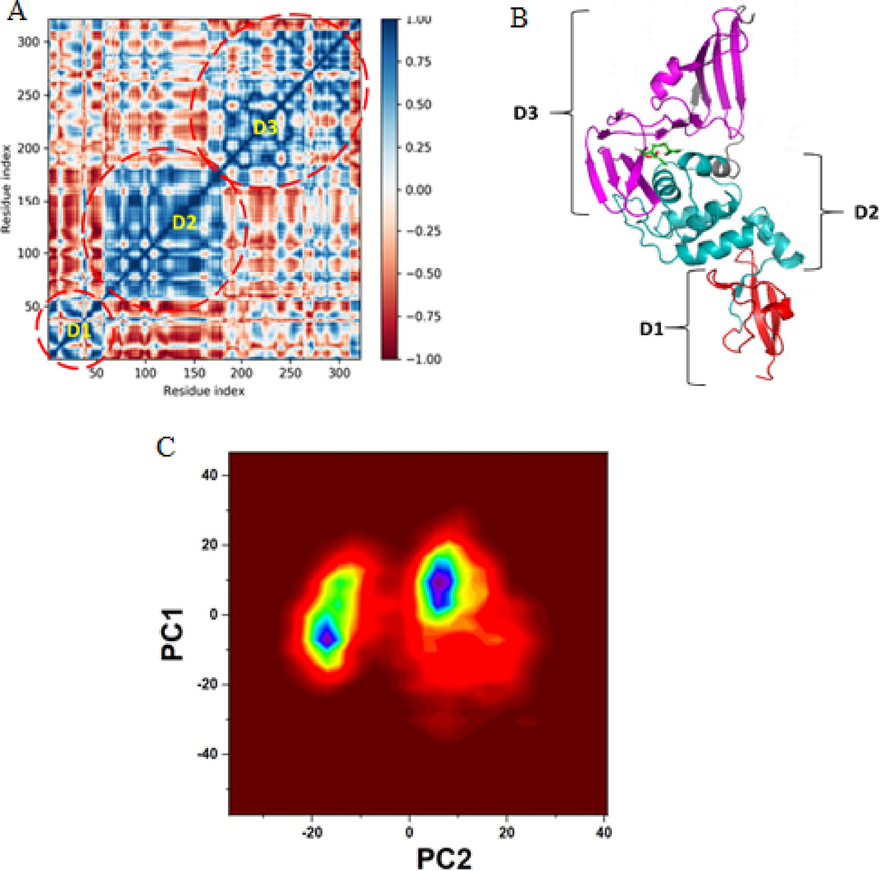
A) Dynamic cross-correlation map of Cα backbone atom pairs of ligand-bound SARS-CoV-2 PLpro, B) Domains of PLpro correlated to the protein’s dynamics, C) PCA of two contributing motions clustered from MD trajectories of aspergillipeptide F bound PLpro.
The PCA analysis of movements of Cα-atoms of PLpro in the bound state obtained from the MD trajectories is shown in Fig. 11C. PCA revealed the association of magnitude of two principal components, fast localized motion (PC1) and slow universal motion (PC2) of residues to the stability of the bound complex. Each trajectory's eigenvalues marked as co-variance were clustered and plotted in a PCA contour map to show the magnitude of movement and residue paths. PCA indicated 26.83 % of PC2 variance of the observed total variance for aspergillipeptide F-PLpro complex. This suggests that the universal slow motion of residues contributed significantly to the stability of the complex. PCA results also corroborated MMGBSA calculated total binding free energy of the system.
We considered 50 ns simulation time shall provide meaningful interpretations of the protein’s initial and final conformations upon ligand binding, as the structure started stabilizing after 15 ns and there were no drifts observed in the protein’s movements up to 50 ns. Performing long-time simulations may not be useful because MD explores the minimum energy conformation adjacent to the initial conformation. To overcome doubts about the successful sampling of stable conformations, running parallel simulations with different initial protein conformations is recommended. The limitation of the applied method is that the pharmacophore model was generated from a single PDB structure and only one initial conformation was available, hence parallel sampling was impossible (Hospital et al., 2015).
4 Conclusion
SARS-CoV-2 PLpro inhibition is a valuable therapeutic strategy to curb SARS-CoV-2 replication and is also beneficial in improving host anti-viral immunity. A structure-based pharmacophore model from the 3D structure of 7LBS-XR8-24 was developed and was successfully applied for virtual screening of comprehensive marine natural product database to identify potent SARS-CoV-2 PLpro inhibitors. The resultant 50 small ligands on comparative molecular docking and consensus scoring, predicted aspergillipeptide F as the best PLpro inhibitor. Binding interaction analysis indicated that aspergillipeptide F engaged all the 5 binding sites on PLpro and exhibited a greater number of hydrogen bonds than the native ligand XR8-24 suggesting potent inhibition. Molecular dynamics of aspergillipeptide F-PLpro complex displayed good stability influenced by the macromolecule’s strongly correlated domain movements. Aspergillipeptide F has preferable drug-like properties and is less toxic according to its predicted molecular and ADME properties. Therefore, this study has the scope for pharmaceutical, pre-clinical and clinical studies to convert aspergillipeptide F into a clinical candidate for SARS-CoV-2 therapy.
Funding
This research work was funded by the Deanship of Scientific Research, Jazan University, Grant No CoV19-24.
References
- Evaluation and optimization of virtual screening workflows with DEKOIS 2.0–a public library of challenging docking benchmark sets. J. Chem. Inf. Model.. 2013;53(6):1447-1462.
- [CrossRef] [Google Scholar]
- Macrolactin A as a novel inhibitory agent for SARS-CoV-2 Mpro: Bioinformatics approach. Applied. Biochem. Biotechnol.. 2021;193(10):3371-3394.
- [CrossRef] [Google Scholar]
- Using physicochemical measurements to influence better compound design. SLAS Discov.. 2019;24(8):791-801.
- [CrossRef] [Google Scholar]
- SwissADME: a free web tool to evaluate pharmacokinetics, drug-likeness and medicinal chemistry friendliness of small molecules. Sci. Rep.. 2017;7(1):1-13.
- [CrossRef] [Google Scholar]
- Principal component analysis: a method for determining the essential dynamics of proteins Protein dynamics. Methods Mol Biol.. 2014;1084:193-226.
- [CrossRef] [Google Scholar]
- Accelerating the repurposing of FDA-approved drugs against coronavirus disease-19 (COVID-19) RSC Adv.. 2020;10(67):40867-40875.
- [CrossRef] [Google Scholar]
- Predictiveness curves in virtual screening. J. Cheminform. 2015;7(1):1-17.
- [CrossRef] [Google Scholar]
- Screening explorer–An interactive tool for the analysis of screening results. J. Chem. Info. Model.. 2016;56(12):2281-2286.
- [CrossRef] [Google Scholar]
- Evaluation of AutoDock and AutoDock Vina on the CASF-2013 benchmark. J. Chem. Info. Model.. 2018;8(8):1697-1706.
- [CrossRef] [Google Scholar]
- Structure-based three-dimensional pharmacophores as an alternative to traditional methodologies. J. Recep. Ligand Channel Res.. 2014;7:27-38.
- [CrossRef] [Google Scholar]
- The MM/PBSA and MM/GBSA methods to estimate ligand-binding affinities. Expert Opin. Drug Discov.. 2015;10(5):449-461.
- [CrossRef] [Google Scholar]
- Empirical scoring functions for structure-based virtual screening: applications, critical aspects, and challenges. Front. Pharmacol.. 2018;1089
- [CrossRef] [Google Scholar]
- Molecular dynamics simulations: advances and applications. Adv Appl Bioinform Chem.. 2015;8:37-47.
- [CrossRef] [Google Scholar]
- Supporting SARS-CoV-2 papain-like protease drug discovery: In silico methods and benchmarking. Front. Chem.. 2020;996
- [CrossRef] [Google Scholar]
- Pharmacophore models and pharmacophore-based virtual screening: concepts and applications exemplified on hydroxysteroid dehydrogenases. Molecules. 2015;20(12):22799-22832.
- [CrossRef] [Google Scholar]
- Improving inverse docking target identification with Z-score selection. Chem Biol Drug Des. 2019;93(6):1105-1116.
- [CrossRef] [Google Scholar]
- Evaluation of the performance of 3D virtual screening protocols: RMSD comparisons, enrichment assessments, and decoy selection—what can we learn from earlier mistakes? J. Comput. Aided Mol. Des.. 2008;22(3):213-228.
- [CrossRef] [Google Scholar]
- Secondary metabolites from marine-derived fungi from China. In: Kinghorn A.D., Falk H., Gibbons S., Asakawa Y., Liu J.-K., Dirsch V.M., eds. Progress in the chemistry of organic natural products. Switzerland: Springer Nature; 2017. p. :121-124.
- [Google Scholar]
- Structure-Based Pharmacophore Modeling, Virtual Screening, Molecular Docking, ADMET, and Molecular Dynamics (MD) Simulation of Potential Inhibitors of PD-L1 from the Library of Marine Natural Products. Mar. Drugs. 2021;20(1):29.
- [CrossRef] [Google Scholar]
- CMNPD: a comprehensive marine natural products database towards facilitating drug discovery from the ocean. Nucleic Acids Res.. 2021;49(D1):D509-D515.
- [CrossRef] [Google Scholar]
- Automatic identification of mobile and rigid substructures in molecular dynamics simulations and fractional structural fluctuation analysis. PloS one. 2015;10(3):e0119264.
- [Google Scholar]
- Radius of gyration is indicator of compactness of protein structure. Mol. Biol.. 2008;42(4):701-706.
- [CrossRef] [Google Scholar]
- AutoDock4 and AutoDockTools4: Automated docking with selective receptor flexibility. J. Comput. Chem.. 2009;30(16):2785-2791.
- [CrossRef] [Google Scholar]
- Pharmacophore Modeling in Drug Discovery: Methodology and Current Status. J. Turkish chem. soc. section a. Chemistry. 2021;8(3):749-762. ttps://doi.org/ 10.18596/jotcsa. 927426
- [Google Scholar]
- Open babel. J. Cheminform. 2013;3(1):33-2011.
- [CrossRef]
- Structure based pharmacophore modeling, virtual screening, molecular docking and ADMET approaches for identification of natural anti-cancer agents targeting XIAP protein. Sci. Rep.. 2021;11(1):1-17.
- [CrossRef] [Google Scholar]
- Structure of papain-like protease from SARS-CoV-2 and its complexes with non-covalent inhibitors. Nat. Commun.. 2021;2(1):1-9.
- [CrossRef] [Google Scholar]
- Exponential consensus ranking improves the outcome in docking and receptor ensemble docking. Sci. Rep.. 2019;9(1):1-14.
- [CrossRef] [Google Scholar]
- Discovery of small molecule PLpro inhibitor against COVID-19 using structure-based virtual screening, molecular dynamics simulation, and molecular mechanics/Generalized Born surface area (MM/GBSA) calculation. Struct Chem.. 2021;32(2):879-886.
- [CrossRef] [Google Scholar]
- Computational investigation of binding of chloroquinone and hydroxychloroquinone against PLPro of SARS-CoV-2. J. Biomol. Struct. 2022;40(7):3071-3081.
- [CrossRef] [Google Scholar]
- UCSF Chimera—a visualization system for exploratory research and analysis. J. Comput. Chem.. 2004;25(13):1605-1612.
- [CrossRef] [Google Scholar]
- New insights into the meaning and usefulness of principal component analysis of concatenated trajectories. J. Comput. Chem.. 2015;36(7):424-432.
- [CrossRef] [Google Scholar]
- Computer-aided drug design of bioactive natural products. Curr Top Med Chem. 2015;15(18):1780-1800.
- [CrossRef] [Google Scholar]
- Pharmacophore modeling: advances, limitations, and current utility in drug discovery. J. Recep. Ligand Channel Res.. 2014;7:81-92.
- [CrossRef] [Google Scholar]
- 3D pharmacophore modeling techniques in computer-aided molecular design using LigandScout. In: Varnek A., ed. Tutorials in Chemoinformatics. Wiley Online Library; 2017. p. :279-309.
- [Google Scholar]
- Strategies for 3D pharmacophore-based virtual screening. Drug Discov. Today Technol.. 2010;7(4):e221-e228.
- [CrossRef] [Google Scholar]
- Identification of Phytoconstituents as Potent Inhibitors of Casein Kinase-1 Alpha Using Virtual Screening and Molecular Dynamics Simulations. Pharmaceutics. 2021;13(12):2157.
- [CrossRef] [Google Scholar]
- Design of SARS-CoV-2 PLpro Inhibitors for COVID-19 Antiviral Therapy Leveraging Binding Cooperativity. J. Med. Chem. 2022;65(4):2940-2955.
- [CrossRef] [Google Scholar]
- One concept, three implementations of 3D pharmacophore-based virtual screening: distinct coverage of chemical search space. J. Chem. Info. Model.. 2010;50(7):1241-1247.
- [CrossRef] [Google Scholar]
- Discovery of the first dual inhibitor of the 5-lipoxygenase-activating protein and soluble epoxide hydrolase using pharmacophore-based virtual screening. Sci. Rep.. 2017;7(1):1-8.
- [CrossRef] [Google Scholar]
- AutoDock Vina: improving the speed and accuracy of docking with a new scoring function, efficient optimization, and multithreading. J. Comput. Chem.. 2010;30 31(2):455-461.
- [CrossRef] [Google Scholar]
- What is the current value of MM/PBSA and MM/GBSA methods in drug discovery? Expert Opin Drug Discov. 2021;16:1233-1237.
- [Google Scholar]
- Comparing AutoDock and Vina in ligand/decoy discrimination for virtual screening. Appl. Sci.. 2019;9(21):4538.
- [CrossRef] [Google Scholar]
- LigandScout: 3-D pharmacophores derived from protein-bound ligands and their use as virtual screening filters. J. Chem. Inf. Model.. 2005;45(1):160-169.
- [CrossRef] [Google Scholar]
- A beginner's guide to molecular dynamics simulations and the identification of cross-correlation networks for enzyme engineering. Methods Enzymol.. 2020;643:15-49.
- [CrossRef] [Google Scholar]
Appendix A
Supplementary material
Supplementary data to this article can be found online at https://doi.org/10.1016/j.arabjc.2022.104334.
Appendix A
Supplementary material
The following are the Supplementary data to this article: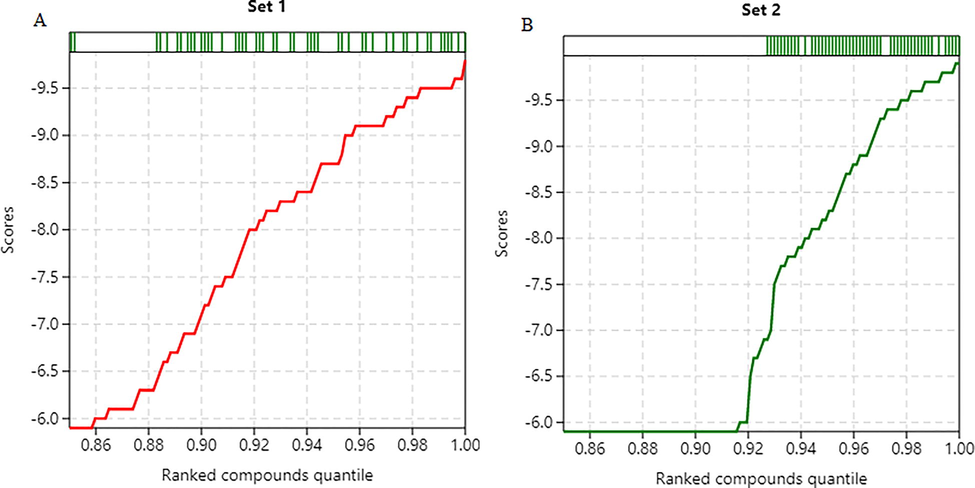
Distribution of scores and ranks for screened compounds A) AutoDock B) AutoDock Vina
Supplementary data 1
Supplementary data 1
Supplementary data 2
Supplementary data 2
Supplementary data 3
Supplementary data 3


