

Translate this page into:
Physico-chemical characterization and photocatalytic activity assessment under UV-A and visible-light irradiation of iron-doped TiO2 nanoparticles
⁎Corresponding author. o.zegaoui@umi.ac.ma (Omar Zegaoui)
-
Received: ,
Accepted: ,
This article was originally published by Elsevier and was migrated to Scientific Scholar after the change of Publisher.
Peer review under responsibility of King Saud University.
Abstract
In this work, undoped TiO2 and Fe-doped TiO2 materials as photocatalysts for water remediation, were synthesized using wet chemical methods (sol–gel + precipitation). Their crystalline structure, optical and morphological properties were explored using X-ray diffraction (XRD), Fourier-transform infrared (FTIR) and Raman spectroscopies, UV–vis diffuse reflectance (DRS) and photoluminescence (PL) spectroscopy, X-ray photoelectron spectroscopy (XPS), and scanning electron microscopy coupled to the energy dispersive X-Ray spectroscopy (SEM-EDS). The photocatalytic performance of the synthesized materials was assessed through the degradation of methyl orange (MO) under UV-A and visible-light irradiations. The structural study showed the existence of predominate anatase phase in all synthesized nanomaterials. The optical study showed a widening of the band gap for Fe-doped TiO2 materials and revealed a decrease in charge carrier’s recombination for all Fe-doped TiO2 nanomaterials compared to undoped TiO2. The morphological study confirmed the nanometric scale of the materials particles. The photocatalytic experiments revealed an enhanced photocatalytic activity of 0.5 %wt Fe-doped TiO2, only under UV-A light, compared to the rest of the prepared nanomaterials. The enhanced photocatalytic activity has been attributed to the efficient charge separation of electrons and holes.
Keywords
Photocatalysis
Fe-TiO2
Methyl orange
UV-A light
Visible light

1 Introduction
Due to the increase in the world population, around 8 billion at present, the demand on natural resources (mines, oil, gas, water, etc.) continues to increase. In particular, the need for drinking water which has become an urgent matter. Our environment is being seriously endangered by polluted water, and finding a solution to that problem has always been the driving force for the development of water purification technology. In fact, many water treatment methods have been implanted; yet, there are still many limitations to be solved. Within this context (Fujishima and Honda, 1972) reported that it is possible to decompose water under ultraviolet irradiation using TiO2 electrodes as photocatalysts. Since then, photocatalysis process has attracted researchers’ attention to the wastewater treatment field. Several semiconductor materials have been used as photocatalysts: TiO2, ZnO, WO3, Fe2O3 CdS and NiO (Ameta et al., 2018). Among these, TiO2 has proven to be the most suitable for most environmental applications because it is biologically and chemically inert, resistant to chemical corrosion and can be used at ambient temperature and pressure, without the need to add any chemical species.
However, TiO2 still has some limitations. In fact, it has two main drawbacks: (i) TiO2 can only be photoexcited under UV irradiation (with wavelengths < 387 nm) which represents only 3–5 % of the solar spectrum; (ii) pure TiO2 has a high recombination rate of photo-induced electrons and holes (e-/h+) are limiting its application. To overcome these problems, great efforts have been made to shift the optical response of TiO2 from UV to the visible light region in order to benefit as much as possible from solar energy and increase the charge carrier separation. So far, various approaches have been suggested such as mono-doping or co-doping of TiO2 with suitable metals and/or nonmetal ions (El Mragui et al., 2020; Thambiliyagodage and Usgodaarachchi, 2021), and combination of TiO2 with other semiconductors (Cerdán-Pasarán et al., 2019; Prasannalakshmi and Shanmugam, 2017). Zhou et al. (2011, 2014), Sun et al. (2018) and Li et al. (2022b, 2022a) reported many papers concerning the improvement of the photocatalytic efficiency of modified and unmodified anatase TiO2 under UV and visible light. They reported that the ordered mesoporous anatase TiO2 exhibited better photocatalytic activity than that of Degussa P25 TiO2 for degradation of highly toxic 2,4-dichlorophenol under UV irradiation (Zhou et al. 2011). Other authors (Chen et al., 2011) reported also that hydrogenated black TiO2 could improve the full-spectrum solar absorption and photocatalytic performance. In other papers, Sun et al. (2018) and Li et al. (2022b, 2022a) reported that the combination of black TiO2 with MoS2 and Cu2S in order to form hierarchical tandem heterojunctions improves the hydrogen production under visible light. They ascribed this excellent photocatalytic performance to the formation of hierarchical tandem heterojunctions with suitable band gap alignment favouring charge transfer and separation, and the introduction of MoS2 and Cu2S extending photo-response to NIR region.
In our earlier studies (El Mragui et al., 2019d, 2019c, 2019b, 2019a), doping the TiO2 with various transition metal cations has been intensively attempted to extend its absorption edge into the visible light region thereby enhancing its photocatalytic activity. In fact, in a previous study (El Mragui et al., 2019a) on the influence of the weight ratio of ZnO and its mode of preparation, on the physicochemical and photocatalytic properties of ZnO-TiO2 nanomaterials, we came out with the result that the loading of TiO2 with ZnO (prepared by the precipitation method) within the limit of 10 % by weight increased the photocatalytic activity of TiO2. Similarly, other studies (El Mragui et al., 2020, 2019d, 2019c) lined up, which included the effect of monodoping Cr, Mn, Co and Ni (within the limit of 10 wt%) and (P, Mo), (P, W) or (Si, W) co-doping of TiO2 nanoparticles on its physico-chemical and photocatalytic properties, lined up.
The present study investigates the impact of doping TiO2 with varying amounts of iron, offering valuable insights into the structural, optical, morphological, and photocatalytic properties of the TiO2 affected by the doping process. The interest in this doping element (Fe) is due to the similarity of its 3d electron configuration with that of Ti. In addition, its cationic radii (Fe3+: 0.65 Å (Pathak et al., 2014; Smith and Perseil, 1997); Fe2+: 0.74 Å (Ravishankar et al., 2017)) which are comparable to that of the Ti4+ (0.68 Å) (El Mragui et al., 2019d; Liu et al., 2017) may allow an easy substitution of Fe by Ti in TiO2 lattice. Furthermore, our interest in exploring the potential of Fe as a doping element in this work was sparked by the promising results reported in the literature which reported that Fe-doped TiO2 has demonstrated a notable photocatalytic activity in degrading many organic molecules including carbamazepine, methylene blue and formic acid, as evidenced by El Mragui et al. (2019b), Komaraiah et al., (2019), Majeed Khan et al., (2019) and Sayyar et al. (2015), respectively. It is also believed that Fe3+ ions can act as shallow charge traps within the lattice of TiO2, which can facilitate the separation of charge carrier and reduce the electron/hole pair recombination rate. This can potentially extend the photo-response of TiO2 into the visible region, thereby enhancing its photoactivity (Rauf et al., 2011; Fawzi Suleiman Khasawneh and Palaniandy, 2021; Khan and Swati, 2016; Sayyar et al., 2015).
In this work, undoped TiO2 and (0.5, 1 and 10 %wt) Fe-doped TiO2 nanoparticles were synthesized via wet chemical methods. The structural properties of the prepared samples were analyzed by X-ray diffraction (XRD), Fourier-transform infrared (FTIR) spectroscopy, and Raman spectroscopy. The optical properties were investigated using UV–visible (UV–Vis) diffuse reflectance (DRS) and photoluminescence (PL) spectroscopy. The composition of the surface of the samples and the electronic state of the main elements were examined by X-ray photoelectron spectroscopy (XPS). The morphology and the surface composition of the samples were examined by the scanning electron microscopy coupled to the energy dispersive X-Ray spectroscopy (SEM-EDS). The photocatalytic activity of the synthesized Fe-doped and undoped TiO2 samples was assessed under both UV-A light and visible-light irradiations, using methyl orange (MO) as an organic pollutant.
2 Materials and methods
2.1 Reagents
Iron (III) nitrate nanohydrate (FeN3O9, 9H2O; purity > 98 %) used as a precursor of iron, titanium (IV) isopropoxide (TTIP, Ti(OCH(CH3)2)4; purity > 99.99 %) used as precursor of titanium, isopropyl alcohol (IPA: C3H8O; purity 99.99 %), used as a solvent in the synthesis, all were purchased from Sigma Aldrich Chemicals (St. Louis, USA). Sodium hydroxide (NaOH; purity 98 %) as a precipitation agent and methyl orange used as a model organic pollutant (C14H14N3SO3Na; purity 99 %), all were purchased from Fisher Scientific International Company (Hampton, USA). Deionized water was used for the preparation of all solutions. All chemicals were of analytic grade and used as received without further purification.
2.2 Preparation of photocatalysts
The synthesis procedure of undoped TiO2 has been described previously (El Mragui et al., 2019a) where pure TiO2 was prepared using the sol–gel method. While in the synthesis of Fe-doped TiO2, combined methods of sol–gel and precipitation were used. As a first step in the Fe-doped TiO2 synthesis, at room temperature the TTIP (Ti(OCH(CH3)2)4) was slowly added dropwise to isopropyl alcohol with a molar ratio of 25/1 (IPA/TTIP). Then, under continuous magnetic stirring, deionized water was added dropwise (the molar ratio of H2O/TTIP of 100/1) and a white solution was obtained. In parallel, the required mass of iron precursor (Fe(NO3)3), to have x% by weight of Fe in the final product, was dissolved in distilled water under constant stirring. While heating up to 70 ◦C an aqueous solution of NaOH was added drop by drop. After 90 min of stirring and heating (70 ◦C), the obtained solution was added drop by drop to the previously prepared white solution of TiO2. The mixture was stirred for 120 min, then filtered and washed with distilled water and dried for 12 h in an oven at 100 ◦C. The obtained product was ground and annealed at 500° C in air for 3 h. The resulting material was noted as x%Fe-TiO2, where x = 0.5, 1 and 10 wt%.
2.3 Characterization of photocatalysts
The crystal phase of the prepared TiO2-based photocatalysts was performed using an X’PERT MPD_PRO diffractometer (Malvern Panalytical Ltd, Malvern, United Kingdom) with Cu Kα radiation at 45 kV and 40 mA (λ = 1.5406 Å). Fourier-transform infrared (FTIR) spectra of the samples were recorded from 400 to 4000 cm−1 using an FTIR spectrometer type JASCO 4100 (Jasco International, Tokyo, Japan) and the KBr pellet method. Raman spectra were collected at room temperature using a VERTEX 70 apparatus (Bruker Optics, Ettlingen, Germany) with 4 cm−1 of spectral resolution. The UV–vis diffuse reflectance spectra were taken using a JASCO V-570 spectrophotometer equipped with a Labsphere DRA-CA-30I integration sphere using BaSO4 as a standard. The room-temperature photoluminescence (PL) spectra were obtained with a Horiba Jovin Fluoromax 4 spectrofluorometer (HORIBA Scientific, Amadora, Portugal). The XPS analysis was performed using a Kratos AXIS Ultra HSA, with VISION software for data acquisition to obtain the surface compositions and chemical states of each element in the prepared photocatalysts. The surface charge correction was made on the assumption that the lower energy carbon C1s peak is in the reference position (285.0 eV). The fitting of peak spectra was performed with the CasaXPS software, using a Gaussian-Lorentzian peak shape and a Shirley (or linear)-type background subtraction. The morphology and elemental composition of the TiO2-based photocatalysts were inspected using scanning electron microscopy (SEM) coupled with Energy Dispersive X-Ray Spectroscopy (EDS). The SEM/EDS analysis was performed using a High resolution (Schottky) Environmental Scanning Electron Microscope with X- Ray Microanalysis and Electron Backscattered Diffraction analysis: Quanta 400 FEG ESEM/EDAX Genesis X4M. The Brunauer-Emmett-Teller (BET) surface areas were obtained at − 196 °C using an ASAP 2010 instrument.
2.4 Photocatalytic degradation tests
The photocatalytic activity of the synthesized TiO2-based photocatalysts was evaluated based on the degradation of Methyl Orange (MO), used as molecule probe, under UV-A light and visible light irradiations. The photocatalytic experiments were carried out at room temperature (26 ± 2 ◦C) in a homemade laboratory reactor. Prior to the degradation process, it was important to achieve the adsorption/desorption equilibrium of the organic impurity over the TiO2 photocatalyst surface. Therefore, the suspension was stirred using a magnetic stirrer for 60 min in dark. After that, the radiation was turned on to initiate the photocatalytic reaction for a maximum of 360 min. The photoreactor system was directly exposed to the light source in open-air conditions. In this work, to produce UV-A and visible-light irradiations, a low-pressure lamp (40 W, model Vilber, VL-340.BL, Eberhardzell, Germany) emitting UV radiation at 365 nm (light intensity ≈ 413 mW/cm2) and a commercial Feit White Compact Fluorescent lamp (23 W, cool daylight, 6500 K, 1311 Lumens, Mainhouse Electronic Co., Ltd, Xiamen, China) were used, respectively. At given intervals of irradiation times, 5 mL of suspension was withdrawn and filtered through a 0.45 μm Millipore filter. The concentration of MO in the solution was determined by measuring the absorbance at λmax = 460 nm using a UV–vis spectrophotometer (Shimadzu 2100 spectrophotometer). The photocatalytic degradation efficiency was calculated using the following expression: MO conversion (%) = 100 × (C0 − Ct)/C0 where C0 and Ct are the concentrations of MO before illumination and at t irradiation time, respectively.
3 Results and discussion
3.1 Characterization
3.1.1 X-ray diffraction
Fig. 1 exhibits the XRD patterns of undoped and Fe-doped TiO2 samples. The XRD pattern of the undoped TiO2 shows peaks that matched well with the characteristic diffraction peaks of standard TiO2 anatase phase (JCPDS file card No. 21–1272) as reported in earlier papers (El Mragui et al., 2020, 2019a). The spectra of 0.5 %wt and 1 %wt Fe-doped TiO2 show the presence of anatase phase exclusively, without any XRD peaks of iron oxides, indicating that either the Fe is successfully incorporated into the crystal lattice of anatase TiO2 or the corresponding metal oxides are well scattered on the surface of the TiO2 particles. While, the XRD pattern of 10 %wt Fe-doped TiO2 revealed the predominance of the anatase phase, in addition to the presence of iron oxides phases represented by the two most intense peaks positioned at 2θ = 33.11° (d104) and 2θ = 35.65° (d110). These peaks belonged to the Hematite α-Fe2O3 oxide (JCPDS file card No. 89–0596) (Gupta et al., 2020). A decrease in crystallinity of Fe-doped TiO2 samples, compared to undoped TiO2, was confirmed based on the observed decrease in anatase peak intensity (see inset, Fig. 1). The crystallite size values for the anatase phase of the synthesized materials were calculated using Scherrer's formula. The trend was not very clear, crystallite size increased from 7.45 to 12.94 nm when doping TiO2 with 0.5 wt% iron. Then, it begins to decrease as the iron content increases from 1.0 to 10.0 wt% where the obtained values of the crystallite size were 7.40 and 6.68 nm, respectively. The inset in Fig. 1 indicates the presence of a slight shift in the main peak of anatase (1 0 1) towards the higher angle side on the 0.5 %wt Fe-doped TiO2 XRD pattern. This shift can be explained by the alteration of the host (TiO2) network resulting from the doping process. Furthermore, it can also be associated with an increase in the crystallite size of the 0.5 %wt Fe-doped TiO2 sample.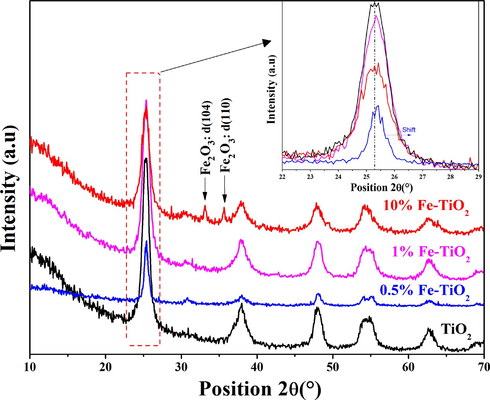
X-ray patterns of the undoped and Fe-doped TiO2 samples.
3.1.2 FTIR spectroscopy
Fig. 2 shows the FTIR absorption spectra of the undoped TiO2 and Fe-doped TiO2 samples. All the recorded spectra showed a broad band at 3420 cm−1 assigned to the OH bonds and also a low-intensity signal at 1628 cm−1 assigned to the bending vibrations of adsorbed H2O on the samples surface (Gupta et al., 2020; Zhang et al., 2019). It is worth mentioning here that the presence of the hydroxyl groups is beneficial for the photocatalytic activity of the as-prepared TiO2 samples. The OH groups play an important role in the photocatalytic process as the adsorbed OH− ions can react with the photoinduced holes and generate highly reactive hydroxide radicals (OH•). The spectrum of undoped TiO2 shows a broad band between 410 and 880 cm−1 due to the overlapping of several bands attributed to various vibration modes of Ti–O and Ti– O–Ti in TiO2 (Dong et al., 2014). This band was observed also on the spectra of Fe-doped TiO2 samples. However, we noticed a slight shift of the center of this band to the lower wavenumber. Choudhury and Choudhury (2012) as well as Gaur et al. (2019) have reported similar shifting in peak position; they concluded that this behavior is due to the formation of new metal-O bonds created upon the substitution of Ti4+ by the doping element. Herein, the FTIR results, are consistent with those of XRD and indicate that the TiO2 lattice has undergone some changes and it is very likely that the Ti4+ has been partially replaced by the doping elements (Fe3+ and/or Fe2+) in the TiO2 lattice, thus resulting in the formation of Ti-O-Fe bonds.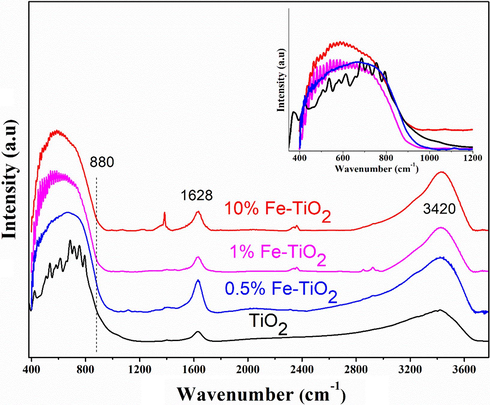
FTIR spectra of undoped and Fe-doped TiO2 samples.
3.1.3 Raman spectroscopy
Raman spectroscopy analysis is a very sensitive technique for the detection of structural defects, phase changes and bonding modifications. For this purpose, it was used to study the changes that occurred in the structural properties of TiO2-based samples during doping with iron. Fig. 3 displays the Raman spectra of undoped TiO2 and Fe-doped TiO2 samples. All spectra exhibited six Raman active modes, characteristic of the anatase phase of TiO2, Eg (145 cm−1), Eg (197 cm−1), B1g (397 cm−1), A1g + B1g (516 cm−1), and Eg (640 cm−1), (Adyani and Ghorbani, 2018; Alamgir et al., 2014). No Raman peak related to iron oxides was detected, which indicated the predominance of the anatase phase in the analyzed samples, reconfirming the obtained XRD results. Nevertheless, when Fe weight ratio is increased, drastic changes occurred in the intensity and the position of the Raman peaks of Fe-doped TiO2 samples, especially for the Eg(1) peak at 145 cm−1 (inset of Fig. 3). These results are in good agreement with those of several studies (Fagan et al., 2016; Luu et al., 2010), where the authors associated the shifting of Raman peaks to higher wavenumbers to the presence of phase change, bond modifications, and/or new bonds formation. In this work, the decrease in intensity and the dislocation of the Raman peaks towards higher wavenumbers can be linked to the bond modifications and/or formation of new bonds resulting from the incorporation of iron into the TiO2 structure, in accordance with the above-cited XRD and FTIR results.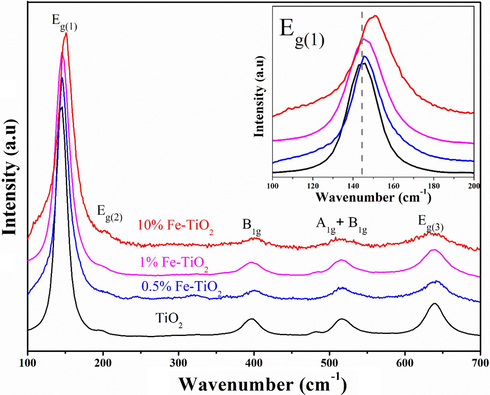
Raman spectra of undoped and Fe-doped TiO2 samples.
3.1.4 UV–vis diffuse reflectance spectroscopy
The optical properties of undoped and Fe-doped TiO2 samples have been explored using the UV–visible absorption spectroscopy. The obtained DRS spectra (Fig. 4) clearly showed that for wavelengths below to about 350 nm, TiO2 exhibited the highest absorption by comparison with the Fe-doped TiO2 samples for which the absorbance decreased all the more the percentage of Fe increased. The collected data served to estimate the band gap energy of the prepared materials using Tauc’s formula (inset of Fig. 4). The estimated optical band gap (Eg) value for undoped TiO2 was ∼ 3.11 eV, similar to that stated earlier (3.12 eV) (El Mragui et al., 2020). The band gap values of the samples containing 0.5 %wt, 1 %wt and 10 %wt of Fe were found to be 3.30, 3.32 and 3.27 eV, respectively. These values indicate that the doping of TiO2 with Fe widens its optical gap, and thus reduces the materials' sensitivity to visible light irradiation. Similar results were reported elsewhere (Choi et al., 2005; Murugadoss et al., 2014). These authors associated the increase of the band gap value and the blue shift of the material’s absorbance to many factors such as particle size, oxygen deficiency, defects in material structure, etc. (Alamgir et al., 2014).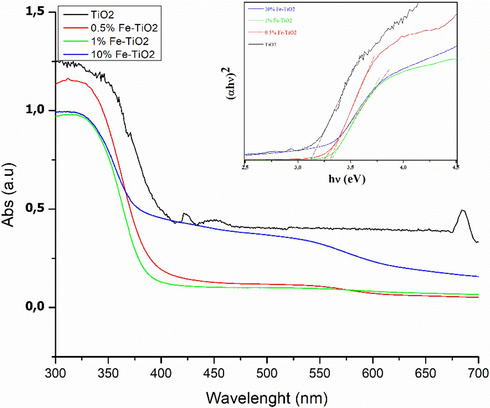
Diffuse reflectance spectra of pure TiO2 and x%Fe-TiO2 nanoparticles. Inset the Tauc’s plots for band gap energy estimation.
3.1.5 Photoluminescence spectroscopy
Fig. 5 displays the typical PL spectra of undoped and the Fe-doped TiO2 samples, recorded between 325 and 500 nm wavelengths with an excitation at 285 nm. The PL spectrum of undoped TiO2 sample, shows a strong characteristic UV emission peak centered at 357 nm associated to band-to-band charge carriers (e/h+) recombination within the band gap of TiO2 (Choudhury and Choudhury, 2013; D’Amato et al., 2018). The center of this emission peak shifted to 359 nm on the spectra of Fe-doped TiO2, which indicates that the optical properties of the Fe-doped TiO2 are not the same as that of undoped TiO2. Furthermore, the recorded UV emission peak was less intense in the Fe-doped TiO2 PL spectra, thus suggesting that Fe doping suppressed (e-/h+) pairs recombination. The delay in the charge carrier recombination is beneficial for increasing the photocatalytic activity of prepared samples because more electrons and holes can participate in redox reactions (D’Amato et al., 2018). Interestingly, the PL spectra of Fe-doped TiO2 exhibited another emission peak at 467 nm that likely arises from the oxygen vacancies created during the modification of TiO2 by Fe ions (D’Amato et al., 2018; Diak et al., 2017). These observations showed that the optical properties of TiO2 nanoparticles were affected by Fe doping.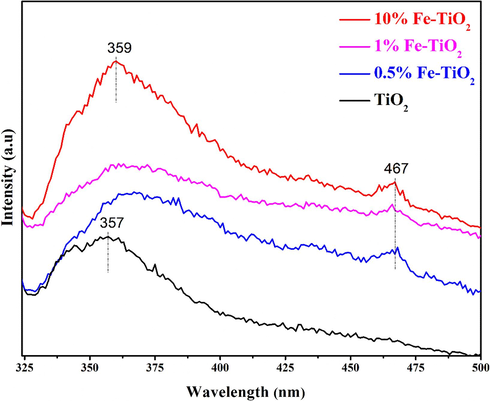
PL spectra of undoped and Fe-doped TiO2 samples.
3.1.6 X-ray photoelectron spectroscopy
XPS measurements were carried out to investigate the chemical states of the elements on the surface of undoped and Fe-doped TiO2 samples. Fig. 6 shows the XPS full scan spectra of undoped and Fe-doped TiO2 samples. Except of Ti, O, C, and Fe, no other elements were detected in the samples, which highlights the purity of the prepared samples. Fig. 7 shows the high resolution XPS spectra of Fe 2p for 1 % and 10 %wt Fe-doped TiO2 samples. Two main signals were observed at around 710.70 eV and 725 eV and were assigned to the binding energies of Fe 2p3/2 and Fe 2p1/2 levels (Majeed Khan et al., 2019), respectively confirming the presence of Fe in these samples. The deconvolution of Fe 2p3/2 and Fe 2p1/2 signals revealed the contribution of two peaks in each signal, which may be related to the coexistence of Fe3+ and Fe2+ forms of iron in Fe-doped TiO2 samples. It is noteworthy that the integrated area of the spectra of Fe3+ and Fe2+ remains practically constant for the samples 1 %Fe-TiO2 and 10 %Fe-TiO2 indicating that the percentage of Fe3+ and Fe2+ in the two samples is the same. Fig. 8 shows the high resolution XPS spectra of Ti 2p of the analyzed samples. Two signals corresponding to Ti 2p3/2 and Ti 2p1/2 levels are being observed respectively at 458.5 and 464.2 eV for undoped TiO2 (El Mragui et al., 2019d; Majeed Khan et al., 2019). These peaks match well with the characteristic peaks of Ti4+ in anatase phase as reported previously (El Mragui et al., 2019d). These signals were slightly shifted towards higher bending energy in the case of Fe-doped TiO2 samples. Their deconvolution revealed the contribution of two peaks in each one, particularly for 1 %Fe-TiO2 sample, which have been assigned to Ti3+ (at about 460 and 465 eV) and Ti4+ (at about 458.8 and 464.6 eV) forms. Indeed, Fig. 8 clearly shows that the area of the peak Ti 2p3/2 characteristic of Ti4+ decreased markedly from 67 % for TiO2 to 26 % for 1 %Fe-TiO2, then increased to 51 % for 10 %Fe-TiO2. Meanwhile, the characteristic peak of Ti3+ increased from 0 (for TiO2) to 42 % (for 1 %Fe-TiO2) and decreased to 18 % (for 10 %Fe-TiO2). Fig. 9 shows the high resolution XPS spectra of O1s electronic state of the analyzed samples. The deconvolution of O1s signals revealed the contribution of three peaks for all samples. The first one, at around 529.8 eV, was attributed to O2− within lattice TiO2 (Avilés-García et al., 2017; Majeed Khan et al., 2019; Zhou et al., 2005). The second, at about 530.5 eV, was due to the presence of oxygen vacancies in the oxygen-deficient regions within the TiO2 matrix, highlighting the presence of oxygen vacancies in the sample. It could be also assigned to Ti2O3 for undoped TiO2 and both Ti-O-Fe and Ti2O3 in the case of Fe-doped TiO2 samples. It is important to note that the integrated area of this peak increased from 15 % (for TiO2) to 56 % (for 1 %Fe-TiO2), then decreased to 33 % (for 10 %Fe-TiO2). This highlights that the maximum of the number of the oxygen vacancies was reached for the sample containing 1 wt% of Fe. This suggests that the substitution of Ti by Fe within TiO2 lattice was successful and more important in the case of 1 %wt Fe compared to 10 %wt Fe. Analogous results were reported for TiO2 doped with Co (El Mragui et al., 2020, 2019d). The last peak, at around 532 eV, was assigned to the chemisorbed of the surface hydroxyl, adsorbed H2O and/or adsorbed O2 (Aadnan et al., 2022; Majeed Khan et al., 2019). A slight shift in O1s signal position should be noted for Fe-doped TiO2 samples compared to that of undoped TiO2. This is due to the modification of the O surrounding environment due to Fe doping process.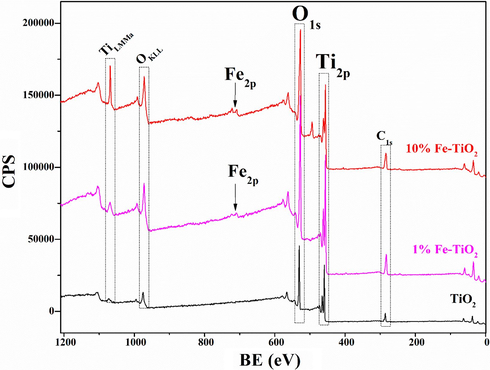
Full scan XPS spectra of pure and Fe-doped TiO2 nanomaterials.
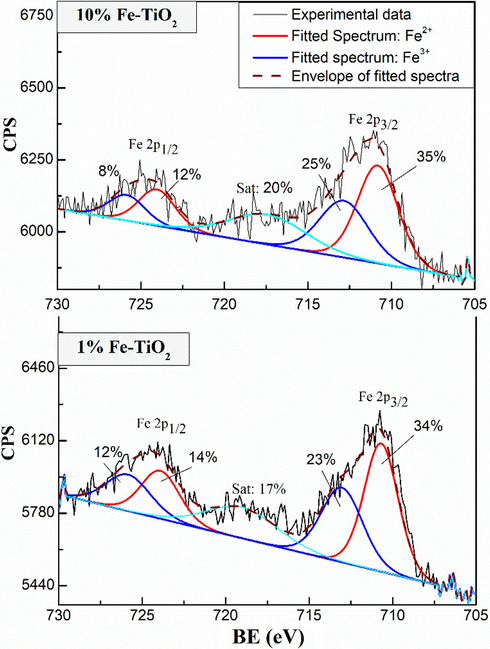
High-resolution spectra of Fe2p of Fe-doped TiO2 samples.
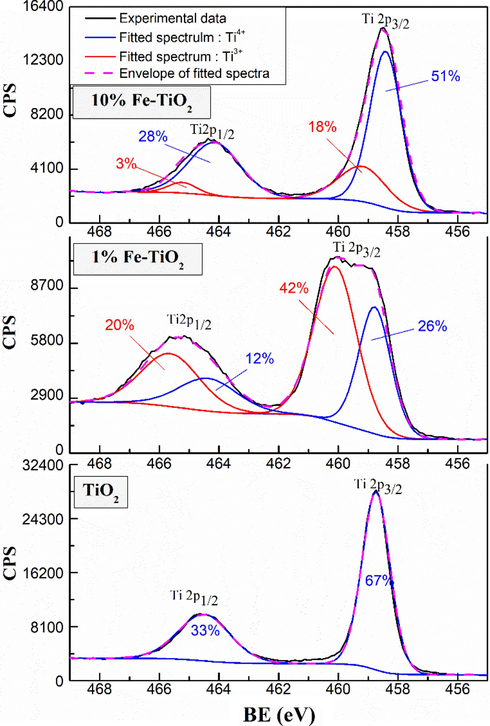
High-resolution spectra of Ti2p of undoped and Fe-doped TiO2 samples.
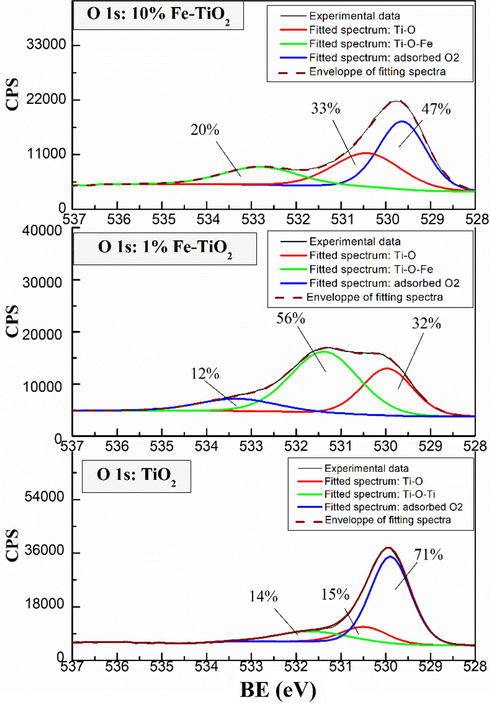
High-resolution spectra of O1s of undoped and Fe-doped TiO2 samples.
3.1.7 SEM-EDS
The morphologies of the pure TiO2, 1 %Fe-TiO2 and 10 %Fe-TiO2 nanoparticles have been explored by SEM coupled to EDS for elemental analysis. The resulted images are depicted in Fig. 10. It can be seen that the undoped TiO2 particles are highly agglomerated even if their shape looks spherical. The particles size distribution showed that undoped TiO2 particles size is between 8 and 10 nm. The morphologies of Fe-doped TiO2 particles remains the same as those of undoped TiO2. This behavior suggests that neither the doping element nor its concentration has an impact on TiO2 particles shape. Nevertheless, the average particles size showed a slight increase when the amount of Fe increases in the sample. Thus, it increased from about 9 nm for TiO2 to about 11 nm for 1 %Fe-TiO2 and about 13 nm for 10 %Fe-TiO2, suggesting that doping TiO2 could promote the crystalline growth of TiO2 particle. The elemental study made by EDS analysis confirmed the purity of the prepared samples by showing only signals associated to the doping element (Fe) presented on the surface of the samples alongside to Ti, O, C and Au, Pd (used for coating the samples). The results of the herein morphological study are similar to those reported by (Komaraiah et al., 2019). Except that they have observed less aggregation for Fe-doped TiO2 samples compared to undoped TiO2.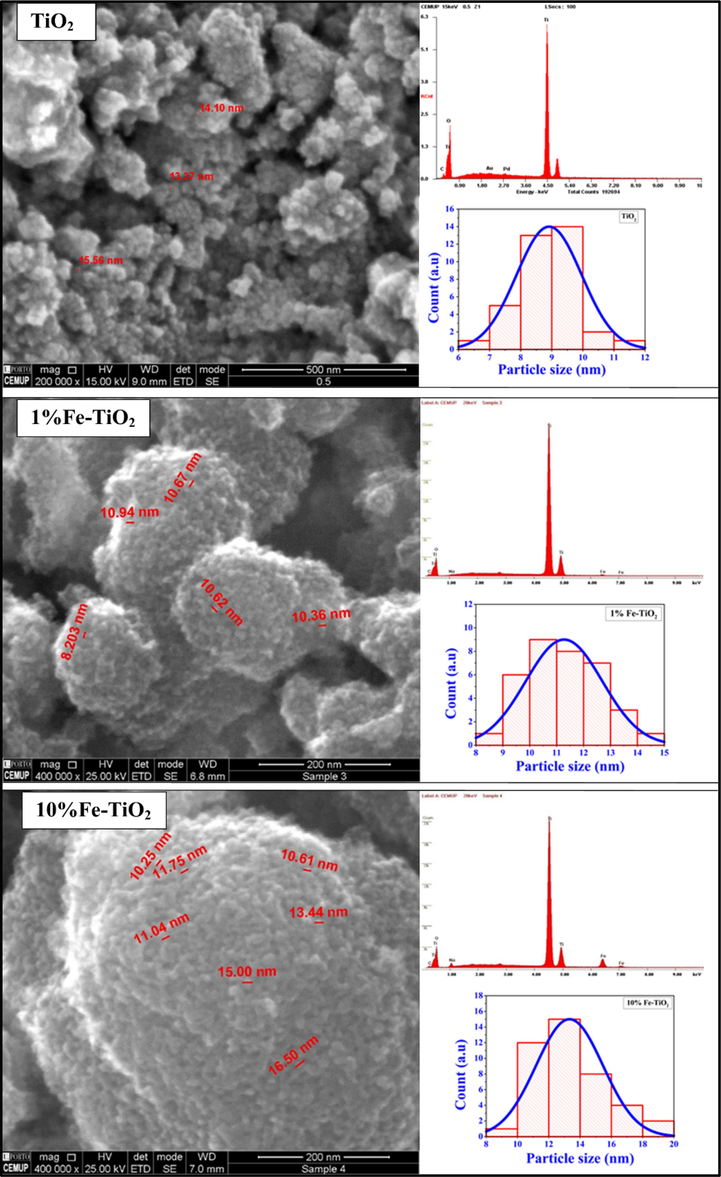
SEM-EDS images of undoped and Fe-doped TiO2 samples.
3.1.8 Surface area
Fig. 11a shows the nitrogen adsorption/desorption isotherms of pure TiO2 and 1 %Fe-TiO2 nanomaterials. The corresponding pore size distribution curves, obtained using the BJH method, are shown in Fig. 11b. As it can be seen from Fig. 11a, the two isotherms are similar and are all of type IV according to the IUPAC classification, and presenting a H2 hysteresis loop. This type of hysteresis is characteristic of mesoporous solids for which the size distribution and shape of the pores are not uniform. The obtained surface areas of TiO2 and 1 %Fe-TiO2 measured using the BET method were 218 and 134 m2/g, respectively. The significant decrease in the surface area of the sample containing Fe is probably due to the filling of the pores of TiO2 with iron oxide nanoparticles since the obtained average pore size (about 20 Ả) is below to that of bare TiO2 (43 Ả).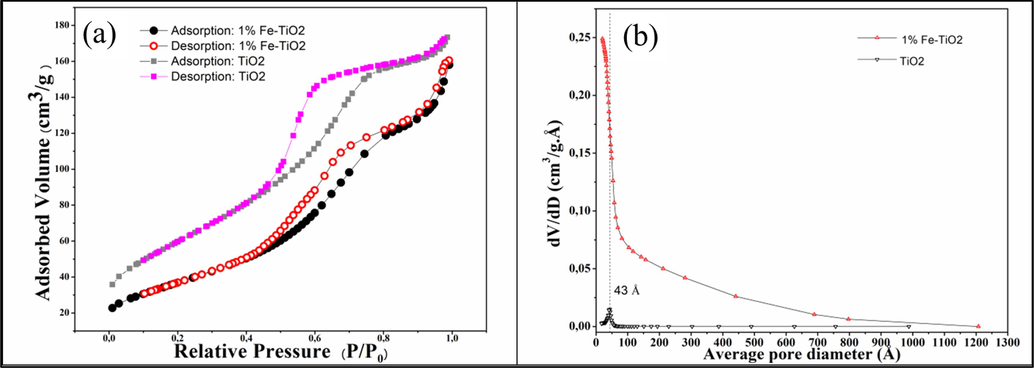
(a) N2 adsorption/desorption isotherm at −196 °C and (b) BJH Pore size distribution of TiO2 and 1 %Fe-TiO2 samples.
3.2 Evaluation of the photocatalytic activity
The photocatalytic activity of the undoped and Fe-doped TiO2 nanomaterials was evaluated under both UV-A and visible light irradiation toward the methyl orange degradation (MO). We remind here, that photolysis experiments were conducted in previous work under UV and visible light irradiation (El Mragui et al., 2019d), and it has been shown that only 2.9 % of the MO was degraded. Thus, we concluded that the contribution of light (either UV-A or visible light) in the direct degradation of methyl orange was minimal. Fig. 12a and b show the curves of MO removal as a function of irradiation time under UV-A and visible light, respectively, in the presence of the undoped and Fe-doped TiO2 nanomaterials. Prior to starting the irradiation for each of the photocatalytic experiments, the reaction was kept in dark for 60 min in order to achieve the adsorption–desorption equilibrium. It can be seen that various kinetics were obtained: under UV light irradiation, 0.5 %Fe-TiO2 showed the highest photocatalytic activity towards MO degradation with 98.61 % MO removal reached in 120 min, whereas undoped TiO2 showed 95.62 % MO removal for the same duration. We observed a relationship between the photocatalytic performance of the materials under UV irradiation and the amount of iron they contain. The more Fe is present in the sample, the lower is its photocatalytic performance. Therefore, the slower process, with only 35.72 % MO removal, was obtained in presence of the photocatalyst containing 10 wt% of Fe. Under visible light irradiation, in presence of undoped TiO2 only 16.3 % MO removal has been obtained after 300 min under irradiation, which is low compared to that obtained under UV irradiation. Undoped TiO2 presented the best photocatalytic performance compared to the Fe-doped TiO2 samples. Here too, the more Fe is in the sample, the weaker its photocatalytic performance (12.5 %, 7.46 % and 5.83 % MO removal for 0.5 %Fe-TiO2, 1 %Fe-TiO2 and 10 % Fe-TiO2, respectively).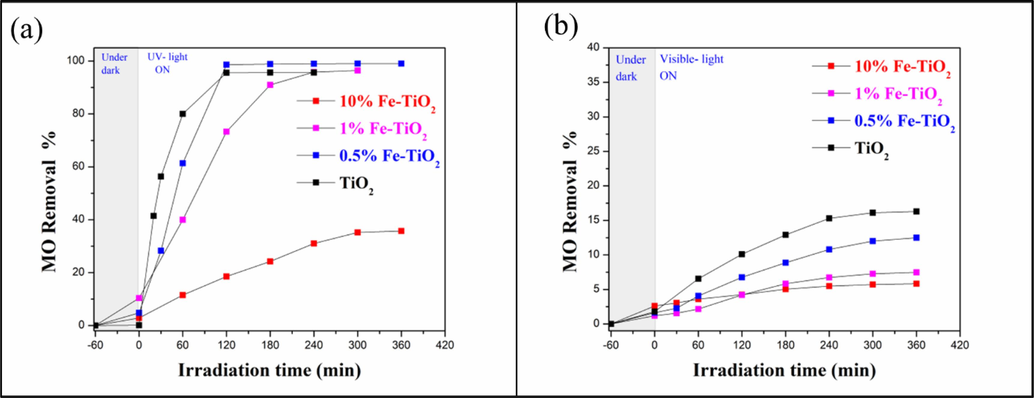
MO degradation as a function of irradiation time under UV-A (a) and visible light (b) in the presence of undoped and Fe-doped TiO2 samples.
Numerous studies have reported similar observations regarding the effect of iron doping on the behavior of TiO2 with enhanced photocatalytic activity being achieved for materials with low iron content. In a successful attempt to synthesize Fe2O3-TiO2 nanocomposites with varying doping concentrations (ranging from 0.0 to 5.0 wt%), Banisharif et al. (2015) arrived at the conclusion that samples containing 0.1 wt% Fe2O3-TiO2 exhibited the highest photocatalytic activity when degrading trichloroethylene. In a separate study, Ramírez-Sánchez and Bandala (2018) synthesized materials containing Fe2O3-TiO2 (ranging from 0.0 to 1.0 wt%). The researchers observed that the photocatalytic performance of 0.3 wt%-Fe2O3-TiO2 was enhanced compared to that of bare TiO2. Both studies arrived at the same conclusion: the presence of Fe cations (at optimal levels) can serve as mediators for interfacial charge transfer, leading to improved lifetime of e− and h+ through electron-hole trapping at the Fe centers. As a result, the photocatalytic activity of the material is enhanced. Both authors found that exceeding the optimal iron content can significantly hinder the photocatalytic performance of the base material. This is because a high concentration of iron can induce electron-hole recombination, which competes with the redox reactions occurring on the photocatalyst's surface (Banisharif et al., 2015; Carp et al., 2004; Ramírez-Sánchez and Bandala, 2018).
Conversely, other researchers (Abbas et al., 2016; Ahmed et al., 2013) utilized the sol–gel method to produce Fe2O3-TiO2 nanoparticles and found that samples doped with 5 % and 7 % of Fe2O3 exhibited the highest photocatalytic activity for methylene blue degradation. further increase in Fe2O3 content in TiO2 leads to larger particle sizes and a lower surface area, ultimately resulting in reduced photocatalytic performance (Abbas et al., 2016; Ahmed et al., 2013). It is noteworthy that this variation in optimal Fe doping content could be closely related to the particle size of the TiO2 photocatalyst, as suggested by (Zhu et al., 2004).
As for the present study, the enhanced photocatalytic activity of 0.5 wt% Fe-doped TiO2 compared to bare TiO2 can be related to the successful suppression of charge carrier (e-, h+) recombination, as suggested by the PL results and in consistency with those of structural studies.
Despite the low recombination rate of electrons and holes revealed by the PL analyses for Fe-doped TiO2 materials, their low photocatalytic activity under visible light was expected due to the wide band gap of TiO2 anatase (Eg = 3.11 eV) which has become wider by doping with Fe. In fact, undoped or Fe doped TiO2 materials are not absorbing wavelengths of visible light efficiently. Thus, the (e−/h+) pairs, which play an essential role in photocatalytic reactions, are not being photogenerated efficiently under visible-light irradiation compared to when the materials are under UV irradiation.
4 Conclusion
In this work, undoped, 0.5 %wt, 1 %wt and 10 %wt Fe-doped TiO2 nanoparticles were successfully prepared via wet chemical by combining sol–gel and precipitation methods. The prepared nanomaterials are used as photocatalysts for water decontamination. The XRD, FTIR and Raman analyses results showed the predominance of anatase in all samples, and highlighted the insertion of Fe within TiO2 lattice. The optical study conducted by DRS and PL spectroscopy showed that doping TiO2 with Fe widen its band gap and suppressed the charge carrier’s recombination. The XPS results confirmed the purity of the samples, and suggested the substitution of Ti4+ by Fe3+ and/or Fe2+ within TiO2 network. The morphological study showed that the shape of TiO2 particles was not impacted by doping with Fe, however, the average size of TiO2 particles increased. The photocatalytic tests, under either UV light or visible light in the presence of the as-prepared nanomaterials, highlighted a strong dependence with Fe amount. It was found that, under UV-A light irradiation, the sample containing 0.5 wt% of Fe exhibited the best MO removal. The enhanced photocatalytic activity has been attributed to the efficient charge separation of electrons and holes. While under visible light irradiation, the undoped TiO2 remains the best photocatalyst for MO removal.
CRediT authorship contribution statement
Abderrahim El Mragui: Investigation, Methodology, Writing – original draft. Imane Aadnan: Investigation. Omar Zegaoui: Conceptualization, Validation, Visualization, Writing – original draft, Writing – review & editing. Joaquim C.G. Esteves da Silva: Writing – review & editing.
Acknowledgments
The authors thank the CCA (Faculty of Sciences, Moulay Ismail University of Meknes, Morocco), the CITT (Moulay Ismail University of Meknes, Morocco), the UATRS (CNRST, Rabat, Morocco), and the CEMUP (University of Porto, Portugal) for their technical supports.
Declaration of competing interest
The authors declare that they have no known competing financial interests or personal relationships that could have appeared to influence the work reported in this paper.
References
- Structural, optical and photocatalytic properties of Mn doped ZnO nanoparticles used as photocatalysts for azo-dye degradation under visible light. Catalysts. 2022;12:1382.
- [CrossRef] [Google Scholar]
- Sol–gel synthesis of TiO2-Fe2O3 systems: Effects of Fe2O3 content and their photocatalytic properties. J. Ind. Eng. Chem.. 2016;39:112-120.
- [CrossRef] [Google Scholar]
- A comparative study of physicochemical and photocatalytic properties of visible light responsive Fe, Gd and P single and tri-doped TiO2 nanomaterials. J. Rare Earths. 2018;36:72-85.
- [CrossRef] [Google Scholar]
- Photocatalytic degradation of methylene blue dye using Fe2O3/TiO2 nanoparticles prepared by sol–gel method. J. Alloy. Compd.. 2013;553:19-29.
- [CrossRef] [Google Scholar]
- Alamgir, Khan, W., Ahmad, S., Mehedi Hassan, M., Naqvi, A.H., 2014. Structural phase analysis, band gap tuning and fluorescence properties of Co doped TiO2 nanoparticles. Opt. Mater. (Amst). 38, 278–285. https://doi.org/10.1016/j.optmat.2014.10.054.
- W and Mo doped TiO2: Synthesis, characterization and photocatalytic activity. Fuel. 2017;198:31-41.
- [CrossRef] [Google Scholar]
- Highly active Fe2O3-doped TiO2 photocatalyst for degradation of trichloroethylene in air under UV and visible light irradiation: Experimental and computational studies. Appl. Catal. B Environ.. 2015;165:209-221.
- [CrossRef] [Google Scholar]
- Photoinduced reactivity of titanium dioxide. Prog. Solid State Chem.. 2004;32:33-177.
- [CrossRef] [Google Scholar]
- Effect of cobalt doping on the device properties of Sb2S3-sensitized TiO2 solar cells. Sol. Energy. 2019;183:697-703.
- [CrossRef] [Google Scholar]
- Increasing solar absorption for photocatalysis with black hydrogenated titanium dioxide nanocrystals. Science. 2011;331:746-750.
- [CrossRef] [Google Scholar]
- Size effects in the Raman spectra of TiO2 nanoparticles. Vib. Spectrosc. 2005;37:33-38.
- [CrossRef] [Google Scholar]
- Luminescence characteristics of cobalt doped TiO2 nanoparticles. J. Lumin.. 2012;132:178-184.
- [CrossRef] [Google Scholar]
- Oxygen vacancy and dopant concentration dependent magnetic properties of Mn doped TiO2 nanoparticle. Curr. Appl Phys.. 2013;13:1025-1031.
- [CrossRef] [Google Scholar]
- Enhancement of visible-light photoactivity by polypropylene coated plasmonic Au/TiO2 for dye degradation in water solution. Appl. Surf. Sci.. 2018;441:575-587.
- [CrossRef] [Google Scholar]
- Photoactivity of decahedral TiO2 loaded with bimetallic nanoparticles: Degradation pathway of phenol-1- 13 C and hydroxyl radical formation. Appl. Catal. B Environ.. 2017;200:56-71.
- [CrossRef] [Google Scholar]
- Hydrothermal synthesis of mixed crystal phases TiO2-reduced graphene oxide nanocomposites with small particle size for lithium ion batteries. Int. J. Hydrogen Energy. 2014;39:16116-16122.
- [CrossRef] [Google Scholar]
- Influence of the preparation method and ZnO/(ZnO + TiO2) weight ratio on the physicochemical and photocatalytic properties of ZnO-TiO2 nanomaterials. Catal. Today. 2019;321–322:41-51.
- [CrossRef] [Google Scholar]
- Synthesis of Fe- and Co-doped TiO2 with improved photocatalytic activity under visible irradiation toward carbamazepine degradation. Materials (Basel). 2019;12:3874.
- [CrossRef] [Google Scholar]
- Synthesis, characterization and photocatalytic properties under visible light of doped and co-doped TiO2-based nanoparticles. Mater. Today:. Proc.. 2019;13:857-865.
- [CrossRef] [Google Scholar]
- Preparation, characterization, and photocatalytic activity under UV and visible light of Co, Mn, and Ni mono-doped and (P, Mo) and (P, W) co-doped TiO2 nanoparticles: a comparative study. Environ. Sci. Pollut. Res.. 2019;1–16
- [CrossRef] [Google Scholar]
- Elucidation of the photocatalytic degradation mechanism of an azo dye under visible light in the presence of Cobalt doped TiO2 nanomaterials. Chemosphere 2020:128931.
- [CrossRef] [Google Scholar]
- Photocatalytic properties of g-C3N4-TiO2 heterojunctions under UV and visible light conditions. Materials (Basel). 2016;9
- [CrossRef] [Google Scholar]
- Fawzi Suleiman Khasawneh, O., Palaniandy, P., 2021. Removal of organic pollutants from water by Fe2O3/TiO2 based photocatalytic degradation: A review. Environ. Technol. Innov. https://doi.org/10.1016/j.eti.2020.101230.
- Electrochemical photolysis of water at a semiconductor electrode. Nature. 1972;238:37-38.
- [CrossRef] [Google Scholar]
- Laser induced phase transformation influenced by Co doping in TiO2 nanoparticles. J. Alloy. Compd.. 2019;780:25-34.
- [CrossRef] [Google Scholar]
- Photocatalytic degradation of organic pollutants over MFe2O4 (M = Co, Ni, Cu, Zn) nanoparticles at neutral pH. Sci. Rep.. 2020;10:1-11.
- [CrossRef] [Google Scholar]
- Fe3+-doped anatase TiO2 with d-d transition, oxygen vacancies and Ti3+ centers: Synthesis, characterization, UV-vis photocatalytic and mechanistic studies. Ind. Eng. Chem. Res.. 2016;55:6619-6633.
- [CrossRef] [Google Scholar]
- Structural, optical and photoluminescence studies of sol-gel synthesized pure and iron doped TiO2 photocatalysts. Ceram. Int.. 2019;45:25060-25068.
- [CrossRef] [Google Scholar]
- Mesoporous black TiO2/MoS2/Cu2S hierarchical tandem heterojunctions toward optimized photothermal-photocatalytic fuel production. Chem. Eng. J. 2022:427131830.
- [CrossRef] [Google Scholar]
- Recent progress in defective TiO2 photocatalysts for energy and environmental applications. Renew. Sustain. Energy Rev.. 2022;156:111980
- [CrossRef] [Google Scholar]
- Mo-N-co-doped mesoporous TiO2 microspheres with enhanced visible light photocatalytic activity. Mater. Res. Bull.. 2017;96:10-17.
- [CrossRef] [Google Scholar]
- Synthesis and characterization of Fe-doped TiO2 photocatalyst by the sol-gel method. Adv. Nat. Sci. Nanosci. Nanotechnol.. 2010;1
- [CrossRef] [Google Scholar]
- Role of Fe doping in tuning photocatalytic and photoelectrochemical properties of TiO2 for photodegradation of methylene blue. Opt. Laser Technol.. 2019;118:170-178.
- [CrossRef] [Google Scholar]
- Systematic investigation of structural and morphological studies on doped TiO2 nanoparticles for solar cell applications. Superlattice. Microst.. 2014;76:349-361.
- [CrossRef] [Google Scholar]
- Photoluminescence and EPR studies on Fe3+ doped ZnAl2O4: An evidence for local site swapping of Fe3+ and formation of inverse and normal phase. Dalt. Trans.. 2014;43:9313-9323.
- [CrossRef] [Google Scholar]
- Fabrication of TiO2/ZnO nanocomposites for solar energy driven photocatalysis. Mater. Sci. Semicond. Process.. 2017;61:114-124.
- [CrossRef] [Google Scholar]
- Photocatalytic degradation of estriol using iron-doped TiO2 under high and low UV irradiation. Catalysts. 2018;8:625.
- [CrossRef] [Google Scholar]
- An overview on the photocatalytic degradation of azo dyes in the presence of TiO2 doped with selective transition metals. Desalination 2011
- [CrossRef] [Google Scholar]
- Optical and magnetic properties of PbS thin films doped with Fe2+ ions. Optik (Stuttg).. 2017;134:121-127.
- [CrossRef] [Google Scholar]
- Kinetic study of formic acid degradation by Fe3+ doped TiO2 self-cleaning nanostructure surfaces prepared by cold spray. Appl. Surf. Sci.. 2015;335:1-10.
- [CrossRef] [Google Scholar]
- Sb-rich rutile in the manganese concentrations at St. Marcel-Praborna, Aosta Valley, Italy: petrology and crystal-chemistry. Mineral. Mag.. 1997;61:655-669.
- [CrossRef] [Google Scholar]
- Synthesis of particulate hierarchical tandem heterojunctions toward optimized photocatalytic hydrogen production. Adv. Mater.. 2018;30:1804282.
- [CrossRef] [Google Scholar]
- Photocatalytic activity of N, Fe and Cu co-doped TiO2 nanoparticles under sunlight. Curr. Res. Green Sustain. Chem.. 2021;4:100186
- [CrossRef] [Google Scholar]
- Activation of persulfate with 3D urchin-like CoO-CuO microparticles for DBP degradation: A catalytic mechanism study. Sci. Total Environ.. 2019;655:614-621.
- [CrossRef] [Google Scholar]
- Well-ordered large-pore mesoporous anatase TiO2 with remarkably high thermal stability and improved crystallinity: Preparation, characterization, and photocatalytic performance. Adv. Funct. Mater.. 2011;21:1922-1930.
- [CrossRef] [Google Scholar]
- Ordered mesoporous black TiO2 as highly efficient hydrogen evolution photocatalyst. J. Am. Chem. Soc.. 2014;136(26):9280-9283.
- [CrossRef] [Google Scholar]
- Preparation and photocatalytic activity of Fe-doped mesoporous titanium dioxide nanocrystalline photocatalysts. Mater. Chem. Phys.. 2005;93:159-163.
- [CrossRef] [Google Scholar]
- Characterization of Fe-TiO2 photocatalysts synthesized by hydrothermal method and their photocatalytic reactivity for photodegradation of XRG dye diluted in water. J. Mol. Catal. A Chem.. 2004;216:35-43.
- [CrossRef] [Google Scholar]


