

Translate this page into:
Plasma treatment by gliding arc discharge of dyes/dye mixtures in the presence of inorganic salts
*Corresponding author. Address: BP 188, Université de Mostaganem, 27000, Algeria. Tel./fax: +213 45206476 a.addou@univ-mosta.dz (A. Addou)
-
Received: ,
Accepted: ,
This article was originally published by Elsevier and was migrated to Scientific Scholar after the change of Publisher.
Peer review under responsibility of King Saud University.

Available online 5 February 2011
Abstract
The gliding arc discharge plasma (GAD) technique was used for discoloration and degradation of an anthraquinone dye Alizarin red S (ARS), an azo dye Orange G (OG) and their mixture. The influence of chloride and sulfate salts on the efficiency of treatment has also been studied. The aim of this study is the discoloration and degradation by GAD of ARS, and OG and their mixture.
The GAD plasma generated between two moist air metallic electrodes connected to a high voltage produced chemical species and highly reactive molecules •OH, NO•, O•, O2, HO2•, H•, H2O2, O3 … and other excited-state neutral molecules. The reactions of discoloration for ARS and OG followed pseudo-first-order kinetics. The apparent kinetic constants of bleaching were found equal to 0.014 and 0.013 min−1 and degradation of 0.008 and 0.010 min−1, respectively for the ARS and OG. For mixtures, the rate of discoloration was 80% in 120 min of treatment for mixtures III, IV and V, while the rate of COD reduction was fast in the first 30 min since it varied between 35% and 40% for all mixtures but stabilized at 68% toward the end of the treatment. The addition of chloride salts and sulfate showed a decrease in the effectiveness of treatment.
GAD treatment is perfectly suited to dyes treatment. It is an alternative method that is part of green chemistry and sustainable development objectives.
Keywords
Gliding arc discharge
Alizarin red S
Orange G
Mixtures
Treatment
Degradation

1 Introduction
Anthraquinone and azo dyes, representing two classes of dyes commonly used in the textile industry, have bio-refractory and carcinogenic characters (Bouzaida et al., 2004; Dai et al., 1995). Their treatment before release into the wild is necessary. The organic and conventional treatments (coagulation/flocculation, adsorption and biodegradation, activated carbon, reverse osmosis and ultrafiltration, ... (Vandevivere et al., 1998) became ineffective due to high number of benzene cycles generated, high stability and resistance of new output molecules (Konstantinou and Albanis, 2004). Effluents containing these types of dyes are characterized by a strong color, highly fluctuating pH, high chemical oxygen demand (COD) and biological oxygen demand (BOD) and severe biotoxicity (Shen et al., 2001; Cisneros et al., 2002a,b; Karkmaz et al., 2004). The dye’s strong color causes considerable damage to the effluent (Mozia et al., 2005). Inorganic salt presence makes the coloration important and the effluent rich and stable.
In recent years, advanced oxidation processes (AOPs) that generate hydroxyl radicals •OH in sufficient quantity are more efficient in water treatment. Common AOPs, including application of technologies, such as Fenton reaction (Alshamsi et al., 2007), photo-Fenton process, electro-Fenton process, ozonation, photo catalysis, non-thermal plasma, irradiation by ultrasonic (Chacon et al., 2006; Panizza and Cerisola, 2009; Ulson de Souza et al., 2010; Bansal et al., 2010; Abdelmalek et al., 2004; Onat et al., 2010; Sayan, 2006), are all applied to investigate the degradation of the anthraquinonic and azo dyes. Gliding arc discharge, an initially proposed tool by Czenichovski (1994) has been found especially suitable for degrading dyes, which are the most-used textile colorants and were generalized by other authors (Abdelmalek et al., 2006; Doubla et al., 2008). This technique produces non-thermal plasma at atmospheric pressure generated by an electric arc supplied by a plasma gas, generally air. Treatment effectiveness is due to the formation of chemical species, neutral molecules and molecules in excited states such as highly reactive •OH, NO•, O•, O2, O•, HO2•, H•, H2O2, O3... The most reactive species is the hydroxyl radical, which has an oxidation potential E° (•OH/H2O) = 2.8 V vs. Normal hydrogen electrode (NHE) can attack the most part of organic molecules with rate constants usually in the order of 106–109 M−1 s−1 (Burlica et al., 2004; Abdelmalek et al., 2008; Andreozzi et al., 1999).
The probable reactions mechanisms taking place are listed as follows:
Therefore, the aim of this study is to use the same technique and investigate the discoloration and degradation by gliding arc discharge (GAD) produced reactive species on aqueous solutions of an anthraquinone dye, Alizarin red S (ARS), an azo dye Orange G (OG) and their mixture in different proportions. The study also focused on the influence of chlorides and sulfates often present in textile wastewaters. Both dyes are extensively used in the textile industry and are considered mutagenic poisons, suspected of being carcinogenic (Zucca et al., 2008; Lachheb et al., 2002; Xu and Li, 2010).
The advantage of the GAD technique we are using is that it is very efficient, generates reactive •OH radicals able to degrade highly resistant pollutants and does not require additional chemicals or catalysts which can be seen as a clean technology.
2 Materials and methods
2.1 Materials and reagents
Alizarin red S (ARS), formulae C14H7NaO7S (9,10 dihydroxy-9,10 dioxo-2 anthracenesulfonic acid) and azo dye Orange G (OG), C16 H10 N2 Na2 O7 S2 (7 hydroxy-8 phenyl azo-7,3-naphtalenedisulfonic acid), were purchased from Acro Organics. The chemical structure and absorption spectra of ARS, OG and their mixtures of different composition are shown in Fig. 1a–c. All solutions were made from analytical-grade chemicals. Distilled water was used to make the dye solutions of desired concentration. The pH of the aqueous dye solution is 6.5 for ARS and OG.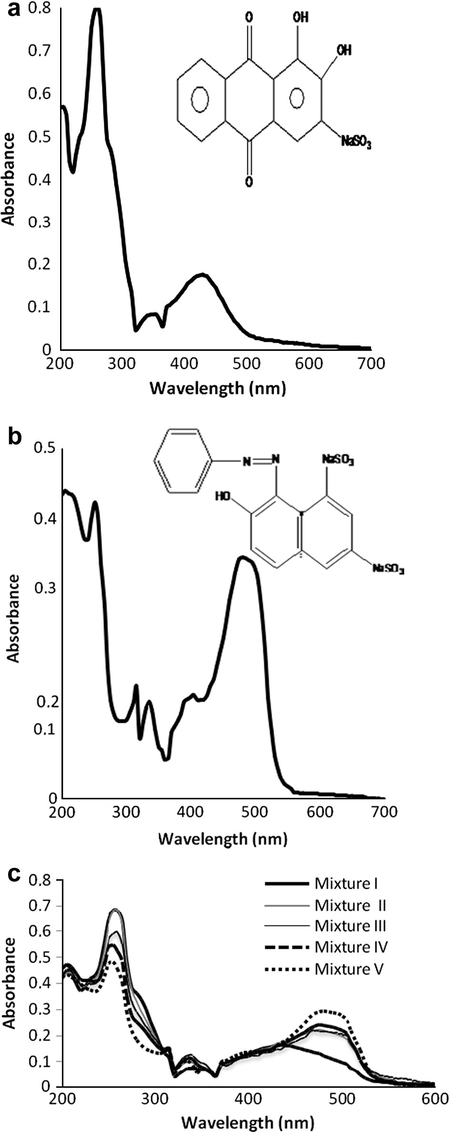
(a) Absorption spectra of ARS. (b) Absorption spectra of OG. (c) Absorption spectra of mixture of ARS and OG.
2.2 Plasma-producing apparatus
The experimental apparatus of the glidarc plasma used is shown in Fig. 2. Compressed gas is led through a bubbling water flask to get water-saturated. The gas flow then is driven between two semi elliptic electrodes connected to a 220 V/10 kV high voltage Aupem Sefli transformer. It produces an alternative potential difference of 10 kV and a current intensity of 100 mA, the power used was 1 kW, with a very interesting energy cost. An electric arc formed between two diverging electrodes raised to a convenient voltage difference at the minimum gap. The arc is pushed away from the ignition point by the feeding gas flow, sweeps along the maximum length of the electrode gap and forms a relatively large non thermal plasma zone. A new arc then appears and develops according to the same procedure. The resulting plasma is actually quenched at atmospheric pressure and quasi-ambient temperature. The diffusion process in the liquid is improved by conversion in the liquid phase due to the airflow and magnetic stirring.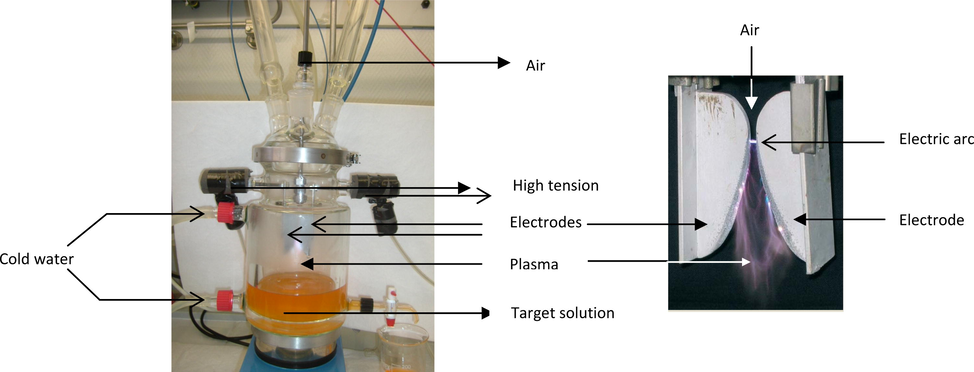
Gliding arc apparatus.
A 160 mL solution is placed into the 500 mL Pyrex closed reactor equipped with a cooling system to avoid evaporation. The treatment is done with predetermined functioning parameters. The gas flow is fixed at: Q = 800 L/h, the minimum gap between the electrodes: e = 2 mm, the diameter of the nozzle: Φ = 1 mm and the distance between the electrodes and the target liquid surface: d = 3 cm. The solution is permanently magnetically stirred and the temperature is maintained at 20 ± 2 °C in the cryostat.
2.3 Procedure and analytical methods
The treated solutions were concentrated to 335 μmol L−1 for the ARS and 223 μmol L−1 for the OG. The mixtures were prepared in the following volume proportions VARS/VOG: 1/4 (mixture I), 2/3 (mixture II), 1/1 (mixture III), 3/2 (mixture IV) and 4/1 (mixture V). The solutions were treated first alone and then added with chloride and sulfate solutions at 1, 2, 3, 4, 5 g L−1 concentrations and then with mixtures of chloride and sulfate solutions at the overall concentration of 5 g L−1. A volume of 160 mL of different ARS (335 μmol L−1) and OG (223 μmol L−1) aqueous solutions was introduced in the reactor. The treatment of the dye solution and their mixture was investigated as a function of plasma-exposure time t (0, 10, 20, 30, 60, 90, 120 min).
The UV–Vis spectrophotometer used for the determination of dye disappearance kinetics was an Optizen Discharge 2011 spectrometer. The discoloration rate of dyes solutions and their mixtures was performed spectrophotometrically at their respective absorption wavelength peak λmax at 430 and 480 nm for ARS and OG, respectively. Mixtures showed a large adsorption band at λmax = 430 nm for mixture I and 480 nm for the others. Each plot was determined at the absorbance peak of each dye. The degradation kinetics was determined from the chemical oxygen demand (COD). The COD relevant to various samples and various treatment times were measured by the potassium dichromate standard method (Collectif AFNOR, 1999a,b). COD and color removal ratios were calculated as follows:
3 Results and discussion
3.1 Plasmachemical GAD treatment
3.1.1 Effect of pH
The influence of pH was studied on witness samples treatment outside GAD. Solutions of ARS and OG were adjusted to pH values ranging from 1 to 6 and their absorbencies were measured respectively at their maximum wavelength (λmax). No change in the intensity of the corresponding absorption bands was noticed. Thus, any decrease in the intensity of the band would be assigned to the GAD treatment and not to the acidifying power due to the formation of nitrous and nitric acids in the solution. It reached a pH of 2 in the first 2 min of treatment (diffusion of NOx in situ generated) (Eqs. ()()()()(7)–(10),) (Marouf-Khelifa et al., 2006).
3.1.2 Study of discoloration
The colored solutions were studied by spectrophotometry measurements. The UV–Vis spectrum of each dye solution was scanned, and the wavelength of the absorbance peak determined in the visible range. The spectrum corresponding to Alizarin red S before treatment (Fig. 1a) is characterized by a band in the visible region whose maximum absorbance corresponds to 430 nm characterizing the chromophore group and two bands located at 260 and 345 nm are attributed to the benzene cycles substituted by groups (Burlica et al., 2004) and to the anthraquinonic part.
The orange G presents an absorption band at 260 nm attributed to multisubstituted benzene rings (Czenichovski, 1994; Vinadgopal and Wynkop, 1996; Donalgic and Levec, 1998), a band at 330 nm characteristic of the naphthalene ring and a very intense third one at 480 nm, corresponding to the azo link. For mixtures, UV–Vis spectra are similar to that of the major dye. The UV–Vis spectra obtained for all the plasma-treated dye solutions show a decrease in the intensity of the absorbance peaks, respectively, for ARS (Fig. 3) and OG (Fig. 4).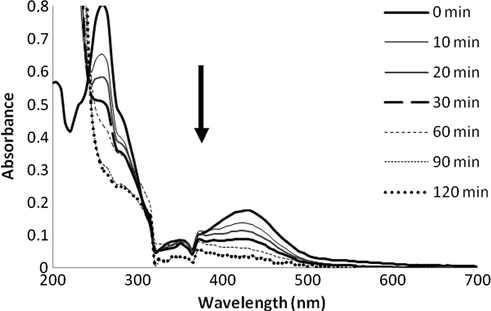
Spectral evolution of a plasma-treated ARS aqueous solution.
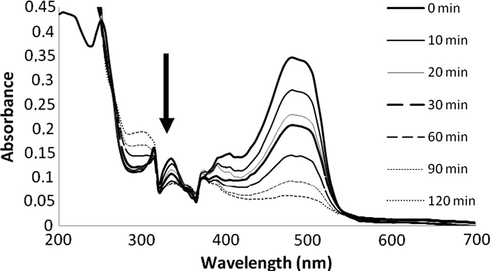
Spectral evolution of a plasma-treated OG aqueous solution.
Although the absorbance peaks in the visible region of the two selected dyes disappear during the plasma treatment, new absorbance peaks around 200 and 240 nm appear in the meantime, suggesting that new species with simplified structures form. The 240 nm absorption peak seams to increase, the 280 nm decrease for ARS and increase for OG under plasma treatment. For ARS and OG, another peak at 240 nm appears that can be attributed to multisubstituted benzene rings (e.g., benzenedicarboxylic acids) (Cisneros et al., 2002a,b) coming from the degradation of the naphthalene ring. However, this assumption remains equivocal, because the absorption band of nitrites at λ < 250 nm might interfere with the spectra of the organic moieties. Progressive discoloration was total after 120 min of treatment.
The results show that for treatment times of 30, 60 and 120 min, the discoloration rate were 47%, 65% and 82% for ARS and 38%, 57% and 82% for OG. We found a gas release during the processing of the solution of Orange G and we assumed it to be N2. It would confirm the breakdown of azo group (–N = N–) (Czenichovski, 1994; Bandara et al., 1999; Zolinger, 1987).
3.1.3 Study of the kinetics of discoloration
The kinetics of discoloration by GAD treatment of both dyes is given in Fig. 5. The reaction kinetics follows a pseudo first-order verified by the linearity of the plot
. The slope represents the apparent kinetic constant of discoloration equal to 0.014 and 0.013 min−1 for the ARS and OG respectively. We notice that the two dyes behave in the same way toward the discoloration because their kinetics parameters are almost identical.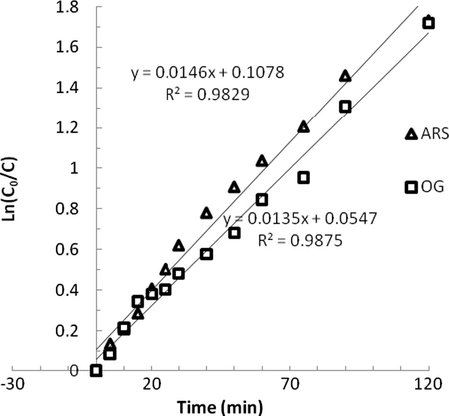
ARS and OG discoloration kinetics.
3.1.4 Study of the degradation
The dye degradation was followed by measuring the COD. It is a pollution parameter that expresses degradation and/or mineralization of organic species (Gupta et al., 2006; Toor et al., 2006). Fig. 6 shows that the COD decreases with GAD treatment time to reach 61.3% for ARS and 70% abatement for the OG after 120 min of exposure. The initial COD values for each dye are obtained from degradation reactions (13) and (14)
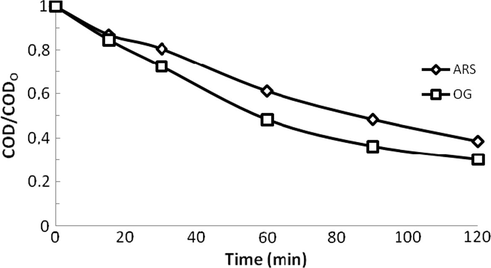
COD evolution of ARS and OG.
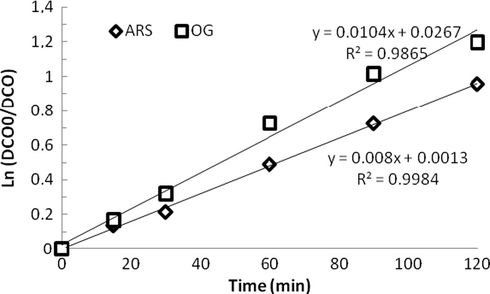
Evolution of the kinetics of degradation.
3.1.5 Evolution of sulfate ions (mineralization)
The evolution of sulfate ions is shown in Fig. 8 for the two dyes (ARS and OG), each containing a sulfur atom. The formation of sulfate ions is due to sulfonate groups oxidation by hydroxyl radicals •OH (Ghezzar et al., 2007) according to reactions (15) and (16):
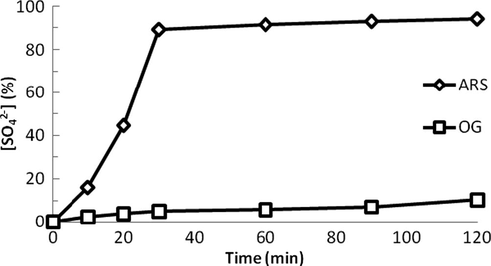
Evolution of
ions according to the treatment time of the ARS and OG.
3.1.6 Study of the mixtures discoloration by GAD treatment
In reality, effluents often contain multiple dyes and the study of the possible interactions between different chromophoric groups during the treatment may be useful (Sarayu et al., 2007). UV–Vis spectra of mixtures of dyes treated with GAD versus time were obtained for all mixtures. For example, we give the spectrum of the mixture IV treatment (Fig. 9) which is more representative of industrial waste. We noticed the decrease of absorption bands up to their disappearance. The 280 nm absorption peak appears in OG spectrum and increases during plasma treatment. If new bands appear in the UV region (200–240 nm) with a tendency toward the maximum absorption out of scale (because of the nitrite bands), they are assigned to the new lighter molecules formed during treatment. The general degradation mechanism actually involves the previous addition of •OH or NO• radicals on unsaturated bonds. The benzene rings are thus especially sensitive to these radicals and their degradation involves a ring opening step with the formation of o-diacids (e.g., muconic acid in the case of phenol) (Abdelmalek et al., 2004).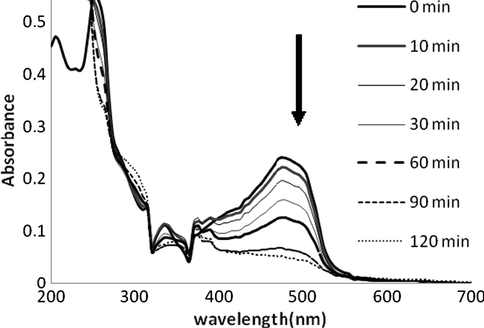
Mixture IV UV–Visible treatment spectrum.
Fig. 10 shows the rate of discoloration for all studied mixtures. The result shows that during the first 30 min of treatment, mixture I reached a discoloration rate of 30% and stabilized around 64% after 2 h of treatment. This can be explained by the predominant presence of OG, which tends to slow down discoloration because of its resistance to treatment. The mixture II was the only one to follow a regular discoloration, since, after 30 min the discoloration rate attained 42% and reached 70% in two hours of treatment. For mixtures III, IV and V, we noticed almost the same behavior since after two hours of treatment the obtained discoloration rate was around 75–80%.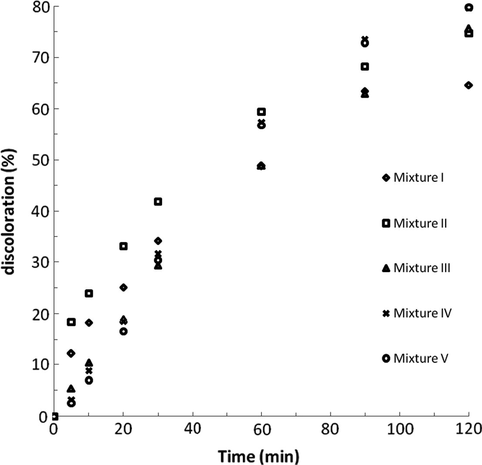
Evolution of the discoloration of mixtures.
3.1.7 Study of the degradation by GAD treatment of mixtures
The COD abatement is shown in Fig. 11. The first 30 min of treatment show a rapid degradation, since for all mixtures, the rate varied between 35% and 40% and then slowed down to reach 68% in 2 h of treatment. The OH groups react more quickly on unsaturated compounds (aromatics) than on the aliphatic compounds. Therefore the mineralization rate is faster at the beginning of treatment and then slows down over time. Indeed, at the beginning of treatment, the dye and aromatic derivatives are easily oxidized by hydroxyl radicals to give aliphatic compounds (carboxylic acids) which are resistant to oxidation by hydroxyl radicals. These assumptions have also been reported by Brillas et al. (2005), (2003) and Sirés et al. (2007); Guivarch et al. (2003).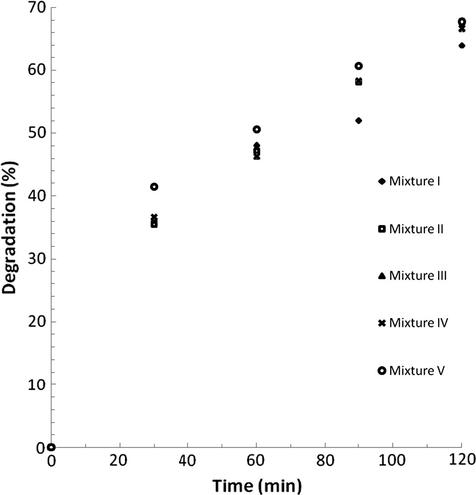
Evolution of the degradation of mixtures.
3.1.8 Study of the evolution of sulfate
We also followed the evolution of sulfates in the degradation of the mixture IV treated by GAD in order to assess the mineralization. The results are shown in Fig. 12. After 120 min of treatment, 7.92 mg L−1 of sulfate ions were released, this represents 20.54% of the theoretical amount of sulfate ions that would be formed if the mineralization was complete (38.55 mg L−1). This low rate may be explained by the high resistance sulphonates to oxidize in the presence of two dyes which are not released easily in these conditions. Nevertheless, the actual concentration of SO42− was less than the theoretic value, i.e., organic sulphur was mineralized to inorganic sulphur partially and existed in organic state partly, which could be demonstrated by the detection of benzene sulfonic acid with GC–MS (Liu et al., 2008).
Evolution of sulfate ions in the mixture IV.
3.2 Influence of inorganic salts on the efficiency of GAD treatment
To represent the industrial effluent, we took the mixture IV (VARS/VOG = 3/2) to which we added chlorides alone, sulfates, and finally the mixture of two salts so that the concentration was always equal to 5 g L−1 to assess the effectiveness of GAD treatment. The solution is treated during 2 h; the results of the discoloration and degradation are given in Figs. 13 and 14. The results show that the discoloration rate decreased slightly when the chloride concentration increased, but increases when the concentration of sulfate ions increased (Fig. 12). However degradation decreased when the concentration of chloride or sulfate increased. The same phenomenon was observed in AOPs treatment (ozonation, UV/H2O2 and UV/TiO2) (Sahoo et al., 2005; Muruganandham and Swaminathan, 2004). This decrease could be explained by the •OH attack on chlorides to form Cl. Thus the consumption of hydroxyl ions by the Cl− will have a negative effect on the treatment (reaction 17–21) (Muthukumar and Selvakumar, 2004).
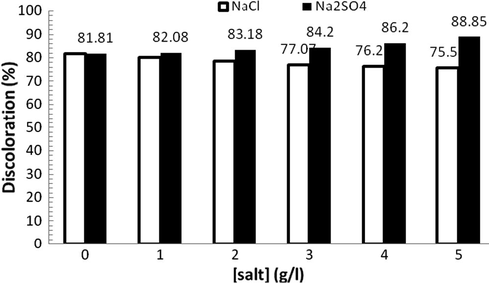
Discoloration of mixture IV “sodium chloride and sodium sulphate effect”.
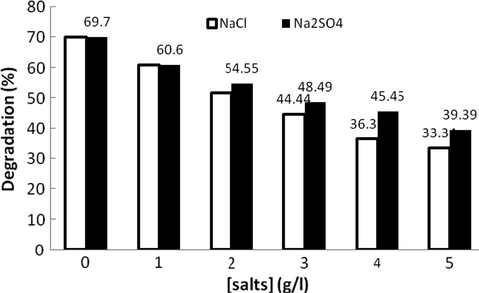
Degradation of mixture IV “sodium chloride and sodium sulphate effect”.
For COD measurement (Fig. 13), we notice that as the concentration of salts increases, the degradation rate decreases. It decreases from 69.7% to 33.3% in the presence of NaCl and 39.4% in the presence of Na2SO4. The sulfate ions had a positive effect on the discoloration contrary to degradation, which reflects the stability of aromatic structures compared to chromophoric bonds easier to break as confirmed by the reactions established for the ARS and the OG by some authors (Bokare et al., 2008; Devi et al., 2009).
3.3 Effect of salt mixture on the efficiency of treatment
We examined the influence of sodium chloride at 5 g L−1 concentration, then the sodium sulfate at the same concentration (5 g L−1) and then the mixture of the two salts at the overall concentration of 5 g L−1 ([NaCl] + [Na2SO4] = 0 + 5, 1 + 4, 2 + 3, 3 + 2, 4 + 1, 5 + 0) on the effectiveness of mixture IV treatment. The results are shown in the Fig. 15.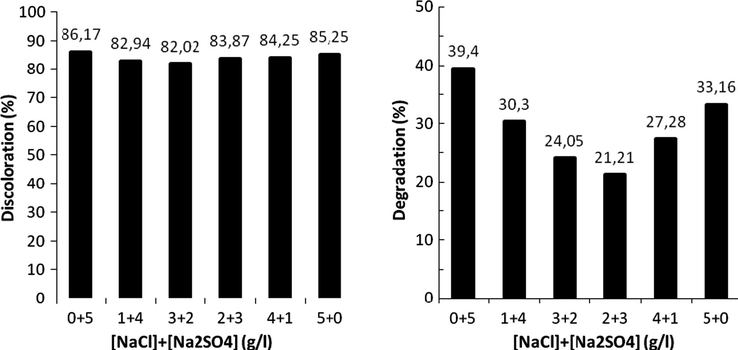
Variation of mixture IV (40%ARS–60%OG) discoloration and degradation with mixed salts.
The Fig. 15 shows the effect of chloride and sulfate ions mixed at different proportions on discoloration and degradation. At the same concentration of chlorides or sulfates, we note that the discoloration and degradation are most affected when the salts are mixed in proportion, this may be due to the increase of the effect of common ion in combined salts (Dong et al., 2007). For example, the effect of chloride on a mixture of 2 g L−1 of Cl− and 3 g L−1 of gives 67.87% of discoloration and 21.21% of degradation, these rates go to 78.65% and 51.5% for chloride alone at a concentration of 2 g L−1.
4 Conclusion
The gliding arc discharge treatment is very efficient in the treatment of dyes solutions. All treated solutions (ARS, OG and mixtures) produced rates of discoloration and degradation above 80% and 61%, respectively, after 120 min of treatment. The kinetics of discoloration and degradation follow a pseudo first order kinetics with rate constants of around 10−2 min−1.
The addition of sulfate ions slightly enhanced the discoloration rate of dye mixture, contrary to chloride ions. COD measurements were particularly affected when the salts are proportionally mixed. The GAD treatment is perfectly suited to dyes treatment. It is an alternative method that is part of green chemistry and sustainable development objectives.
References
- Plasmachemical degradation of azo dyes by humid air plasma: Yellow Supranol 4 GL, Scarlet Red Nylosan F3 GL and industrial waste. Water Res.. 2004;38:2339-2347.
- [Google Scholar]
- Bleaching and degradation of textile dyes by non thermal plasma process at atmospheric pressure. Ind. Eng. Chem. Res.. 2006;45:23-29.
- [Google Scholar]
- Gliding arc discharge assisted catalytic degradation of bisphenol A in solution with ferrous ions. Sep. Purif. Technol.. 2008;63:30-37.
- [Google Scholar]
- Comparative efficiencies of the degradation of crystal violet using UV/hydrogen peroxide and Fenton’s reagent. Dyes Pigm.. 2007;74:283-287.
- [Google Scholar]
- Advanced oxidation processes for water purification and recovery. Catal. Today. 1999;53:51-59.
- [Google Scholar]
- Degradation and decoloration of concentrated solutions of Orange II. Kinetics and quantum yield for sunlight induced reactions via Fenton type reagents. J. Photochem. Photobiol. A, Chem.. 1999;99:57.
- [Google Scholar]
- Photocatalytic degradation of azo dye in aqueous TiO2 suspension: reaction pathway and identification of intermediates products by LC/MS. Sep. Purif. Technol. 2010;72:357-365.
- [Google Scholar]
- Plasma density and rotational temperature measurements of the •OH and NO• radicals produced by a gliding arc in humid air. Plasma. Chem. Plasma Process. 2002;22:553-571.
- [Google Scholar]
- Iron-nickel bimetallic nanoparticles for reductive degradation of azo dye Orange G in aqueous solution. Appl. Catal. B: Environ.. 2008;79:270-278.
- [Google Scholar]
- Heterogeneous photocatalytic degradation of the anthraquinonic dye, Acid Blue 25: a kinetic approach, Photochem. Photobiol. A. 2004;168:23-30.
- [Google Scholar]
- Peroxi-coagulation and photoperoxi-coagulation treatments of the herbicides 4-chlorophenoxyacetic acid in aqueous medium using an oxygen diffusion cathode. Electrochem. Soc.. 2003;150:148-154.
- [Google Scholar]
- Mineralization of paracetamol in aqueous medium by anodic oxidation with a boron-doped diamond electrode. Chemosphere. 2005;58:399-406.
- [Google Scholar]
- Organic dye removal from aqueous solution by glidarc discharges. Electrostatics. 2004;62:309-321.
- [Google Scholar]
- Solar photocatalytic degradation of azo-dyes by photo-Fenton process. Dyes Pigm.. 2006;69:144-150.
- [Google Scholar]
- Photodegradation of an azo dye of the textile industry. Chemosphere. 2002;48:393-397.
- [Google Scholar]
- Photodegradation of an azo dye of the textile industry. Chemosphere. 2002;48:393-399.
- [Google Scholar]
- Collectif AFNOR, la qualité de l’eau, tome II, 1999. Analyses organoleptiques. Mesures physico-chimiques. Paramètres globaux. Composés organiques, NFT 90-102. Groupe Eyrolles S.A AFNOR.
- Collectif AFNOR, la qualité de l’eau, tome III, 1999. Éléments majeurs. Autres éléments et composés minéraux, NFT 90-040. Groupe Eyrolles S.A AFNOR.
- Gliding arc applications to engineering and environment control. Pur. Appl. Chem.. 1994;66:1301-1310.
- [Google Scholar]
- Study on the relationship between structure of synthetic organic chemicals and their biodegradability. Environ. Chem.. 1995;14:534-567.
- [Google Scholar]
- Kinetic modeling based on the non-linear regression analysis for the degradation of Alizarin Red S by advanced photo Fenton process using zero valent metallic iron as the catalyst. Mol. Catal. A: Chem.. 2009;314:88-94. ÉcoLire phonétiquement
- [Google Scholar]
- Comparaison of catalyzed and non catalyzed oxidation of azo dye and effect on biodegradability. Env. Sci .Technol.. 1998;32:1294.
- [Google Scholar]
- Decoloration of three azo dyes in water by photocatalysis of Fe (III) oxalate complexes/H2O2 in the presence of inorganic salts. Dyes Pigm.. 2007;73:261-268.
- [Google Scholar]
- Plasmachemical decolourisation of bromothymol blue by gliding dielectric discharge at atmospheric pressure. Dyes Pigm.. 2008;77:118-124.
- [Google Scholar]
- Enhancement of the bleaching and degradation of textile wastewaters by Gliding arc discharge plasma in the presence of TiO2 catalyst. Appl. Catal. B: Environ.. 2007;72:304-313.
- [Google Scholar]
- Degradation of azo dyes in water by electron-Fenton process. Environ. Chem. Lett.. 2003;1:38-44.
- [Google Scholar]
- Photocatalytic degradation of a mixture of crystal violet (basic violet 3) and methyl red dye in aqueous suspensions using Ag+ doped TiO2. Dyes Pigm.. 2006;69:224-232.
- [Google Scholar]
- Photocatalytic degradation of the alimentary azo dye amaranth: mineralization of the azo group to nitrogen. Appl. Catal.. 2004;51:183-186.
- [Google Scholar]
- Worldwide occurrence and effects of antifouling paint booster biocides in the aquatic environment. Environ. Int.. 2004;30:235-248.
- [Google Scholar]
- Photocatalytic degradation of various types of dyes (Alizarin S, Crocein Orange G, Methyl Red, Congo Red, Methylene Blue) in water by UV-irradiated titania. Appl. Catal., B. 2002;39:75-90.
- [Google Scholar]
- Degradation of gas–liquid gliding arc discharge on acid Orange II. Hazard. Mater.. 2008;157:441-447.
- [Google Scholar]
- Reduction of nitrite by sulfamic acid and sodium azide from aqueous solutions treated by gliding arc discharge. Sep. Purif. Technol.. 2006;50:373-379.
- [Google Scholar]
- Photochemical oxidation of reactive azo dye with UV/H2O2 process. Dyes Pigm.. 2004;62:269-275.
- [Google Scholar]
- Studies on the effect of inorganic salts on decolouration of acid dye effluents by ozonation. Dyes Pigm.. 2004;62:221-228.
- [Google Scholar]
- Decolorization of textile azo dyes by ultrasonication and microbial removal. Desalination. 2010;255:154-160.
- [Google Scholar]
- Photocatalytic degradation of crystal (C.I. Basic Violet 3) on silver ion doped. Dyes Pigm.. 2005;66:189-196.
- [Google Scholar]
- Assessment of degradation of eight commercial reactive azo dyes individually and in mixture in aqueous solution by ozonation. Dyes Pigm.. 2007;75:362-366.
- [Google Scholar]
- Optimization and modeling of decolorization and COD reduction of reactive dye solutions by ultrasound-assisted adsorption. Chem- Eng. 2006;119:175-181.
- [Google Scholar]
- Degradation of dye solution by an activated carbon fiber electrode electrolysis system. Hazard. Mater.. 2001;B84:107-110.
- [Google Scholar]
- Catalytic behavior of the Fe3+/Fe2+ system in the electro-Fenton degradation of the antimicrobial chlorophene. Appl. Catal. B: Environ.. 2007;72:382-394.
- [Google Scholar]
- Photocatalytic degradation of direct Yellow 12 dye using UV/TiO2 in a Shallow pond Slurry reactor. Dyes Pigm.. 2006;68:53-60.
- [Google Scholar]
- Removal of COD and color from hydrolyzed textile azo dye by combined ozonation and biological treatment. Hazard Mater.. 2010;179:35-42.
- [Google Scholar]
- Treatment and reuse of wastewater from the textile wet-processing industry, review of emerging technologies. Chem. Technol. Biotechnol.. 1998;72:289-302.
- [Google Scholar]
- Photosensitized degradation of a textile azo dye, acid orange 7, on TiO2 particles using visible light. Environ. Sci. Technol.. 1996;30:1660-1668.
- [Google Scholar]
- Degradation of azo dye Orange G in aqueous solutions by persulfate with ferrous ion. Sep. Purif. Technol.. 2010;72:105-111.
- [Google Scholar]
- Color chemistry, synthesis, properties and applications of organic dyes and pigments. VCH: Weinheim Amsterdam; 1987.
- Degradation of alizarin red S under mild experimental conditions by immobilized 5,10,15,20-tetrakis (4 sulfonatophenyl) porphine–Mn(III) as a biomimetic peroxidase-like catalyst. Mol. Catal. A: Chem.. 2008;288:97-102.
- [Google Scholar]


