

Translate this page into:
Polarity-guided phytochemical extraction, polyphenolic characterization, and multimode biological evaluation of Seriphidium kurramense (Qazilb.) Y. R. Ling
⁎Corresponding authors at: Chief DCTMD(Retd.) National Institute of Health, Islamabad 20892, Pakistan.(Shahzad Hussain), Department of Biology, Science Unit, Deanship of Educational Services, Qassim University, Buraidah, 51452, KSA.(Iffat Naz). I.Majid@qu.edu.sa (Iffat Naz), shahzadpharmacist1962@gmail.com (Shahzad Hussain)
-
Received: ,
Accepted: ,
This article was originally published by Elsevier and was migrated to Scientific Scholar after the change of Publisher.
Peer review under responsibility of King Saud University.
Abstract
Purpose of study
The undertaken study aims to assess the polyphenolic profile, and antioxidant, antimicrobial, antiviral, antidiabetic, and cytotoxic potential of Seriphidium kurramense (Qazilb.) Y. R. Ling extracts.
Methods
Extracts of aerial parts were prepared by successive extraction (n-hexane {Sk-nH}, ethyl acetate {Sk-EA}, methanol {Sk-M} and aqueous {Sk-Aq}). Chromogenic assays determined the antioxidant profile while HPLC quantified several polyphenols. Agar well diffusion was employed for antimicrobial potential while brine shrimp and hemolytic assays established the biosafety profile.
Results
The results have shown that maximum extract recovery (17.49% w/w), total phenolics content (24.44 ± 0.15 μg GAE/mgE), and total flavonoids content (6.87 ± 0.25 μg QE/mgE) were recorded in Sk-Aq. RP-HPLC quantified a significant amount of syringic acid (1.43 ± 0.05 µg/mgE), caffeic acid (0.48 ± 0.02 µg/mgE), gentisic acid (6.44 ± 0.01 µg/mgE), and quercetin (4.39 ± 0.01 µg/mgE) in Sk-Aq, while maximum amounts of thymoquinone (0.21 ± 0.02 µg/mgE) and luteolin (3.90 ± 0.03 µg/mgE) along with apigenin (3.72 ± 0.03 µg/mgE) existed in Sk-M and highest quantities of ferulic acid (2.98 ± 0.01 µg/mgE), myricetin (1.04 ± 0.02 µg/mgE) and kaempferol (1.23 ± 0.01 µg/mgE) were found to be present in Sk-EA. A substantial free radical scavenging (85.87 ± 1.00%), total reducing power (211.93 ± 0.97 µg AAE/mgE), and urease inhibition activity (87.99 ± 0.19% at 500 µg/ml) were also recorded in the Sk-Aq. The highest antioxidant capacity (243.5 ± 1.12 µg AAE/mgE), antibacterial, antifungal, and antiviral activity (100% reduction in plaque formation at 400 µg/ml) were observed for Sk-EA. Maximum antibacterial and antifungal activities were revealed against Klebsiella pneumoniae (MIC = 25 ± 0.37 µg/ml), and Candida albicans (MIC = 50 ± 0.19 µg/ml) respectively. The prominent antidiabetic potential was displayed by Sk-nH in terms of α-amylase and α-glucosidase inhibition.
Conclusion
The results reported, herein suggest that S. kurramense can be a promising candidate for antioxidant, antibacterial, antifungal, antiviral, and antidiabetic secondary metabolites.
Keywords
Antibacterial
Antioxidant
Antiviral
Anti-urease
Plaque reduction

1 Introduction
Infections caused by microbes (bacteria and viruses) are a primary reason for diseases and deaths in humans all over the world. No<65% of current general human infective disease outbursts have originated from zoonotic viruses (Lisi et al., 2021). Approximately 100 million people around the world are victimized each year by microbial infections (Alwan, 2011). Antibiotics have been the sole option to treat microbial infections caused by bacteria. However, the unwarranted and incongruous use has resulted in the progression of antibiotic resistance by bacteria, thus creating a tough challenge for treating the infections (Cantas et al., 2013, Van Boeckel et al., 2015). Therefore, research efforts have increased to search for alternative remedies to control microbial infections in humans.
Plants that are used as traditional medicines contain a broad array of secondary metabolites such as coumarins, phenolic acids, flavones, flavonols, terpenoids, alkaloids, etc. possessing bioactive properties (Elisha et al., 2017). These biomolecules are the source of plant-derived antimicrobial therapeutics. Moreover, herbal remedies when used with prescription medicine have an obvious effect as antimicrobials since the phytochemicals in plants can resensitize the microbes resistant to the available antibiotics thus providing resistance reversal (Thakur and Kumar, 2019) (Shriram et al., 2008) (Shriram et al., 2010) (Shriram et al., 2013).
Genus Seriphidium belongs to the family Compositae and is useful for treating various ailments like diabetes, high blood pressure, and gastrointestinal disorders in Middle East countries like Turkey. Artemisinin, an antimalarial drug has been isolated from its two species: S. annua, and S. indica. S. dubia has been used to cure asthma, scabies, ulcer, and constipation whereas S. absinthium is ethnomedicinally used as antimicrobial, anthelmintic, and antifungal. Likewise, S. brevifolia has been used as anthelmintic agent in the ethnoveterinary medicine practice of Pakistan (Shafiq et al., 2017). Moreover, many plants of the genus Seriphidium are pharmacologically important due to their phytoconstituents such as α-thujone 1,8-cineole β-caryophyllene, and β-thujone. It has also been collected and transported to other parts of the country and abroad for santonin extraction (Gilani et al., 2010) which is used as an antioxidant, anti-inflammatory, immunosuppressive, and antimalarial (Wang et al., 2019a).
Seriphidium kurramense (Qazilb.) Y. R. Ling. is a potent medicinal plant native to Upper Kurram Agency, at the Pakistan-Afghanistan border (Gilani et al., 2010). Local communities use this plant for several ailments such as anthelmintic, antidiabetic, and remedy for stomach problems and infections. The plant is believed to have insecticidal properties (Ahmad et al., 2018). Despite being used for many important purposes by folklore it is yet to be scientifically explored, therefore, in this study various extracts of the plant were analyzed for antimicrobial potential. Their ability to ameliorate oxidative stress, quantification of polyphenols with established antimicrobial properties, enzyme inhibition, and biocompatibility were evaluated alongside to corroborate the results of antimicrobial susceptibility assays. As for the literature survey under our perusal is concerned, we found that HPLC-based detection, and quantification of polyphenols, assessment of anti-urease, antiviral, and antidiabetic potential of S. kurramense have not been described hitherto. This study is a substantial contribution to research in natural products and provides scientific evidence of some of the traditional uses of S. kurramense.
2 Materials and methods
2.1 Reagents, solvents, and apparatus/equipment
Solvents; methanol, ethyl acetate, n-hexane, and dimethyl sulfoxide (DMSO), quercetin, ferric chloride (FeCl3), aluminum chloride (AlCl3), gallic acid, DPPH (2,2-diphenyl-1-picrylhydrazyl) potassium acetate, sulfuric acid (H2SO4), ascorbic acid, ammonium molybdate, monosodium dihydrogen phosphate (NaH2PO4), potassium ferricyanide, trichloroacetic acid (TCA), reference antibiotics (ciprofloxacin and cefixime), reference antifungal drug (clotrimazole), reference antiviral drug (trifluridine), α-amylase enzyme, trypton soy broth (TSB), p-nitrophenyl α-D-glucose (PNG), acarbose, Folin–Ciocalteu reagent, phosphate buffer (PB), RPMI-1640 medium, sea salt, Dulbecco's Modified Eagle Medium (DMEM) and Medium 119 were acquired from Sigma (Sigma-Aldrich, Germany). Tween-20 from Merck-Schuchardt, USA. SDA (Sabouraud dextrose agar) was procured from Oxoid, England and doxorubicin was purchased from Merck (Darmstadt, Germany), while ISP4-medium was prepared in lab.
2.2 Eddddthical statement
The experiments where human blood was required, was performed after approval from Ethical Committee of Quaid-i-Azam University (Approval No. #BEC-FBS-QAU2021-376) and in consent with the WHO guidelines for drawing blood (2010). Informed consent was taken from all individuals who volunteered for blood sampling.
2.3 Collection and identification of the plant material
Aerial parts of fully grown Seriphidium kurramense were collected from District Kurram, in July and August 2019. Plant specimen was identified and verified by Prof. Dr. Mushtaq Ahmad, Department of plant sciences, Quaid-i-Azam University Islamabad, and the plant specimen was added under voucher no. 132,012 within herbarium of medicinal plants, Department of Plant Sciences, Quaid-i-Azam University, Islamabad for further reference.
2.4 Extraction process
The plant material collected was subjected to eliminate adulterants, washed up with tap water and then dried under shade at an ambient temperature for a period of 6–8 weeks. Dried material afterwards was crushed using grinder to a coarse powder. To obtain crude extracts of the dried powder of S. kurramense, successive extraction along with ultra-sonication assisted maceration was done as previously implemented (Ahmed et al., 2017). Four solvents of increasing polarity were employed i.e., n-hexane (nH), ethyl acetate (EA), methanol (M) and distilled water (DW) respectively. The ratio of plant biomass to solvent was 1:4 (w/v). Powdered plant material (5 kg) was first soaked with a non-polar solvent i.e., n-hexane for 3 days in 1000 ml Erlenmeyer flasks and sonicated periodically at 25 KHz. Muslin cloth was used to perform filtration followed by fine filtration using filter paper. Solvent was recovered from the filtrate through rotary evaporator under vacuum at 40 °C. Marc was re-extracted with the same solvent for second time following the same steps. Similar procedure was adapted for the rest of the solvents i.e., EA, M and DW. Crude plant extracts after complete drying were stored in properly labeled containers and stored at 4 °C in refrigerator until further use (Kazmi et al., 2022).
2.4.1 Extract recovery
Weight of dried extracts was taken properly, and percent recovery of crude extracts was determined by applying following formula:
Extract recovery (%w/w) = WB/WE × 100.
Where WB = Weight of plant biomass and WE = Weight of crude extract after drying.
2.5 Phytochemical profiling
2.5.1 Determination of total phenolic content (TPC)
Total phenolic content (TPC) was calculated employing Folin-Ciocalteu (FC) reagent corresponding to an established protocol, previously illustrated (Ul-Haq et al., 2012). Test sample (20 μl) from the stock extracts (4 mg/ml) and 90 μl of FC reagent were transferred to the corresponding wells of microplate and incubated for 5 min at room temperature. sodium carbonate (6% w/v), 90 μl of was transferred to wells containing mixture. Incubation was done at 37 °C for 30 min and the absorbance was evaluated at 630 nm utilizing microplate reader (Biotech USA, microplate reader Elx 800). DMSO was used as negative control and gallic acid as positive control. Calibration curve was drawn using (y = 0.165x + 0.1631, R2 = 0.9955) at varying concentrations (3.125–25 μg/ml) and total phenolic content was measured in microgram gallic acid equivalent per milligram of extract (μg GAE/mgE). Assay was carried out in triplicate.
2.5.2 Determination of total flavonoid content (TFC)
To quantify total flavonoids content, aluminum chloride based colorimetric method was followed (Ul-Haq et al., 2012). A mix containing 20 μl of the sample from the stock (4 mg/ml DMSO), 10 μl of 1.0 M potassium acetate, 10 μl of Alcl3 (10% w/v in H2O) and 160 μl of distilled water were poured in a 96-well plate. At room temperature, plate was incubated for half an hour and absorbance was measured at 415 nm using microplate reader. DMSO was treated as negative control and the experiment was run as triplicate. A calibration curve (y = 0.0508x + 0.0602, R2 = 0.9947) of positive control (quercetin) was drawn at final concentration (2.5–40 μg/ml) and resultant flavonoid content was expressed in microgram equivalent of quercetin per milligram of extract (μg QE/mgE).
2.5.3 RP-HPLC quantitative analysis
High performance liquid chromatography system combined with DAD (diode array detector) was applied as formerly defined (Qasim et al., 2017, Ahmed et al., 2017) for detecting and quantifying of polyphenols in S. kurramense. HPLC system (Agilent Chem station Rev. B. 02–01-SRI 260) was provided with a Zorbex-C8 analytical column (5 µm particle size, 4.6 cm and 250 nm) associated with DAD, (Agilent technologies Germany). Binary gradient system comprises mobile phase A (methanol: water: acetic acid: acetonitrile in 10:85:1:5 ratio) and mobile phase B (acetonitrile: methanol: acetic acid in 40:60:1 ratio) was employed to achieve the detection of polyphenols. Flow rate was adjusted at 1 ml per minute and column was injected with 20 µl of the sample solution prepared in methanol. Before injecting new sample, column was tuned for 10 min. A gradient volume of (mobile phase B) was 0–50% in (0–20 min), 50–100% in (20–25 min) and 100% in last 25–30 min. Stock solutions of all the standards were freshly prepared within methanol and then further diluted to final concentrations of 10, 20, 50, 100, and 200 µg/ml. For each standard, the calibration curve was generated by utilizing the final concentration and peak area. Standard solutions and mobile phases were degassed first and then filtered out using 0.45 µm membrane filter (Millex-HV), whereas all samples were centrifuged and filtered prior to injecting into the HPLC system. The absorption was taken at certain wavelengths. Polyphenols were recognized by comparison of UV–Vis spectra and retention time of chromatographic peaks in comparison to reference standards at 257 nm for plumbagin, vanillic acid and thymoquinone, 279 nm for coumaric acid, catechin, syringic acid and gallic acid, 325 nm for apigenin, gentisic acid, caffeic acid, luteolin and ferulic acid and 368 nm for kaempferol, quercetin and myricetin. A wavelength of 360 nm was used as a reference wavelength so that in case of luminescence, the quantification of compounds showing inverted peaks may be double checked through their retention times and peak pattern with reference to 360 nm. Quantity of each polyphenol was quantified using calibration curves of standards i.e., for rutin (y = 9.547x + 22.217, R2 = 0.997), vanillic acid (y = 6.357x + 12.113, R2 = 0.998), ferulic acid (y = 19.51x-16.67, R2 = 0.998), catechin (y = 7.878x-19.532, R2 = 0.996), gallic acid (y = 23.573x-43.167, R2 = 0.995), syringic acid (y = 9.532x + 13.754, R2 = 0.998), myricetin (y = 5.2278x-6.3043, R2 = 0.998), coumaric acid (y = 9.7644x + 14.281, R2 = 0.999), caffeic acid (y = 25.093x + 92.465, R2 = 0.995), gentisic acid (y = 12.21x-20.348, R2 = 0.996) and apigenin (y = 18.111x + 25.565, R2 = 0.997).
2.5.4 Antioxidant assays
2.5.4.1 Free radical scavenging assay (%FRSA)
Free radical scavenging capacity of the crude extract was assessed by monitoring its ability to quench the stable DPPH reagent (2,2-diphenyl-1-picrylhydrazyl) free radicals, following an earlier established procedure (Ul-Haq et al., 2012). Briefly, 10 μl of the tested sample (4 mg/ml DMSO) along with 190 μl of DPPH solution (9.2 mg/100 ml methanol) was added to 96 well plate and then incubated for about an hour under complete dark conditions at 37 °C. After incubation, at 630 nm the absorbance was logged. Percent free radical scavenging was computed by the following formula:
Where Abs is the absorbance of tested sample, while Abc is absorbance of negative control comprising DMSO and DPPH reagent. Ascorbic acid (1 mg/ml DMSO) was used as positive control and the assay was run as triplicate analysis. Test samples exhibiting ≥ 50% free radical scavenging was evaluated at the final concentrations of 200, 66.66, 22.22 and 7.4 µg/ml to calculate the 50% inhibitory concentration and Graph pad prism software was applied to evaluate IC50.
2.5.4.2 Total antioxidant capacity (TAC)
Total antioxidant capacity was calculated by formerly defined protocol (Jafri et al., 2017). 100 µl (4 mg/ml), of test extract was added in Eppendorf tubes to it 900 µl of TAC reagent (0.6 M sulphuric acid, 4 mM ammonium molybdate solution and 28 mM sodium phosphate in H2O) was added. Ascorbic acid (1 mg/ml DMSO) at the final concentration of (0–50 μg/ml) was used as positive control. Blank solution contained 900 µl of reagent solution and 100 µl of DMSO. All the sample tubes were kept within water bath at 95 °C for 90 min, cooled at room temperature and 200 μl of sample was shifted to a 96 well plate. Absorbance of the samples was noted at 630 nm utilizing microplate reader. Total antioxidant capacity was calculated as microgram pf ascorbic acid equivalent per milligram of extract, (µg AAE/mgE) and experiment was run in triplicate.
2.5.4.3 Total reducing power (TRP)
A colorimetric assay based on standard potassium ferricyanide was employed to approximate reducing power of plant extracts (Jafri et al., 2017). 100 μl of test samples (4 mg/ml) with 250 µl potassium ferricyanide (0.1% w/v in H2O) and 200 μl of the phosphate buffer (0.2 mol/l, pH 6.6) was added in Eppendorf tubes. This mix was then incubated for 20 min at 50 °C then 200 μl of trichloroacetic acid (10% w/v in H2O) was added and then centrifugation at 3000 rpm for 10 min at room temperature was performed. An aliquot of 50 μl FeCl3 (0.1% w/v in H2O) and supernatant (150 μl) and was added to 96 well plate. Absorbance was noted at 630 nm. Blank solution containing 100 μl of DMSO and ascorbic acid was used as negative and positive controls in this experiment. The assay was run in triplicate and total reducing power was calculated as microgram of ascorbic acid equivalent per mg of extract. (µg AAE/mgE).
2.6 Antimicrobial susceptibility testing
2.6.1 Antibacterial susceptibility assay
Antibacterial potential of various extracts of S. kurramense, was evaluated according to an earlier described protocol (Peerzade et al., 2018). Pure cultures of both reference strains and resistant clinical isolates were evaluated. Reference bacterial strains included Escherichia coli (ATCC-25922), Salmonella typhi (ATCC-14028), Staphylococcus aureus (ATCC-6538), Staphylococcus epidermis (ATCC-12228), Pseudomonas aeruginosa (ATCC-27853), Bacillus subtilis (ATCC-6633), Klebsiella pneumoniae (ATCC-10031) and Salmonella enterica (ATCC-14028) while resistant clinical isolates included Pseudomonas aeruginosa, Escherichia coli, Methicillin Resistant Staphylococcus aureus (MRSA) and Staphylococcus hemolyticus. The standardized inoculum (5 × 10⁶ CFU/ml) of the refreshed bacterial cultures were swabbed onto the surface of respective plates containing Muller Hinton Agar (MHA) growth media utilizing sterile cotton swab under aseptic conditions. Afterwards, a well of 6 mm diameter was punched in each well using sterile cork borer. The bottom of each well was sealed by adding small amount of the medium to avoid leakage of the samples. Then 100 µl of the extract (20 mg/ml in DMSO) was poured in their respective wells which were previously labeled. After pouring the extracts the plates were left undisturbed at room temperature for the diffusion of extracts before the incubation. Cefixime at the final concentration of 5 µg (100 µl) and DMSO were used as positive and negative controls respectively in this assay. Inoculated petri plates were then kept at 37 °C in incubator for 24 h. After incubation, diameters of inhibitory zones were measured by vernier calipers in millimeters.
2.6.2 Antifungal susceptibility assay
For evaluation of antifungal potential of S. kurramense extracts, agar well diffusion method was performed in triplicate as explained earlier (Kalidindi et al., 2015) (Sales et al., 2016). The inoculum of test fungal strains Mucor species (FCBP-0300), Aspergillus niger (FCBP0198), Candida albicans (ATCC-10231), Fusarium solani (FCBP-0291) and Aspergillus fumigatus (FCBP-66), were harvested within Tween 20 solution (0.02% v/v) in distilled water and their turbidness was regulated with reference to 0.5 McFarland standard. Afterwards, 100 μl of standardized inoculum of all fungal strains was swabbed on previously labeled respective plates holding Sabouraud Dextrose agar (SDA). The inoculated plates were left undisturbed at room temperature for 20 min and then 6 mm diameter wells were created using a sterile cork borer. The bottom of each well was sealed by adding small amount of the medium to avoid leakage of the samples. Then each well was filled with 100 µl of respective extract (20 mg/ml in DMSO). DMSO and clotrimazole (4 mg/ml DMSO) were used as negative and positive controls in this assay. The seeded plates were then incubated at 28 °C for 24–48 h. Finally, the inhibitory zones around the samples and standard were observed and their diameters were recorded in millimeters.
To estimate the in-vitro antifungal activity of crude extracts against Aspergillus flavus (FCBP-0064); clinical isolates of Trichophyton rubrum, Trichophyton tonsurans, Aspergillus terreus, Alternaria alternata, Rhizopus arrhizus, and Fusarium dimerum, microbroth dilution method was utilized. The protocol developed by Clinical and Laboratory Standard Institute (CLSI) document M−38−A2 was followed (Wayne, 2008). RPMI-1640 was used as a culture medium for fungal growth. For inoculum preparation, 0.85% sterile saline was used. Spores were transferred through Pasteur pipette to saline solution (containing Tween-20) and the turbidity was corrected in accordance with McFarland standard 0.5. Firstly, 5 µl from each sample stock was transferred into the corresponding wells of microtiter plate, to which 195 µl of RPMI was added (500 µg/ml RPMI). Then two-fold serial dilutions were prepared containing 250, 125, 62.5, and 31.25 µg/ml RPMI in next wells. After sample addition, 100 µl of fungal suspension of respective strain was added to each well. Terbinafine at a concentration ranging from 0.5 to 0.001 µg/ml RPMI and Amphotericin B (16–0.313 µg/ml of RPMI) were used as positive controls and DMSO diluted within RPMI-1640 medium, (<1%) was used as negative control. Plates were then incubated at the temperature of 35 °C for varying periods for different fungi or till the growth appeared in control well. The results were recorded by visual aid using a magnifying glass. Assay was performed in triplicate and the lowest concentration inhibiting 100% growth was expressed as MIC.
2.6.3 Antiviral assay
By double layer agar technique, plaque reduction assay was accomplished as formerly depicted (Danesh et al., 2015). Concisely, 20 mg of each tested extract, at first, was dissolved within 1 ml of ethyl acetate, from which 100 µl was transferred to Eppendorf tubes and allowed to evaporate. To the dried extract 150 µl of known plaque forming unit PFU phage suspension was included and then at room temperature tubes were incubated for 50 min. After incubation, 250 µl of E. coli overnight culture was included to phage suspension and incubated at the temperature, 37 °C for about 20 min. Afterwards, mixture was mixed with 3 ml of softened agar and poured on a nutrient agar (NA) plate. Ethyl acetate combined with phage suspension and phage lysate treated with similar process (without plant extract) were used as two negative controls. Trifluridine was used as positive control. Afterwards, the plates were incubated for 24 h, at 37 °C and plaque was counted. Plaque reduction assay results were expressed in form of PFU ratio.
2.7 Enzyme inhibition assays
2.7.1 Alpha amylase inhibition assay
Starch iodine based colorimetric assay was employed to gauge the α-amylase inhibitory capability of test extracts following the standard protocol (Zhao et al., 2019). Reaction mixture comprising 25 μl of enzyme (0.14 U/ml), 15 μl of phosphate buffer (pH 6.8), 40 μl of starch solution (2 mg/ml in potassium phosphate buffer) and 10 μl of the extract (4 mg/ml DMSO) was incubated for half an hour at 50 °C in 96 well plate then 1 M HCl (20 μl) was added as a stopping solution. Subsequently, 90 μl iodine reagent (5 mM potassium iodide and 5 mM of iodine) was moved to each well. Negative control having no extract while blank did not contain amylase enzyme and buffer was added to replace each of them. Positive control of this assay was Acarbose (250 μM). Following incubation, the absorbance was taken at 540 nm. Results were expressed as percent of α-amylase inhibition per mg of extract using the given equation:
Where Abn = Absorbance of the negative control, Abs = Absorbance of the sample and Abb is Absorbance of blank.
2.7.2 Alpha-glucosidase inhibition assay
Protocol reported earlier (Nair et al., 2013) was used for execution of this assay. Initially, (20 mM) of PNG (25 μl), 5 μl the tested sample and 69 µl 50 mM, phosphate buffer (pH 6.8) was mixed in the corresponding wells of 96 well plate and then addition of 1 µl of the enzyme solution was done. After then, immediately the absorbance was measured employing microplate reader at 405 nm. The mix was then incubated at 37 °C for a period of 30 min. 100 µl of sodium bicarbonate (0.5 mM) solution was transferred to stop the reaction. DMSO was used instead of test samples as a negative control and tested sample was replaced by Acarbose solution as a positive control, following the same procedure as described. Whole assay was run as triplicate analysis and absorbance was measured at 405 nm. Percent enzyme inhibition was calculated by employing the following formula:
Ac = Absorbance of control, As = Absorbance of sample.
2.7.3 Urease inhibition assay
Jack bean urease inhibition assay was utilized as described (Bai et al., 2015), 20 µl from 5 Units per ml of the stock solution was mixed with 30 µl of the assay buffer (comprising K2HPO4, LiCl, urea and EDTA, at the concentration of 100 mM, 1 mM, 0.01 M, and 0.01 M respectively, pH 8.2), approx. 20 µl of the extract in 96 well plate and then this mixture was incubated for 30 min at 37 °C. This was followed by the addition of 50 µl of alkali reagent (comprising 0.5% NaOH and 0.1% w/v of sodium hypochlorite (NaOCl)) and phenol reagent (sodium nitroprusside, 0.005% w/v and 1% w/v phenol) and the incubation was done for about 20 min at the temperature 25 °C. Absorbance of the mixture was calculated at 625 nm using a microplate reader (OptiMax, Tunable) and all the extracts were analyzed at the concentration range 62.5–500 µg/ml.
In this experiment, thiourea was used as a standard for urease inhibitor. Assay was repeated thrice, and inhibitory activity was determined using the following formula:
Where, Absample is the absorbance of sample and Abcontrol is the absorbance in presence or absence of the sample. Graph pad Prism version 5.0 was used for calculation of IC50.
2.8 Biosafety profiling
2.8.1 Hemolytic assay
Hemolytic was performed by following protocol as described earlier (Singh and Katoch, 2020). Various concentrations of S. kurramense extracts (250 and 500 µg/ml) were used to determine their hemolytic potential against human erythrocytes. The hemolytic potential i.e., the concentration that can induce 50% (HC50) or 10% (HC10) hemoglobin release from RBCs due to exposure to extracts were determined using table curve 2D v5.01 software.
Erythrocytes were isolated after centrifugation of fresh human blood and rinsed three times employing sterile phosphate buffer saline solution (pH 7.4). Erythrocytes pellet was resuspended in phosphate buffer solution to achieve a 5% solution. RBCs suspension of 50 μl was moved to 96 well plate having 150 μl of samples at different concentrations. Incubation was done for 30 min at room temperature and then centrifuged for 20 min at 2000 rpm. Supernatant (100 μl) from the mixture was transported to a fresh 96 well plate and the absorbance was estimated at wavelength, 360 nm. 0.1% Triton X100 was employed as positive control and hemolysis was computed in percent using the formula.
The experiment was done in triplicate.
2.8.2 Brine shrimp lethality assay (Cytotoxicity Testing)
For the assessment of primary biocompatibility profile of S. kurramense, 24 h lethality test was accomplished against brine shrimp larvae (Artemia salina) as illustrated earlier (Ul-Haq et al., 2012). Eggs of A. salina (Ocean star, USA) were incubated in a specifically constructed two-compartment plastic tray for hatching period of 24–48 h within simulated sea water (38 g/ liter augmented with 6 mg/liter of the dried yeast) under illumination and heat at 30–32 °C). Afterwards, using Pasteur pipette, ten mature phototropic nauplii were shifted to the wells of microtiter plate. Extract containing ≤ 1% DMSO in the sea water at concentrations of 200, 100, 50 and 25 μg/ml was added to each well carrying the shrimp larvae. Final volume of 300 μl was kept in each well. Positive control (1.25–10 µg/ml of doxorubicin) and negative controls (1% DMSO in sea water) were used. After time duration of 24 h, dead shrimps were tallied, and percentage death was confirmed. Median lethal concentration (LC50) was processed using table curve 2D v5.01 software. The whole experiment was performed thrice.
3 Statistical analysis
Data were presented as mean of triplicate ± standard error. Graph Pad Prism software 5.0 was applied for graphical representation and calculation of IC50 values whereas HC50 and LC50 values were computed utilizing table curve 2D v5.01 software.
4 Results and discussion
4.1 Effect of extraction solvent on the extract yield
Percentage extract recovery has been briefed in Table 1. Maximum extract yield (17.49% w/w) was exhibited by Sk-Aq, followed by Sk-M (12.95% w/w) and Sk-EA (6.07% w/w). In contrast, the extraction yield was least (1.70% w/w) in case of Sk-nH. An extraction technique with exceptional proficiency owing to time and yield ratio is essential to correctly calculate the phytochemicals (Celeghini et al., 2001). It also impacts the biological appraisal of extracts. In the undertaken study, a declining trend was observed within extract yield with decrease in the polarity of solvents. Thus, the use of sonication assisted maceration with different polarity solvents in current study is a crucial factor in optimization of extract yield and its relationship with biological behaviors. This statement is in compliance with results as formerly reported by (Hayouni et al., 2007, Ahmed et al., 2017). Variations in extraction output can credited to varying solubility of phytoconstituents built on the wide range chemical composition in the plant (Khan et al., 2015). Sk-nH = n-hexane extract, Sk-EA = ethyl acetate extract, Sk-M = methanol extract, Sk-Aq = aqueous extract.
Sr.no.
Extracts
Polarity index
Percent extract yield % (w/w)
1
Sk-nH
00
1.70
2
Sk-EA
4.4
6.07
3
Sk-M
5.1
12.95
4
Sk-Aq
9.0
17.49
4.2 Quantitative phytochemical evaluation
Total phenolic content (TPC) and total flavonoid content (TFC) were quantified by considering the standard regression lines for gallic acid (y = 0.165x + 0.1631; R2 = 0.9955) and quercetin (y = 0.0508x + 0.0602; R2 = 0.9947).
4.2.1 Total phenolic content (TPC)
The total gallic acid equivalent phenols in S. kurramense extracts showed a range of 24.44 ± 0.34 to 1.20 ± 0.13 μg GAE/mgE. The highest TPC (24.44 ± 0.34 μg GAE/mgE) was recorded for Sk-Aq whereas lowest quantity (1.20 ± 0.13 μg GAE/mgE) was found to be present in Sk-nH. The detected quantity of total phenolic content in aqueous extract is also in accordance with another report published on Seriphidium oliverianum (Abbas et al., 2021). The phenolic content was observed to decrease in the subsequent order: Sk-Aq > Sk-M > Sk-EA > Sk-nH (Fig. 1). A broad array of solvents are needed for their extraction since the polyphenol polarities range from polar to non-polar, thus. Thus, polarity performs a vital role in enhancing the phenols solubility. A substantial relationship among antioxidant capacity and total phenolic content was observed in earlier investigations, suggesting phenolic compounds as the major sponsors to antioxidant potential of plants (Fernandes de Oliveira et al., 2012). Polyphenols have antioxidant (Kumar et al., 2013), antifungal (Chen et al., 2013), anticancer and antibacterial (Móricz et al., 2018) potential. Plant phenolics combat oxidative stress and the cell death by scavenging or chelating free radicals and trace elements (Cheynier, 2012) therefore the phenolic content was assessed to extrapolate the possible role of S. kurramense in infectious diseases. To the best of our knowledge, determination of TPC and TFC was carried out for the first time in current study.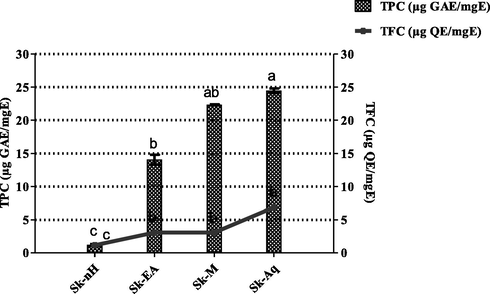
Total phenolic content and total flavonoid content of S. kurramense extracts.Values are presented as mean ± standard deviation from the triplicate investigation. The columns with different superscript (a-c) letters show significantly (P < 0.05) different means.
4.2.2 Total flavonoid content (TFC)
Total flavonoid content of S. kurramense extracts in terms of μg QE/mgE are presented in Fig. 1. Among tested extracts, highest flavonoid content of 6.87 ± 0.25 μg QE/mgE was recorded in Sk-Aq. Same quantity of TFC (3.07 ± 0.29 and 3.07 ± 0.21 μg QE/mgE) was detected in Sk-M and Sk-EA. Lowest content of TFC (1.17 ± 0.22 μg QE/mgE) was observed in Sk-nH. Compounds with hydroxyl groups such as flavonoids, act through scavenging or chelating processes and are accountable for the free radical scavenging activity of plants (Ahmed et al., 2017). The potential mechanisms of antioxidant actions by flavonoids involve scavenging ROS, protecting and regulating antioxidant defenses and inhibition of ROS formation either by inhibiting enzymes or chelating the trace components (Zahra et al., 2017). Therefore, the present flavonoid determination in the extracts of S. kurramense suggests that it would be a beneficial antioxidant and would come forward as a successful candidate against infectious diseases by bolstering immune system through palliation of oxidative stress.
4.2.3 RP-HPLC analysis
Polyphenols were quantified by RP-HPLC profiling, using 15 standards. The chromatographic fingerprints of analytes and standards are shown in Fig. 2 and Table 2 depicts quantified values of 10 detected phenolic constituents. Sk-EA contained maximum concentration of Luteolin (3.82 ± 0.11 µg/mgE) followed by Ferulic acid (3.05 ± 0.03 µg/mgE). Gentisic acid (6.44 ± 0.01 µg/mg) and Quercetin (4.39 ± 0.01 µg/mgE) were found substantially in Sk-Aq whereas Sk-M was found to be rich in Luteolin (3.90 ± 0.03 µg/mgE) and Apigenin (3.72 ± 0.03 µg/mgE) The detected polyphenols such as apigenin and ferulic acid have established bioactive profile which further potentate the medicinal value of S. kurramense. Phenolic acids are known to have antioxidant (Cheynier, 2012), anti-inflammatory (Cory et al., 2018) and antimicrobial properties and are stated to be more potent against Gram negative bacteria as compared to Gram positive bacteria (Cetin-Karaca, 2011). In the present study considerable antibacterial activity against gram negative as compared to gram positive bacteria has been observed. Previously apigenin’s antibacterial (Kim et al., 2020), antifungal (Lee et al., 2018) and anti-parasitic capability has been reported (Wang et al., 2019b). Furthermore, ferulic acid was found to exert an immediate and constant inhibition of Coronobacter sakazakii (Shi et al., 2016). It has also been indicated in various studies that polyphenols have strong antiviral activities through various mechanisms (Musarra-Pizzo et al., 2019) (Bai et al., 2016) (Agrawal et al., 2020). Nd = Not detected, Sk-EA = ethyl acetate extract, Sk-M = methanol extract, Sk-Aq = aqueous extract, Data values shown represent Mean ± SD (n = 3).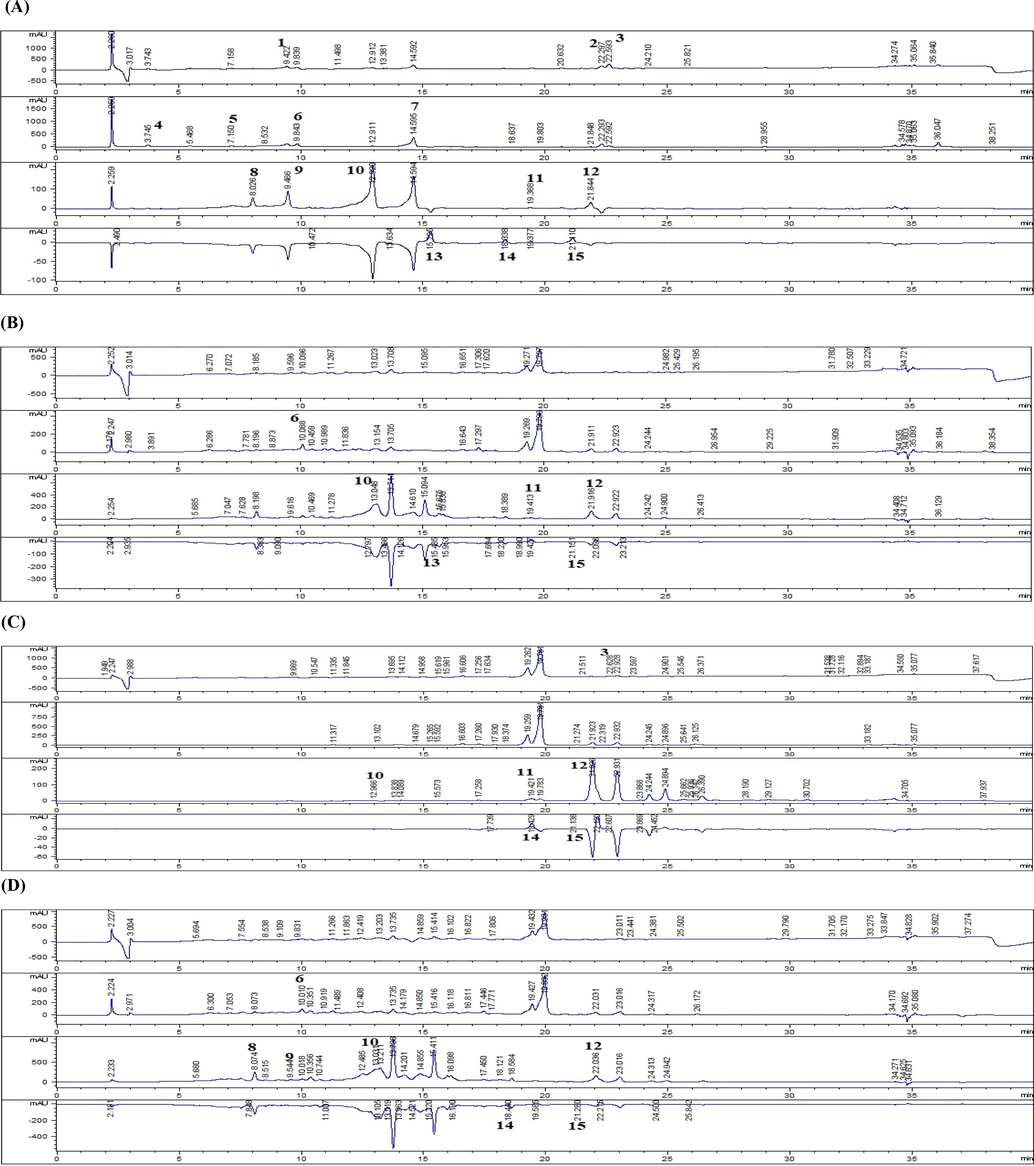
High performance liquid chromatography fingerprints of S. kurramense extracts. A = standards, B = Sk-EA, C = Sk-M, D = Sk-Aq1. Vanillic acid 2. Plumbagin 3. Thymoquinone 4. Gallic acid 5. Catechin 6. Syringic acid 7. Coumaric acid 8. Gentisic acid 9. Caffeic acid 10. Ferulic acid 11. Luteolin 12. Apigenin 13. Myricitin14. Quercetin 15. Kaempferol.
Sr.no.
Polyphenol standards
Signal (nm)
Concentration (µg/mg of Extract) (n = 3)
Sk-EA
Sk-M
Sk-Aq
1
Plumbagin
257
Nd
Nd
Nd
2
Vanillic acid
257
Nd
Nd
Nd
3
Thymoquinone
257
Nd
0.21 ± 0.02
Nd
4
Gallic acid
279
Nd
Nd
Nd
5
Catechin
279
Nd
Nd
Nd
6
Syringic acid
279
1.23 ± 0.03
Nd
1.43 ± 0.05
7
Coumaric acid
279
Nd
Nd
Nd
8
Caffeic acid
325
Nd
Nd
0.48 ± 0.02
9
Luteolin
325
3.82 ± 0.11
3.90 ± 0.03
Nd
10
Gentisic acid
325
Nd
Nd
6.44 ± 0.01
11
Ferulic acid
325
3.05 ± 0.03
0.42 ± 0.02
2.98 ± 0.01
12
Apigenin
325
2.23 ± 0.01
3.72 ± 0.03
3.01 ± 0.04
13
Quercetin
368
Nd
2.07 ± 0.03
4.39 ± 0.01
14
Myricetin
368
1.04 ± 0.02
Nd
Nd
15
Kaempferol
368
1.23 ± 0.01
0.78 ± 0.03
0.78 ± 0.02
4.3 In-vitro biological profiling
4.3.1 Antioxidant assays
4.3.1.1 Free radical scavenging activity (FRSA)
Reactive oxygen species (ROS) and free radicals are produced as a result of biological processes. (Vaghasiya et al., 2011). They play an imperative part in oxidative stress linked to the pathogenesis of many bacterial, viral and chronic diseases (Aiyegoro and Okoh, 2010) (Kumar et al., 2008). Plants owing to their ROSs scavenging ability represent themselves as valuable suppliers of organic antioxidants. (Riaz et al., 2012). The percent free radical scavenging activity (%FRSA) of S. kurramense extracts was evaluated by measurement of their capability to scavenge stable free radical DPPH. Results of this assay are exhibited in Fig. 3.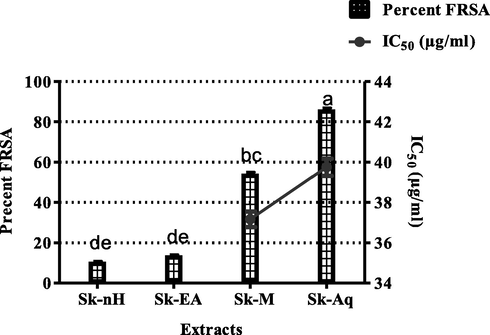
Percent free radical scavenging activity of S. kurramense extracts. Values are presented as mean ± standard deviation from the triplicate investigation. The columns with different superscript (a-e) letters show significantly (P < 0.05) different means.
Highest free radical scavenging activity was exhibited by Sk-Aq (85.87 ± 1.00%) followed by Sk-M (54.01 ± 1.02%) and Sk-EA (13.53 ± 0.59%). The least FRSA (10.33 ± 0.55%) was displayed by Sk-nH. The plant polyphenols and flavonoids, among the plant components are deemed strong free radical scavengers, (Farah et al., 2018) and serve as prospective alternate to faux antioxidants owing to the safety plus efficacy (Tzima et al., 2018). As mentioned earlier free radicals are responsible for oxidative stress linked to various diseases, therefore, scavenging free radicals can be linked to mitigation of oxidative stress in these infections. Thus, the antioxidant activity can be correlated with antimicrobial activity as well. Free radical scavenging activity in this research could be attributed to polyphenols detected such as quercetin (OZGEN et al., 2016), gentisic acid (JOSHI et al., 2012) in Sk-Aq which displayed strong activity, apigenin in Sk-Aq (Kumar et al., 2013) and Sk-M and luteolin (ROY et al., 2015) in Sk-EA and Sk-M which have exhibited moderate activities. The antioxidant agents always show complex and variable mode of action hence a single method cannot be relied to determine antioxidant capability of test samples (Sini et al., 2011).
4.3.1.2 Total antioxidant capacity
Total antioxidant capacity of S. kurramense extracts was established by a colorimetric assay based on phospho-molybdenum which involves development of green complex (Fatima et al., 2015). The results are summarized in Fig. 4. Highest antioxidant potential was exhibited by Sk-EA (243.5.0 ± 1.12 µg AAE/mgE), followed by Sk-Aq (238.3 ± 0.91 µg AAE/mgE) and Sk-M (140.4 ± 0.76 µg AAE/mgE) while lowest TAC was recorded for Sk-nH (1.2 ± 0.34 µg AAE/mgE). Prominent total antioxidant capacity denotes that test extracts would play the role of promising antioxidants by reducing oxidative stress which is the foundation of many diseases by damaging the immune functions of biological systems (Apak et al., 2016).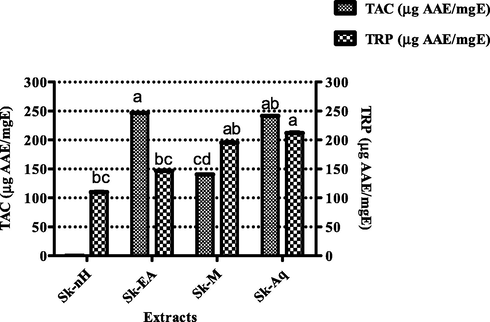
Graphical representation of total antioxidant capacity and total reducing power of S. kurramense extracts. Values are presented as mean ± standard deviation from the triplicate investigation. The columns with different superscript (a-d) letters show significantly (P < 0.05) different means.
4.3.1.3 Total reducing power
Fig. 4 shows the reducing power of S. kurramense extracts. The highest TRP (211.93 ± 0.97 µg AAE/mgE) was recorded for Sk-Aq, followed by Sk-M (195.28 ± 1.01 µg AAE/mgE), Sk-EA (146.62 ± 0.72 µg AAE/mgE) and the lowest (109.71 ± 0.85 µg AAE/mgE) for Sk-nH. The reducing power assay is centered on reduction of potassium ferricyanide (Fe+3) to form potassium ferricyanide (Fe+2) by plant components, followed by reaction with ferric chloride (FeCl3) with subsequent formation of ferric–ferrous complex. The reduction is correlated with the existence of reductones which relate to antioxidant action by providing a hydrogen atom and thus destroying the free radical chain, hence a direct relationship has been noted between antioxidant capability and the reducing power of some plant extracts (ABDEL-HAMEED, 2009). Thus, noteworthy reducing power of test extracts supports the fact that these extracts could be valuable for various infectious diseases by mitigating the oxidative stress through free radical scavenging.
4.4 Antimicrobial susceptibility assays
4.4.1 Antibacterial assay
Improper and misuse of antibiotics lead to the progression of microbial resistance, rendering the treatment of bacterial infections a major challenge for health professionals. Bacteria also have evolved certain mechanisms which contribute to resistance by either chemical or enzymatic modifications (Todar, 2011). Plants provide protection against infective diseases and resistance due to maximum safety and minimum side effects. (Ruddaraju et al., 2020). Therefore, screening natural sources especially plants for finding alternative antimicrobials is becoming a dire need at the present time (Malik et al., 2022).
Results of antibacterial activity of extracts are shown in Table 3. Sk-EA was found to be more effective against all tested strains of bacteria. The inhibitory zone diameter values ranged from 8.33 ± 1.52 to 21.33 ± 0.76 mm. The highest value (21.33 ± 0.76 mm) was recorded for Sk-EA against K. pneumoniae whereas least against S. enterica (8.33 ± 1.52 mm) by Sk-M. For resistant clinical isolates inhibitory zone diameter values ranged from 7.0 ± 0.00 to 11.83 ± 0.76 mm. The tested extracts with better antibacterial action against gram negative bacterial strains in comparison to gram positive however noteworthy activity against gram positive bacteria is also apparent. Along with that S. kurramense extracts have shown significant activity against resistant clinical isolates against resistant clinical isolates that have shown resistance against contemporary antibiotics proving their superlative activity. ---= no activity, Sk-nH = n-hexane extract, Sk-EA = ethyl acetate extract, Sk-M = methanol extract, Sk-Aq = aqueous extract., Data values shown represent Mean ± SD (n = 3), S. typhi = Salmonella typhi, E. coli = Escherichia coli, B. subtilis = Bacillus subtilis, S. aureus = Staphylococcus aureus, P. aeruginosa = Pseudomonas aeruginosa, S. enterica = Staphylococcus enterica, K. pneumoniae = Klebsiella pneumoniae and S. epidermis = Staphylococcus epidermis. The columns with different superscript (a-g) letters show significantly (P < 0.05) different means.
Bacterial strains
Zone of Inhibition (mm ± SD) at 2000 µg/well and Minimum Inhibitory Concentration (MIC; µg/ml)
Sk-nH
MIC
Sk-EA
MIC
Sk-M
MIC
Sk-Aq
MIC
Cefixime
MIC
DMSO
Non-resistant strains
S. aureus
16.83 ± 0.29d
25 ± 0.22
19.17 ± 0.76bc
25 ± 0.33
12.83 ± 0.76f
100 ± 0.33
11.00 ± 0.50 fg
100 ± 0.55
21.22 ± 0.05
25 ± 0.22
---
S. typhi
13.83 ± 0.28ef
50 ± 0.23
21.0 ± 1.00ab
25 ± 0.23
9.67 ± 1.52
150 ± 0.41
11.33 ± 0.57 fg
100 ± 0.44
19.23 ± 0.02
25 ± 0.33
---
B. subtilis
16.17 ± 1.04d
25 ± 0.33
16.67 ± 1.15d
25 ± 0.22
12.67 ± 0.58f
100 ± 0.37
10.00 ± 0.00 g
150 ± 0.48
19.11 ± 0.05
25 ± 0.12
---
E. coli
13.00 ± 0.00ef
50 ± 0.34
15.00 ± 1.00de
50 ± 0.35
10.00 ± 1.00 g
150 ± 0.41
9.00 ± 0.00
150 ± 0.52
20.02 ± 0.01
25 ± 0.17
---
K. pneumoniae
15.00 ± 0.00de
50 ± 0.27
21.33 ± 0.76ab
25 ± 0.37
11.33 ± 1.52 fg
100 ± 0.37
---
---
21.11 ± 0.05
25 ± 0.21
---
P. aeruginosa
15.50 ± 1.32de
50 ± 0.44
14.33 ± 0.58e
50 ± 0.44
8.17 ± 1.04
300 ± 0.31
---
---
21.23 ± 0.03
25 ± 0.28
---
S. enterica
11.33 ± 0.57 fg
100 ± 0.51
12.83 ± 0.76f
100 ± 0.41
8.33 ± 1.52
300 ± 0.32
9.50 ± 0.50
150 ± 0.25
21.12 ± 0.04
25 ± 0.19
---
S. epidermis
15.67 ± 0.76de
50 ± 0.35
17.50 ± 0.87 cd
25 ± 0.57
11.83 ± 0.76 fg
100 ± 0.42
---
---
14.12 ± 0.03
25 ± 0.13
---
Resistant clinical isolates
S. hemolyticus
10.50 ± 0.41 g
100 ± 0.33
9.33 ± 0.58
50 ± 0.22
7.00 ± 0.00
300 ± 0.22
9.33 ± 0.28
300 ± 0.31
---
---
---
E. coli
9.66 ± 0.58
100 ± 0.31
8.16 ± 0.28
50 ± 0.31
8.00 ± 0.00
100 ± 0.35
8.00 ± 0.00
300 ± 0.22
---
---
---
MRSA
11.83 ± 0.76 fg
---
8.16 ± 0.28
250 ± 0.44
9.00 ± 0.00
300 ± 0.47
---
---
---
---
---
P. aeruginosa
7.50 ± 0.40
25 ± 0.57
7.00 ± 00
25 ± 0.34
11.00 ± 0.87 fg
50 ± 0.52
10.5 ± 0.50 g
150 ± 0.22
---
---
---
Results of the current study strongly correlate with already documented reports where extracts of the plant understudy displayed significant antibacterial activity versus gram positive and gram negative bacterial strains (Ahmad et al., 2018). The results of antimicrobial potential of S. kurramense can be correlated with phenolic acids such as apigenin, ferulic acid, luteolin and quercetin detected in different extracts of the plant. Phenolic acids are known to have antimicrobial activity (Cetin-Karaca, 2011). Various degrees of efficacy are reported on apigenin’s antifungal, anti-parasitic and antibacterial potential, antibacterial mechanism being perturbance of cell membrane (Wang et al., 2019b) (Kim et al., 2020). Furthermore, ferulic acid was found to exert an immediate and constant inhibition of Coronobacter sakazakii by altering the cell membrane permeability (Shi et al., 2016). Luteolin exerts antibacterial action through affecting membrane permeability and by inhibiting the activity of DNA topoisomerases I and II (Wang and Xie, 2010). Another polyphenol quantified is quercetin which exhibits antibacterial action by altering the cell permeability, destroying bacterial cell wall, reducing enzyme activities, influencing protein synthesis and expression, and inhibiting synthesis of nucleic acids (Yang et al., 2020). In line with the results of antibacterial assay, it is apparent that S. kurramense extracts and/or it’s isolated phytochemicals may play a significant role in lead development to combat antibacterial drug resistance.
4.4.2 Antifungal assay
S. kurramense was assessed against twelve different fungal strains and the Table 4a. and Table 4b) depict the results of the assay. Noteworthy antifungal activity was recorded against C. albicans (31.33 ± 0.57 mm) by Sk-EA followed by Sk-nH (30.83 ± 0.76 mm) and moderate activity against A. fumigatus (13.66 ± 0.58 mm) by Sk-Aq. Significant activity against F. dimerum (MIC value of 62.5 µg/mL) was recorded for Sk-EA and Sk-M. Previous study reported noteworthy antifungal activity of EA extract against A. flavus and A. niger at 5 mg/ml concentration (67.2 and 32.2% inhibition respectively) however in the present study Sk-EA showed no activity against both mentioned fungal strains Therefore, the result of antifungal activity of ethyl acetate extract against A. flavus and A. niger of the previous study conducted (Ahmad et al., 2018) is not in agreement with the results of the present study. Several studies showed that secondary metabolites produced by plants have inhibitory effects on several pathogenic fungi (Castillo-Reyes et al., 2015) (Hossein and Maldonado, 1982) (Arif et al., 2009). The antifungal activity shown by various extracts of S. kurramense may be attributed to the polyphenols detected within extracts particularly quercetin in Sk-M and luteolin in both Sk-EA and Sk-M. Quercetin improves fluconazole-resistant C. albicans stimulated apoptosis by regulation of quorum sensing and causing mitochondrial dysfunction (Yang et al., 2020) (Rocha et al., 2019). Likewise, luteolin produces ultrastructural and morphological changes in the fungus (Báidez et al., 2006). The structure of the phenolics allows them to disperse through microbial membranes and penetrate the cell, where they intervene in metabolic pathways of fungi by intruding in the ergosterol synthesis, glucan, proteins,chitin and glucosamine in fungi (Ansari et al., 2013). (See Table 4a. and Table 4b). ---= no activity, Clotz = Clotrimazole, DMSO = dimethyl sulfoxide, Sk-nH = n-hexane extract, Sk-EA = ethyl acetate extract, Sk-M = methanol extract, Sk-Aq = aqueous extract, Data values were represented as Mean ± SD (n = 3), C. albicans = Candida albicans, A. fumigatus = Aspergillus fumigatus, A. solani = Alternaria solani, A. niger = Aspergillus niger, T. tonsurans = Trichophyton tonsurans, A. alternata = Alternaria alternata, A. terreus = Aspergillus terreus, T. rubrum = Trichophyton rubrum, R. arrhizus = Rhizopus arrhizus, A. flavus = Aspergillus flavus, F. dimerum = Fusarium dimerum. The columns with different superscript (a-f) letters show significantly (P < 0.05) different means.
Fungal strains
Average Zone of Growth Inhibition (mm ± SD) (n = 3) (Concentration = 2000 µg/well)
Sk-nH
MIC (µg/ml)
Sk-EA
MIC (µg/ml)
Sk-M
MIC (µg/ml)
Sk-Aq
MIC (µg/ml)
Clotz.
MIC (µg/ml)
DMSO
C. albicans
30.83 ± 0.76ab
50 ± 0.11
31.33 ± 0.57a
50 ± 0.19
28.33 ± 0.29ab
50 ± 0.42
20 ± 0.00c
200 ± 0.28
34.00 ± 0.00
50 ± 0.21
---
A. fumigatus
7 ± 0.00f
300 ± 0.32
8.16 ± 0.83ef
300 ± 0.22
8.50 ± 0.50ef
300 ± 0.24
13.66 ± 0.58de
300 ± 0.44
32.16 ± 0.28
50 ± 0.33
---
A. solani
---
---
---
---
28.33 ± 0.29
50 ± 0.25
---
A. niger
---
---
---
8 ± 0.00ef
300 ± 0.28
30.33 ± 0.57
50 ± 0.35
---
Mucor spp.
---
---
---
---
30.16 ± 0.41
50 ± 0.29
---
Fungal strains
Minimum Inhibitory Concentration (µg/mL ± SD) (n = 3)
Sk-EA
Sk-nH
Sk-M
Sk-Aq
Terbinafine
Amphotericin-B
DMSO
T. rubrum
250 ± 0.22
500 ± 0.55
125 ± 0.12
125 ± 0.44
0.005 ± 0.11
---
---
T. tonsurans
125 ± 0.32
250 ± 0.43
250 ± 0.24
125 ± 0.43
0.005 ± 0.18
---
---
A. alternata
250 ± 0.24
500 ± 0.43
125 ± 0.34
250 ± 0.32
0.005 ± 0.12
---
---
A. terreus
250 ± 0.27
500 ± 0.21
125 ± 0.54
250 ± 0.27
---
3.2 ± 0.11
---
R. arrhizus
250 ± 0.25
500 ± 0.38
250 ± 0.48
---
---
3.2 ± 0.18
---
A. flavus
---
250 ± 0.49
500 ± 0.38
---
---
3.2 ± 0.21
---
F. dimerum
62.5 ± 0.55
250 ± 0.27
62.5 ± 0.27
125 ± 0.19
---
3.2 ± 0.19
---
4.4.3 Antiviral assay
The antiviral potential of S. kurramense extracts was tested against phage virus. Among the extracts, Sk-EA was found as highly potent that reduced PFU to zero percent, followed by Sk-nH and Sk-Aq. Results are shown in Table 5. Several studies have confirmed the antiviral potential of plants (Denaro et al., 2020, Jaime et al., 2013). The antiviral activity of the extracts can also be attributed with the presence of phenolic acids in extracts with documented antiviral activity such as luteolin quantified in Sk-EA which in recent studies has shown that it inhibits the secretion of Hepatitis B e-antigen (HBeAg) in HepG2.2.15 cells that bear the HBV genome and Hepatitis B surface antigen (HBsAg) suggests that luteolin acts as a potential anti-HBV agent (Bai et al., 2016), apigenin quantified in Sk-EA and Sk-Aq, inhibits the replication of EV71 which causes hand, foot and mouth disease (HFMD) by disturbing association of viral RNA with trans-acting factors and regulating cellular JNK pathway (Dai et al., 2019) and quercetin quantified in Sk-Aq, is effective against various viral infections by either blocking the virus entry or inhibiting viral replication enzymes such as viral polymerases (Agrawal et al., 2020). PFU = plaque forming unit, Sk-nH = n-hexane extract, Sk-EA = ethyl acetate extract, Sk-M = methanol extract, Sk-Aq = aqueous extract, Data values shown represent Mean ± SD (n = 3), Trifluridine = positive control. The columns with different superscript (a-d) letters show significantly (P < 0.05) different means.
Extracts
Number of PFU formed (Average n = 3)
Percent PFU (%)
Sk-nH
19.33 ± 1.15ab
14.28 ± 0.11
Sk-EA
00 ± 0.00a
00 ± 0.00
Sk-M
136 ± 2.08 cd
100 ± 0.03
Sk-Aq
36 ± 1.00ab
26.42 ± 0.22
Negative control
138 ± 2.22
100 ± 0.02
Trifluridine
00 ± 0.00
00 ± 0.00
4.5 Enzyme inhibition assays
4.5.1 α-amylase inhibition assay
Diabetes mellitus, a metabolic disorder of worldwide prevalence is characterized by hyperglycemia. The inhibitors of alpha amylase and alpha glucosidase enzymes which are responsible for metabolism and absorption of glucose are believed to be effective agents for controlling and managing diabetes mellitus (Tadera et al., 2006). Adverse effects linked with insulin and oral hypoglycemic agents, used to manage blood glucose levels, compelled the researchers to find alternate sources of new anti-diabetic therapeutics (Liyanagamage et al., 2020). Hence, there is a dire need to explore organic sources for enzyme inhibitors.
The results of alpha amylase inhibition assay are displayed in Table 6. Highest inhibition was shown by Sk-nH followed by Sk- M with IC50 values of 96.26 ± 0.44 and 109.10 ± 0.24 μg/ml respectively. IC50 value of Sk-Aq was 113.50 ± 0.37 μg/ml and that of Sk-EA was 117.0 ± 0.53 μg/ml. Sk-nH = n-hexane extract, Sk-EA = ethyl acetate extract, Sk-M = methanol extract, Sk-Aq = aqueous extract, Data values shown represent Mean ± SD (n = 3). Acarbose = positive control for α-amylase and α-glucosidase assay, Thiourea = positive control for urease assay.--=Not applicable, The columns with different superscript (a-d) letters show significantly (P < 0.05) different means.
Extracts
Percent α-amylase inhibition (%)
(200 μg/ml)
IC50 (μg/ml)
Percent α-glucosidase inhibition (%)
(100 μg/ml)
IC50 (μg/ml)
Percent urease inhibition (%)
(500 μg/ml)
IC50 (μg/ml)
Sk-nH
65.19 ± 0.55a
96.26 ± 0.44
60.51 ± 0.37ab
48.35 ± 0.22
60.62 ± 0.39 cd
214.30 ± 0.14
Sk-EA
61.26 ± 0.47ab
117.0 ± 0.53
57.13 ± 0.23ab
58.02 ± 0.38
75.08 ± 0.25bc
278.80 ± 0.25
Sk-M
48.62 ± 1.00bc
109.10 ± 0.24
56.66 ± 0.43ab
30.44 ± 0.47
84.15 ± 0.18ab
289.70 ± 0.41
Sk-Aq
47.51 ± 0.28bc
113.50 ± 0.37
47.12 ± 0.27bc
45.75 ± 0.42
87.99 ± 0.19a
288.30 ± 0.31
Acarbose
97.2 ± 1.60
42.5 ± 0.10
64.0 ± 1.40
84.9 ± 1.05
–
–
Thiourea
–
–
–
–
95.17 ± 0.00
49.7 ± 1.50
The alpha amylase inhibiting potential of S. kurramense can be linked with presence of quercetin and ferulic acid as they have been detected in Sk-EA, Sk-M and Sk-Aq. Phenolics and flavonoids have the ability to inhibit alpha amylase enzyme (Etxeberria et al., 2012). Plant based phenolic compounds like quercetin and ferulic acid, catechin, are accountable for regulation of glycaemia by secreting insulin, increasing glucose uptake, α-glucosidase, and α-amylase inhibition and further inhibiting lipid peroxidation (Barone et al., 2009). The α-amylase inhibitory proficiency of S. kurramense combined with its antimicrobial and antioxidant attributes propose it to be a suitable candidate particularly where infections and metabolic disorders along with oxidative stress are implicated in disease progression such as diabetes.
4.5.2 α-glucosidase inhibition assay
Like alpha amylase inhibition another strategy developed to deal with type-2 diabetes is alpha-glucosidase’s inhibition. Generally, nutritional starch is processed by α-amylase into maltose and dextrin, while α-glucosidase in digestive tract hydrolyzes these carbohydrates into glucose increasing the blood glucose level (Zheng et al., 2020). Synthetic inhibitors are generally linked with digestive side effects. Thus, developing the inhibitors from natural sources present an alternate option for the management of hyperglycemia. In recent times, several studies have been performed to detect inhibitors of alpha glucosidase from natural resources (Assefa et al., 2019).
Glucose modulatory potential of S. kurramense was additionally evaluated by α-glucosidase inhibition assay. Results of this assay are summarized in Table 6. Sk-nH exhibited highest α-glucosidase inhibition i.e., 60.51 ± 0.37% with an IC50 value of 48.35 ± 0.22 μg/ml whereas, remarkable enzyme inhibition potential was also shown by Sk-EA (57.13 ± 0.23%) and Sk-M (56.66 ± 0.43%) with IC50 values of 58.02 ± 0.38 and 30.44 ± 0.47 μg/ml respectively at 100 μg/ml concentration. At the same concentration Sk-Aq exhibited comparatively low enzyme inhibition potential (47.10 ± 0.27%). No literature is available on alpha glucosidase inhibition of the plant understudy.
A number of studies indicated the alpha glucosidase inhibitory potential of polyphenols (Assefa et al., 2019) (Seo et al., 2015) (Benalla et al., 2010). Alpha glucosidase inhibitory effects of tested extracts, therefore, can be credited to polyphenols which have been detected and have documented glucosidase inhibitory activities such as luteolin (Yan et al., 2014), apigenin (Zeng et al., 2016) and ferulic acid (Zheng et al., 2020) quantified in Sk-EA and Sk-M. The results are consistent with the antioxidant activities of Sk-EA and Sk-M. Antioxidant action along with enzyme inhibition potential of S. kurramense prospects its use in infectious diseases.
4.5.3 Urease inhibition assay
The results for assessment of urease inhibition assay and IC50 of the extracts are presented in Table 6. All the extracts exhibited anti-urease activity. Sk-M and Sk-Aq were found to be more potent by showing a percent inhibition value of 84.15 ± 0.18 and 87.99 ± 0.19 respectively. Furthermore, Sk-EA and Sk-nH exhibited 75.08 ± 0.28 and 60.62 ± 0.39 percent inhibition respectively. Maximum urease inhibitory potential of Sk-M and Sk-Aq could possibly be attributed to high content of polyphenols owing to the recorded reports of their urease inhibition activity (Kafarski and Talma, 2018) such as apigenin (Nile et al., 2018), quercetin (Shabana et al., 2010) and gentisic acid (Malik et al., 2019). In this study, the manifestation of anti-urease activity by all the four extracts indicates the presence of urease inhibitors in them, another study reported strong anti-urease activity of pure compounds isolated from Seriphidium quettense (Imran Tousif et al., 2017).
Urease hydrolyzes urea into ammonia and carbon dioxide. In humans, it assists Helicobacter pylori to survive inside the stomach, which can cause gastric, duodenal ulceration, gastritis and even gastric cancer (Tarsia et al., 2018). It can colonize in acidic environment by secreting urease which facilitates the conversion of urea to ammonia and this liberated ammonia guards it from stomach acids (Amin et al., 2013). Therefore, inhibition of urease enzyme that would ultimately halt the production of ammonia can be regarded as an efficacious strategy to eradicate the microorganism by making it susceptible to stomach acid (Rego et al., 2018).
Various treatment options are there for the treatment of urease producing bacteria such as H. pylori, but limitations include various complications such as high toxicity, high cost of pretreatment, instability and bacterial resistance. Therefore, discovery of novel urease inhibitors developed from medicinal plants having low toxicity, few side effects, high bioavailability, and great stability, is gaining importance as an alternative treatment against H. pylori and other urease producing bacteria and would also address the issue of rapid development of antimicrobial resistance and would also be cost-effective (Pervaiz et al., 2019). Thus, S. kurramense, considering the results of this study, can be a prospective antimicrobial.
4.6 Hemocompatibility assay
Owing to the presence of polyphenols with documented activity against various diseases and noteworthy antioxidant, antibacterial, antifungal, and antiviral activity, biocompatibility of S. kurramense extracts was assessed. Many reports show that extracts can adversely affect the erythrocyte membrane and many plants exhibit severe side effects including hemolytic anemia (Zohra and Fawzia, 2014). Table 7 displays the results of hemolytic assay for S. kurramense extracts. All extracts exhibited<10% hemolytic activity, so it is concluded that S. kurramense extracts do not contain constituents which possess hemolytic potential and thus hinted that it would be safe for human use. Although, natural products are considered safer, however their use must be linked with in-vivo and toxicity studies. Sk-nH = n-hexane extract, Sk-EA = ethyl acetate extract, Sk-M = methanol extract, Sk-Aq = aqueous extract, Data values shown represent Mean ± SD (n = 3). Triton x-100 = positive control.
Hemolytic Profile
Extracts
Concentration (µg/ml)
%Hemolysis
Sk-nH
500
8.42 ± 0.52
250
4.11 ± 0.49
Sk-EA500
10.44 ± 0.93
250
5.39 ± 0.54
Sk-M500
9. 63 ± 0.59
250
5.10 ± 0.45
Sk-Aq
500
10.03 ± 0.77
250
5.22 ± 0.66
Triton X-100
500
99.9 ± 0.01
250
95.8 ± 0.01
4.7 Brine shrimp lethality assay (Cytotoxicity Testing)
Brine shrimp assay is a plain and high-level efficiency cytotoxicity test for bioactive compounds. It is centered on killing capability of compounds of an aquatic crustacean organism, the brine shrimp. It has been observed that shrimp larvae behave like mammalian cells so it can be deduced that cytotoxicity against mammalian cells acts as the same as against shrimp larvae (Ullah et al., 2012). Cytotoxicity was assessed against brine shrimp larvae to ascertain its biosafety profile. Sk-Aq showed a percent mortality value of 50 ± 0.72% at 200 µg/ml concentration followed by Sk-M (40 ± 0.55%). Sk-EA exhibited 30 ± 0.28 percent mortality and for Sk-nH 20 ± 0.19 percent mortality was observed. The results are shown in Fig. 5. Keeping in view of the results of the assay we can conclude that S. kurramense possesses low degree of cytotoxicity as the LC50 values of extracts were beyond 200 µg/ml.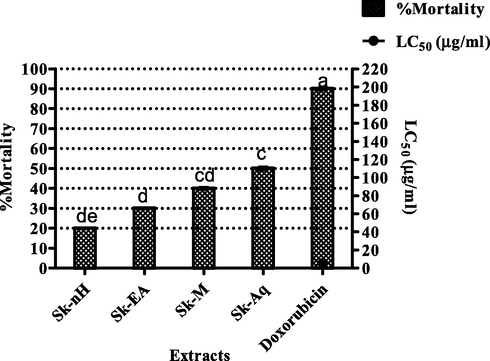
Brine shrimp assay for S. kurramense extracts. Values are presented as mean ± standard deviation from the triplicate investigation. The columns with different superscript (a-e) letters show significantly (P < 0.05) different means.
In evaluation of bioactivity, <1000 μg/ml LC50 value is deemed cytotoxic (Nguta et al., 2012). In the current study, 100% of the tested extracts showed LC50 values < 1000 μg/ml, advocating the existence of cytotoxic components such as flavonoids, phenols, saponins and others responsible for the observed deaths (Aziz et al., 2013). The observed activity could be credited to polyphenols revealed by HPLC.
5 Conclusion
In conclusion, this study underscored the therapeutic potential with prominence on antimicrobial ability, phytochemical quantification, multimode antioxidant, and biocompatibility characterization of S. kurramense whereby, it is shown that the selection of extraction solvent is a critical mutable in biological profiling of medicinal plants. Overall, maximum extract recovery was revealed by aqueous extract. A substantial antibacterial and antifungal activity was demonstrated by all extracts however, highest antimicrobial and antiviral proficiency was presented by ethyl acetate extract. Noteworthy gallic acid equivalent total phenolic and quercetin equivalent flavonoid content was presented by aqueous extract. HPLC-DAD analysis quantified considerable amounts of polyphenols amongst various extracts. All extracts contained considerable antioxidant potential. Notable α-amylase and glucosidase inhibition was shown by n-hexane extract. All extracts inhibited urease in a concentration dependent manner. All the extracts were found to be moderately cytotoxic and negligible hemolysis is indicative of their biocompatibility. These results should be extrapolated through bioassay guided isolation of “lead” compounds and detailed mechanistic studies to develop therapeutics against microbial resistance.
6 Author’s contribution
We substantiate that all authors have made significant contribution to the work and approved the finishing description of publication. SA designed and conceptualized the study and critically revised the manuscript. SH supervised the undertaking of experiments, helped in data curation, revising the manuscript and approved the final version. NA performed all the experimentation, analyzed, and interpreted the data, wrote and revised the manuscript. SAM and IN helped in manuscript write-up and critical review of the manuscript. HF contributed in data validation and critical revision of the manuscript.
Acknowledgement
The researchers would like to thank the Deanship of Scientific Research, Qassim University for funding the publication of this project.
Declaration of Competing Interest
The authors declare that they have no known competing financial interests or personal relationships that could have appeared to influence the work reported in this paper.
References
- ABBAS, A., NAQVI, S. A. R., RASOOL, M. H., NOUREEN, A., MUBARIK, M. S. & TAREEN, R. B. 2021. Phytochemical analysis, antioxidant and antimicrobial screening of seriphidium oliverianum plantextractsDose-Response,19,15593258211004739.Doi: 10.1177%2F15593258211004739.
- AGRAWAL, P. K., AGRAWAL, C. & BLUNDEN, G. 2020. Quercetin: antiviral significance and possible COVID-19 integrative considerations. Natural Product Communications, 15, 1934578X20976293Doi: 10.1177%2F1934578X20976293.
- Total phenolic contents and free radical scavenging activity of certain Egyptian Ficus species leaf samples. Food chemistry. 2009;114:1271-1277.
- [Google Scholar]
- Antimicrobial, hemagglutination and phytotoxic activity of crude ethanolic and aqueous extracts of Seriphidium kurramense. J. Tradit. Chin. Med.. 2018;38:433-438.
- [CrossRef] [Google Scholar]
- Polarity directed optimization of phytochemical and in vitro biological potential of an indigenous folklore: Quercus dilatata Lindl. ex Royle. BMC Complement. Alternat. Med.. 2017;17:1-16.
- [Google Scholar]
- Preliminary phytochemical screening and in vitro antioxidant activities of the aqueous extract of Helichrysum longifolium DC. BMC Complement. Alternat. Med.. 2010;10:1-8.
- [Google Scholar]
- ALWAN, A. 2011. Global status report on noncommunicable diseases 2010, World Health Organization.
- Anti-Helicobacter pylori and urease inhibition activities of some traditional medicinal plants. Molecules. 2013;18:2135-2149.
- [CrossRef] [Google Scholar]
- Natural phenolic compounds: a potential antifungal agent. Microb. Pathog. Strategies Combating Them: Sci., Technol. Edu.. 2013;1:1189-1195.
- [Google Scholar]
- Antioxidant activity/capacity measurement. 1. Classification, physicochemical principles, mechanisms, and electron transfer (ET)-based assays. J. Agric. Food. Chem.. 2016;64:997-1027.
- [CrossRef] [Google Scholar]
- Natural products–antifungal agents derived from plants. J. Asian Nat. Prod. Res.. 2009;11:621-638.
- [CrossRef] [Google Scholar]
- Alpha glucosidase inhibitory activities of plants with focus on common vegetables. Plants. 2019;9:2.
- [CrossRef] [Google Scholar]
- Secondary metabolites, antimicrobial, brine shrimp lethality & 4th instar Culex quinquefasciatus mosquito larvicidal screening of organic & inorganic root extracts of Microcos paniculata. IOSR J. Pharm. Biol. Sci.. 2013;8:58-65.
- [Google Scholar]
- In vitro screening and evaluation of some Indian medicinal plants for their potential to inhibit Jack bean and bacterial ureases causing urinary infections. Pharm. Biol.. 2015;53:326-333.
- [CrossRef] [Google Scholar]
- Luteolin inhibits hepatitis B virus replication through extracellular signal-regulated kinase-mediated down-regulation of hepatocyte nuclear factor 4α expression. Mol. Pharm.. 2016;13:568-577.
- [CrossRef] [Google Scholar]
- Antifungal capacity of major phenolic compounds of Olea europaea L. against Phytophthora megasperma Drechsler and Cylindrocarpon destructans (Zinssm.) Scholten. Physiol. Mol. Plant Pathol.. 2006;69:224-229.
- [CrossRef] [Google Scholar]
- Ferulic acid and its therapeutic potential as a hormetin for age-related diseases. Biogerontology. 2009;10:97-108.
- [Google Scholar]
- Antidiabetic medicinal plants as a source of alpha glucosidase inhibitors. Curr. Diabetes Rev.. 2010;6:247-254.
- [Google Scholar]
- A brief multi-disciplinary review on antimicrobial resistance in medicine and its linkage to the global environmental microbiota. Front. Microbiol.. 2013;4:96.
- [CrossRef] [Google Scholar]
- In vitro antifungal activity of polyphenols-rich plant extracts against Phytophthora cinnamomi Rands. Afr. J. Agric. Res.. 2015;10:4554-4560.
- [CrossRef] [Google Scholar]
- Extraction and quantitative HPLC analysis of coumarin in hydroalcoholic extracts of Mikania glomerata Spreng:(“ guaco”) leaves. J. Braz. Chem. Soc.. 2001;12:706-709.
- [Google Scholar]
- CETIN-KARACA, H. 2011. Evaluation of natural antimicrobial phenolic compounds against foodborne pathogens.
- Phenolics and antifungal activities analysis in industrial crop Jerusalem artichoke (Helianthus tuberosus L.) leaves. Ind. Crops Prod.. 2013;47:339-345.
- [CrossRef] [Google Scholar]
- CHEYNIER, V. 2012. Phenolic compounds: from plants to foods. Phytochemistry reviews, 11, 153-177.
- The role of polyphenols in human health and food systems: a mini-review. Front. Nutr.. 2018;5:87.
- [CrossRef] [Google Scholar]
- Antiviral efficacy of flavonoids against enterovirus 71 infection in vitro and in newborn mice. Viruses. 2019;11:625.
- [CrossRef] [Google Scholar]
- DANESH, A., BEHRAVAN, J., RAMEZANI, M. & SABETI NOGHABI, Z. 2015. Development of a Plaque Reduction Assay as an Antiphage Activity Evaluation Method. Research in Molecular Medicine, 3, 23-27.
- Antiviral activity of plants and their isolated bioactive compounds: an update. Phytother. Res.. 2020;34:742-768.
- [CrossRef] [Google Scholar]
- The antibacterial activity of extracts of nine plant species with good activity against Escherichia coli against five other bacteria and cytotoxicity of extracts. BMC Complement. Alternat. Med.. 2017;17:1-10.
- [Google Scholar]
- Antidiabetic effects of natural plant extracts via inhibition of carbohydrate hydrolysis enzymes with emphasis on pancreatic alpha amylase. In: Expert opinion on therapeutic targets. 2012.
- [CrossRef] [Google Scholar]
- Phenolic acid profiling and antiglycation studies of leaf and fruit extracts of tyrosine primed Momordica charantia seeds for possible treatment of diabetes mellitus. Pak. J. Pharm. Sci. 2018;31:2667-2672.
- [Google Scholar]
- Extraction optimization of medicinally important metabolites from Datura innoxia Mill.: an in vitro biological and phytochemical investigation. BMC Complement. Alternat. Med.. 2015;15:1-18.
- [CrossRef] [Google Scholar]
- FERNANDES DE OLIVEIRA, A. M., SOUSA PINHEIRO, L., SOUTO PEREIRA, C. K., NEVES MATIAS, W., ALBUQUERQUE GOMES, R., SOUZA CHAVES, O., VANDERLEI DE SOUZA, M. D. F., NÓBREGA DE ALMEIDA, R. & SIMÕES DE ASSIS, T. 2012. Total phenolic content and antioxidant activity of some Malvaceae family species. Antioxidants, 1, 33-43.Doi: 10.3390/antiox1010033.
- Chemotypic variations and phytotoxic studies of essential oils of endemic medicinal plant, Seriphidium kurramense, from Pakistan. J. Med. Plants Res.. 2010;4:309-315.
- [CrossRef] [Google Scholar]
- The effects of solvents and extraction method on the phenolic contents and biological activities in vitro of Tunisian Quercus coccifera L. and Juniperus phoenicea L. fruit extracts. Food Chem.. 2007;105:1126-1134.
- [CrossRef] [Google Scholar]
- IMRAN TOUSIF, M., RIAZ, N., NAZIR, M., AHMAD, S., SALEEM, M., JABBAR, A., ASHRAF, M. & BAKHSH TAREEN, R. 2017. Anti-urease Secondary Metabolites from Seriphidium quettense. Records of Natural Products, 11.
- In vitro assessment of antioxidant potential and determination of polyphenolic compounds of Hedera nepalensis K. Koch. Arab. J. Chem.. 2017;10:S3699-S3706.
- [CrossRef] [Google Scholar]
- In vitro antiviral activity of plant extracts from Asteraceae medicinal plants. Virol. J.. 2013;10:1-10.
- [Google Scholar]
- Antioxidant activity and free radical scavenging reactions of gentisic acid: in-vitro and pulse radiolysis studies. Free radical research. 2012;46:11-20.
- [Google Scholar]
- Recent advances in design of new urease inhibitors: a review. J. Adv. Res.. 2018;13:101-112.
- [CrossRef] [Google Scholar]
- Antifungal and antioxidant activities of organic and aqueous extracts of Annona squamosa Linn. leaves. J. Food Drug Anal.. 2015;23:795-802.
- [CrossRef] [Google Scholar]
- Phytochemical analysis and comprehensive evaluation of pharmacological potential of Artemisia brevifolia Wall. ex DC. Saudi Pharma. J. 2022
- [CrossRef] [Google Scholar]
- Phytochemical and in vitro biological evaluation of Artemisia scoparia Waldst. & Kit for enhanced extraction of commercially significant bioactive compounds. J. Appl. Res. Med. Aromat. Plants. 2015;2:77-86.
- [CrossRef] [Google Scholar]
- Apigenin promotes antibacterial activity via regulation of nitric oxide and superoxide anion production. J. Basic Microbiol.. 2020;60:862-872.
- [CrossRef] [Google Scholar]
- Antioxidant and free radical scavenging potential of Citrullus colocynthis (L.) Schrad. methanolic fruit extract. Acta Pharma.. 2008;58:215-220.
- [CrossRef] [Google Scholar]
- Antioxidant mediated protective effect of Parthenium hysterophorus against oxidative damage using in vitro models. BMC Complement. Alternat. Med.. 2013;13:1-9.
- [Google Scholar]
- Apigenin induces cell shrinkage in Candida albicans by membrane perturbation. FEMS Yeast Res.. 2018;18:foy003.
- [CrossRef] [Google Scholar]
- Medicinal plants in management of diabetes mellitus: an overview. Ceylon J. Sci.. 2020;49:3-11.
- [Google Scholar]
- MALIK, A., MALIK, N., DHIMAN, P., KHATKAR, A. & KAKKAR, S. 2019. Molecular docking, synthesis, α-amylase inhibition, urease inhibition and antioxidant evaluation of 4-hydroxy-3-methoxy benzoic acid derivatives. Research Journal of Pharmacy and Technology, 12, 5653-5663.http://dx.doi.org/10.5958/0974-360X.2019.00978.8.
- Bioprospecting Dodonaea viscosa Jacq.; a traditional medicinal plant for antioxidant, cytotoxic, antidiabetic and antimicrobial potential. Arabian J. Chem. 2022:103688.
- [CrossRef] [Google Scholar]
- Antibacterial potential of the Cistus incanus L. phenolics as studied with use of thin-layer chromatography combined with direct bioautography and in situ hydrolysis. J. Chromatogr. A. 2018;1534:170-178.
- [CrossRef] [Google Scholar]
- The antimicrobial and antiviral activity of polyphenols from almond (Prunus dulcis L.) skin. Nutrients. 2019;11:2355.
- [CrossRef] [Google Scholar]
- In vitro studies on alpha amylase and alpha glucosidase inhibitory activities of selected plant extracts. Eur. J. Experiment. Biol.. 2013;3:128-132.
- [Google Scholar]
- Evaluation of acute toxicity of crude plant extracts from kenyan biodi-versity using brine shrimp, artemia salina l. (artemiidae) 2012
- [Google Scholar]
- NILE, S. H., KEUM, Y. S., NILE, A. S., JALDE, S. S. & PATEL, R. V. 2018. Antioxidant, anti‐inflammatory, and enzyme inhibitory activity of natural plant flavonoids and their synthesized derivatives. Journal of biochemical and molecular toxicology, 32, e22002.Doi: 10.1002/jbt.22002
- Antimicrobial and phytochemical screening of methanolic fruit extract of Withania coagulans L. Dunal for evaluating the antidiabetic activity. Pharma. Innov. J.. 2018;7:197-204.
- [Google Scholar]
- GC-MS metabolic profiling and anti-urease activity of non-polar fractions of Calligonum Polygonoides L. (Polygonaceae) and Crateva Adansonii DC. Prodr. (Capparaceae) Trop. J. Pharm. Res.. 2019;18:1955-1960.
- [CrossRef] [Google Scholar]
- Antioxidant properties, phenolic composition, bioactive compounds and nutritive value of medicinal halophytes commonly used as herbal teas. S. Afr. J. Bot.. 2017;110:240-250.
- [CrossRef] [Google Scholar]
- REGO, Y. F., QUEIROZ, M. P., BRITO, T. O., CARVALHO, P. G., DE QUEIROZ, V. T., DE FÁTIMA, Â. & MACEDO JR, F. 2018. A review on the development of urease inhibitors as antimicrobial agents against pathogenic bacteria. Journal of Advanced Research, 13, 69-100.Doi: 10.1016/j.jare.2018.05.003
- Phytochemical screening, free radical scavenging, antioxidant activity and phenolic content of Dodonaea viscosa. J. Serb. Chem. Soc.. 2012;77:423-435.
- [CrossRef] [Google Scholar]
- ROCHA, M. F. G., SALES, J. A., DA ROCHA, M. G., GALDINO, L. M., DE AGUIAR, L., PEREIRA-NETO, W. D. A., DE AGUIAR CORDEIRO, R., CASTELO-BRANCO, D. D. S. C. M., SIDRIM, J. J. C. & BRILHANTE, R. S. N. 2019. Antifungal effects of the flavonoids kaempferol and quercetin: a possible alternative for the control of fungal biofilms. Biofouling, 35, 320-328.Doi: 10.1080/08927014.2019.1604948.
- RUDDARAJU, L. K., PAMMI, S. V. N., SANKAR GUNTUKU, G., PADAVALA, V. S. & KOLAPALLI, V. R. M. 2020. A review on anti-bacterials to combat resistance: From ancient era of plants and metals to present and future perspectives of green nano technological combinations. Asian Journal of Pharmaceutical Sciences, 15, 42-59.Doi: 10.1016/j.ajps.2019.03.002.
- Antifungal activity of plant extracts with potential to control plant pathogens in pineapple. Asian Pacific J. Trop. Biomed.. 2016;6:26-31.
- [CrossRef] [Google Scholar]
- Anti-hyperglycemic activity of polyphenols isolated from barnyard millet (Echinochloa utilis L.) and their role inhibiting α-glucosidase. J. Korean Soc. Appl. Biol. Chem.. 2015;58:571-579.
- [CrossRef] [Google Scholar]
- Inhibitory activity against urease of quercetin glycosides isolated from Allium cepa and Psidium guajava. Biosci. Biotechnol. Biochem.. 2010;74:878-880.
- [CrossRef] [Google Scholar]
- Phytochemical screening and biolgical evaluation of some potential constituents of Seriphidium oliverianum. RJLBPCS 2017
- [Google Scholar]
- Antimicrobial activity of ferulic acid against Cronobacter sakazakii and possible mechanism of action. Foodborne Pathog. Disease. 2016;13:196-204.
- [Google Scholar]
- A potential plasmid-curing agent, 8-epidiosbulbin E acetate, from Dioscorea bulbifera L. against multidrug-resistant bacteria. Int. J. Antimicrob. Agents. 2008;32:405-410.
- [CrossRef] [Google Scholar]
- Antibacterial & antiplasmid activities of Helicteres isora L. Indian J Med Res. 2010;132:94-99.
- [Google Scholar]
- Curing of plasmid-mediated antibiotic resistance in multi-drug resistant pathogens using Alpinia galanga rhizome extract. Adv. Biotechnol.. 2013;13:1-5.
- [Google Scholar]
- Antimicrobial activities and mechanism of action of Cymbopogon khasianus (Munro ex Hackel) Bor essential oil. BMC Complement. Med. Ther.. 2020;20:1-9.
- [Google Scholar]
- Determining the antioxidant activity of certain medicinal plants of Attapady, (Palakkad). Current botany: India using DPPH assay; 2011. p. :1.
- Inhibition of α-glucosidase and α-amylase by flavonoids. J. Nutr. Sci. Vitaminol.. 2006;52:149-153.
- [CrossRef] [Google Scholar]
- TARSIA, C., DANIELLI, A., FLORINI, F., CINELLI, P., CIURLI, S. & ZAMBELLI, B. 2018. Targeting Helicobacter pylori urease activity and maturation: In-cell high-throughput approach for drug discovery. Biochimica et Biophysica Acta (BBA)-General Subjects, 1862, 2245-2253.Doi: 10.1016/j.bbagen.2018.07.020.
- Expanding antimicrobial resistance and shrinking antibiotic arsenal: phytochemicals—a ray of hope. MGM J. Med. Sci.. 2019;6:191.
- [CrossRef] [Google Scholar]
- TODAR, K. 2011. Bacterial resistance to antibiotics (page 3). Todar’s online textbook of bacteriology, 4.
- Qualitative and quantitative analysis of polyphenols in Lamiaceae plants—a review. Plants. 2018;7:25.
- [CrossRef] [Google Scholar]
- Antioxidant and cytotoxic activities and phytochemical analysis of Euphorbia wallichii root extract and its fractions. Iran. J. Pharma. Res.: IJPR. 2012;11:241.
- [Google Scholar]
- Phytotoxic, cytotoxic and insecticidal activities of Calendula arvensis L. J. Biotechnol. Pharm. Res. 2012;3:104-111.
- [Google Scholar]
- Phytochemical analysis of some medicinal plants from western region of India. Res. J. Med. Plant. 2011;5:567-576.
- [Google Scholar]
- Global trends in antimicrobial use in food animals. Proc. Natl. Acad. Sci.. 2015;112:5649-5654.
- [CrossRef] [Google Scholar]
- A review on flavonoid apigenin: dietary intake, ADME, antimicrobial effects, and interactions with human gut microbiota. Biomed Res. Int.. 2019;2019
- [CrossRef] [Google Scholar]
- Structure-activity relationship and synthetic methodologies of α-santonin derivatives with diverse bioactivities: a mini-review. Eur. J. Med. Chem.. 2019;175:215-233.
- [Google Scholar]
- Antibacterial activity and mechanism of luteolin on Staphylococcus aureus. Wei Sheng Wu Xue Bao=. Acta Microbiol. Sin.. 2010;50:1180-1184.
- [Google Scholar]
- Short hybrid peptides incorporating β-and γ-amino acids as antimicrobial agents. Peptides. 2017;97:46-53.
- [CrossRef] [Google Scholar]
- Clinical and Laboratory Standards Institute (CLSI): Reference Method for Broth Dilution Antifungal Susceptibility Testing of Filamentous Fungi. Carol Stream, IL: Allured Publishing Corporation; 2008.
- α-Glucosidase inhibition by luteolin: kinetics, interaction and molecular docking. Int. J. Biol. Macromol.. 2014;64:213-223.
- [CrossRef] [Google Scholar]
- Quercetin: its main pharmacological activity and potential application in clinical medicine. Oxid. Med. Cell. Longevity. 2020;2020
- [CrossRef] [Google Scholar]
- Polarity based characterization of biologically active extracts of Ajuga bracteosa Wall. ex Benth. and RP-HPLC analysis. BMC Complement. Alternat. Med.. 2017;17:1-16.
- [Google Scholar]
- Inhibitory mechanism of apigenin on α-glucosidase and synergy analysis of flavonoids. J. Agric. Food. Chem.. 2016;64:6939-6949.
- [CrossRef] [Google Scholar]
- The antioxidant property and α-amylase inhibition activity of young apple polyphenols are related with apple varieties. LWT. 2019;111:252-259.
- [CrossRef] [Google Scholar]
- Inhibition mechanism of ferulic acid against α-amylase and α-glucosidase. Food Chem.. 2020;317:126346
- [CrossRef] [Google Scholar]
- Hemolytic activity of different herbal extracts used in Algeria. Int. J. Pharm. Sci. Res.. 2014;5:495-500.
- [Google Scholar]
- OZGEN, S., KILINC, O. K. & SELAMOĞLU, Z. 2016. Antioxidant activity of quercetin: a mechanistic review. Turkish Journal of Agriculture-Food Science and Technology, 4, 1134-1138.
- ROY, S., MALLICK, S., CHAKRABORTY, T., GHOSH, N., SINGH, A. K., MANNA, S. & MAJUMDAR, S. 2015. Synthesis, characterisation and antioxidant activity of luteolin–vanadium (II) complex. Food Chemistry, 173, 1172-1178.


