

Translate this page into:
Polystyrene electrospun nanofibers as effective sorbents for the removal of atypical antipsychotics: Kinetic and thermodynamic studies
⁎Corresponding authors. hbghzhanjundong@163.com (Zhanjun Dong), anjingyaofen@163.com (Jing An)
-
Received: ,
Accepted: ,
This article was originally published by Elsevier and was migrated to Scientific Scholar after the change of Publisher.
Peer review under responsibility of King Saud University.
Abstract
In this study, polystyrene nanofibers were prepared by electrospinning for the adsorption of olanzapine, risperidone, and clozapine from aqueous solution. The properties of polystyrene nanofibers were characterized via FTIR, SEM, TEM, TG, and XRD analyses. In addition, the impact of contact time, initial ion concentration, adsorbent dosage, temperature, and pH on the adsorption was studied. The adsorption kinetics and thermodynamic evaluation of three analytes on PS nanofibers were performed. The adsorption of the three analytes by polystyrene nanofibers followed the first-order kinetics with constant rates of 0.02348, 0.02683, and 0.03024 mg/g min for olanzapine, risperidone, and clozapine, respectively. Further, the adsorption conformed to Redlich-Peterson isotherm model and the maximum adsorption capacities for olanzapine, risperidone, and clozapine were 12.33, 8.36, and 12.96 mg/g, respectively. The adsorption process was characterized by spontaneous, exothermic, and physical reaction. The regeneration of nanofiber adsorbent showed that the adsorption capacity did not significantly change after 5 cycles of desorption. The selectivity of different analytes followed the order of clozapine > risperidone > olanzapine. Thus, the polystyrene electrospun nanofibers exhibit good potential as novel adsorbents for the isolation and purification of antipsychotic drugs from biological samples.
Keywords
Kinetics and isotherms
Polystyrene nanofibers
Regeneration
Electrospinning
Adsorption capacity

1 Introduction
Atypical antipsychotics (AAPs) have been widely used to treat patients with schizophrenia, bipolar disorder, and other psychotic disorders, or those diagnosed with severe behavioral disorders (Stroup & Gray, 2018; Uçok & Gaebel, 2008). Olanzapine, risperidone, and clozapine are commonly used atypical antipsychotic drugs. The results of a large meta-analysis show that clozapine, olanzapine, and risperidone were significantly better than the other AAPs in alleviating symptoms (Krause et al., 2019). The widespread use of atypical antipsychotics is accompanied by a growing awareness of drug-related adverse effects, such as weight gain, diabetes mellitus, hyperlipidemia, prolonged QTc interval, myocarditis, and cataracts. Studies suggest that the adverse effects are dose-dependent (Uçok & Gaebel, 2008). Therefore, the therapy with AAPs requires close drug monitoring.
Several analytical methods used for biological samples with complex matrices require a pretreatment step for sample separation and purification, prior to instrumental analysis. The ideal pretreatment process is expected to be fast, economical, and safe, but also easily automated and exhibit high-throughput performance (Hussain et al., 2020). Solid phase extraction (SPE) is crucial in the field of sample pretreatment, due to its high selectivity, reproducibility, and high throughput.
The choice of sorbent material is a significant factor in SPE. In recent years, new adsorbents such as magnetic surface-modified materials, nanoparticles, molecularly/ion-imprinted polymers, and metal organic frameworks have been developed (Mahmoodi et al., 2020; Mahmoodi et al., 2019; Demeestere et al., 2010; Oveisi et al., 2018). Techniques used for nanotechnology-based sample preparation represent a major advance in the field of pretreatment studies. Electrospinning is a technique based on repulsive electrostatic forces to draw a viscoelastic solution into nanofibers. In addition, it is the simplest and most flexible method for the preparation of nanofibers. Synthetic polymers are the most popular class of electrospun materials used as SPE sorbents. The polymers show greatest potential for tuning the sorption chemistries, and exhibit the necessary viscoelasticity due to their long chains (Chigome et al., 2011). Polystyrene electrospun nanofibers are three-dimensional structures with robust chemical and thermal stability. Other advantages include ease of preparation, low cost of production, and safety. The large specific surface area, high porosity, and surface homogeneity of the nanomaterials facilitate SPE miniaturization and efficient extraction (Lucena et al., 2011).
To the best of our knowledge, there are no studies evaluating the role of polystyrene nanofibers in the adsorption of atypical antipsychotic drugs. Therefore, we investigated the adsorption mechanism of olanzapine, clozapine, and risperidone, in addition to their selectivity and adsorption capacity. In this study, polystyrene (PS) nanofibers were successfully prepared by electrospinning. Further, the kinetics, thermodynamic properties, and adsorption isotherms of the PS nanofibers were investigated. The results were used to assess the feasibility of PS nanofibers as adsorbents in SPE and separation of antipsychotic drugs from biological samples. Nanofibers with three-dimensional net structure were obtained by optimizing several parameters. The characteristics of the synthetic nanofibers were determined via Fourier-transform infrared spectroscopy (FTIR), scanning electron microscopy (SEM), transmission electron microscopy (TEM), thermogravimetric analysis (TGA), and X-ray diffraction (XRD). The removal kinetics, isotherms, and thermodynamics were studied in detail. Further, the regeneration and stability of the synthesized nanofibers were investigated and discussed.
2 Materials and methods
2.1 Reagents
The Olanzapine (0521A022, purity: 98 %) is purchased from Solabao (Beijing), the risperidone (100570–201704, purity: 99.9 %) and clozapine (100323–201703, purity: 99.7 %) are purchased from the National Institutes for Food and Drug Control (Beijing, China), Methanol is purchased from Fisher Scientific (Fair Lawn, USA), Polystyrene (MW 230000) is purchased from Shijiazhuang Chemical Fiber Co., Tetrahydrofuran (THF) and N,N-dimethylformamide (DMF) are purchased from Sinopharm Chemical Reagent Co., ltd, China..
2.2 Preparation of PS nanofibers
The nanofibers were synthesised according to a method previously proposed by our team (Fan et al., 2022).
2.3 Instruments and chromatography conditions
Acquity UPLC H-Class system (Waters, MA, USA), SS-2535 Electrospinning Equipment (Ucalery, Beijing, China), and constant-temperature oscillator (Zhicheng, Shanghai, China) were used in the study. The chromatographic separation was achieved using a C18 column (Zorbax Eclipse XDB-C18 column, 150 × 4.6 mm, 5 µm) with a column temperature of 35 °C. Using a mixture of 50 mmol/L potassium dihydrogen phosphate solution (A) and acetonitrile (B) as a mobile phase, the gradient was set at a flow rate of 1 mL/min as follows: 0–1 min 10 % B, 1–5 min, 10 % → 40 % B, 5–7 min 40 % B, and 7–8 min 10 % B. The detection wavelength was set to 280 nm, with an injection volume of 10 μL.
2.4 Adsorption experiments
To analyze the adsorption ability and optimum adsorption conditions for PS nanofibers, several factors including the drug concentration, contact time, temperature, pH, and adsorbent dosage were investigated.
2.4.1 Influence of pH of the sample solution
A 10 mL aliquot of mixed standard solution with a concentration of 10 mg/L was added to a 50 mL conical flask. The pH values were then adjusted to 3, 5, 7, 9, and 11, followed by the addition of 10 mg of nanofiber. The solution was centrifuged at 150 r/min and 37°C until adsorption equilibrium was reached. The supernatant was filtered and used for analysis. The adsorption capacity was then calculated. Subsequently, the effect of pH on the adsorption of the three analytes was evaluated.
2.4.2 Effect of adsorbent concentration
A mixed standard aqueous solution (10 mL) with a concentration of 10 mg/L was added to a 50 mL conical flask, and the pH was adjusted to neutral. Next, 3, 5, 10, 15, and 20 mg of PS nanofibers were added to the flask, and centrifuged at 150 r/min and 37°C until adsorption equilibrium was reached. The supernatant was filtered and used for analysis. The adsorption capacity was calculated in order to evaluate the effect of adsorbent dosage on the adsorption efficiency of the three substances.
2.4.3 Effect of the initial analyte concentration
A 10 mL solution of mixed standards with initial concentrations of 5 mg/L, 10 mg/L, 15 mg/L, 20 mg/L, and 25 mg/L was prepared. The pH was then adjusted to neutral, followed by the addition of 10 mg of PS nanofiber and centrifuged at 37°C and 150 r/min until adsorption equilibrium was reached.
2.4.4 Isothermal adsorption
A 10 mL solution of mixed standards with initial concentrations of 5 mg/L, 10 mg/L, 15 mg/L, 20 mg/L, and 25 mg/L was prepared. The pH was then adjusted to neutral, followed by the addition of 10 mg of PS nanofibers. The conical flask was transferred to a thermostatic shaker and centrifuged at three different temperatures (298 K, 310 K, and 318 K) and 150 r/min for 2 h. The supernatant was filtered and used for analysis. The equilibrium adsorption capacity was calculated and the adsorption isotherm was determined.
2.4.5 Adsorption kinetics
The pH was adjusted to neutral, and 10 mg of PS nanofiber was added. The conical flask was transferred to a constant temperature shaker and centrifuged at 150 r/min at three different temperatures (298 K, 310 K, and 318 K). The samples were obtained at 0, 10, 20, 30, 40, 50, 60, 80, 120, and 140 min, and the supernatant was filtered and analyzed in order to calculate the adsorption capacity at different times. The pseudo-first-order kinetic models (1), pseudo-second-order kinetic models (2) and intra particle diffusion models (3) were then fitted (Khorasani et al., 2021; Jafarnejad et al., 2020):
2.4.6 Adsorption isotherm model
Mixed standards including 10 mL aqueous solutions with initial concentrations of 5 mg/L, 10 mg/L, 15 mg/L, 20 mg/L, and 25 mg/L were prepared, and the pH is adjusted to neutral, followed by the addition of 10 mg of PS nanofibers and centrifuged at 298 K, 310 K, and 318 and 150 r/min until the adsorption equilibrium was reached. The supernatant was filtered and used for analysis, and the adsorption capacity was calculated. The data obtained from the thermodynamic adsorption experiments were then fitted using the Langmuir, Freundlich and Redlich-Peterson isothermal adsorption models, expressed by Equations (5), (6), and (7), respectively (Al-Ghouti & Da'ana, 2020).
2.4.7 Thermodynamic study of adsorption
Three thermodynamic parameters including changes in enthalpy (ΔH, kJ/mol), entropy (ΔS, J/mol K), and free energy (ΔG,kJ/mol) were calculated using Equation (7) (Wang et al., 2007) and Gibbs-Helmholtz equation (Equation (8)).
3 Results and discussion
3.1 Characterization of PS nanofibers
The surface morphology of the synthesized PS nanofibers and their sizes were studied by SEM and TEM (Fig. 1). The SEM image shows that the nanofiber is three-dimensional, and the diameter of the fibers is almost 300 nm (Fig. 1b). Fig. 1c presents the TEM images of the synthesized nanofibers with smooth surface, good distribution size and shape.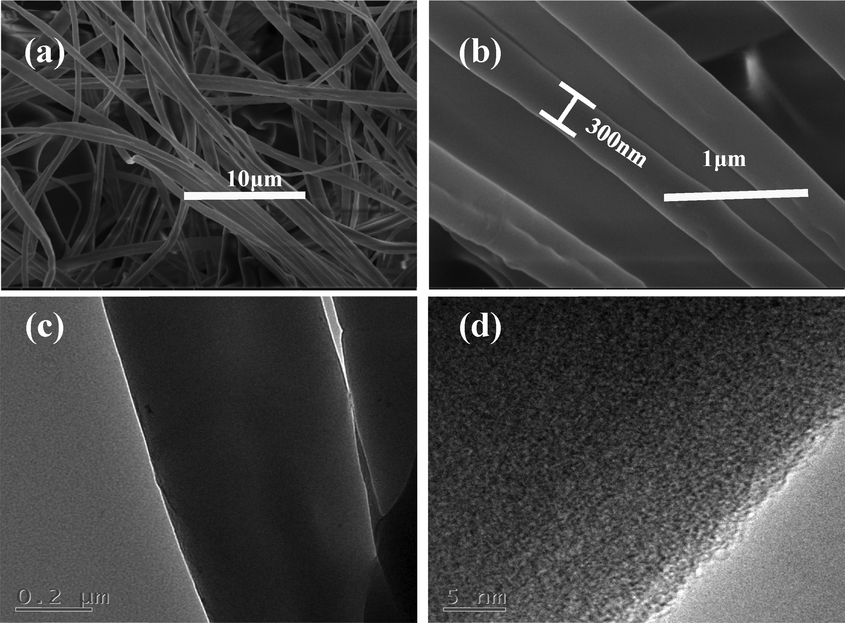
Characterization of PS nanofibers. (a) SEM image-low-resolution; (b) SEM image-high-resolution;(c) low-resolution TEM image;(d) high-resolution TEM image.
3.2 Stability of the PS nanofibers
The PS nanofibers were insoluble and stable in methanol, acetonitrile, tert-butyl methyl ether, and water, but soluble in ethyl acetate. In addition, TGA curves shows that the sample exhibited two main weight loss peaks, with the weight loss peak between 50 °C and 300 °C attributed to the loss of bound water on the surface of the material, and the larger weight loss peak between 300 °C and 450 °C was due to the pyrolysis of the skeletal structure. This result demonstrated that the framework of PS nanofibers was thermally stable up to 300 °C (Fig. 2a). The chemical stability of the PS nanofibers was confirmed via XRD. As shown in Fig. 2b, the XRD patterns of the sample exhibit dispersed diffraction peaks, demonstrating low crystallinity of the synthetic PS nanofibers and the high chemical stability of the sorbent.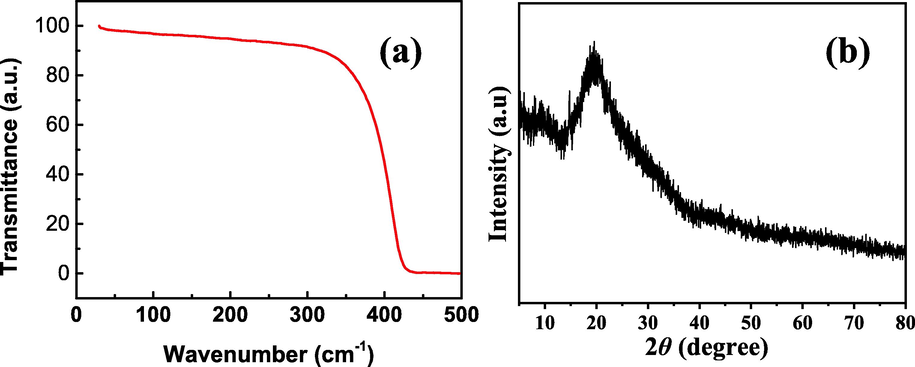
The stability of the PS nanofibers.(a) XRD spectra; (b)TG curves.
3.3 Mechanism of adsorption of AAPs
The adsorption mechanism was analyzed via FTIR spectroscopy. Fig. 3a shows the infrared spectrum of the synthesized PS nanofibers. The FTIR spectra of PS nanofibers show peaks at 2931 cm−1 and 2866 cm−1 due to C—H stretching vibration of methylene; a peak at 3023 cm−1 due to C—H stretching vibration of the benzene ring; three immediately attached characteristic peaks at 1598 cm−1, 1493 cm−1, and 1449 cm−1 generated by the deformation vibration of the benzene ring; and at 1262 cm−1 and 1028 cm−1 attributed to vibrations due to in-plane C—H bond bending and C—C single bond skeleton of the two materials, respectively. Fig. 3b shows the infrared spectrum of PS nanofibers adsorbed with olanzapine. In addition to exhibiting a similar polystyrene spectrum as shown in Fig. 3a, a large peak was detected near 3371 cm−1 associated with the hydroxyl group of water adsorbed on the surface of the material, as well as an adsorption peak at 1641 cm−1 due to the C⚌N bond vibration and 1370 cm−1 attributed to the C—N bond vibration. This demonstrates that olanzapine was adsorbed on PS nanofibers. The IR spectra reveal significantly increased water absorption on the surface of the material after the adsorption of olanzapine, which suggests the possible role of hydrogen bonds. Thus, the primary mechanism of olanzapine adsorption by nanofibers is mediated via hydrogen bonding and π-π interactions. Fig. 3c and 3d respectively show the IR spectra of PS nanofibers adsorbed with risperidone and clozapine. The basic skeletal structure of the PS nanofibers is similar to the structure presented in Fig. 3a. The IR spectrum after the adsorption of risperidone and clozapine revealed a large hydrophobicity of the surface of the material, suggesting that the main mechanism of nanofiber adsorption of risperidone and clozapine was mediated via π-π interaction.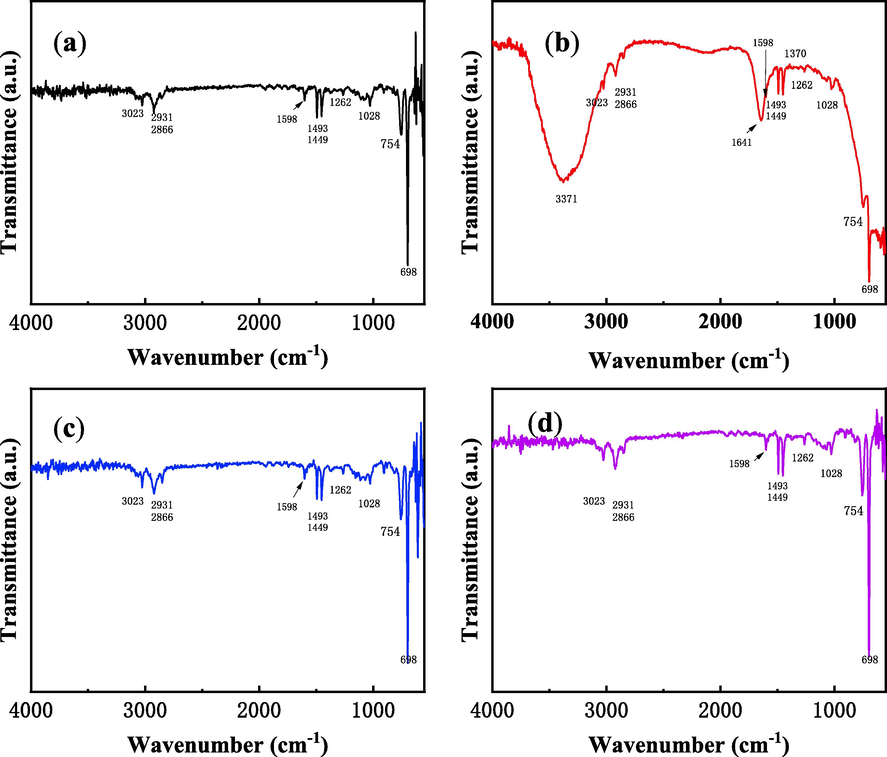
IR spectra of the PS nanofibers. (a) PS; (b) PS + olanzapine; (c) PS + risperidone;(d) PS + clozapine.
The possible mechanism of adsorption is shown in Fig. 4. Structures of three analytes are shown in Fig. 4. All the analytes possess aromatic and hydrophobic molecular components. In addition, PS shown in Fig. 4, also known as aromatic adsorbent, is a typical non-polar adsorbent, suggesting adsorption via a π–π interaction mediated via hydrophobic and an aromatic residues ((Li et al., 2016; Luo et al., 2018; Mahmoud et al., 2020).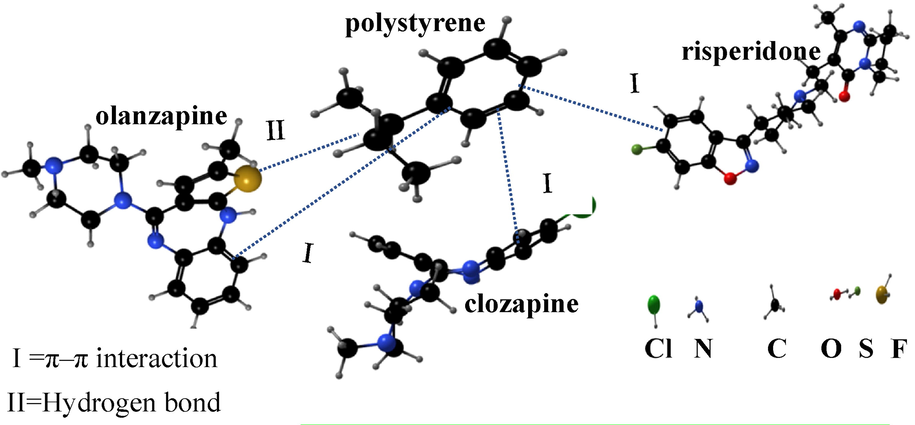
The possible adsorption mechanisms on PS nanofibers.
3.4 Optimization of the adsorption experimental conditions
The pH of the sample solution has a significant effect on the extraction efficiency. In many cases, compounds exist in different states under different pH conditions. In this study, the influence of pH on the adsorption performance of three AAPs was investigated. As shown in Fig. 5a, the sorption efficiency of the PS nanomaterials gradually increases as the pH increases from 3 to 9. The optimal adsorption of the three substances was achieved at pH 9. Three AAPs were in the molecular state under alkaline conditions, which facilitated nanofiber adsorption. Based on the adsorption mechanisms discussed above, the high adsorption capacity of PS nanofibers can be explained as follows: polystyrene is a non-polar compound that adsorbs fewer polar compounds via hydrophobic interaction. The pKa values of olanzapine, clozapine, and clozapine are 7.24, 8.76, and 7.34, respectively. In an acidic environment, they mainly exist in the ionic state. In addition, as the pH increases, ionic compounds slowly change to the neutral state, which facilitates adsorption via π-π interactions. However, there are several studies reporting the instability of olanzapine in aqueous solution (Fisher et al., 2013) indicating that an excessively high pH is detrimental to the stability of the three AAPs. Considering the convenience of the test operation and the instability of olanzapine, the adsorption was facilitated by neutral conditions in this study.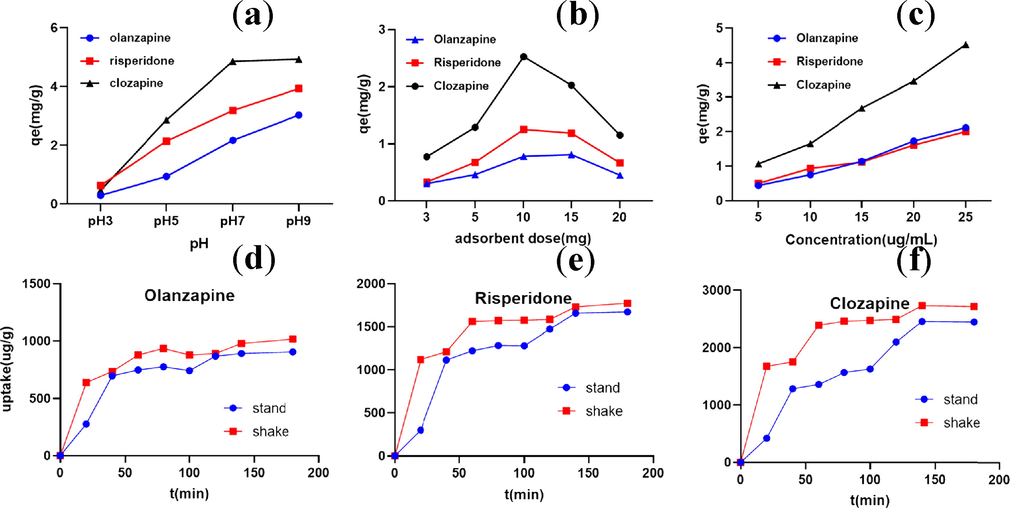
Effects of (a) pH (C = 10 mg/L; T = 310K; adsorbent dose = 10 mg), (b) adsorbent dose (C = 10 mg/L; pH = 7; T =310K), (c) initial concentration (C = 5–25 mg/L; T =310K; adsorbent dose = 10 mg), (d,e,f) shaking (Agitation speed = 150 r/min; pH = 7; T =310K; C = 10 mg/L).
Fig. 5b shows that the absolute adsorption amount of the substance increases with the increase in the dosage of the adsorbent. The adsorption amount of the substance per unit mass of adsorbent is the highest at 10 mg. When the amount of adsorbent is greater than 10 mg, the adsorption amount of the substance per unit mass of adsorbent does not significantly increase with the increase in the concentration of the adsorbent. When the total amount of substances in the solution is held constant, the number of active sites involved in the adsorption increase with the increase in the adsorbent concentration, which decreases the adsorption capacity of the three materials per unit mass of adsorbent. The experiment was terminated with the selection of 10 mg of nanofiber as the final adsorbent dosage.
The effect of the initial concentration on the adsorption of the three compounds was then evaluated (Fig. 5c). The results show that the larger the initial concentration, the stronger the adsorption, although additional standards are required. Finally, the initial concentration was determined (10 ug/mL) based on comprehensive evaluation.
The adsorption curves of olanzapine, risperidone, and clozapine are shown in Fig. 5d,5e and 5f. It can be seen that the maximum adsorption occurred within 30 min, and the adsorption capacity increased eventually. The changes in the adsorption amount tended to slow down and gradually reached equilibrium. The high rate of material adsorbed initially may be due to the large number of adsorption sites during the initial phase of adsorption, the large concentration gradient at the interface between the adsorbent and the substance solution, and the driving force promoting mass transfer. Subsequent increase in repulsive forces between olanzapine on the adsorbent surface and the solid phase resulted in partial or no binding of olanzapine to the remaining empty sites on the adsorbent surface, and an equilibrium was reached after 60 min. Nonetheless, the equilibrium adsorption time and the maximum adsorption amount of several substances differed with the nanofibers. The equilibrium time for the three substances was around 60–120 min. The adsorption amounts also differed with the three substances, with the nanofibers adsorbing more clozapine than risperidone and olanzapine. The effect of the nanofibers on the adsorption of the three substances were compared during shaking and standing. Both standing and shaking activities resulted in adsorption equilibrium. However, shaking shortened the time for adsorption equilibrium and increased the equilibrium adsorption concentration. Therefore, shaking was finally selected to promote the adsorption.
3.5 Adsorption kinetics
3.5.1 Intraparticle diffusion
The adsorption rate control step was determined using the intraparticle diffusion model (Equation (3)). As shown in Fig. 6, the curve was curved at both ends and straight in the middle. The fitted straight lines in the middle of the adsorption process did not pass through the origin, which indicates that the intraparticle diffusion was not the only rate control step (Kiran Kumar & Venkata Mohan, 2012). Therefore, the overall adsorption process was jointly controlled by intra-particle diffusion and membrane diffusion.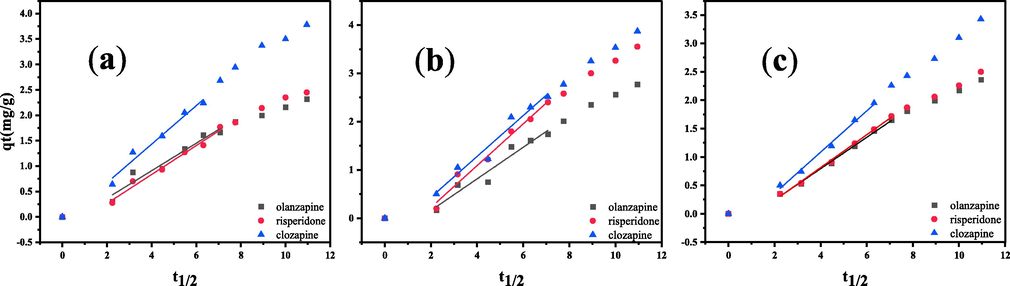
Intra-particle diffusion plots for the adsorption of three AAPs by the PS nanofibers.(a) 298 K;(b) 310 K;(c) 318 K.
3.5.2 Kinetic models
The pseudo-first-order and pseudo-second-order kinetic models were used to describe the adsorption kinetics of three analytes. The two kinetic curves are presented in Fig. 7. The adsorption rate of the adsorbent decreases when the temperature increases, as shown in Table 1. In most cases, increasing the temperature increases the adsorption rate, but at the same time, the desorption rate increases and the difficulty of aggregation increases, which is obvious with the temperature increase. The equilibrium amounts obtained from the pseudo-first-order are smaller than those obtained from the pseudo-second-order model. However, they are closer to the experimentally obtained equilibrium adsorption amounts. The results indicated that the pseudo-first-order adsorption kinetics was more suitable for the experimental data than the pseudo-second-order adsorption model.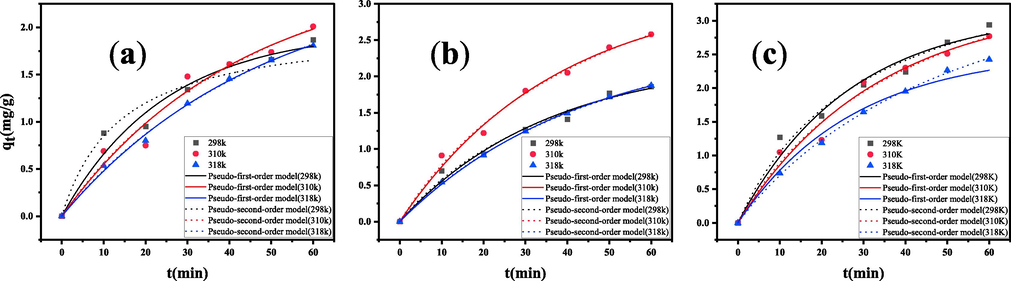
Fitting the adsorption kinetics curves of three AAPs onto PS nanofibers by two models. (a) olanzapine;(b) risperidone;(c) clozapine.
T
analyte
qe(exp) (mg/g)
Pseudo-first-order model
Pseudo-second-order model
Intraparticle diffusion
k1
R2
qe(cal)
k2
R2
qe(cal)
kp
C
R2
298
olanzapine
1.87
0.0406
0.9667
1.97
0.0137
0.9731
2.04
0.2703
−0.1712
0.9281
risperidone
1.86
0.0282
0.9838
2.25
0.0066
0.9866
3.27
0.2846
−0.3031
0.9768
clozapine
2.94
0.0376
0.9746
3.13
0.0077
0.9819
4.25
0.3789
−0.0843
0.9602
310
olanzapine
2.01
0.0235
0.9664
2.62
0.0040
0.9665
4.04
0.3272
−0.4941
0.9266
risperidone
2.58
0.0268
0.9916
3.21
0.0041
0.9927
4.77
0.4322
−0.6401
0.9762
clozapine
2.77
0.0302
0.9786
3.28
0.0048
0.9792
4.78
0.4227
−0.4116
0.9536
318
olanzapine
1.81
0.0208
0.9968
2.55
0.0034
0.9968
4.03
0.2764
−0.3124
0.9955
risperidone
1.87
0.0231
0.9996
2.49
0.0041
0.9998
3.85
0.2890
−0.3426
0.9957
clozapine
2.43
0.0245
0.9988
3.16
0.0035
0.9989
4.84
0.3632
−0.3682
0.9908
3.6 Adsorption isotherm model
To better understand the adsorption of analytes by PS nanofibers, non-linear Langmuir, Freundlich, and Redlich-Peterson models were fitted to each experimental value (Fig. 8). As the Table 2 shows, the values of R2 for the Redlich-Peterson model were larger than those of the Langmuir and Freundlich models. This indicates that the adsorption isotherms of the adsorbents on the analytes were more consistent with the Redlich-Peterson isotherm model, suggesting that the non-homogeneous pores or surfaces of the two adsorbents mentioned above were the main factors of the adsorption isotherm. The adsorption of the substances was not homogeneous, as the pores or surfaces were the main sites of adsorption. The higher values of correlation coefficient reveal that the Freundlich model better fitted the isotherm data compared with the Langmuir model. The value of 1/n is an empirical parameter that reflects the difficulty of adsorption (Mahmoodi et al., 2011). The 1/n values of this study range between 0.1 and 1, facilitating adsorption reaction. The maximum adsorption capacities of olanzapine, risperidone, and clozapine in the experiment were 12.33, 8.36, and 12.96 mg/g, respectively. The results of AAPs adsorption reported in the literature using other types of adsorbent materials were also selected as standards of reference for comparative analysis (Table 3). It can be seen that the maximum adsorption capacity of PS nanofibers for the three AAPs obtained in this study was comparable to results reported in the published literature.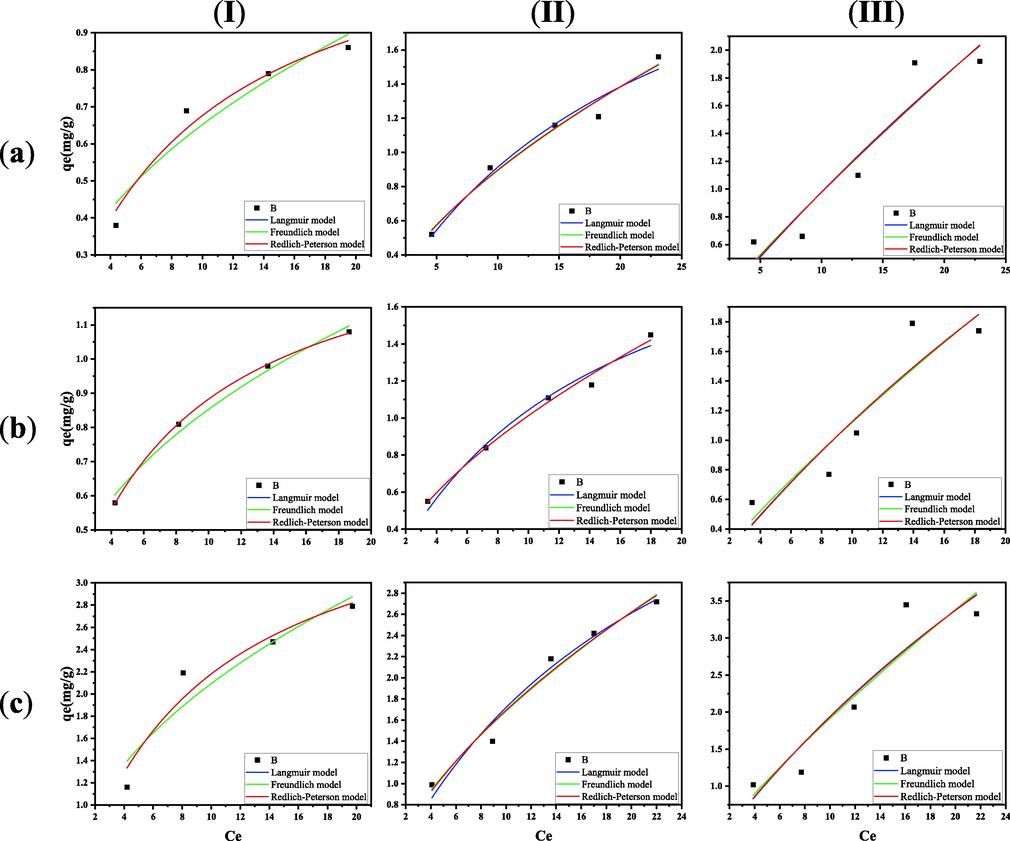
Adsorption isotherms of three AAPs onto PS nanofibers. (a) olanzapine;(b) risperidone;(c) clozapine;(I) 298 K;(II) 310 K;(III) 318 K.
T (K)
Analyte
Langmuir
Freundlich
Redlich-Peterson
Qmax (mg/g)
b (L/mg)
R2
KF
n
R2
KR
α
β
R2
298
olanzapine
1.28
0.11
0.9677
0.22
2.10
0.9240
0.14
0.11
0.93
0.9677
risperidone
1.44
0.16
0.9997
0.34
2.48
0.9892
0.23
0.16
0.98
0.9998
clozapine
4.04
0.12
0.9427
0.71
2.14
0.8988
0.47
0.12
0.98
0.9427
310
olanzapine
2.86
0.05
0.9691
0.21
1.58
0.9749
0.48
1.57
0.45
0.9750
risperidone
2.39
0.07
0.9771
0.27
1.73
0.9905
0.36
0.64
0.60
0.9970
clozapine
5.44
0.05
0.9720
0.39
1.56
0.9743
0.68
1.02
0.47
0.9745
318
olanzapine
12.33
0.01
0.8963
0.13
1.12
0.8902
0.12
0.07
0.50
0.8959
risperidone
8.36
0.02
0.8550
0.16
1.20
0.8568
0.13
0.03
0.85
0.8550
clozapine
12.96
0.02
0.8840
0.29
1.21
0.8791
0.24
0.04
0.80
0.8827
Sorbent materials
Adsorbate
Amount of Sorbents
Qmax (mg/g)
Ref.
Magnetic nanoparticles
risperidone
25 mg
3.84
Yin et al., 2017
Magnetic molecularly imprinted polymers
risperidone
20 mg
18.4
Ji et al., 2018
risperidone
20 mg
1.0
Ji et al., 2018
PS nanofibers
olanzapine,risperidone,clozapine
10 mg
12.33, 8.36 and 12.96 respectively
This word
3.7 Adsorption thermodynamics
The effects of PS nanofibers on the adsorption of the three substances were analyzed at three different temperatures (298, 310 and 318 K) to determine the thermodynamic parameters (ΔH, ΔS, and ΔG). The results are shown in Fig. 9 and Table 4.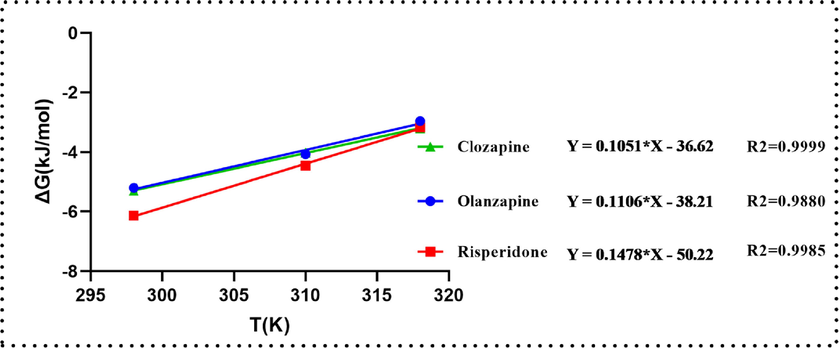
Plot of ΔG versus T for the estimation of thermodynamic parameters.
analyte
ΔH
ΔS
ΔG
298 K
310 K
318 K
olanzapine
−38.21
−110.60
−5.20
−4.07
−2.96
risperidone
−50.22
−147.80
−6.14
−4.46
−3.17
clozapine
−36.62
−105.10
−5.30
−4.02
−3.20
The negative values of ΔG of the three AAPs indicate spontaneous adsorption, and the degree of spontaneity of the reaction decreased with the increase in temperature.
The value of ΔH < 0 indicates that the adsorption of the three analytes on the PS nanofiber occurred via exothermic reaction. In addition, ΔS < 0 indicates the decreased randomness at the solid/solution interface during the adsorption of the three AAPs in aqueous solution on the nanofibers, which also indicates that the adsorption decreased the entropy. As shown in Table 4, the values of ΔH for the three substances were<80 kJ/mol, which indicates physical adsorption (Litefti et al., 2019; Mihailescu et al., 2019). Consequently, the integrated adsorption mechanism involves a π–π interaction, which suggests physical adsorption.
Finally, a comparative analysis of the thermodynamic values of the different adsorption systems and those of other methods reported in the literature shows significant variation in the results obtained. Contrasting results obtained for the same analytes and adsorbent system (Qi et al.,2015; Kumar & Mohan, 2011) may be attributed to the differences associated with the analytes and the adsorbent, and the differences in experimental conditions.
3.8 The regeneration of the adsorbent
The regeneration properties of the adsorbent are an important factor to minimize the treatment costs. To investigate the regeneration performance of PS nanofibers, five adsorption/desorption cycles were conducted. In this research, After the adsorption reaction reached equilibrium, the PS nanofibers were filtered and then rinsed with methanol and water. As shown in Fig. 10, the adsorption capacity remained at 80 % after five cycles, indicating that the material has good stability and regeneration properties.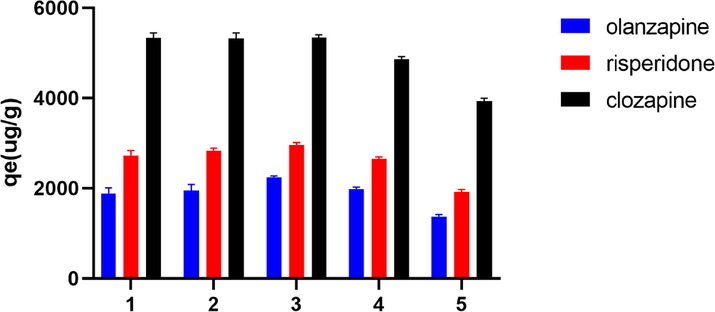
Reusability of PS nanofibers.
4 Conclusion
In this study, the kinetic and thermodynamic properties of PS nanofibers during the adsorption of olanzapine, clozapine, and risperidone were studied. This is the first study to explore the feasibility of applying PS nanofibers for the pretreatment of AAPs. The adsorption of the three substances by PS nanofibers is more consistent with the Redlich-Peterson isotherm model under the study conditions. The thermodynamic results reveal exothermic and spontaneous physical adsorption. Adsorption kinetic studies show that the adsorption conforms to a pseudo first-order kinetics model and the intraparticle mass transfer process is a rate-controlling step. The results demonstrate that the PS electrospun nanofibers represent a potential novel adsorbent for the isolation and purification of antipsychotic drugs from biological samples.
Declaration of Competing Interest
The authors declare that they have no known competing financial interests or personal relationships that could have appeared to influence the work reported in this paper.
References
- Guidelines for the use and interpretation of adsorption isotherm models: a review. J. Hazard. Mater.. 2020;393:122383
- [Google Scholar]
- Electrospun nanofibers as sorbent material for solid phase extraction. Analyst. 2011;136(14):2879-2889.
- [Google Scholar]
- Trace analysis of antidepressants in environmental waters by molecularly imprinted polymer-based solid-phase extraction followed by ultra-performance liquid chromatography coupled to triple quadrupole mass spectrometry. Anal. Bioanal. Chem.. 2010;396(2):825-837.
- [Google Scholar]
- Determination of atypical antipsychotics in human plasma by UPLC-UV with polystyrene nanofibers as a solid-phase extraction sorbent. RSC Adv.. 2022;12(25):16194-16202.
- [Google Scholar]
- Stability of some atypical antipsychotics in human plasma, haemolysed whole blood, oral fluid, human serum and calf serum. Forensic Sci. Int.. 2013;229(1–3):151-156.
- [Google Scholar]
- Analytical sample preparation by electrospun solid phase microextraction sorbents. Talanta. 2020;208:120413
- [Google Scholar]
- Synthesis ofmulti-functionalized Fe3O4-NH2-SH nanofiber based on chitosan for single and simultaneous adsorption ofPb(II) and Ni(II) from aqueous system. International Journal of Biological Macromolecules. 2020;148:201-217.
- [CrossRef] [Google Scholar]
- A water-compatible magnetic molecularly imprinted polymer for the selective extraction of risperidone and 9-hydroxyrisperidone from human urine. Talanta. 2018;181:392-400.
- [Google Scholar]
- Pectin/lignocellulose nanofibers/chitin nanofibers bionanocomposite as an efficient biosorbent of cholesterol and bile salts. Carbohydrate Polymers. 2021;261
- [CrossRef] [Google Scholar]
- Removal of natural and synthetic endocrine disrupting estrogens by multi-walled carbon nanotubes (MWCNT) as adsorbent: kinetic and mechanistic evaluation. Separ. Purif. Technol.. 2012;87:22-30.
- [Google Scholar]
- Efficacy, acceptability and tolerability of antipsychotics in patients with schizophrenia and comorbid substance use. a systematic review and meta-analysis. Eur. Neuropsychopharmacol.. 2019;29(1):32-45.
- [Google Scholar]
- Endocrine disruptive synthetic estrogen (17α-ethynylestradiol) removal from aqueous phase through batch and column sorption studies: mechanistic and kinetic analysis. Desalination. 2011;276(1–3):66-74.
- [Google Scholar]
- Development and application of novel clonazepam molecularly imprinted coatings for stir bar sorptive extraction. J. Colloid Interface Sci.. 2016;468:183-191.
- [Google Scholar]
- Adsorption of an anionic dye (Congo red) from aqueous solutions by pine bark. Sci. Rep.. 2019;9(1):16530.
- [Google Scholar]
- Potential of nanoparticles in sample preparation. J. Chromatogr. A. 2011;1218(4):620-637.
- [Google Scholar]
- A 3D stable metal(-)organic framework for highly efficient adsorption and removal of drug contaminants from water. Polymers (Basel). 2018;10(2)
- [Google Scholar]
- Dye adsorption and desorption properties of Mentha pulegium in single and binary systems. J. Appl. Polym. Sci.. 2011;122(3):1489-1499.
- [Google Scholar]
- In situ deposition of Ag/AgCl on the surface of magnetic metal-organic framework nanocomposite and its application for the visible-light photocatalytic degradation of Rhodamine dye. J Hazard. Mater.. 2019;378:120741
- [Google Scholar]
- Synthesis of pearl necklace-like ZIF-8@chitosan/PVA nanofiber with synergistic effect for recycling aqueous dye removal. Carbohydr. Polym.. 2020;227:115364
- [Google Scholar]
- Nitrogen and sulfur co-doped graphene quantum dots/nanocellulose nanohybrid for electrochemical sensing of anti-schizophrenic drug olanzapine in pharmaceuticals and human biological fluids. Int. J. Biol. Macromol.. 2020;165(Pt B):2030-2037.
- [Google Scholar]
- Gold (III) adsorption from dilute waste solutions onto Amberlite XAD7 resin modified with L-glutamic acid. Sci. Rep.. 2019;9(1):8757.
- [Google Scholar]
- MIL-Ti metal-organic frameworks (MOFs) nanomaterials as superior adsorbents: Synthesis and ultrasound-aided dye adsorption from multicomponent wastewater systems. J. Hazard. Mater.. 2018;347:123-140.
- [Google Scholar]
- Disks solid phase extraction based polypyrrole functionalized core-shell nanofibers mat. Talanta. 2015;144:129-135.
- [Google Scholar]
- Management of common adverse effects of antipsychotic medications. World Psychiatry. 2018;17(3):341-356.
- [Google Scholar]
- Side effects of atypical antipsychotics: a brief overview. World Psychiatry. 2008;7(1):58-62.
- [Google Scholar]
- Adsorption thermodynamics and kinetic investigation of aromatic amphoteric compounds onto different polymeric adsorbents. J. Environ. Sci.. 2007;19(11):1298-1304.
- [Google Scholar]
- Magnetic solid-phase extraction in combination with ultra high-performance liquid chromatography-tandem mass spectrometry analysis: quantification of risperidone and 9-hydroxyrisperidone in biological samples. J. Braz. Chem. Soc. 2017
- [Google Scholar]


