

Translate this page into:
Positive roles and synergistic mechanism of graphene oxide in improving fracturing fluid performances
⁎Corresponding author at: Research Institute of Petroleum Exploration & Development, PetroChina, Beijing, China. liyuan2022@petrochina.com.cn (Yuan Li)
-
Received: ,
Accepted: ,
This article was originally published by Elsevier and was migrated to Scientific Scholar after the change of Publisher.
Abstract
Abstract
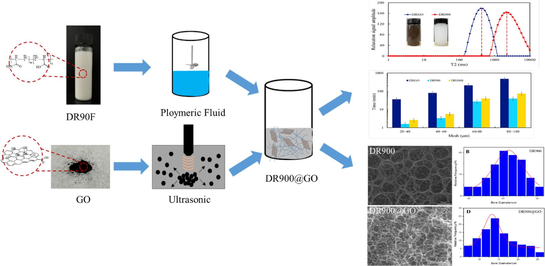
There has been growing interest in designing and developing polymeric nanoparticles in recent years. The inclusion of nanoparticles can enhance the performances of polymer solutions, including stability, rheology, and shear resistance. Nano-graphene oxide (Nano-GO) has been considered a superior nanoparticle for this purpose because of its robust thermal and mechanical properties. However, systematic studies on the application of graphene oxide nanoparticles in slickwater fracturing fluid have not been reported. Therefore, this study aims to improve the stability of nanoparticles, enhance the rheological properties of polymer nanofluids, and elucidate the synergy between nanoparticles and fracturing fluids through Fourier transform infrared spectroscopy and scanning electron microscopy. By evaluating rheological properties, drag reduction performances, and sand carrying capacity, this study confirms that the slickwater fracturing fluid added with Nano-GO (referred to as DRGO) meets the industrial requirement, and Nano-GO can significantly improve the rheological properties, apparent viscosity, as well as temperature and salt resistance of slickwater fracturing fluid. In terms of microstructure, the polymer molecules inside DRGO are closely overlapped to form a uniform network structure with greatly enhanced molecular chain strength.
Nomenclature
- DR90F
-
Code name for drag reducer
- Nano-GO
-
Synthesized nano graphene oxide
- HPAM
-
Partially hydrolyzed polyacrylamide
- G“
-
Loss modulus
- G'
-
Storage modulus
- DR%
-
drag reduction rate of drag reducer solution
- ΔP0
-
the pressure difference generated when clean water passes through the ends of 8 mm pipe at different flow rates
- ΔPDR
-
the pressure difference generated when friction reducer passes through the ends of 8 mm pipe at different flow rates
- DRGO
-
Slickwater fracturing fluid with GO addition
- DR900
-
Slickwater fracturing fluid with DR90F as main agent
- TG
-
Thermal gravimetric curve
- DTG
-
Derivative Thermogravimetric Analysis
- SEM
-
Scanning Electron Microscope
- ESEM
-
Environmental Scanning Electron Microscope
- LF-NMR
-
Low Field Nuclear Magnetic Resonance
1 Introduction
Slickwater fracturing fluid is favored by its high drag reduction rate, low cost, and weak damage to hydrocarbon reservoir rocks. Consequently, it has gradually become one of the key working fluids in stimulated reservoir volume and occupies the highest market share in fracturing operations, playing a crucial role in the development of tight oil and gas throughout the world (Jiang et al., 2013). As the main agent in the slickwater fracturing fluid, polyacrylamide is a type of polymer with a large number of carboxyl and amide groups on the molecular unit. When dispersed in water, polyacrylamide molecules distort into a network structure based on hydrogen bonds between molecular units. This feature is very important for the application of hydraulic fracturing fluid (Bahamdan and Daly, 2006). However, the slickwater fracturing fluid has also been criticized due to its insufficient sand carrying capacity as well as poor temperature and salt tolerance, which scales with the exploration depth and formation heterogeneity. These aspects limit the further application of slickwater fracturing fluid.
In the slickwater fracturing fluid system, polyacrylamide can form long chains from levels of nanometer to micron by intermolecular hydrogen bonds and interchain mechanical entanglement. These long chains then twist into a network structure. However, the weak intermolecular hydrogen bond energy renders these chains subject to breaking under shear or high-temperature conditions, thereby destroying the network structure. Temperature resistance of polyacrylamide molecules was exemplified to be effectively improved by introducing monomers with strong electrolyte groups such as sulfonic radical (Wang et al., 2019; Zhang et al., 2018) or betaine amphiphilic ionic groups (Zhu et al., 2017). However, this method does not significantly improve the performance of sand carrying and shear resistance in slick water. Still, new methods are urgently needed to improve the temperature resistance and sand carrying capacity of slickwater fracturing fluid.
If the long chain of the polyacrylamide is reinforced by a rigid material, the reinforced rigid chains would retain the network properties when the long chains of polyacrylamide are partially broken. Nanomaterials are favored by the physical and chemical properties of the structural units in the nanoscale range, and they are used as such rigid materials to develop functional composites (Yang et al., 2015; Xu et al., 2013; Luo et al., 2020). Specifically, inorganic nanoparticles with massive polar groups on the surface can be uniformly dispersed in polyacrylamide solution to prepare composite materials, owing to the small-size particle, large surface area, and high surface energy of nanomaterials as well as the polar nature of polyacrylamide.
Nanoparticles have been introduced into the fracturing fluid to reduce the filtration-caused fluid loss, improve the sand carrying capacity, increase the temperature resistance, and enhance the oil displacement effect (Shi et al., 2020; Bai et al., 2021; Crews and Huang, 2008; Huang et al., 2010). Micelles with surfactants could help maintain a high viscosity of 200 mPa·s at 120 °C, and they were made through chemical adsorption and surface charge by adding magnesium oxide and zinc oxide nanoparticles in VES clean fracturing fluid (Gurluk et al., 2013). The addition of nano-SiO2 particles was demonstrated to improve the shear resistance, viscoelasticity, stability, and sand carrying capacity of the fracturing fluid at high temperatures (Zhu and Li, 2018). Alharbi et al. (Al-Muntasheri et al., 2017) studied the influence of nanomaterials on the rheological properties of polymer-based fracturing fluids, and they found that the addition of nanomaterials under high pressure can reduce the viscosity loss of guar gum fracturing fluids crosslinked by borate. Liu et al. (Liu et al., 2020) investigated the impact of silica nanoparticles, carbon nanotubes, and graphite powder on the rheological characteristics of guar gum fracturing fluid. Zhao et al. (Cao et al., 2005) prepared an emulsion containing SiO2 nanoparticles, which could effectively improve the plugging performance of the emulsion and reduce the water content of the reservoir in the oil field. With the increasing salinity of formation water, the emulsion would have gradually increased viscosity due to the thickening effect of SiO2 and presented a gel state, thereby improving temperature and salt resistance. Yu et al. (Yu et al., 2015) developed a slickwater system incorporating nanomaterials. This system was advantageous due to its minimal reservoir damage, robust resistance to temperature and salinity, and a notable drag reduction rate reaching up to 75 %.
Nonetheless, nano-composites are seldom reported as drag reducers in hydraulic fracturing, and rare attention has been paid to the effect of two-dimensional nanomaterials on the performance of slickwater fracturing fluids. Herein, this paper would like to determine whether nano-graphene oxide can improve the performance of the conventional slickwater-based fracturing fluid, including rheology, drag reduction and sand suspension. Furthermore, the synergistic mechanism between nano-graphene oxide and slickwater-based fracturing fluid was revealed.
2 Materials and methods
2.1 Materials
Kerosene, DR90F (partially hydrolyzed polyacrylamide (HPAM), molecular weight 8×10⁶g/mol), and graphite powder were purchased from Beijing Comex Oilfield Chemical Company. Sulfuric acid (H2SO4, 98 %), sodium nitrate (NaNO3, 99 %), potassium permanganate (KMnO4, 98 %), sodium chloride (NaCl, 99 %), calcium chloride (CaCl2, 99 %), and ammonium persulfate ((NH4)2S2O8, 99 %) were purchased from Shanghai Aladdin.
2.2 Preparation of Nano-GO
The modified Hummer method was used to synthesize Nano-GO in this study, because this method is favored by the short reaction time, high oxidation degree, low environmental pollution, and high safety (Yang et al., 2018).
There were mainly three stages of preparation:
Low-temperature stage: keep the temperature at 0 °C, add 2 g graphite powder into 46 mL concentrated H2SO4, add 1 g NaNO3 and 6 g KMnO4 in turn, and stir the mixture for 2 h.
Intermediate-temperature stage: heat the mixture to 35 °C, continue to react for 2 h, add 92 mL deionized water, continue to react for 2 h, add 60 mL 5 % H2O2, and then keep the mixture still for 10 min.
Separation and purification stage: the reaction system is first pumped while hot, then washed with 5 % dilute hydrochloric acid and distilled water, and then dried in a vacuum oven at 60 °C for 48 h, to obtain solid nano-graphite oxide. After ultrasonic treatment, the nano-graphene oxide was obtained and named Nano-GO. The reaction principle is schematically shown in Fig. 1.
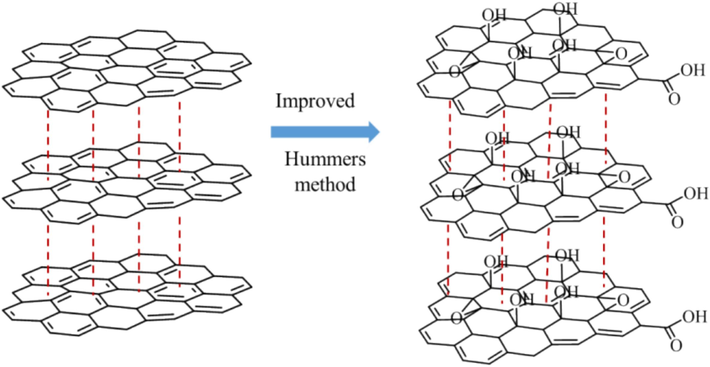
- Synthetic route of Nano-GO.
2.3 Characterization
2.3.1 FTIR test
The Fourier transform infrared spectra of fracturing fluid in the range of 4000–500 cm−1 were measured by using KBr particles on Nicolet IS50 Fourier transform infrared spectrometer (ThermoFisher, USA).
2.3.2 ESEM and SEM
Quanta 200FEG environmental scanning electron microscopy (ESEM, Thermo Fisher Scientific U.S.A.) and FEI Quanta 200F field scanning electron microscope (SEM, Thermo Fisher Scientific U.S.A.) were used to characterize the dispersion and distribution of nanomaterials in fracturing fluid. The microstructure of nano-composite fracturing fluid was observed using SEM.
2.3.3 TGA test
The thermal gravimetric analysis (TGA, LF DC-40MT, Mettler Toledo) was used to study the decomposition temperature of slickwater fracturing fluid. The samples were heated from 20 °C to 700 °C at a heating rate of 20 °C per minute under the protection of nitrogen.
2.3.4 Zeta potential
Zetasizer (Malvern Instruments, U.K.) was used to measure the zeta potential of Nano-GO, DR900, and nano-composite slickwater fracturing fluid.
2.4 Preparation of fracturing fluid
Nano-GO was dispersed in 100 mL ultrapure water at room temperature (25 °C), followed by magnetic stirring (500 rpm) for 2 h and ultrasonic treatment for 1 h to prepare the Nano-GO solution. Then, 5000 ppm DR900F was added to the Nano-GO solution, followed by magnetic stirring for 1 h to obtain nano-composite slickwater fracturing fluid. The concentration of nano-materials changed from 100 ppm to 800 ppm in the preparation of nano-composite slickwater fracturing fluid.
2.5 Rheological measurements
Haake MARS III rheometer (Thermo Scientific, Germany) was used to test the apparent viscosity, salt resistance, temperature resistance, shear resistance, and viscoelasticity of nano-composite slickwater fracturing fluid and blank slickwater fracturing fluid (without Nano-GO). The rotor used a concentric-cylinder geometry to ensure accurate measurements.
Various rheological parameters of the fracturing fluids are measured, including.
Apparent viscosity: tested with a DG41 rotor at the temperature of 30 °C with the shear rate of 170 s−1.
Shear resistance: tested with a DG41 rotor for continuous shear at the temperature of 90 °C and the shear rate of 170 s−1 for 60 min.
Temperature resistance: measured at a shear rate of 170 s−1 at different temperatures (from 30 °C to 90 °C, with an increasing measuring spacing of 5 °C).
Salt resistance: measured at the temperature of 30 °C and the shear rate of 170 s−1 shear rate under different salinity conditions.
Viscoelasticity: measured with a Z41 Ti rotor, including stress and frequency scanning.
2.6 Performance test of fracturing fluid
The performance of nano-composite slickwater was mainly assessed from three aspects in this study, namely sand carrying performance, drag reduction performance, and gel breaking performance.
2.6.1 Sand carrying performance test
The following steps were taken to evaluate the sand carrying performance of the fracturing fluid:
Mix the slickwater fracturing fluid with different proppants at a sand ratio of 20 %.
Place the sand mixture in a blender at a low speed to ensure that the proppant is fully mixed in the slickwater and then transfer the sand mixture to the measuring cylinder.
Place the measuring cylinder at room temperature, observe the proppant particle settlement process, and record the time.
2.6.2 Drag reduction performance test
The drag reduction performance test was conducted to evaluate the efficiency of the fracturing fluid in minimizing frictional losses during fluid transport. Understanding the drag reduction capabilities of the fracturing fluid is crucial for optimizing the hydraulic fracturing process, as it can lead to significant improvements in energy efficiency and operational cost savings.
The following steps were taken to evaluate the drag reduction efficacy of the fracturing fluid:
Put 30 L 5000 ppm slickwater fracturing fluid into the liquid storage tank, and open the spherical valve under the tank.
Run the software, set the displacement to 250 m3/h, 500 m3/h, 750 m3/h, 1000 m3/h, and 1250 m3/h, respectively, under the same external conditions, and record the pressure difference for each displacement.
Calculate the drag reduction rate according to the formula.
2.6.3 Gel breaking performance test
The following steps were taken to evaluate the gel breaking performance of the fracturing fluid:
100 ppm gel breaker (ammonium persulfate) was added to the prepared slickwater fracturing fluid and fully stirred with the fracturing fluid, then the gel was broken at 80 °C.
Viscosity changes were measured every 5 min during the gel breaking process. Complete breaking was believed to take place when the viscosity became lower than 5 mPa·s.
The residue in the gel-broken solution was filtered and dried to obtain the residue content.
3 Results and discussion
3.1 Characterization of Nano-GO
As shown in Fig. 2, the graphite powder has no obvious absorption peak, whereas the synthesized Nano-GO has many characteristic absorption peaks. These include the –OH vibration absorption peak at 3396 cm−1, the stretching vibration peak of C = C at 1630 cm−1 and 873 cm−1, the bending vibration peak of C–H on GO-like benzene ring skeleton structure (Wei et al., 2020), the stretching vibration peak of C-OH at 1390 cm−1, and the stretching vibration peak of C-O-C at 1120 cm−1. All these peaks indicate that Nano-GO was successfully prepared in the laboratory. As is shown in Fig. 3, Nano-GO presents a sheet structure and has a particle size of 200–300 nm.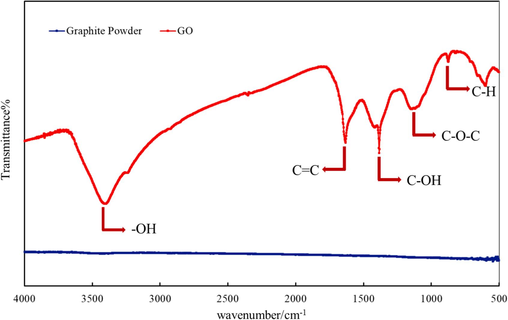
Comparison of infrared spectra between graphite powder and Nano-GO.
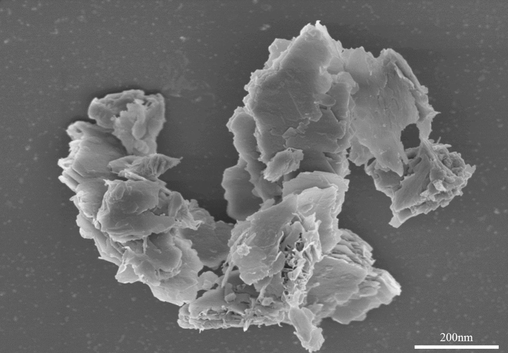
SEM image of Nano-GO prepared in the laboratory.
3.2 Preparation of nano-hybrid slickwater fracturing fluid
3.2.1 Concentration optimization of Nano-GO
Conventional slickwater fracturing fluids normally have low viscosity and thus low sand carrying performance, which can be improved by increasing the viscosity. Therefore, the apparent viscosity of fracturing fluid is the main measurement index for Nano-GO dosage selection. Based on the quantities of additives employed in the oil field, the concentration of drag reducer was preliminarily determined to be 5000 ppm, while that of Nano-GO ranged from 100 ppm to 800 ppm. A rheometer was used to test the apparent viscosity of slickwater fracturing fluid at different nano-GO concentrations. As shown in Fig. 4, adding Nano-GO contributes to increased apparent viscosity of the fracturing fluid to various degrees. Specifically, the apparent viscosity of the fracturing fluid increases as the Nano-GO concentration varies from 0 to 300 ppm, while it decreases in the concentration range of 300 ppm to 800 ppm. Therefore, 300 ppm can be determined as the optimal concentration. Higher concentrations are not helpful because a large number of nanomaterials would agglomerate, resulting in the poor stability of nanomaterials. Hydrophilic nanoparticles like Nano-GO can form hydrogen bonds with each other, exacerbating agglomeration. This aggregation reduces the effective surface area available for interaction with polymer chains, leading to a decrease in viscosity. Other researchers have come to the same conclusion (Liu et al., 2020; Xu et al., 2023).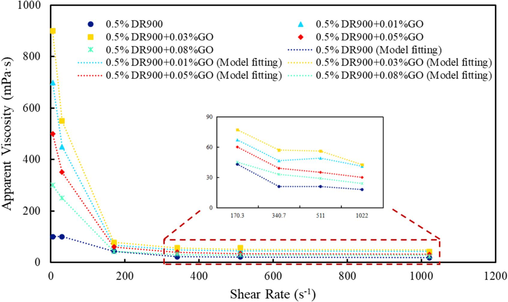
Apparent viscosity of slickwater fracturing fluid with different amounts of Nano-GO.
The relationship between viscosity and shear rate demonstrates that the solution exhibits shear thinning behavior. The Cross model is suitable for describing the rheological behavior of non-Newtonian fluids. The Cross model, an empirical equation, is widely used to describe the rheological behavior of pseudoplastic non-Newtonian fluids. It is given by: (Cross, 1965)
Where, is the apparent viscosity at a given shear rate γ, is the zero-shear viscosity, is the infinite-shear viscosity, k is a constant related to the shear rate at which the transition occurs. m is the shear thinning index.
Using the Cross model, fit the data in Fig. 4 with the parameters listed in Table 1. The addition of Nano-GO significantly increases both the zero-shear rate viscosity and the infinite-shear viscosity. When the addition amount is 300 ppm, the infinite-shear viscosity reaches its highest value. The shear thinning index m describes the rate of change in fluid viscosity in response to variations in shear rate. A smaller m value indicates lower sensitivity of the fluid viscosity to changes in shear rate, meaning the fluid viscosity decreases more slowly with increasing shear rate. When the Nano-GO content is at 300 ppm, the m value is the smallest, indicating that the system exhibits superior shear resistance.
Formulation
k
m
5000 ppm DR900
100.15
18.99
0.01
3.75
5000 ppm DR900 + 100 ppm GO
709.05
42.69
0.03
2.16
5000 ppm DR900 + 300 ppm GO
914.91
47.67
0.03
1.97
5000 ppm DR900 + 500 ppm GO
506.94
30.35
0.02
2.09
5000 ppm DR900 + 800 ppm GO
300.84
26.93
0.02
2.46
According to the viscosity screening, the formula of nano-hybrid slickwater fracturing fluid was determined as shown in Table 2. For the sake of simplicity and clarity, the slickwater fracturing fluid prepared only with DR90F will be hereinafter referred to as DR900, whereas the slickwater fracturing fluid added with Nano-GO will be referred to as DRGO.
Sample
Drag Reducer
Nanomaterial
Ultrapure water
DRGO
0.5 g DR90F
0.03 g Nano-GO
100 mL
DR900
0.5 g DR90F
/
100 mL
3.2.2 Stability test
Nanoparticles and polymer molecules have been attracting lots of attention because of their outstanding composite structure and performance control. Adding a small number of nanoparticles can significantly improve the mechanical and thermal stability of polymers (Li et al., 2012). The key to achieving high-performance nanocomposites is to control the dispersion of nanoparticles in the polymer (Yuan et al., 2021), because nanoparticles are subject to aggregation and settlement due to their heterogeneous dispersion in the polymer.
The stability of DRGO was confirmed by experiments (Fig. 5), in which DR900 and DRGO slickwater fracturing fluids were configured and placed in a 30 °C oven for 60 days. Eventually, DRGO has no delamination and Nano-GO in solution does not aggregate and settle, exemplifying good stability. Table 3 shows the comparison of zeta potential changes between DR900 and DRGO before and after 30 days of placement. The zeta potential of DR900 and DRGO remained constant, indicating that the system was stable and no aggregation and precipitation were observed.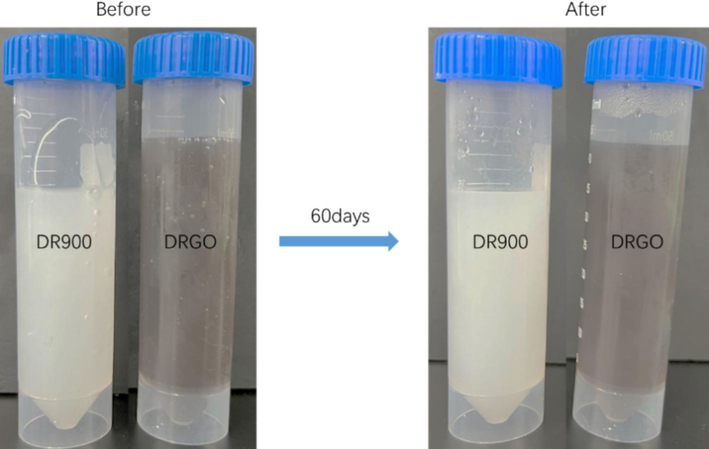
Stability evaluation of DR900 and DRGO.
No.
Time/day
Zeta potential/mv
1
DR900-0 day
−34.8
2
DR900-30 day
−35.4
3
DRGO-0 day
−27.4
4
DRGO-30 day
−26.1
3.3 Synergistic mechanism
Adding nanomaterials into fracturing fluid can improve the performance of fracturing fluid. However, most relevant research focused on formulation optimization and effect evaluation, while failing to investigate the interaction between nanomaterials and fracturing fluids. In this study, the synergistic mechanism between nanoparticles and fracturing fluid was explored by analyzing zeta potential, Fourier-transform infrared spectroscopy (FTIR), and scanning electron microscopy (SEM) of DRGO.
3.3.1 Zeta potential analysis
Zeta potential is an important parameter to study the stability of DRGO. As shown in Fig. 6, the zeta potentials of DR900, Nano-GO, and DRGO are −34.8 mV, –23.7 mV, and −27.4 mV, respectively. With partially hydrolyzed polyacrylamide (HPAM) as the main component, DR90F has a certain amount of carboxyl group, and thus it is negatively charged. The surface of Nano-GO is abundant with hydroxyl groups, and these hydroxyl groups will form hydrogen bonds with the carboxyl and amide groups on the surface of DR90F (as shown in Fig. 7), thus forming a composite system. Then the charge carried by the composite system will be close to the negative charge carried by the carboxyl group of Nano-GO. Therefore, the zeta potential of DRGO is close to that of Nano-Go. According to DLVO (Derjaguin, Landau, Vervey, and Overbeek) theory (Huo et al., 2019; Li et al., 2012), zeta potential above −25 mV is the most stable. Therefore, DRGO is confirmed to be a stable slickwater fracturing fluid.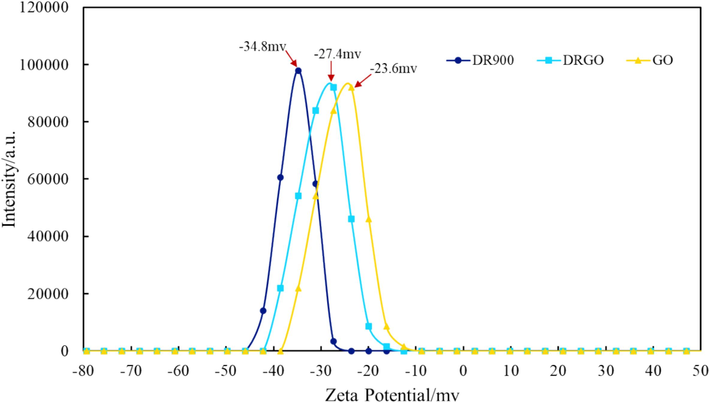
Zeta potentials of different slickwater fracturing fluids.
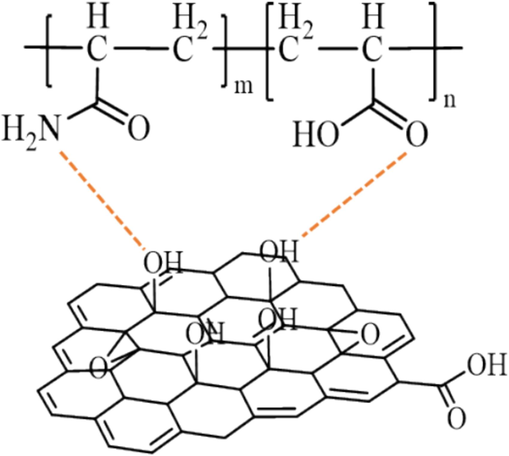
Schematic diagram of hydrogen bond formation between DR90F and Nano-GO.
3.3.2 FTIR analysis
As illustrated in Fig. 8, there is no obvious difference between the two samples. For DR900, there are several strong peaks in the spectrum, including the stretching vibration peak of –OH and N–H at 3405 cm−1, the characteristic peak of methyl at 2950 cm−1, the absorption peaks of methylene (–CH2-) at 2925 cm−1, 2850 cm−1, and 1471 cm−1, the stretching vibration peak of carbonyl C = O at 1675 cm−1, the characteristic absorption peak of amino-NH2 stretching vibration in amide group at 1573 cm−1, the symmetric stretching vibration peak of COO at 1408 cm−1, indicating the presence of carboxyl group in DR90F, the asymmetric stretching vibration peak of C-O-C at 1124 cm−1, and the characteristic absorption peak of primary amide at 627 cm−1.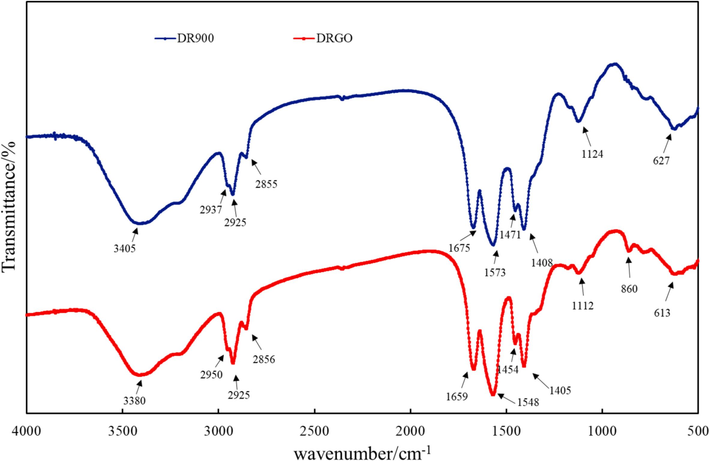
Infrared absorption spectra of DR900 and DRGO.
In contrast, the spectrum of DRGO is featured by red-shifted absorption peaks of some groups due to the interaction between Nano-GO and DR90F and thus the shielded charge on the polymer molecular chain. The strong and wide peak from 3405 cm−1 to 3380 cm−1 indicates the presence of hydrogen bond stretching –OH (Kumar et al., 2022). The absorption peak of carbonyl C = O in the amide group corresponds to the wavenumber from 1675 cm−1 to 1659 cm-1 (Ma et al., 2020). The wavenumber of amino-NH2 in the amide group ranges from 1573 cm−1 to 1548 cm−1. All these functional groups present obvious red-shifted absorption peaks, indicating the interaction between amino and carboxyl functional groups with Nano-Go. In this case, hydrogen bonds with nitrogen or oxygen of DR90F are formed (Fig. 8), which are commonly referred to as pseudocrosslinked structures (Yu et al., 2020). From the perspective of energy, the redshift phenomenon can be understood as the enhanced interaction between Nano-GO and DR90F chain segment. Therefore, the overall energy becomes weaker, and the structure becomes more stable (Li et al., 2018). In addition, the bending vibration peak of benzene ring C–H at 860 cm−1 also proves the interaction between Nano-GO and DR90F (Bai et al., 2013).
3.3.3 ESEM analysis
Nano-GO and DR90F were analyzed mainly from the perspectives of zeta potential and FTIR. In order to further illustrate the synergy between Nano-GO and DR90F, the structure of the fracturing fluid was visually examined using ESEM.
As shown in Fig. 9A, the polymer molecules in DR900 have intertwined to form a multilayer spatial network structure with different sizes of pores. However, the stacking structure is relatively random and the intermolecular bond is loose. There are great differences in the strength (thickness) of the connecting molecules. Under the action of shear stress, the weakly connected molecular chains or winding points are vulnerable to destruction or slipping, which would devastate the network structure. As shown in Fig. 9B, the pore size in DR900 is mainly distributed in the range of 40–45 μm.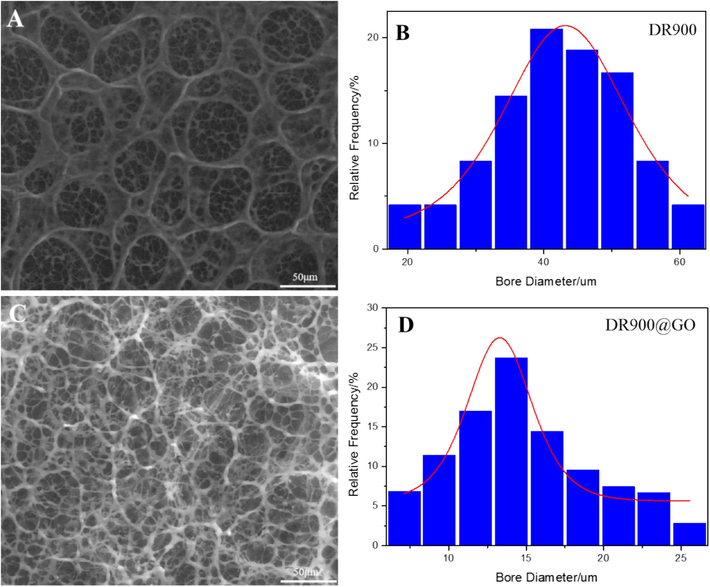
ESEM images and pore size distribution of DR900 and DRGO (A for DR900, B for DR900 pore size distribution, C for DRGO, and D for DRGO pore size distribution).
Fig. 9C shows an ESEM image of DRGO, in which polymer molecules overlap with each other to form a whole unit. The network structure is uniform and closely stacked, contributing to the high strength of connecting molecular chains. Fig. 9D shows a pore size distribution of 11.75–14 μm, which is 42 % of that of DR900. This may result from the introduced Nano-GO that forms a pseudocrosslinked structure with DR90F. Therefore, the strength of the connection point between the molecular chains increases, and the wall thickness of the pore decreases. This is also because of the involvement of more molecules in crosslinking, resulting in a reduced aperture and a more uniform grid structure (He et al., 2015).
Typically, LF-NMR characterization of polymeric networks can be performed by looking at the magnetic relaxation of hydrogen belonging to polymeric chains. In this paper, the change of microstructure of fracturing fluid was analyzed by measuring hydrogen relaxation of water in polymer network (Abrami et al., 2018; Chui et al., 1995; Abrami et al., 2019). The instrument used in this paper is MacroMR12-150H-I produced by Suzhou Newmai Electronic Technology Co., Ltd. The experimental temperature is 30 °C. The measured water quality internal transverse relaxation time samples were based on CPMG sequence. The experimental results are shown in Fig. 10. (Kopač et al., 2022)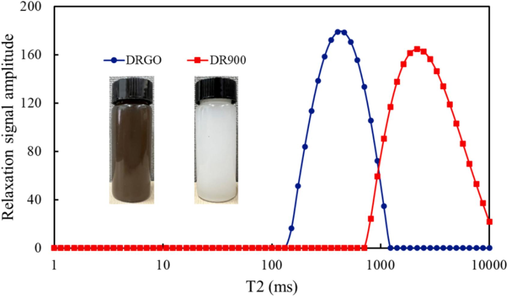
The cross-linking density of two fracturing fluid systems.
where T2, H2O is the relaxation time of free water protons, φp is the polymer volume fraction, M is relaxivity, which is dimensionally a velocity (length/time) and reflects the effect of polymeric chains on the water protons relaxation, and ε is a modulus-dependent constant.
As indicated by Eq. (2), T2 is related to M. Specifically, T2 is smaller when the effect of M on the relaxation of water molecules increases due to the enhanced force between polymer chains or smaller pore structures formed. The relaxation time of DRGO ranges from 152 ms to 1000 ms, while that of DR900 is 811 ms to 10000 ms. This indicates the stronger influence of M of DRGO on the relaxation time of water molecules, which is also consistent with ESEM results.
Based on the results of FTIR and ESEM, the network structures of DRGO and DR900 are speculated as shown in Fig. 11. In DR900, the polymer chains form a spatial network structure by intermolecular hydrogen bonds and interchain mechanical entanglement (Fig. 11B). After adding Nano-GO, the hydroxyl group of Nano-GO and the carboxyl and amide groups of DR90F form a pseudocrosslinked structure, so that the spatial network structure is enhanced and the overall strength is greatly improved (Fig. 11A).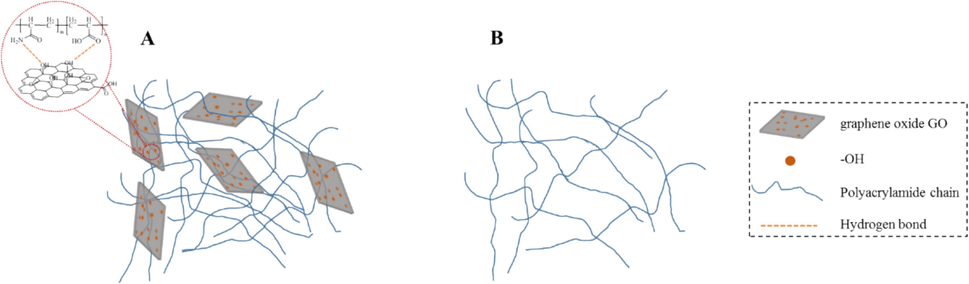
Network structures of DRGO and DR900 (A is the mixture of Nano-GO and DR900, B is DR900).
3.3.4 Thermal gravimetric curve (TGA) analysis
TGA is utilized to elucidate the interaction between GO and DR900. Fig. 12 indicates that all samples have almost the same process of weight loss, including four obvious stages. In stage ①, the weight loss is primarily due to the losing bound water. DRGO has a higher maximum weight loss rate than DR900 due to its stronger hydrogen bonding force. In stage ②, the weight loss mainly results from the decomposition of amide groups (Biswal and Singh, 2004; Li et al., 2022). Since the unstable oxygen-containing groups on the surface of Nano-GO also began to decompose (Eigler et al., 2012), the DTG value of DRGO reached the maximum at 324 °C, while that of DR900 reached the maximum at 360 °C. In stage ③, the weight loss is mainly from the decomposition of main polymer chains (Li et al., 2017). As it contains a variety of functional groups, DR900 presents multiple peaks in the DTG curve. More energy is required to break the pseudocrosslinked structure of DRGO. Therefore, the decomposition temperature increases and presents an unimodal feature. Moreover, the hydrogen bond plays a key role in the connection between DR90F and GO. When the temperature rises, the hydrogen bond breaks and the weight loss rate is maximum. The fourth stage is the combustion stage of by-products and impurities after decomposition. The above TGA analysis proves that the pseudocrosslinked structure between GO and DR90F is beneficial to improve the performance of the fracturing fluid.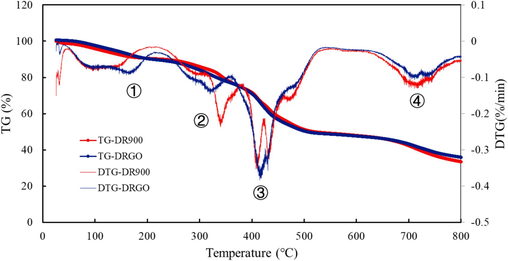
Thermal Gravimetric Curves of DRGO and DR900.
3.4 Rheological behavior of fracturing fluid
It can be seen from the previous experimental results that the viscosity of DRGO is higher than that of DR900, indicating the positive role of added nanomaterials in improving the rheological properties of slickwater fracturing fluid. In this section, analyses rheological properties of DRGO will be presented.
3.4.1 Temperature resistance test
As analyzed above, the added nanomaterials have a remarkable influence on the properties of fracturing fluids at room temperature. Then, performances of fracturing fluids at high temperatures are tested to explore the influence of nanomaterials. As shown in Fig. 13, the apparent viscosity of the fracturing fluids is negatively correlated with temperature. At the same temperature, the viscosity of DRGO is higher than that of DR900. When the temperature is 90 °C, the viscosity of DRGO (50.86 mPa·s) is higher than that of DR900 (27.64 mPa·s), indicating improved temperature resistance after adding nanomaterials.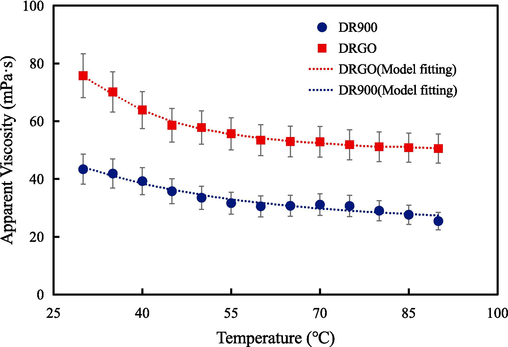
Relation between the viscosity of fracturing fluids and temperature.
The Arrhenius equation can better describe the relationship between fluid viscosity and temperature. Its equation is as follows,(Peleg et al., 2012)
Table 4 shows the fitting parameters of the modified Arrhenius equation. The activation energy Ea of DRGO increased by 95.4 % compared to DR900. The addition of Nano-GO increased the energy required for the reaction, as it not only needs to overcome the intermolecular forces between the polymer chains but also the hydrogen bonds between Nano-GO and the polymer chains. Hence, the activation energy of DRGO increased. From B's perspective, the base viscosity of DRGO increased by 112 % compared to DR900. Viscosity reflects the intermolecular frictional forces, which are the forces between polymer molecules in this case. After adding Nano-GO, more cross-linking points were created between the molecules, increasing the frictional forces between them and leading to a significant increase in system viscosity.
Formulation
A
B
Ea
R2
DR900
7.21*10–4
23.45
25858.32
0.96
DRGO
5.23*10–8
49.68
50529.25
0.99
3.4.2 Shear resistance test
In the fracturing process, the fracturing fluid needs to undergo a long shearing process, so the shear resistance of the fracturing fluid is a basic requirement. As shown in Fig. 14, the viscosity of DRGO is greater than that of DR900, indicating the positive role of added nanomaterials in improving the shear resistance. The experimental conditions include a temperature of 90 °C, a shear rate of 170 s−1, and a shearing duration of 60 min. The experimental results show that the viscosity of DR900 was 29.33 mPa·s, and the viscosity retention rate was 31.53 %. The viscosity of DRGO was 52.72 mPa·s, and the viscosity retention rate was 41.72 %. The viscosity is increased by 79.75 % from 29.33 mPa·s, to 52.72 mPa·s after nanomaterials are added, which meets the requirements of field production (i.e. 50 mPa·s).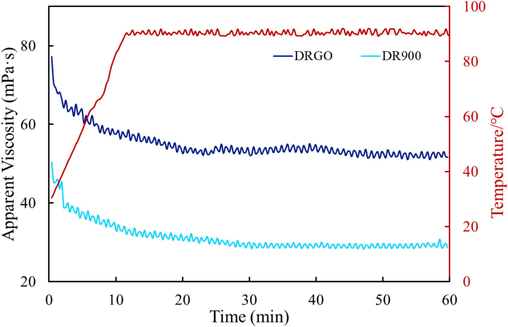
Relationship between the viscosity of fracturing fluids and shearing time.
3.4.3 Salinity resistance test
Using produced water for salinity resistance tests can reduce the use of freshwater, decrease the impact on the environment, and improve oil and gas recovery in unconventional reservoirs. However, slickwater fracturing fluids generally perform poorly at high salinity. Therefore, examining the impact of varied salinity levels on the efficacy of slickwater fracturing fluid is imperative.
As shown in Fig. 15, viscosity is very sensitive to salinity. The viscosity of DR900 in 4000 ppm NaCl is 14.16 mPa·s, with a viscosity retention rate of 33.31 %. In contrast, the viscosity of DR900 in 1500 ppm CaCl2 is 4.58 mPa·s, with a viscosity retention rate of 10.53 %. After adding Nano-GO, the overall salt resistance is improved. The viscosity of DRGO in 4000 ppm NaCl solution is 48.44 mPa·s, with a viscosity retention rate of 62.50 %, while that in 1500 ppm CaCl2 is 34.92 mPa·s, with a viscosity retention rate of 46.42 %, which is 4 times higher than that of DR900.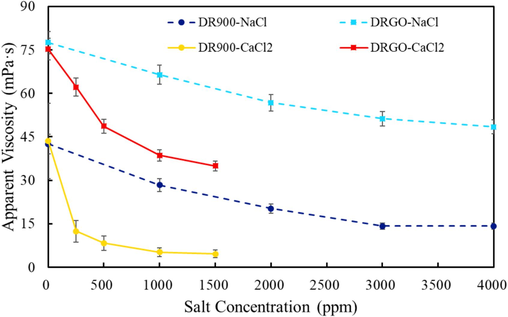
Relation between the viscosity of fracturing fluids and salinity at a shear rate of 170 s−1 under the temperature of 30 °C.
The main component of DR90F is HPAM, whose skeleton structure is composed of stacked and often irregularly arranged carbon molecules. When exposed to high-salinity brine, the skeleton structure of HPAM will deform and curl, thereby reducing the effective volume of HPAM polymer. This is because the carboxyl or amide functional groups of HPAM molecules react with free-flowing monovalent and divalent ions. When the amide and carboxyl functional groups in the HPAM polymer chain react with sodium (Na+) and calcium (Ca2+) ions, the viscosity of the polymer nanofluid is reduced (Kumar et al., 2022).
When Nano-GO is added to the solution, the direct interaction between free-flow ions and carbon atoms in the polymer skeleton structure is inhibited. The edge and surface of Nano-GO are rich in oxygen-based functional groups, including hydroxyl (−OH), epoxy, and carboxyl (−COOH) entities. The hydrogen atom on the hydroxyl group of Nano-GO tends to be bonded with the carboxyl group of DR90F, thereby enhancing the rheological properties. The existence of amino groups is also verified by FTIR analysis by detecting NH stretching and NH2 deformation, thereby indicating the pseudocrosslinked bond between Nano-GO and DR90F.
Fig. 16 shows the influence of monovalent and divalent ions on the polymer after adding Nano-GO. Hydrogen bonding is the primary driving mechanism for polymer physisorption on the surface of nanoparticles. In deionized water, the polymer backbone stretches, and the strong contact between nanoparticles and the polymer backbone inside the chain causes the polymer backbone to twist. In salt water, electrostatic shielding enhances solution polarity and curls polymer chains. When nanoparticles are introduced, the strong contact between nanoparticles and polymer chains strengthens the connection between polymer chains and further improves system attributes (Zhang et al., 2023).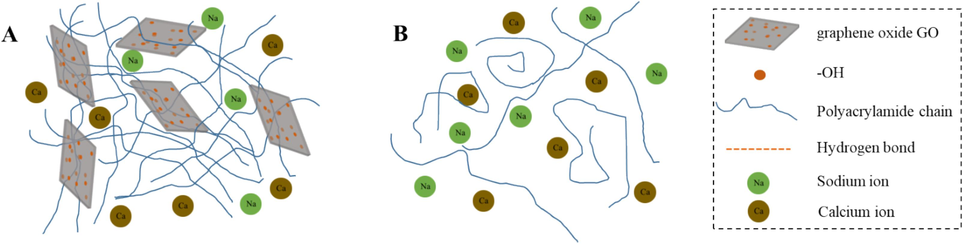
Schematic diagrams of influences of salinity on fracturing fluid structure.
3.4.4 Viscoelastic test
Elastic properties of fracture fluids could have a significant impact on the transportation of proppant in fracture networks (Zhao et al., 2018). Therefore, it is necessary to test the Storage modulus G' and Loss modulus G'' of the solution simultaneously. The cross point of G' and G'' represents the relaxation time of the polymer network. A lower cross-point value corresponds to the stronger proppant suspension ability, and the longer relaxation time indicates stronger elastic properties (Biheri and Imqam, 2022).
As shown in Fig. 17A, the stress scanning curve is related to the microstructure of the fracturing fluid. When the stress exceeds the upper limit, G' will decrease, which indicates that the internal structure of the system has been damaged to a certain extent. Fig. 17A also shows that the platform in the stress scanning curve of DRGO is much longer than that of DR900, indicating a more stable microstructure.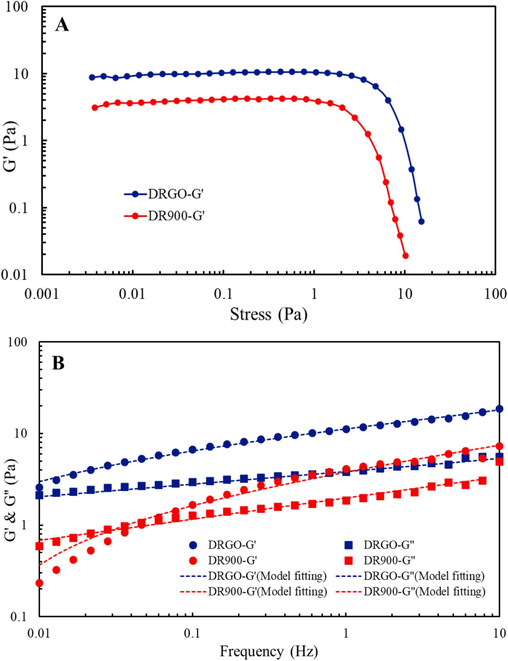
Viscoelastic tests by stress scanning (A) and frequency scanning (B).
As shown in Fig. 17B, there are cross points between G' and G“ of different slickwater fracturing fluids under fixed stress values. When the scanning frequency is lower than the cross point, G” is larger than G', and the viscosity effect is dominant. When the scanning frequency is higher than the cross point, G' is larger than G“, and the elastic effect is dominant (Wang et al., 2020). The cross point is shifted from 0.06 Hz to less than 0.01 Hz after Nano-GO is added, indicating that DRGO is elastic and has stronger sand carrying capacity. This result is attributed to the strong hydrogen bonding interaction between the nanoparticles and curled polymer backbone (Zhang et al., 2023).
The Havriliak-Negami model is used to fit the modulus data, and the fitting results are shown in Fig. 17B. The Havriliak-Negami (H-N) model is widely used to describe the frequency-dependent viscoelastic behavior of materials, particularly polymers. It can effectively describe the storage and loss behavior of materials over a wide frequency range. Its mathematical expression is as follows.
τ represents the characteristic relaxation time of the material. It indicates the speed at which the material responds to applied stress or strain changes. The τ for DRGO is 1.32, and for DR900, it is 0.36. These results suggest that the addition of Nano-GO promotes the formation of a strong 3D network structure. The interactions between the polymer and Nano-GO are mainly hydrogen bonds and hydrophobic interactions between the HPAM chains and GO. The hydrogen bonds arise from the interaction between the –OH groups on GO and the carboxyl and amide groups on the HPAM chain backbone. The hydrophobic interactions stem from the interaction between the non-polar backbone of HPAM molecules and the non-polar sheets of GO. This is consistent with the experimental results from electron microscopy and infrared spectroscopy.
3.5 Performance tests of fracturing fluid
3.5.1 Sand-carrying performance
Carrying proppant into fractures is one of the primary properties of fracturing fluids. In order to better evaluate the sand-carrying performance of DRGO, a slickwater fracturing fluid with a viscosity of 77 mPa·s is prepared with high-concentration DR90F, which will be hereinafter referred to as DR1000. Fig. 18 shows the settling time of proppant with different mesh sizes in three slickwater fracturing fluids.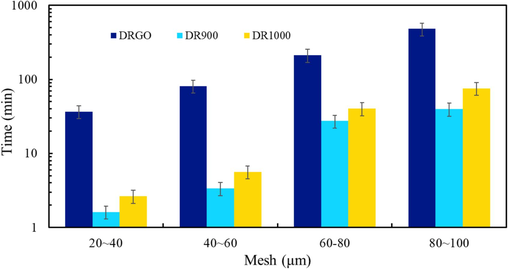
Settlement time of proppant in different fracturing fluids.
By comparing the sand carrying performances of three slickwater fracturing fluids, the following conclusions are obtained:
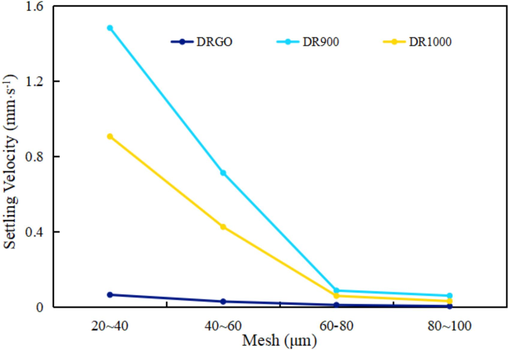
The settlement time increases as the mesh of proppant increases. As shown in Fig. 19, the settling velocity of DRGO is the lowest.
DRGO and DR1000 have similar viscosity (about 75 mPa·s), but the settling time of DRGO is much higher than that of DR1000. Therefore, viscosity is not the main factor affecting sand carrying performance (Galindo, 2019). Viscoelasticity can be regarded as a response to the strength of the grid structure in the fracturing fluid, which can be used to better describe the sand carrying performance of the fracturing fluid. The smaller the cross point of storage modulus and loss modulus, the better the sand carrying capacity. The cross point of G' and G“ at DRGO is the lowest, only 0.01 Hz, so the sand carrying performance of this system is better than that of the other systems.
The proppant-carrying capacity of fracturing fluid is analyzed from the perspective of polymer molecule microstructure. It is important to elaborate on the difference in sand carrying performances of fracturing fluids with different molecular structures so as to fundamentally understand the key factors affecting the sand carrying performance of fracturing fluid. A comparison between SEM images of DRGO and DR900 (Fig. 9) provides an intuitive illustration of the proppant settlement process in different solutions. In DR900, proppant under the action of gravity will settle along the large holes between polymer molecules and areas with low winding strength, causing polymer molecules to deform and flow. For DRGO, the polymer molecules are overall deformed under stress due to the smaller pores between polymer molecules as well as the formed pseudocrosslinked structure, which requires greater force for the proppant settlement. Therefore, DRGO has good sand carrying capacity.
As depicted in Table 5, the settling velocity of DR900 is broadly similar to that reported in the other studies, whereas that of DRGO is much lower than that of the others.
As shown in Table 6, the settling time decreases greatly as the temperature increases, which is due to the weakened hydrogen bond force and the destroyed system structure under high temperature.
- Settling velocity of proppant in different fracturing fluids.
| System name | Sand Ratio | Proppant Type | Mesh of Proppants | Settling Velocity mm/s | Temperature/°C | References |
|---|---|---|---|---|---|---|
| DRGO | 20 % | Quartz sand | 40–60 | 0.029 | 30 | This paper |
| DR900 | 20 % | Quartz sand | 40–60 | 0.71 | 30 | This paper |
| FA-30 | 20 % | Ceramsite | 40–70 | 0.27 | 30 | Huo et al. (Bingxia et al., 2016) |
| New Clean Slickwater Fracturing Fluid | 20 % | Ceramsite | 40/70 | 0.40 | 30 | Zhang et al. (Yang et al., 2020) |
| HVFR | 11 % | Sakrete play sand | 70 | 4.11 | 30 | Carl et al. (Aften, 2018) |
| FAJ-3 | 20 % | Ceramsite | 40–70 | 0.08 | 25 | Xu et al. (Ke et al., 2019) |
| HVFR | 15 % | Ceramsite | 40–70 | 0.65 | 25 | Wang et al. (Wang et al., 2022) |
| HVFR-B | 20 % | Ceramsite | 100 | 0.12 | 25 | Song et al. (Song et al., 2020) |
| Mesh of Proppants | Temperature | DRGO | DR900 | DR1000 |
|---|---|---|---|---|
| 80–100 mesh | 30℃ | 480 mm/s | 39.68 mm/s | 75.63 mm/s |
| 60℃ | 45.14 mm/s | 22.45 mm/s | 27.67 mm/s | |
| 90℃ | 23.5 mm/s | 12.91 mm/s | 15.43 mm/s |
3.5.2 Performance of drag reduction
The high drag reduction rate is the most outstanding performance of slickwater fracturing fluid, which contributes to its wide application in oil and gas fields. In actual fracturing operations, the pumping flow rate reaches 10 m3/min, which is much higher than the flow rate simulated in the laboratory. In this study, the maximum flow rate is 2.0 m3/h due to equipment power limitations. As shown in Fig. 20, at 30 °C, the drag reduction rate of DRGO increases with the growing flow rate. The strong resistance under the condition of low flow rate is attributed to the viscous resistance of high-viscosity fluid in addition to the friction between liquid molecules. In contrast, higher flow rates enhance shear rates and reduce the viscosity of the fluid, making friction between liquid molecules the main resistance. Therefore, the drag reduction rates of the two slickwater fracturing fluids tend to be similar at high flow rates. In contrast, at 90 °C, drag reduction rates of both fluids are decreased, with that of DRGO higher than that of DR900. This is also consistent with the abovementioned higher DRGO thermal resistance than DR900.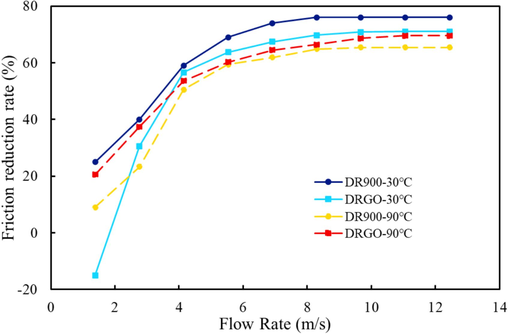
Drag reduction rates of DR900 and DRGO varying with temperature and flow rates.
3.5.3 Gel breaking performance
High-viscosity fluids may be subject to difficulty in breaking gel and/or high residue contents. However, the synthesized DRGO in this study presents good gel-breaking performance after 100 ppm ammonium persulfate is used to break gel, as suggested by the low viscosity of the gel-breaking liquid (i.e. 1 mPa·s) after adding ammonium persulfate for 35 min (Fig. 21). Moreover, the residue content in DRGO is only 10.11 ppm (Table 7), which is similar to that in DR900, indicating no additional damage to the reservoir.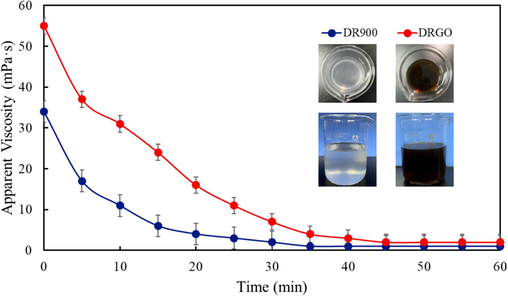
Varying viscosity of DR900 and DRGO with time.
No.
Fracturing fluid type
Residue Content/ppm
1
DR900
8.32
2
DRGO
10.11
4 Conclusions
In this study, a new method was proposed to formulate functional fracturing fluids with higher temperature resistance and stronger shear resistance, which was associated with investigations into the synergy between graphene oxide nanoparticles and slickwater fracturing fluid as well as evaluation of the performance of nanohybrid fracturing fluid.
Firstly, interactions between graphene oxide nanoparticles and polymer molecules are mainly through hydrogen bonding. Consequently, the inclusion of modified nanomaterials can enhance the fracturing fluid's apparent viscosity, temperature resistance, viscoelasticity, and sand carrying performances of the fracturing fluid.
Secondly, although both having spatial network structures, DR900 presents a disorderly, loose, and multi-hole network structure, while DRGO exhibits a uniform and compact integral network structure, which contributes to its elasticity similar to that of solid, thereby improving the sand carrying capacity of fracturing fluid. Finally, DRGO achieves a drag reduction rate of 71.07 % at a flow rate of 12 m/s. Adding Nano-GO does not affect the drag reduction performance of DR900. When the concentration of the glue breaker is 100 ppm, DRGO can quickly break the gel within 35 min, and the residue content is as low as 10 ppm.
To conclude, nano graphene oxide can markedly improves the properties of fracturing fluids, and nanohybrids represent an innovative approach to developing excellent fracturing fluids.
CRediT authorship contribution statement
Yuan Li: Writing – original draft. Xu Han: Writing – review & editing. Donghang Zhang: Funding acquisition. Ping Fu: Visualization. Guohui Chen: Investigation. Maozhang Tian: Data curation. Fujian Zhou: Funding acquisition. Hang Xu: Data curation. Zimo Lin: Resources.
Acknowledgements
This research was financially supported by National Natural Science Foundation of China (Grant Nos. 52004306 and 52174045), the Strategic Cooperation Technology Projects of CNPC and CUPB (Grant Nos. ZLZX2020-01 and ZLZX2020-02) and the National Science and Technology Major Projects of China (Grant Nos. 2016ZX05030005 and 2016ZX05051003). The Major Science and Technology Project of CNPC (Grant Nos. 2023ZZ0409).
Declaration of competing interest
The authors declare that they have no known competing financial interests or personal relationships that could have appeared to influence the work reported in this paper.
References
- Abrami, M., Chiarappa, G., Farra, R., Grassi, G., Marizza, P., & Grassi, M. (2018). Use of low field NMR for the characterization of gels and biological tissues. 14.
- Investigation on the thermal gelation of Chitosan/β-Glycerophosphate solutions. Carbohydr. Polym.. 2019;214:110-116.
- [CrossRef] [Google Scholar]
- Aften, C. (2018). Analysis of Various High Viscosity Friction Reducers and Brine Ranges Effectiveness on Proppant Transport. Day 4 Wed, October 10, 2018, D043S006R003. https://doi.org/10.2118/191792-18ERM-MS.
- Nanoparticle-Enhanced Hydraulic-Fracturing Fluids: A Review. SPE Prod. Oper.. 2017;32(02):186-195.
- [CrossRef] [Google Scholar]
- Poly(oxyalkylene) grafts to guar gum with applications in hydraulic fracturing fluids. Polym. Adv. Technol.. 2006;17(9–10):679-681.
- [CrossRef] [Google Scholar]
- Integrated re-stimulating technology of fracturing-replenishment-displacement of horizontal wells in tight reservoirs. Fault-Block Oil & Gas Field. 2021;28(1):63-67.
- [Google Scholar]
- Proppant Transport Using High-Viscosity Friction Reducer Fracture Fluids at High-Temperature Environment. SPE J.. 2022;27(01):60-76.
- [CrossRef] [Google Scholar]
- Development of resistance-reducing agent with rapid thickening property for slick-water. Modern Chemical Industry. 2016;36(1):78-81.
- [Google Scholar]
- Characterisation of carboxymethyl cellulose and polyacrylamide graft copolymer. Carbohydr. Polym.. 2004;57(4):379-387.
- [CrossRef] [Google Scholar]
- Preparation and characterization of SiO2 nanoparticles-water flooding enhancement agent of low permeability oil field. Chemistry Research. 2005;16(1):32-34.
- [Google Scholar]
- Measurement of the porous microstructure of hydrogels by nuclear magnetic resonance. J. Colloid Interface Sci.. 1995;174(2):336-344.
- [Google Scholar]
- Crews, J. B., & Huang, T. (2008). Performance Enhancements of Viscoelastic Surfactant Stimulation Fluids With Nanoparticles. All Days, SPE-113533-MS. https://doi.org/10.2118/113533-MS.
- Rheology of non-Newtonian fluids: A new flow equation for pseudoplastic systems. J. Colloid Sci.. 1965;20(5):417-437.
- [Google Scholar]
- Formation and Decomposition of CO2 Intercalated Graphene Oxide. Chem Mater.. 2012;7
- [Google Scholar]
- Galindo, T. (2019). Does Higher Viscosity Improve Proppant Transport? Day 2 Wed, April 10, 2019, D021S004R005. https://doi.org/10.2118/195192-MS.
- Enhancing the Performance of Viscoelastic Surfactant Fluids Using Nanoparticles. All Days 2013SPE-164900-MS
- [CrossRef] [Google Scholar]
- Microscopic mechanism of proppant carrying capacity of fracturing fluid. Oilfied. Chemistry. 2015;32(1):34-38.
- [Google Scholar]
- Huang, T., Crews, J. B., & Agrawal, G. (2010). Nanoparticle Pseudocrosslinked Micellar Fluids: Optimal Solution for Fluid-Loss Control With Internal Breaking. All Days, SPE-128067-MS. https://doi.org/10.2118/128067-MS.
- Effect of zeta potential on properties of foamed colloidal suspension. J. Eur. Ceram. Soc.. 2019;39(2–3):574-583.
- [CrossRef] [Google Scholar]
- Technology of Fracturing Fluids with Friction-reducing Water Overseas and Its Research Progress. Tezhong Youqicang- Special Oil & Gas Reservoirs. 2013;20(1):1-6.
- [Google Scholar]
- Ke, X., Yongjun, L., Xin, W., Yang, S., Minje, X., & Xiaohui, Q. (2019). Development of a Smart Slickwater with Highproppant-Carrying Capability for Shale Reservoirs. Day 1 Mon, November 11, 2019, D011S007R004. https://doi.org/10.2118/197817-MS.
- Polysaccharide-based hydrogels crosslink density equation: A rheological and LF-NMR study of polymer-polymer interactions. Carbohydr. Polym.. 2022;277:118895
- [CrossRef] [Google Scholar]
- Experimental investigation of GO-HPAM and SiO2-HPAM composite for cEOR: Rheology, interfacial tension reduction, and wettability alteration. Colloids Surf A Physicochem Eng Asp. 2022;637:128189
- [CrossRef] [Google Scholar]
- Photopolymerization and characterization of polyacrylamide/modified nanocrysatlline cellulose nanocomposite hydrogels. Polym Mater Sci Eng. 2017;4(5)
- [Google Scholar]
- The effect of the addition of carbon nanotube fluids to a polymeric matrix to produce simultaneous reinforcement and plasticization. Carbon. 2012;50(5):2056-2060.
- [CrossRef] [Google Scholar]
- Preparation of One-Dimensional Polymer-Inorganic Composite Nanomaterials. Prog. Chem.. 2018;30(4):338.
- [Google Scholar]
- Nano-silica hybrid polyacrylamide/polyethylenimine gel for enhanced oil recovery at harsh conditions. Colloids Surf A Physicochem Eng Asp. 2022;633:127898
- [CrossRef] [Google Scholar]
- Influence of nanomaterial morphology of guar-gum fracturing fluid, physical and mechanical properties. Carbohydr. Polym.. 2020;234:115915
- [CrossRef] [Google Scholar]
- Advance in polymer matrix composite synergistically enhanced by inorganic nanomateria. New Chemical Materials. 2020;05:32-36.
- [CrossRef] [Google Scholar]
- A high salt tolerance and low adsorption drag reducer based on non-covalent enhancement. Pet. Explor. Dev.. 2020;47(6):1333-1341.
- [Google Scholar]
- The Arrhenius Equation Revisited. Crit. Rev. Food Sci. Nutr.. 2012;52(9):830-851.
- [CrossRef] [Google Scholar]
- Research progress of nanometer slippery water fracturing fluid technology in China. New Technology & New Products of China. 2020;20:4-6.
- [CrossRef] [Google Scholar]
- Song, J., Navarrete, R., Asadi, M., & Jin, B. (2020). New High Viscosity Friction Reducers for Proppant Transport in Hydraulic Fracturing. Day 1 Wed, February 19, 2020, D011S001R003. https://doi.org/10.2118/199330-MS.
- A Comprehensive method to evaluate the viscous slickwater as fracturing fluids for hydraulic fracturing applications. J. Pet. Sci. Eng.. 2020;193:107359
- [CrossRef] [Google Scholar]
- A novel multifunction fracturing fluid compounding of nano-emulsion and viscous slickwater for unconventional gas and oil. Arab. J. Chem.. 2022;15(5):103749
- [CrossRef] [Google Scholar]
- Preparation and properties of resistance reducing agent with temperature and salt resistance used for shale gas fracking. Applied Chemical Industry. 2019;48(1):113-117.
- [Google Scholar]
- Determination of the Oxidizability on the Surface of the Graphene Oxide Layer by Infrared Spectroscopy. Spectrosc. Spectr. Anal.. 2020;40(6):1722.
- [Google Scholar]
- Analysis on polymeric nano-composites as drag reduction agent for oil. Oil & Gas Storage and Transportation. 2013;32(10):1037-1042.
- [Google Scholar]
- The enhancement of performance and imbibition effect of slickwater-based fracturing fluid by using mos_2 nanosheets. Petroleum Science(4) 2023
- [Google Scholar]
- Correlation between Molecular Structure and Interfacial Properties of Edge or Basal Plane Modified Graphene Oxide. ACS Appl. Nano Mater.. 2018;1(6):2763-2773.
- [CrossRef] [Google Scholar]
- Synthesis of Organic-inorganic Ionic Nanoparticle and Its Applications in Polymer Matrix. Materials Reports. 2015;29(17):52-56.
- [Google Scholar]
- New Clean Slickwater Fracturing Fluid System For shale reservoir. Drill. Prod. Technol. 2020 04),89–92+11
- [Google Scholar]
- Yu, W. C., Wu, J., & Han, B. H. (2015). Synthesis and Application of Green and Clean Nanometer Composite Drag Reduction Agent in Shale Gas Development Journal of Yangtze University (Natural Science Edition) (08),78-82+7. doi:10.16772/j.cnki.1673-1409.2015.08.019.
- Multifunctional hydrogel based on ionic liquid with antibacterial performance. J. Mol. Liq.. 2020;299:112185
- [Google Scholar]
- Graphene oxide effectively removes polyacrylamide from aqueous solution: Molecular dynamics simulation and experimental analysis. J. Environ. Chem. Eng.. 2021;9(6):106615
- [CrossRef] [Google Scholar]
- Application of fumed silica-enhanced polymeric fracturing fluids in highly mineralized water. J. Mol. Liq.. 2023;375:120835
- [Google Scholar]
- Discussion of preparation for polyacrylamide friction reducer with temperature, salinity and shear resistant used in slickwater fracturing. Applied Chemical Industry. 2018;47(4):834-838.
- [Google Scholar]
- Zhao, H., Danican, S., & Torres, H. (2018). Viscous Slickwater as Enabler for Improved Hydraulic Fracturing Design in Unconventional Reservoirs. Paper resented at the SPE Annual Technical Conference and Exhibition, Dallas, Texas, 24-26 November. SPE-191520-MS.
- Study on salt thickening mechanism of the amphiphilic polymer with betaine zwitterionic group by β-cyclodextrin inclusion method. Colloid Polym. Sci.. 2017;295(10):1887-1895.
- [CrossRef] [Google Scholar]
- The performance of viscoelastic foamed fracturing fluids with nanoparticles. Science Technology and Engineering. 2018;18(10):42-47.
- [Google Scholar]


