

Translate this page into:
Potential of Luffa cylindrica seed as coagulation-flocculation (CF) agent for the treatment of dye wastewater: Kinetic, mass transfer, optimization and CF adsorption studies
⁎Corresponding authors. pc.nnaji@mouau.edu.ng (P.C. Nnaji), ifegodfey@yahoo.co.uk (I.G. Ezemagu)
-
Received: ,
Accepted: ,
This article was originally published by Elsevier and was migrated to Scientific Scholar after the change of Publisher.
Peer review under responsibility of King Saud University.
Abstract
Background
In dye-based wastewater decontamination, coagulation-flocculation (CF) induced by Luffa cylindrica seed (LCS) was applied.
Methods
The effects of parameters (dosage, pH, stirring/settling time) were investigated using one-factor-at-a-time and Box-Behnken jar test which was designed to optimize the removal of color/total suspended solids (CTSS), chemical oxygen demand (COD) and Chromium VI metal. Proximate and instrumental LCS and post-treatment settled sludge characterization, kinetics, mass transfer and CF adsorption study of the process were investigated.
Significant findings
LCS's proximate composition revealed high crude protein, while its instrumental characterization identified a network of structures with an active surface and a partial crystalline composition. At pH 2, the removal efficiency of CTSS was 99.2% at 1400 mg/L for 30mins, COD was 90.07% at 1400 mg/L for 30mins and at pH 6 chromium was 98.29% at 1800 mg/L for 15mins, these were reported at optimum conditions. Kinetic parameters; rate constant, K11, and half-time coagulation, were determined. The CF adsorption isotherm followed the Freundlich pattern and the kinetic was pseudo-second order. After settling for 300 min, dye removal decreased from the original dye concentration of 1000mgL-1 to 3mgL-1 due to the rapid mass transfer process. R2 was > 0.9 for all the studies, and error indicators reported low values. The high dye-polluted wastewater decontamination potential of bio-coagulant was therefore established. The kinetic, mass transfer and CF adsorption study data obtained may be useful for bio-coagulation system design, a start-up operating time, design control and optimization.
Keywords
Dye wastewater
Luffa cylindrica seed
Coagulation-flocculation
Box-Behnken design
CF adsorption study

1 Introduction
Water pollution is a global issue that affects not only humans but the entire biological population. In natural surface water supplies, water contamination can occur unintentionally, carelessly, or unlawfully discharging contaminated wastewater (Nnaji et al., 2020a; Ezemagu et al., 2020b). The increased manufacturing of dye has resulted in the proliferation of industrial wastewater generation from dye-based industries, particularly to meet the increasing population's textile needs. Dye color and heavy metals are the main contaminants in most wastewater. Dye color is due to incompetent manufacturing process in dye-based industries, while heavy metals are the product of their extensive industrial use, especially in fertilizers, paints, batteries, paper, textiles, industries, etc (Onukwuli et al., 2021; Nnaji et al., 2020b). The toxicity and the presence of this color in very small quantities is extremely visible and detrimental to marine life. The decomposition of organic contaminants from dye materials can create toxic compounds that are considered mutagenic. These compounds are not biodegradable due to their high molecular mass and complex molecular structures (de Souza et al., 2016; Hadi et al., 2019). In addition, the structure of certain synthetic dyes has a benzene ring that can be hazardous to human and/or animal life due to their high thermal and long-term stability (Jafari et al., 2020).
Similarly, due to their poor biodegradability, carcinogenicity and bioaccumulation (Wang et al., 2019), the presence of heavy metals in wastewater poses a severe disposal problem. If the wastewater is not properly disposed of in an environment, this heavy metal usually contaminates the soil, food chain, water supplies and air, and this could result in irreparable harm to various organs, tissues, nervous and reproductive systems, even in trace quantities (Wang et al., 2019). One of the heavy metals that present a major environmental issue in dye wastewater is chromium VI. The introduction of Cr (VI) into the environment is primarily due to human activities in the fields of chemicals, electroplating, leather, and textiles. Chromium VI is particularly harmful to animals, humans, and environmentally toxic. Acute nasal septum and respiratory sensitization (asthma), inflammation, and ulceration are caused by inhalation of chromium VI; kidney and liver function are impaired by ingestion and carcinogenic effects have been observed (AWWA, 2012).
A broad variety of technologies based on various decontamination processes, which are known as either biological or physical technology, and advanced oxidation, are used for decontamination of effluents containing dye (Li et al., 2020). These technologies could be ion exchange, membrane isolation, reverse osmosis, precipitation, electrocoagulation, coagulation/co-precipitation, and adsorption etc (Akpomie & Conradie, 2021; Irfan et al., 2017; Nnaji et al., 2020c; Alves et al., 2020). Coagulation-flocculation (CF), a phyco-chemical technological solution stands out as the most feasible primary option for extracting pollutants from wastewater containing dyes, despite all these techniques due to a number of reasons (Menkiti et al., 2015; Okolo et al., 2016).
The CF is the application of coagulant to wastewater to destabilize and neutralize charges that keep the color/colloid in suspension and then aggregate the resulting individual particles(Nnaji et al., 2014; Menkiti & Ezemagu, 2015; Okolo et al., 2016; Ezemagu et al., 2016). The mechanism of CF that relies on the physical and chemical properties of the solution, the contaminants present, and the coagulant type include hydrolysis, coagulation, peri-kinetic and orth-kinetic flocculation (Howe et al., 2012). Peri-kinetic and orth-kinetic flocculation is driven by interparticle bridging and sweep flocculation (physical adsorption). The aggregation of particles takes place through this adsorption mechanism.
Essentially, coagulation-flocculation process using bio-coagulant exhibits two principal mechanisms; charge destabilization/neutralization, and interparticle bridging/sweep flocculation. The later occur through adsorption and could be likened to conventional adsorption (Jadhav & Mahajan, 2014; Ezemagu et al., 2020a; Menkiti & Ezemagu, 2015). Coagulation-flocculation are the fundamental processes at most water treatment plants and modern wastewater treatment plants where solid–liquid separation is of considerable significance in practice. It is also widely used to remove color/colloid dispersion in dye-based wastewaters using various coagulants (Nnaji et al., 2020c).
Chemical coagulants have been widely used to extract a wide variety of pollutants from wastewater. However, the brownish coloring of equipment by iron salt and the post-contamination issues associated with aluminum salts are an inherent drawback (Okolo et al., 2018). Health issues such as Alzheimer's disease in humans (Irfan et al., 2017), generation of large volume of sludge leading to huge disposal cost and inefficiency of aluminum salt in low-temperature waters (Ezemagu et al., 2021a) was reported.
The ability of coagulants from biological origin in reducing the hazards associated with wastewater and the growing concern for environmental issues caused using conventional coagulants, resulted to search for more biological alternative that are ecofriendly. Due to their biodegradability, reusability, wide availability, eco-friendly, easy preparation and efficient performance, natural organic (plant based) coagulants are the most preferred (Ani et al., 2012). Natural bio-coagulants like Moringa olifera, tannins, Detarium microcarpum, mucuna seed, etc. has been researched on with good results (Okolo et al., 2016; Ani et al., 2012; Nnaji et al., 2020c). Wastewater treated with natural coagulant using processes of CF as opposed to synthetic coagulants does not pose any risk to biological species. The generated sludge can be anaerobically digested and composted to produced biogas and biofertilizer (Ezemagu et al., 2021c; Ejimofor et al., 2021).
Luffa cylindrica seed, the coagulant for the CF process belongs to the cucurbitaceae family. Luffa cylindrica seed are readily found in Senegal, Gambia, Guinea, Serra leone, Liberia, Mali, Ghana, Nigeria etc. Luffa cylindrica seed is dispersed pantropically and sub tropically to countries where rainfall is high. Luffa consists primarily of cellulose (60%), hemicellulose (30%), and lignin (10%), and is thus, called lignocellulose (Shahidi et al.,2015). Luffa fresh gourd is used as an edible vegetable, in medical treatment, and the sponge finds wide applications, among others, in packaging, shoe mats, soundproof linings, plant, algae, bacteria, and yeast immobilization matrix (Anastopoulos & Pashalidis, 2020). Luffa consists of protein and carbohydrate; hence can be used a coagulant in decontamination of aqueous effluent (Baharlouei et al., 2018). Luffa cylindrica seed’s biodegradability, non-toxicity, and healthy nature for human and animals alike, makes it relevance.
However, most of the works on dye-based wastewater decontamination were centered on OFAT (one factor at a time) technique. OFAT consumes time and should not be applied in predicting desired optimum CF efficiency based on the interactions between the process factors (Ezemagu et al., 2021b; Ejimofor et al., 2021a). The process variables that influence CF are temperature, solution pH, wastewater content, coagulant concentration and type, etc. Therefore, optimizing these factors will increase the performance of the process significantly. Response surface methodology (RSM), a set of statistical concepts for the design of model building experiments, the evaluation of the influences of different factors, and the search for the optimal conditions of the variables, was proposed (Onukwuli et al., 2021; Ezemagu et al., 2021a). Box-Behnken design (BBD) is one of the vital components of RSM. Unlike center composite design and other designs in RSM, the BBD consumes less time with few experimental runs and precise results, hence, is usually applied in industrial research (Ezemagu et al., 2021a).
Furthermore, many industrial coagulation-flocculation (CF) processes involving particle agglomeration involve rapid transfer of particle mass and adsorption. Since they are efficient in suspending solid particles, CF processes and most industrial processes use agitated vessels, ensuring that all usable surface area is used, resulting in a good mass transfer rate. Accurately specifying kinetic, mass transfer, optimization and CF adsorption parameters will eliminate or substantially decrease over-design and boost sound control structures by improving the operational efficiency of the unit (Jimoda et al., 2013). Precise equipment size can be assured with the correct parameters, risks can be quantified confidently and optimum operating policies can be adequately defined. There is no documented evidence in the literature on the kinetics, mass transfer, optimization, and CF adsorption studies of the Luffa cylindrica seed induced CF process for the decontamination of dye-based wastewater. Therefore, the importance of this work is evident.
Hence, the aim of the present work is to investigate the use of Luffa cylindrica seed (LCS) induced CF process for the decontamination of dye-based wastewater. Specifically, this bio-coagulant was used to assess the removal of color/total suspended solids (CTSS), heavy metal, and COD from the wastewater. Physiochemical characterization of Luffa cylindrica seeds were gotten. Fourier transfer infrared (FTIR), Scanning electron spectroscopy (SEM)/elemental and X-ray diffraction (XRD) were applied to observe the Luffa cylindrica seed (LCS) and the post treated settled sludge after coagulation (PTSS) for its morphological, spectral, elemental composition and crystalline properties. The study's specific objectives also, included coagulation process kinetics, sorption kinetics and isotherm modelling of CF adsorption, mass transfer (coagulation rate-based modelling), and CF process optimization.
2 Experimental section
2.1 Materials, preparation and characterization
At CONRAWS Scientific Equipment Nigeria Limited, the Cibacron blue (3GA) and dispersed red 220 dyes were collected in Enugu, Nigeria. Without further processing the dye materials were applied. Dye-based wastewater was prepared for a 1000mgL-1 concentration by dissolving the same ratio of Cibacron blue (CBD) and dispersed red (DRD) in distilled water.
2.1.1 Luffa cylindrica seed (LCS)
Luffa cylindrica sponges were collected around farm settlements in Amawom, Ikwuano Local Government Area, Abia State, Nigeria, between August and September, and dried in sun. The Luffa cylindrica seeds were isolated from the matured dried sponges. Separated seeds were washed, dried and homogenized to obtain LCS and placed in an airtight container for further use (see Fig. 1). The proximate analysis of the LCS was based on standard methods (AOAC, 2005). Coagulant (LCS) and post treatment settled sludge (PTSS) were characterized using the following instruments: an infrared spectrometer (Agilent Technologies) with a resolution range of 4000–650 cm−1 and 30 8 cm−1 scans with 16 background scans to obtain FT-IR spectra. A scanning electron microscope (Phenon-World, MVE 016477830) for morphological characteristics of the sample. An X-Ray diffractometer (XRD) spectrum was obtained using PHILIPS – ASCII (UDF) with XPERT diffractometer to determine the crystalline nature of the materials.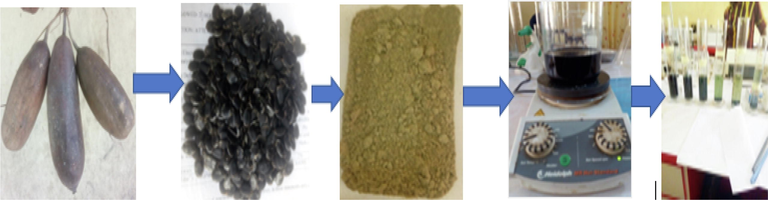
Schematic diagram of LCS preparation up to application as coagulant.
2.1.2 Dye-based wastewater
The characterization of dye-based wastewater was determined by standard methods (AWWA, 2012). The COD and the Cr(VI) were determined using dichromate method (5220A) and flame adsorption spectrophotometry (3111B), respectively (AWWA, 2012).The characterization was carried out at the National Soil, Plant, Fertilizer, and Water Laboratory, Umudike, Nigeria. Mettler Toledo Delta 320 pH meter, Conductivity meter, DDS 307 and UNICO 1100 Spectrophotometer were used to evaluate the pH, electrical conductivity and CTSS.
2.2 Coagulation-flocculation (CF) test (Jar test)
The CF process was carried out utilizing a jar test approach, in which LCS (with concentration 1.0–1.8gL-1) was added to 200 mL of wastewater at various pH values (2–10). Sulphuric acid and sodium hydroxide, both at 0.1 M, were used to achieve pH adjustment between 2 and 10. It was decided to undertake 5mins quick stirring at 150 rpm followed by 30 min of gentle stirring at 25 rpm. The coagulant was applied before the agitation. After 30 min of slow stirring, the solution was gently put into a 250 mL cylinder and allowed to settle. A UV–VIS spectrophotometer (UNICO 1100, with wavelength range 330–900 nm and sample cell length of 10 mm) was used to measure the absorbance of a 10 mL supernatant pipetted 2 cm below the solution at various time intervals.
2.3 Determination of CTSS, COD and chromium (VI) metal removal
Using the direct proportionality between absorbance and concentration, the percentage CTSS removal from dye-based wastewater was determined. The initial absorbance was reported before the process of CF was carried out and the absorbance at each time was recorded. From this, the percentage CTSS removal for each of the coagulant dosages was calculated. The supernatant obtained after the CF process was analyzed with a standard method according to AWWA (2012) for COD and chromium (VI) content.
2.4 Coagulation-flocculation (CF) kinetic principles
The clusters-size distribution of colloidal particles as time evolves is described by the Smolunchowski as (Okolo et al., 2016):
Where, Nn(t) is the time-dependent number concentration of n-fold clusters, t is the time, and Kij are the elements of the rate kernel which control the rate of coagulation between an i-fold and an j-fold cluster. However, from Smolunchowski approximation, the coagulation is entirely controlled by Brownian diffusion and the coagulation rate constant for dimmer formation of an initially mono-disperse suspension is then given by:
where KB is the Boltzmann constant, T is the absolute temperature, and η is the medium viscosity. It has been reported that for a constant kernel, i.e., Kij = KII, the Smolunchowski Eq. (1) can be resolved to obtain the expression:
where No is the initial particle concentration.
From Eq. (3), the linear functions in time for the inverse square root of monomer concentration N1 is given by the expression:
From Eq. (4),
vs t can be plotted and fitted using MATLAB 2015a software. The linear polynomial model F(x) = P1 * X + P2 similar to Eq. (4) was used for the fit. The coagulation rate constant can be evaluated from the slope. Also, the rapid coagulation rate constant, KRis given by Smoluchowski as:
Combination of Eqs. (2) and (5) gives:
Furthermore, the coagulation time or the time when the total number concentration of particle is reduced by a factor of 2 is obtained using Eq. (7).
This coagulation time represents a useful time scale for the identification of the early stages in the CF process. Denoting the number of concentrations of n-fold aggregates at reduced time as .
Absorbance is converted to suspended solid particles concentration (N), mgL-1, using Beer‘s law as shown.
Where A = Absorbance, εm = molar extinction coefficient, C = concentration, L = path length of 1 cm
No = Initial Particle Concentration and Nn = Particle Concentration at time, t.
2.5 CF adsorption isotherm and kinetic modeling
The sorption mechanism, inter particle bridging, and sweep flocculation cause floc development in coagulation-flocculation, which can be reproduced as an adsorption phenomenon (Jadhav & Mahajan, 2014; Ezemagu et al., 2020). To determine the CF adsorption effectiveness of LCS in the CF process, the data obtained from the jar test experiment was used to model the isotherm using Langmuir, Freundlich, and Temkin models, as well as adsorption kinetics using Lagergren pseudo first order and Ho's pseudo second order models.
2.5.1 Langmuir isotherm
The Langmuir isotherm is based on the fact that the maximal adsorption on the adsorbent surface corresponds to a saturated monolayer of solvent molecules, the adsorption energy is uniform, and no adsorbate transmigration on the surface plane ((Ezemagu et al., 2016). The Langmuir equation is written as:
Where , is the Langmuir constant (Lg−1); is the equilibrium dye concentration on the adsorbent (gg−1); is the equilibrium dye concentration in solution (gL-1); qm is the concentration of dye when the adsorbent forms a monolayer (gg−1). and can be evaluated from the slope and intercept of plot .
2.5.2 Freundlich isotherm
The Freundlich isotherm is based on the premise that bio-sorption heat has a heterogeneous surface with a non-uniform distribution over the surface. The linearized empirical equation is expressed as:
Where the Freundlich constant is (gg-1L1/n g−1/n) and 1/n is the heterogeneity factor associated with the bio-sorption potential and strength, respectively.
2.5.3 Tempkin isotherm
The Tempkin isotherm model considered the impact on adsorption isotherms of certain indirect adsorbate/adsorbate interactions and proposed that the adsorption heat of all the molecules in the layer would decrease linearly with coverage due to these interactions (Menkiti et al., 2018). The Tempkin isotherm linearized equation is given as:
2.5.4 Adsorption kinetics
To determine the mechanism of CF adsorption performance on the biomass during the CF process, the Lagergren pseudo first order model, Ho's pseudo second order model, was analyzed. The expression for pseudo first order rate is given as:
The rate constant of first order adsorption (min−1) is
, where
and
are the amount of dye adsorption on biomass at equilibrium and at time t, (gg−1), respectively. The rate of pseudo second order is expressed by (Menkiti et al., 2018):
Where the rate constant is for pseudo second order adsorption (gg-1min−1).
2.6 Coagulation-flocculation diffusion model formulation
From counter-current and simultaneous diffusion of particles from dense to less dense particle regions, a mathematical model explaining the transfer rate of mass (coagulated particles) in the wastewater treatment during CF process was created, as shown in Fig. 2a. By defining the simplifying assumptions, identifying the correct initial and boundary conditions of the process, the conservation of particle mass in the wastewater treatment system for CF was achieved. The following assumptions have been made: wastewater homogeneity and one-dimensional mass transfer in the process. The initial wastewater particle concentration is uniform and the internal resistance to the movement of particles was overlooked.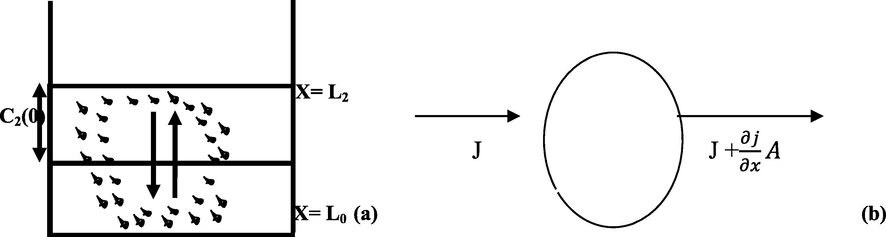
Schematic outlay of the process showing L2, height of coagulated wastewater, the interface of less and rich-particle zones(a), Species conservation in CF (b).
Considering conservation of mass of particles in the coagulation-flocculation system as illustrated in Fig. 2b, we will have:
Where C = concentration, j = flux of the mass per unit time, A = area, x = characteristic length (m), and t = time.
Applying Eqs. (16) to (18) in Eq. (15), we have:
Divide Eq. (19) by Ax gives;
Recalling, Fick’s first law:
Effective diffusion coefficient
And then, combining Eqs. (20) and (21), gives:
Eq. (22) is a partial differential equation which describes the rate of mass transfer during the CF of wastewater using biomass. Using Eq (23),
was computed for an effective particle diffusion coefficient. (Menkiti & Onukwuli, 2011)
2.6.1 Numerical solution technique (finite difference technique)
With a view to solving the Eq. (22), the technique of approximation was used. The explicit finite difference method (FDM) was applied and the equation was transformed into a differential equation by dividing the solution domain into a grid of points represented along with each mesh point and referred to as nodes in the form of mesh and derivatives. The solution was obtained when at each node the dependent variable was first defined, and then approximated until the final step for the next step. Therefore, the finite display of the mesh points is shown as follows (Jimoda et al., 2013):
Where δx and δt indicate grid sizes and subscripts denote the location of the dependent variable being considered in the × and t directions, respectively. Let the process of jar CF occupy the
space and divide the gap in the space of the unit into equal δx intervals and time into δt intervals. The finite difference representations of various derivatives appearing in the governing equation are obtained from expanding the Taylor series (Stroud, 1987). Then, applying the expansion in the t-direction while preserving the constant and truncated second term of the series for the left side of Eq. (22) then gives,
Therefore,
Similarly, expanding in the x-direction, keeping t, constant, i.e., for the right-hand side of Eq. (22), becomes:
Again, applying Taylor’s series expansion in × direction (backward difference) keeping t constant:
Adding Eqs. (29) and (30) gives:
Equating Eq. (28) to Eq. (31) and introducing
as in Eq. (22) gives the governing equations:
Where r =
At
Then, calculate (pseudo concentration at external mesh point) and depicts the relevant grid points at x = 0 and x = L. The simplest way to represent the condition at x = 0, for forward difference, in finite difference is given by:
This gives an additional
equation at any time stage to be used instead of a given
value in an explicit finite difference. Now,
must be inserted at the external mesh point to represent a pseudo concentration more accurately at × = 0 by the central difference equation by imagining that the tissue sheet is very slightly extended. Accordingly, in terms of central difference representation, the finite difference approximation at boundary x = 0 is:
To eliminate
between Eqs. (33) and (34), we have that Eq. (35) as:
Substitute Eq. (36) into Eq. (34) and expanding gives
Similarly, at × = L (for other side of the tissue) the derivative boundary condition becomes:
In terms of central difference representation, we have,
Similarly, if the value (
) is eliminated between Eq. (38) and Eq. (39), we have:
2.6.2 Computer programming and simulation
Codes for Eq. (40) implementation for the rate of mass transfer during wastewater coagulation using LSC was developed in the MATLAB environment and analyzed under various process operating conditions. The criterion for the stability and convergence of the solution was tested and met (
) for each simulation run of the CF process. The following statistical parameters were used: mean square error (MSE), root mean square error (RMSE), mean absolute percentage error (MAPE), and mean absolute deviation (MAD). Using Eqs (41) – (44)., the statistical parameters above were calculated.
2.7 Box-Behnken design (BBD) of experiment
In the design of the RSM jar test, BBD implementing RSM from Design Expert 10.0 portable was used. BBD is a three-level architecture for quantitative variables for all variables. The architecture has varied across three levels for each of the numerical factors; high (+1), low (-1) and middle (0). The experiment required a total of 17 runs (Table 1). The response variables (Y %) were %CTSS, %COD and %Cr (VI) removal, while, LCS dosage (X1), solution pH (X2) and stirring time (X3) were the independent variables affecting the response variables (Y%). The spectrum and levels used in the analysis are indicated in Table 1. This method is intended to suit the quadratic polynomial equation (Kim, 2016; Ahmadi et al., 2016; Ezemagu et al., 2021) of this model form:
Run
Coded
Uncoded
Responses
X1
X2
X3
Dosage (gL-1)
pH
Stirring time (mins)
CTSS Removal (%)
COD
Removal (%)Cr(VI) Removal (%)
1.
0
0
0
1.4
6
15.0
58.4
76.97
70.01
2.
−1
0
−1
1.0
6
5.0
56.6
67.48
92.92
3.
1
−1
0
1.8
2
15.0
97.8
88.03
48.62
4.
0
−1
−1
1.4
2
5.0
97.9
87.10
32.48
5.
0
1
−1
1.4
10
5.0
27.0
76.80
46.23
6.
−1
0
1
1.0
6
30.0
35.2
43.34
87.53
7.
−1
1
0
1.0
10
15.0
28.6
67.61
50.78
8.
1
0
−1
1.8
6
5.0
49.0
86.80
89.48
9.
−1
−1
0
1.0
2
15.0
89.4
86.59
44.06
10.
0
0
0
1.0
6
15.0
58.2
76.44
71.42
11.
0
0
0
1.4
6
15.0
58.7
77.89
70.98
12.
0
0
0
1.4
6
15.0
58.4
77.01
72.22
13.
0
0
0
1.4
6
15.0
56.7
77.44
73.58
14.
0
1
1
1.4
10
30.0
29.0
45.30
45.97
15.
0
−1
1
1.4
2
30.0
99.2
90.07
49.02
16.
1
1
0
1.8
10
25.0
35.0
68.93
56.02
17.
1
0
1
1.8
6
30.0
68.4
79.8
98.29
The independent variables affecting y, bo, bi, bii and bij are the offset terms, ith linear coefficient,
iith quadratic coefficient and the ijth interaction coefficient where y is the response variable to be modeled; Xi and Xj.
For three variable inputs of X1, X2, and X3, the quadratic response is shown in Eq (46) (Prabhu et al., 2020):
Where Y: response; X1, X2, and X3: autonomous parameters; b0: constant, b1, b2 and b3: constants were reflecting the influence of parameters X1, X2, and X3; b12, b13 and b23: constants were reflecting the interaction between two parameters; and b11, b22 and b33: constants were reflecting the quadratic effect.
3 Results and discussion
3.1 Characterization results
3.1.1 Luffa cylindrica seed (LCS)
The proximate composition of LCS previously documented (Nnaji et al., 2020b; Onukwuli et al., 2021), revealed 21.88% crude protein, which is high and comparable to published work as one of the active component for CF process. The relative high protein could be the reason for good performance of LCS as a coagulant for the treatment of dye-based wastewater. Documented literature has defatted LCS crude protein ranging from 42.17 to 70.65%, 45.06– 50.06%, whereas non-defatted LCS crude protein is 28.45% (Nnaji et al., 2020b).
3.1.2 Characterization of dye-based wastewater
The characteristics of dye-based wastewater revealed high dissolved solid particles with obvious high conductivity and the presence of heavy metals. The results indicated pH of 5.55, turbidity 340.53FAU, BOD 316.35 mg/L, COD 1930.4 mg/L, Lead 2.27 mg/L, Nickel 8.54 mg/L and Chromium 2.315 mg/L. The value of turbidity shows the presence of total dissolved and suspended solid in the wastewater. The high COD value and the presence of heavy metals such as Lead, Nickel and chromium are indicators of pollution.
3.1.3 FT-IR spectra characterization of LCS and PTSS
It is important to understand the essence and properties of a material in order to make the best use of it. Therefore, FT-IR was used to investigate the LCS and PTSS surface characteristics. The LCS and PTSS spectra are shown in Fig. 3. Fig. 3 showed the existence for LCS and PTSS of a polymer –OH, functional group extending between 3276.3 cm−1 and 3280.1 cm−1 (Jiang et al., 2020). Methyl C-H and methylene C = H asymmetric stretching is applied to spectra stretch 2951.1–2914.8 cm−1 for LCS and PTSS, while 1707.1 cm−1 could be carboxylic ketone stretching. For LCS and PTSS, 1636.3 cm−1, 1543.1 cm−1, and 1408.8 cm−1 could be due to olefin, aromatic ring stretches and asymmetric alcohol bends, respectively. Similarly, the stretch for LCS and PTSS at 1226.3 cm−1 and 1036.2 cm−1 may be attributed respectively to skeletal C = C vibration and primary amine C-N The medium peak for PTSS at 1770.5 cm−1 and 1457.4 cm−1 could be due respectively to carboxylic and skeletal C-C stretching of vibration. Also present in PTSS are 1080.9–1028.7 cm−1 stretching and 752.9 cm−1 stretching, respectively, which may be cyclohexane vibration and C-H alkyne bend. Protein and fatty acid structures commonly contain these groups, especially the hydroxyl and carboxyl groups (Dalvand et al., 2016). The spectra are comparable to the spectra obtained for organic compounds like protein(Nandiyanto et al., 2019). The majority of the functional groups found in LCS and PTSS serves as an active site for color/colloidal particle attachment (de Souza et al., 2016; Onukwuli et al., 2021). Another indicator of LCS ability to pick up metal ions in solution is the presence of – OH (which could be proof for possible pore hydration) and carboxylic stretching. The changes in FTIR spectra in the two samples indicate that functional groups are involved in dye and colloidal adsorption during coagulation and flocculation (Joshi et al., 2020). The shift in peaks could be attributed to changes in functional groups’ chemical environment, while, bandwidths appearance and disappearance as seen in PTSS points at reactions that involves the relevant functional groups(Nnaji et al., 2020b).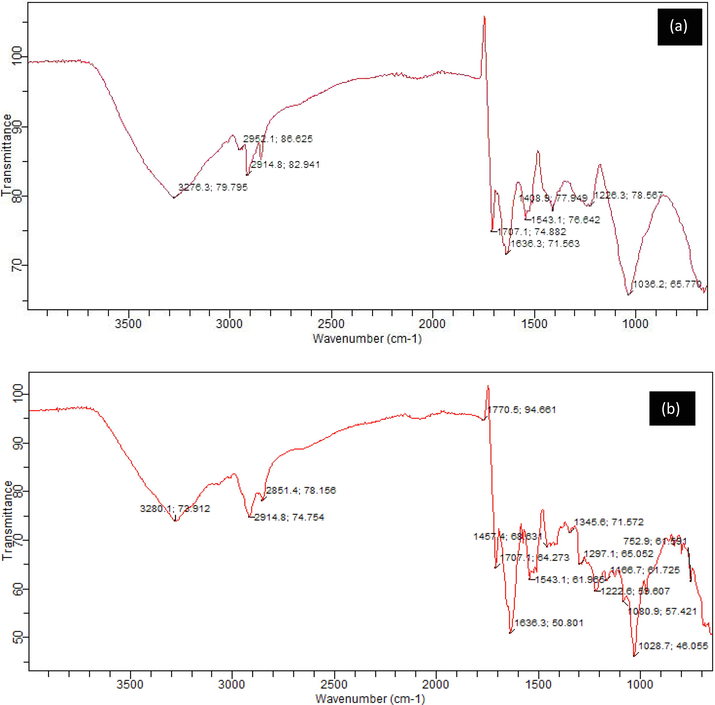
FTIR spectra of (LCS) (a); Post treatment settled sludge (PTSS) (b).
3.1.4 SEM/elemental results of LCS and SS
LCS and PTSS (post CF) surface morphology is provided in 1500 × magnification (see Fig. 4). Fig. 4a for LCS indicates fibrous nature and irregular structure, some fissures and pores are present. This is an example of a macroporous structure providing active sites for coagulation-flocculation and adsorption (Ahmad & Haseeb, 2015). The PTSS surface morphology displayed in Fig. 4b is in 1500 × magnification. The figure showed expansion of LCS molecules and aggregated particles of LCS and dye, attributed to the CF process involving certain chemical reactions, which led to the breakdown of the existing structure to allow floc formation. Table 2 describes the elemental compositions of LCS, CBD, DRD and PTSS. Clearly, the presence of elements, which were originally not seen in LCS, but subsequently appeared in the PTSS matrix was an indicator of the transfer of elemental particles from dye-based wastewater. The presence or absence of such particles could not be unconnected to a chemical reaction that contributed to depositing or adding the elements to the PTSS matrix, or dissolving them into decontaminated wastewater solution.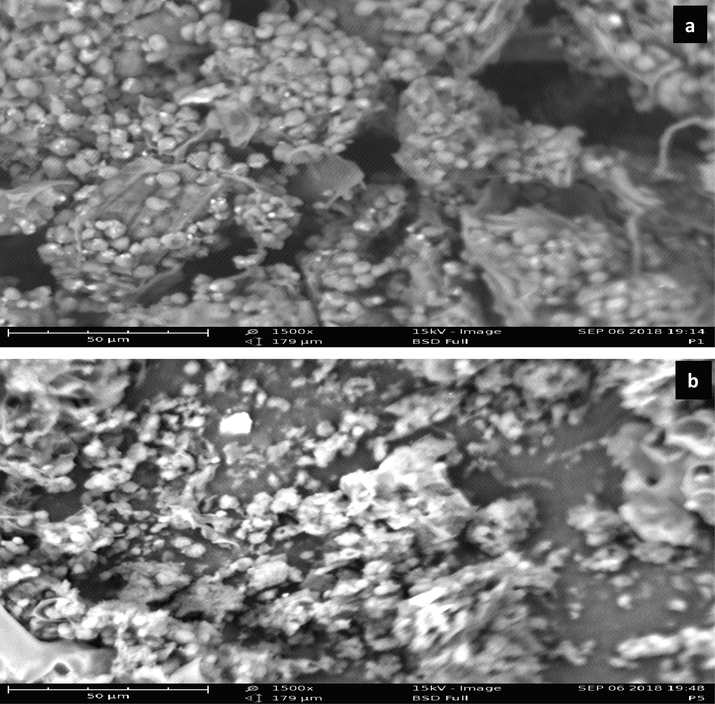
SEM micrograph LCS at 1500x magnification (a) and PTSS at 1500 × magnification (b).
Element, (wt. %)
LCS
CBD
DRD
SS
Mg
24.10
0.00
4.40
0.00
Al
1.40
1.10
0.60
8.70
Si
1.10
1.20
0.20
15.70
P
34.00
0.23
0.60
22.00
S
9.90
80.9
64.80
33.00
Cl
0.30
3.20
28.80
12.40
Ca
0.60
5.10
0.10
5.40
Ti
0.40
0.30
0.08
1.10
Cr
0.00
1.10
0.00
0.40
Mn
0.07
1.10
0.00
0.00
Fe
1.30
4.10
0.30
1.70
Ni
0.00
0.07
0.00
0.06
Cu
0.06
0.20
0.00
0.00
Zn
0.30
0.04
0.00
0.01
Br
0.00
0.50
0.01
0.00
Sn
26.50
0.00
0.00
0.00
Pb
0.00
0.80
0.00
0.30
3.1.5 XRD results of LCS and PTSS
X-ray diffraction is a valuable method for the study of the material's crystalline structure. Fig. 5 displays the X-ray diffraction spectra for both LCS and PTSS. Fig. 4a for LCS shows 14 clear and high peaks and numerous halos with amorphous humps and lots of noise, while, Fig. 5b indicated 13 clear peaks, between 10 < 2
< 70° strip. This indicates characteristic patterns of a partially crystalline nature where scattered bands were formed by poorly organized molecules. For PTSS, Fig. 5b showed similarly organized molecules with peak changes. Also, the crystal peaks in Fig. 5 a, b, when compared with the regular crystal peaks shifted from left to right axes, which could be attributed to the expansion or contraction of LCS (Menkiti et al., 2016). Fig. 5a, b indicated crude lattice structure for LCS and PTSS, respectively. The peak changes may be due to reactions that lead to molecular particle attachment. It could be formation of magnesium compound which dissolved into the solution of the treated wastewater. If material studied indicates well defined peaks, it is said to be crystalline, whereas non-crystalline or amorphous material displays halos or humps(Zhao et al., 2017).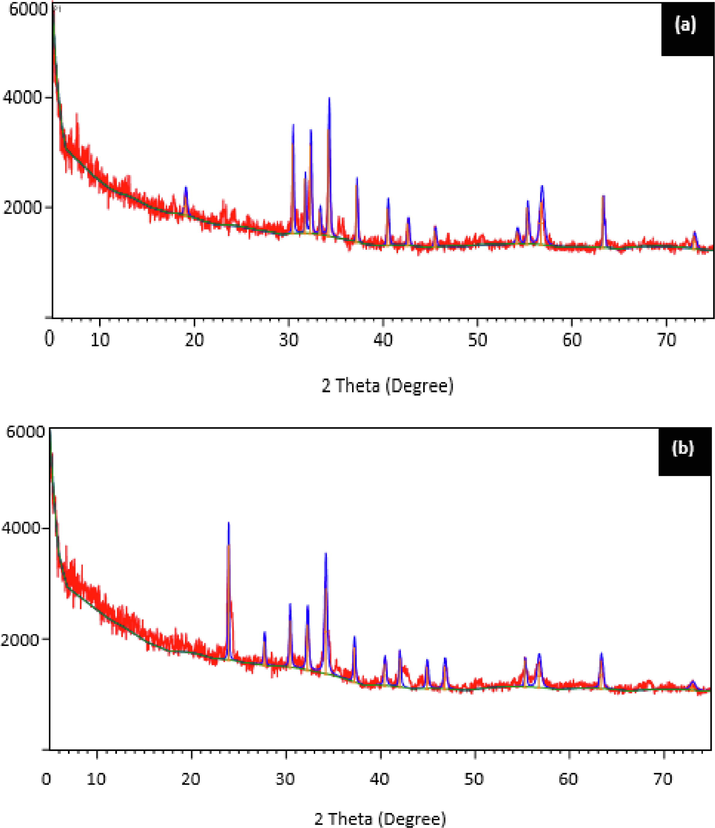
The XRD spectra of (a) LCS (b) post treatment settled sludge (PTSS).
3.2 Process factors influence
3.2.1 Effect of LCS on CTSS, COD and chromium (VI) removal
Fig. 6 shows the effect of varying dosages of LCS between 1.0 and 1.8gL-1 for the efficiency of CTSS, COD and Cr (VI) removal at varying pH after 300 min settling. Fig. 6a clearly showed better coagulant performance in removing CTSS at acidic medium, especially pH 2, recording>94% between 1.0 and 1.6gL-1. The optimum dosage, however, which provided 98.4% CTSS removal was 1.2gL-1 at pH 2. The high efficiency of removal of CTSS could be attributed to the strong interaction between LCS and wastewater molecules that led to the destabilization/neutralization of the negatively charged CTSS particles in dye-based wastewater (Okolo et al., 2016). The lower efficiency of removal recorded at other pH, in particular, pH 4 to 8 could be linked to reversal of the charges on particles resulting in re-stabilization and a decline in CF. LCS was believed to have functional groups which serve as an active site for CTSS attachment(Ani et al., 2012). Fig. 6b shows the COD removal efficiency at varying pH and biomass dosage after 300 min of settling. Fig. 6b clearly highlighted better biomass performance at pH 2, which recorded between 86.53 and 88% for all dosages. This can be due to a reduction of the wastewater organic portion (CTSS) prior to the COD test. Acidic medium performance is compatible with other literatures, as it favors the oxidation reaction that resulted in the removal of organic wastewater components (Jorfi et al., 2018). The optimum dosage of 1.4gL-1 at pH 2 gives the best COD removal efficiency of 88%. Fig. 6c shows the effect of varying dosage of coagulant between 1.0 and 1.8gL-1 and pH between 2 and 10 for removal efficiency of chromium (VI) after 300 min settling time. Fig. 6c shows a different impact on coagulant efficiency when removing chromium (VI) from dye-based wastewater compared with CTSS and removal of COD. The figure indicated better output at an aqueous pH 6–10 for all dosages applied. As the dosage increases, the removal of chromium (VI) increased, but undeniably the lowest was reported at pH 2. The best coagulant performance for removal of chromium (VI) was reported at pH 6 with 1.8gL-1 providing a removal efficiency of 97.5%. The active attachment site established in LCS could be attributed to this performance.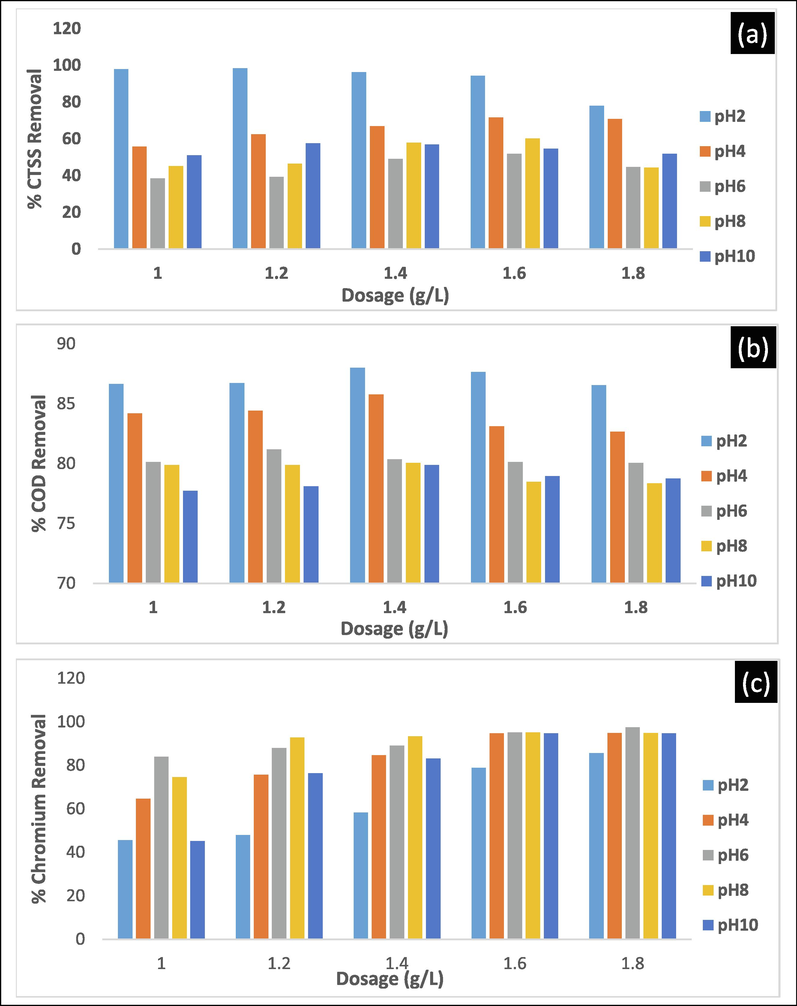
The plot of dosage and pH effect on the removal efficiency of CTSS(a), COD(b) and Cr (VI)(c) after 300 min settling time.
3.2.2 Effect of settling time on CTSS removal using LCS
The effect of settling time on removing CTSS using LCS was assessed at varying wastewater pH and dosage of 2 – 10 and 1.0 – 1.8gL-1, respectively, in the range 5 – 300mins. Fig. 7a showed the effects of assessing the efficiency of removal of CTSS at constant optimum pH of 2 and varying dosages ranging from 1.0 to 1.8gL-1. The efficiency of removal of the CTSS improved with increased settling time. Throughout the indicated time, the first three dosages (1.0, 1.2, 1.4gL-1) maintained a steady increase in CTSS removal. The dosage of 1.2gL-1 with removal efficiency>87% after 30mins of settling and reported 98.4% removal at the end of 300mins was considered to be optimal dosage. The results of the assessment of CTSS removal at the constant optimum dosage of 1.2gL-1 and the varying aqueous solution pH range 2–10 were shown in Fig. 7b. The superiority of the pH value was clearly observed in the CF process. In this investigation the bio-coagulant better performance recorded at acidic pH (especially pH 2) was evident as indicated in Fig. 7b. The figure showed that fair removal efficiency was observed at an alkaline pH of 10 as settling time increased. This is consistent with the literature available (Patrick et al., 2015; Onukwuli et al., 2021).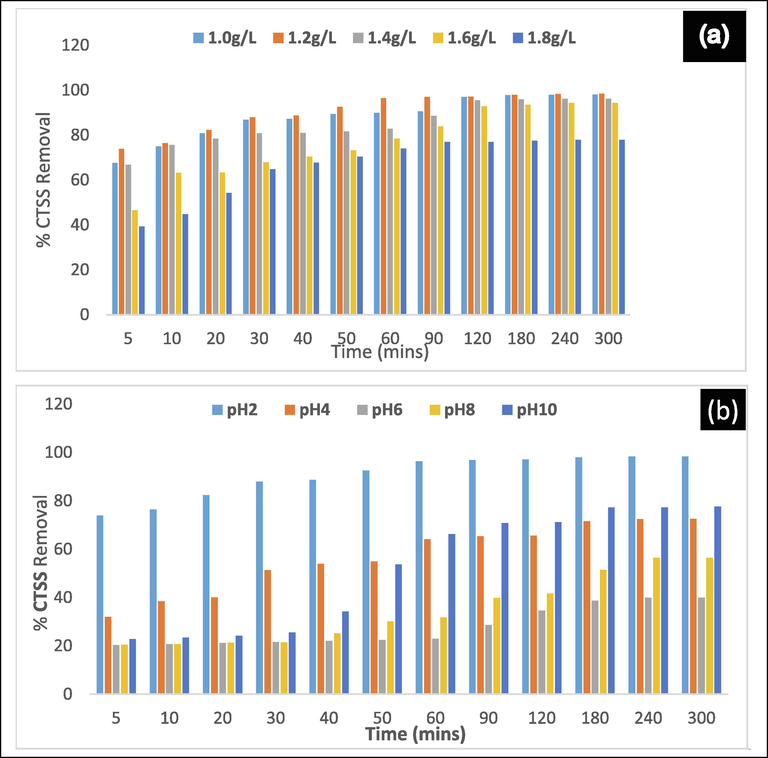
The plot of settling time effect on the removal efficiency of CTSS at constant pH and varying dosage (a), constant dosage and varying pH (b).
3.3 Process kinetics
The kinetics of the coagulation-flocculation efficiency of LCS on decontamination of dye-based wastewater using MATLAB 2015b software curve fitting tools have been studied. The kinetic results were obtained at pH 2, with 1.4gL-1 of bio-coagulant and an initial dye concentration of 1.0gL-1 in the wastewater. The constant of CF rate, K11, of 9.644E-4(L/g.s) , KR 4.822E-4(L/g.s), 1.1(mins), R2 0.9655, adjR2 0.9612, SSE 4.542E-4 and RMSE 7.535E-3 were obtained from the graph of , against time based on Eq. (4) and the coagulation time, , obtained using Eq. (7). K11 is a critical parameter that indicates the CF process output speed and accounts for instant aggregation and subsequent settling. Due to the negligible change in the temperature and viscosity of the dye-based wastewater during the process, KR, calculated from Eq. (6), showed minimal variance from K11. This matches previous literatures (Okolo et al., 2016). Using statistical parameters, the goodness of fit and adequacy of the experimental data to the primary model as expressed in Eq. (4) was assessed. The R2 and adjR2 values are relatively high, and are close to unity. This means the fit to the experimental data is in good agreement. The findings fit previous works (Patrick et al., 2015; Okolo et al., 2016). The SSE and RMSE are very minimal, suggesting minimum fit error and variance from the experimental results, so the fit may be helpful for forecasting.
3.4 Coagulation- adsorption results
To determine the CF adsorption effectiveness of LCS in the CF process, the data obtained from the jar test experiment was used to model the isotherm using Langmuir, Freundlich, and Temkin models, as well as adsorption kinetics using Lagergren pseudo first order and Ho's pseudo second order models for color removal at optimum pH 2.
3.4.1 Adsorption isotherm
Summaries of isotherm parameters, R2 and adjR2, SSE and RMSE, were shown in Table 3. The maximum monolayer adsorption capacity (qm) of dye-based wastewater was found to be 533.0gg−1 by Langmuir, while R2 was 0.8040. RL > 0 but<1 is an indicator of favorable dye mixture adsorption on LCS. The value of Freundlich's KF parameter is 1271.6gg−1(g−1)1 / n. The value of n is 4.819. n > 1 showed a favorable and heterogeneous adsorption value. Also, 4.558e-4 and 148.7 were found to be the values of the Tempkin parameters A and B. The experimental data of these isotherms summarized in Tables 3, shows that compared to the Langmuir and Tempkin models, the Freundlich model provided a better fit with the highest R2 value. The SSE and RMSE, were also found to be relatively small.
Model/
Parametersqm
KL
R2
Adj. R2
SSE
RMSE
RL
Langmuir Isotherm
533.0
0.1229
0.8040
0.7387
8.527e-8
0.000169
0.8906
Freundlich Isotherm
Kr
N
R2
Adj. R2
SSE
RMSE
1271.6
4.8190
0.9116
0.8821
0.03473
0.1076
Temkin
Isotherm
A
B
R2
Adj. R2
SSE
RMSE
4.558e-4
148.7
0.7576
0.6768
3.072e + 4
101.20
3.4.2 Adsorption kinetic results
Coagulation-flocculation data were applied to the Lagergren's pseudo first and Ho's pseudo second order kinetic models for the adsorption of dye-based wastewater onto biomass and analyzed. The model plots of the adsorption kinetic have been presented, see Fig. 8. Lagergren adsorption constant, K1 of 0.02439 min−1, adsorption capacity at equilibrium, qe.cal 140gg−1, R2 0.9449, adjR2 0.9394, SSE 0.6693 and RMSE 0.2587 were obtained from the log plot (qe-qt) against t and the fit tables using linear polynomial in the MATLAB setting, while the qe.exp, was 712.1gg−1. The adsorption capacity determined from the fit data at equilibrium, qe cal, was found not to be similar to the experimental adsorption capacity, qe exp. The R2 and adjR2 were found to be > 0.9, while the SSE and RMSE were moderately low.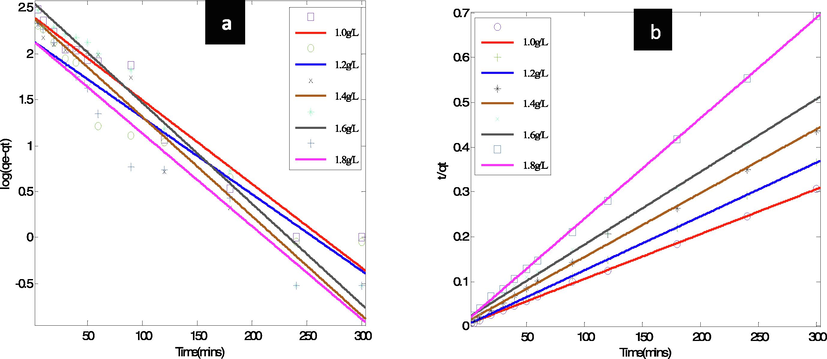
Adsorption kinetic model plots (a) Lagergren's pseudo first, (b) Ho's pseudo second order.
Likewise, the pseudo second order model of Ho fitted in Fig. 8b and based on Eq. (14) revealed K2 1.404e-1 min−1, qe cal 821.7gg−1, R2 0.9771, adjR2 0.9748, SSE 0.003557 and RMSE 0.01886 were obtained from the t/qt versus t plot and the fit table of the linear polynomial of MATLAB curve fitting tools. The experimental adsorption capacity, qe exp, was 712.1gg−1. From the results, the equilibrium adsorption capacity, qe cal, calculated from the fit data, was found to be relatively close to the experimental qe. It was found that the R2 and modified R2 were > 0.9, while the SSE and RMSE were very low. The kinetic data showed that when compared to the first order model, Ho 's second order model was best suited due to high R2 and its agreement with the experimental values. This is a strong indication that the second order kinetics model was followed by the method. Moreover, relative to the first order model, the SSE and RMSE for the second order were very low. The above confirmed that chemisorption, which involves valence forces through electron sharing or exchange, is the rate limiting step.
3.5 Coag-flocculation diffusion (mass transfer) modeling - numerical results
The partial differential equation (model) solution describing the mass transfer rate was resolved using a computational technique (finite differential method). The solutions obtained were programmed and implemented in the MATLAB environment generating various CF profiles. The profiles of CF at different spatial locations are shown in Fig. 9a, while, Fig. 9b demonstrated the correlation at an optimal pH 2.0 and 1.4gL-1 between experimental and projected results. As observed in the experimental results, the figure clearly shows the exponential decay pattern, indicating the rate of decrease in dye concentration as the process duration advances. The decrease in dye concentration at the point U (1:301:1) could be attributed to instrumental or human error. The fifth profile of a virtual distribution of particles in Fig. 9a, the experimental results that were obtained and reported in Fig. 9b were similar. These confirm that the model has been adequate for predicting the response variables in the experimental values. This also means that the model is almost in complete harmony with the experimental model, so the model is a critical instrument for the design of the bio-CF system.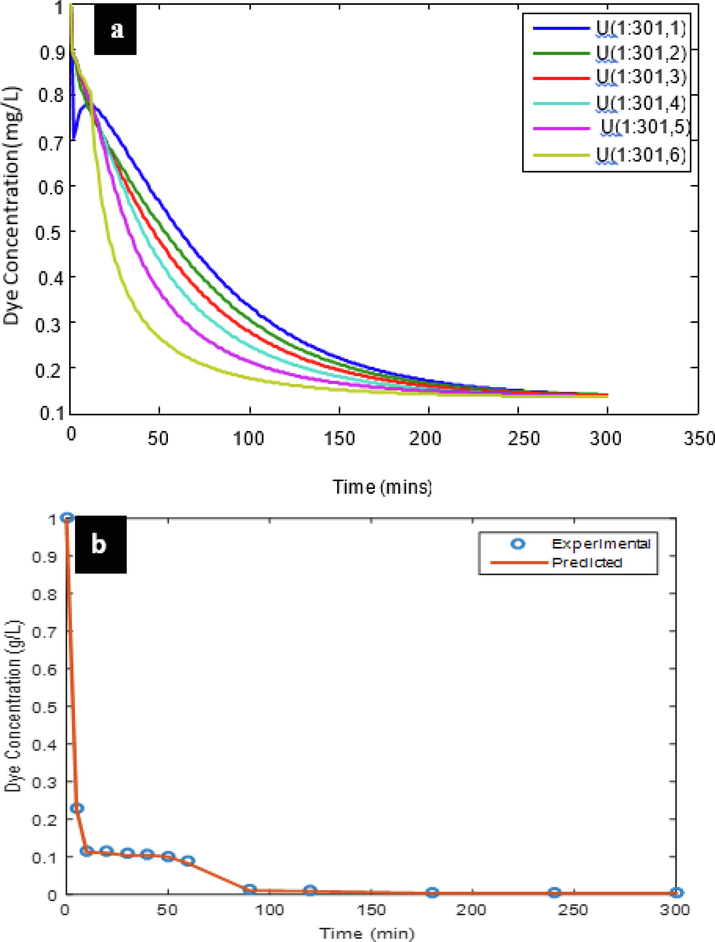
Dye concentration distribution simulation at varying spatial position (a), simulated and experimental dye concentration over time (b) at pH2 and 1.4gL-1.
R2, MAD, MSE, RMSE and MAPE were used to further validate the adequacy of the forecast. The findings showed R2 > 0.99 at the optimum dose of 1.4gL-1 and pH 2, implying a positive correlation. It was also noted that MAPE 7.50 value were<10%, showing good model experimental data prediction, and the lower the number, the better the predictive purpose of the model(Jimoda et al., 2013). A close look at the values revealed by MAD, MSE and RMSE; 0.0024, 7.392e-5 and 8.60e-3, respectively, are very small, which is a strong model prediction indicator.
3.6 Response surface fitting by Box-Behnken design (BBD)
Three variables, LCS dosage (X1), solution pH (X2) and stirring time (X3), were correlated with the three responses, Y1 for CTSS removal (%), Y2 for COD removal (%) and Y3 for Cr (VI) removal (%), using a quadratic polynomial equation as provided in Eq. (46). The second order regression models were shown in Eqs. (47) - (49), obtained from the experimental results.
Where, respectively, X1, X2 and X3 were LCS dosage, solution pH and stirring time. The effect of a single variable is defined by the coefficient of one factor, while the interaction between the two variables and the quadratic effect is defined by the coefficient of two factors and those with a second order term. A positive sign before the words indicates a synergistic effect, while a negative sign indicates an antagonistic effect (Kim, 2016). Following the elimination, as shown in Table 4, of non-significant terms, Eqs. (50) - (52) imaged.
Response
Source
SS
DF
MS
F-value
Prob > F
Remark
Y1(CTSS) %
Model
17591.0
9
1954.6
3.78
0.0467
Suggested
Linear
X1
210.01
1
210.01
4.60
0.0464
X2
10231.7
1
10231.6
19.78
0.0030
X3
396.21
1
396.21
0.77
0.4105
Pure quadratic
X12
3325.27
1
3325.27
6.43
0.0389
X22
3224.28
1
3224.28
6.23
0.0412
X32
14.84
1
14.84
0.029
0.8703
Interaction
X1 X2
123.04
1
123.04
3.045
0.0838
X1 X3
370.56
1
370.56
2.72
0.0425
X2 X3
22.09
1
22.09
0.043
0.8422
Residual
3620.41
7
517.20
Lack of fit
1150.18
3
383.39
1.62
0.1377
Not significant
Pure error
2470.23
4
617.56
Cor. Total
21211.4
16
Y2(COD) %
Model
188.06
9
20.90
17.60
0.0005
Suggested
Linear
X1
0.30
1
0.30
11.18
0.03107
X2
112.65
1
112.65
87.5
<0.0001
X3
0.042
1
0.042
0.18
0.9412
Pure quadratic
X12
2.62
1
2.62
0.89
0.3758
X22
0.14
1
0.14
58.57
0.0001
X32
5.52
1
5.52
0.52
0.4951
Interaction
X1 X2
0.15
1
0.15
12.61
0.0096
X1 X3
60.93
1
60.93
5.42
0.0961
X2 X3
3.99
1
3.99
0.75
0.9550
Residual
1.67
7
0.24
Lack of fit
1.10
3
0.37
5.60
0.2897
Not significant
Pure error
0.57
4
0.14
Cor. Total
189.73
16
Y3(Cr (VI)) %
Model
6071.81
9
674.65
118.56
<0.0001
Suggested
Linear
X1
28.58
1
28.58
5.02
0.0600
X2
77.00
1
77.00
13.53
0.0079
X3
39.16
1
39.16
6.88
0.0342
Pure quadratic
X12
728.54
1
728.54
128.03
<0.0001
X22
5150.82
1
5150.82
905.17
<0.0001
X32
189.52
1
189.52
33.30
0.0007
Interaction
X1 X2
0.12
1
0.12
0.020
0.8907
X1 X3
37.21
1
37.21
6.54
0.0377
X2 X3
70.56
1
70.56
12.40
0.0097
Residual
39.83
7
5.69
Lack of fit
31.57
3
10.52
5.10
0.0748
Not significant
Pure error
8.26
4
2.06
Cor. Total
6111.64
16
3.6.1 Model adequacy
To assess the adequacy of the models, model overview statistics and ANOVA were used. While the ANOVA was presented in Table 4, the model overview statistics revealed R2 0.8293 and adjR2 0.6099, R2 0.9584 and adjR2 0.9050, and R2 0.9935, adjR2 0.9851, for CTSS, COD and Cr (VI) removal responses, respectively. The p-value for CTSS removal from the ANOVA table was 0.0467, while that of COD and Cr (VI) removal were < 0.01 for the model chosen. For CTSS, COD and Cr (VI) removal, the model summary statistics showing R2, of 0.8293, 0.9584 and 0.9935, respectively, suggested that the empirical model could not explain only 17.07%, 4.16% and 0.65% of the variance. The high R2 values suggested that the model was well suited to the response (Okolo et al., 2018). It can also be seen from the findings that the experiment indicates a desirable and rational alignment with the R2 's proximity to the adjR2. This closeness ensures that the quadratic models are satisfactorily adapted to the experimental data (Okolo et al., 2018).
The second order regression for the efficiency of CTSS, COD and Cr (VI) removal indicate that the models were significant because the f-values of 3.78, 17.6 and 118.56, respectively, were high. Similarly, for quadratic regression models, the p-value that gives an indicator of the importance of a model in relation to the f-value was<0.05. For a 95% confidence level, this showed that the models were statistically significant, indicating only a 5% risk that the f-value was due to noise. The model is not significant if the p-value is above 0.1(Okolo et al., 2018).
3.6.2 Process analysis
Table 4 also, explains the linear (X1, X2, X3), quadratic (X12, X22, X32) and interaction (X1X2, X2X3, X1X3) effects of the parameters. From the table, the response, Y1, revealed that X1, X2, X12, X22, and X2X3 are significant terms with p < 0.05, while X3, X32, X2X3 and X1X3 are not significant terms. Similarly, Y2 response have significant terms of X1, X2, X22, X1X2, while X3, X12, X32, X1X3, X2X3 are not significant. Also, from the table, the response, Y3, shows that X2, X3, X1X3, X2X3, X12, X22 and X32 are all significant terms. Only X1 and X1X2 are not significant. The lack of fit f-values of 1.62, 5.60 and 5.10 for Y1, Y2 and Y3, respectively, imply that the lack of fit is not significant relative to the pure error. There are only 13.770%, 28.97% and 7.48% for Y1, Y2 and Y3, respectively, chance that the lack of fit f-values this large could occur due to noise. Non-significant lack of fit is good, the model needs to fit.
3.6.3 Effect of variables on CTSS, Cr (VI) and COD removal efficiency
The 3-D response surface plots in Fig. 10 showed the individual and combined effect of LCS dosage, solution pH and stirring time on the percent CTSS, COD and Cr (VI) removal based on a total of 17 BB-design of the three variables. The surface graph which is a representative of the model used to visualize the relationship between the response and the experimental data showed curvilinear profiles and significant curvatures. The distinct curves for the relationship between pH and dosage, pH and stirring time, dosage and stirring time variables, clearly depict their interactions in the process This is consistent with the quadratic model and an indication that the independent variables have strong interactions(Imen et al., 2013). Optimum condition at 1.4gL-1 dosage, pH 2 and 30mins stirring were indicated by the response surface plots, giving 99.20% CTSS removal, with 1.4gL-1 dosage, pH 2 at 30mins stirring, giving 90.07% COD removal and at 1.8 g/L dosage, pH6 and 15mins giving 98.29% Cr (VI) removal, respectively.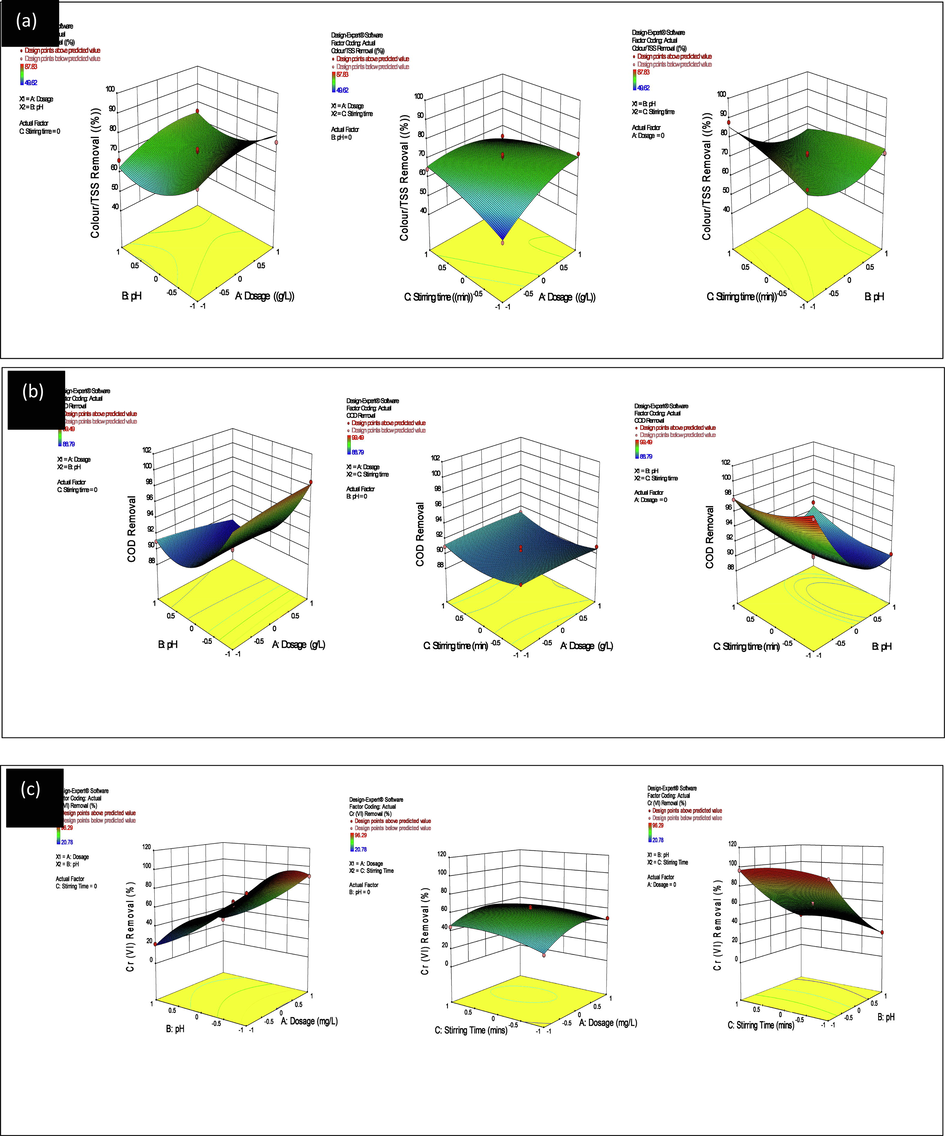
3-D response surface plots for CTSS (a), COD (b) and Cr (VI) (c) removal efficiency.
3.6.4 Validation of the optimized parameters of the coagulation process based on RSM
The optimized results were validated experimentally by carryout triplicate experiment and the average treatment efficiencies obtained are shown in Table 5. It can be shown in Table 5 that the optimum experimental validated % removal efficiency of CTSS, COD and Cr (VI) are close to the model predicted values at the same optimum conditions.
Variables
Dosage (g/L)
pH
Time (mins)
BBD Optimized Results (%)
Experimental Validated result (%)
CTSS
1.4
2
30
99.20
98.9
COD
1.4
2
30
90.07
89.6
Cr (VI)
1.8
2
30
98.29
96.8
4 Conclusion
In this research, coag-flocculation method was used to evaluate the efficiency of LCS as an effective biomass for the decontamination of dye-based wastewater at the condition of the analysis. LCS features suggested coagulant with sufficiently active site to be used as a bio-coagulant. The composition of the sludge obtained suggests that it may be a resource for wastewater-absorbed materials. The coag-flocculation system using LCS efficiently extracted 99.2% CTSS at wastewater pH 2 with 1400mgL-1; 90.07% of COD with 1400mgL-1 and wastewater pH 2 and 98.29% of chromium (VI) with 1800mgL-1 and wastewater pH 6. In addition, the study revealed that LCS dosage and wastewater pH had a major influence on the results. The kinetic, mass transfer, optimization and CF adsorptive parameters were also obtained. The indicators of error were very minimal. The kinetic and mass transfer simulation results predicted were in agreement with the experimental results. Therefore, the use of LCS has adequately demonstrated the potential of a bio-coagulant alternative in the treatment of dye-based wastewater. The kinetic, mass transfer, optimization and CF adsorptive data obtained could be useful for design, start-up operating time, design control and optimization of the process of bio-coagulation.
Acknowledgement
P.C. Nnaji and I.G. Ezemagu are grateful to Department of Chemical Engineering, Michael Okpara University, Umudike and Department of Chemical Engineering, Nnamdi Azikiwe University, Nigeria. V.C. Anadebe is grateful to CSIR, India and TWAS Italy for the Postgraduate Fellowship (Award No. 22/FF/CSIR-TWAS/2019) to purse research programme in CSIR-CECRI, India. In addition, Alex Ekwueme Federal University Ndufu-Alike Ebonyi State, Nigeria, is acknowledged for the Research Leave to visit CECRI, India
Declaration of Competing Interest
The authors declare that they have no known competing financial interests or personal relationships that could have appeared to influence the work reported in this paper.
References
- Competitive adsorption of Cu2+ and Ni2+ on Luffa acutangula modified Tetraethoxysilane (LAP-TS) from the aqueous solution: Thermodynamic and isotherm studies. Groundwater Sustainable Dev.. 2015;1(1–2):146-154.
- [Google Scholar]
- Journal of Photochemistry and Photobiology A : Chemistry Photoperoxi-coagulation using activated carbon fi ber cathode as an ef fi cient method for benzotriazole removal from aqueous solutions : Modeling, optimization and mechanism. J. Photochemistry Photobiology, A: Chem.. 2016;322–323:85-94.
- [Google Scholar]
- Ultrasonic aided sorption of oil from oil-in-water emulsion onto oleophilic natural organic-silver nanocomposite. Chem. Eng. Res. Des.. 2021;165:12-24.
- [Google Scholar]
- Development of Spirulina/chitosan foam adsorbent for phenol adsorption. J. Mol. Liq.. 2020;309:113256
- [Google Scholar]
- Environmental applications of Luffa cylindrica-based adsorbents. J. Mol. Liq.. 2020;319:114127
- [Google Scholar]
- Nephelometric and functional parameters response of coagulation for the purification of industrial wastewater using Detarium microcarpum. J. Hazard. Mater.. 2012;243:59-66.
- [Google Scholar]
- Official Methods of Analysis (16th Edition). Gaitherburg: Association of Official Analytical Chemist; 2005.
- AWWA, APHA, WEF, 2012. Standard Method for the Examination of Water and Wastewater, 22ndEdition, New York.
- Fixed-bed column performance of methylene blue biosorption by Luffa cylindrica: statistical and mathematical modeling. Chem. Eng. Commun.. 2018;205(11):1537-1554.
- [Google Scholar]
- Comparison of Moringa stenopetala seed extract as a clean coagulant with Alum and Moringa stenopetala-Alum hybrid coagulant to remove direct dye from Textile Wastewater. Environ. Sci. Pollut. Res.. 2016;23(16):16396-16405.
- [Google Scholar]
- de Souza, M. T. F., de Almeida, C. A., Ambrosio, E., Santos, L. B., Freitas, T. K. F. de S., Manholer, D. D., … Garcia, J. C. (2016). Extraction and use of Cereus peruvianus cactus mucilage in the treatment of textile effluents. J. Taiwan Inst. Chem. Eng., 67, 174–183.
- RSM and ANN-GA modeling of colloidal particles removal from paint wastewater via coagulation method using modified Aguleri montmorillonite clay. Current Res. Green Sustainable Chem.. 2021;4:100164
- [Google Scholar]
- Integrated Treatment of Paint Wastewater Using Helix Pometia Shell Coagulant and Sludge Conversion to Biogas: Process Thermodynamics and Biogas Energy Content. Int. J. Plant, Animal Environ. Sci.. 2021;11(03):391-422.
- [Google Scholar]
- Modeling and optimization of turbidity removal from produced water using response surface methodology and artificial neural network. S. Afr. J. Chem. Eng.. 2021;35:78-88.
- [Google Scholar]
- Instrumental and thermal characterization of the sludge generated after bio-coagulation treatment (GSABT) of petroleum produced water (PW) Results Eng.. 2021;9:100187
- [Google Scholar]
- Biofertilizer production via composting of digestate obtained from anaerobic digestion of post biocoagulation sludge blended with saw dust: Physiochemical characterization and kinetic study. Environ. Challenges. 2021;5:100288
- [Google Scholar]
- Turbidimetric study for the decontamination of paint effluent (PE) using mucuna seed coagulant (MSC): Statistical design and coag-flocculation modelling Turbidimetric study for the decontamination of paint effluent (PE) using mucuna seed coagulant. Environ. Adv.. 2020;2:100023
- [Google Scholar]
- Adsorptive approach on nepholometric study of paint effluent using Tympanotonos fuscatus extract. Bull. Chem. Soc. Ethiop.. 2016;30(3):377-390.
- [Google Scholar]
- Optimization of dye adsorption process for Albizia lebbeck pods as a biomass using central composite rotatable design model. Chem. Industry Chem. Eng. Quarterly. 2019;25(1):39-46.
- [Google Scholar]
- Principles of Water Treatment. John Wiley and Sons Inc.; 2012. p. :139-142.
- Imen, F., Lamia, K., Asma, T., Neacute ji, G., & Radhouane, G. (2013). Optimization of coagulation-flocculation process for printing ink industrial wastewater treatment using response surface methodology. African J. Biotechnol., 12(30), 4819–4826.
- The removal of COD, TSS and colour of black liquor by coagulation – flocculation process at optimized pH, settling and dosing rate. Arabian J. Chem.. 2017;10:S2307-S2318.
- [Google Scholar]
- Assessment of feasibility of natural coagulants in turbidity removal and modeling of coagulation process. Desalin. Water Treat.. 2014;52(31–33):5812-5821.
- [Google Scholar]
- Enhanced degradation of reactive dyes using a novel carbon ceramic electrode based on copper nanoparticles and multiwall carbon nanotubes. Chin. J. Chem. Eng.. 2020;28(1):318-327.
- [Google Scholar]
- Platanus orientalis leaves based hierarchical porous carbon microspheres as high efficiency adsorbents for organic dyes removal. Chin. J. Chem. Eng.. 2020;28(1):254-265.
- [Google Scholar]
- Modelling of Mass Transfer Rate During Biocoagulation-Flocculation of Coal-Rich Wastewater. J. Sci. Res. Rep.. 2013;2(1):376-390.
- [Google Scholar]
- COD removal from high salinity petrochemical wastewater using Photo-assisted peroxi-coagulation. Chem. Biochem. Eng. Q.. 2018;32(2):229-238.
- [Google Scholar]
- Application of ANN and RSM on fluoride removal using chemically activated D. sissoo sawdust. Environ. Sci. Pollut. Res.. 2020;27(15):17717-17729.
- [Google Scholar]
- Application of response surface method as an experimental design to optimize coagulation-flocculation process for pre-treating paper wastewater. J. Ind. Eng. Chem.. 2016;38:93-102.
- [Google Scholar]
- Investigation on removing recalcitrant toxic organic polluters in coking wastewater by forward osmosis. Chin. J. Chem. Eng.. 2020;28(1):122-135.
- [Google Scholar]
- Process Optimization and Kinetics of Biolubricant Synthesis From Fluted Pumpkin Seed. European Sci. J.. 2015;11(27):30-47.
- [Google Scholar]
- Adsorptive study of coagulation treatment of paint wastewater using novel Brachystegia eurycoma extract. Appl. Water Sci.. 2018;8(6):1-15.
- [Google Scholar]
- Perikinetics and sludge study for the decontamination of petroleum produced water (PW) using novel mucuna seed extract Collision factor for Brownian transport. Pet. Sci.. 2016;13(2):328-339.
- [Google Scholar]
- Focus on adsorptive equilibrium, kinetics and thermodynamic components of petroleum produced water biocoagulation using novel Tympanotonos Fuscatus extract. Petroleum. 2018;4(1):56-64.
- [Google Scholar]
- Single and multi angle nephelometric approach to the study of coag-flocculation of coal effluent medium using Brachystegia eurycoma coagulant (BEC). 2011;8(1):61-76.
- Sludge characterization and treatment of produced water(PW) using Tympanotonos Fuscatus coagulant (TFC) Petroleum. 2015;1(1):51-62.
- [Google Scholar]
- How to read and interpret ftir spectroscope of organic material. Indonesian J. Sci. Technology. 2019;4(1):97-118.
- [Google Scholar]
- Application of experimental design methodology to optimize dye removal by mucuna sloanei induced coagulation of dye-based wastewater. Desalin. Water Treat.. 2020;198:396-406.
- [Google Scholar]
- Nephelometric Performance Evaluation of Oxidized Starch in the Treatment of Coal Washery Effluent. Natural Resources. 2014;05(03):79-89.
- [Google Scholar]
- Luffa cylindrica seed: Biomass for wastewater treament, sludge generation study at optimum conditions. Chem. Industry Chem. Eng. Quarterly. 2020;26(4):349-358.
- [Google Scholar]
- Efficiency evaluation of Luffa cylindrica and Mucuna sloanei seeds in dye removal : A news approach. Int. Sci. J.. 2020;146(June):184-201.
- [Google Scholar]
- Optimizing bio-coagulants for brewery wastewater treatment using response surface methodology. Nigerian J. Technology. 2018;36(4):1104.
- [Google Scholar]
- Nephelometric approach to study coagulation-flocculation of brewery effluent medium using Detarium microcarpum seed powder by response surface methodology. J. Environ. Chem. Eng.. 2016;4:992-1001.
- [Google Scholar]
- Dual-purpose optimization of dye-polluted wastewater decontamination using bio-coagulants from multiple processing techniques via neural intelligence algorithm and response surface methodology. J. Taiwan Inst. Chem. Eng.. 2021;125:372-386.
- [Google Scholar]
- Kinetics and Particle Removal Profile of Pulverized Snail Shell – Alum Induced Coag-Flocculation of Quarry Effluent. British J. Appl. Sci. Technol.. 2015;5(6):621-632.
- [Google Scholar]
- Analysis of Garcinia indica Choisy extract as eco-friendly corrosion inhibitor for aluminum in phosphoric acid using the design of experiment. Integrative Medicine Res.. 2020;9(3):3622-3631.
- [Google Scholar]
- Stroud, 1987. Engineering Mathematics, Programme and Problem. Macmillan Education Ltd, 448.
- Shahidi, A., Jalilnejad, N., & Jalilnejad, E. (n.d.). A study on adsorption of cadmium (II) ions from aqueous solution using Luffa cylindrica. Desalination and Water Treatment, (May 2015), 37–41.
- Biomass-derived porous carbon highly efficient for removal of Pb(II) and Cd(II) Green Energy Environ.. 2019;4(4):414-423.
- [Google Scholar]
- Adsorption of light green anionic dye using cationic surfactant-modified peanut husk in batch mode. Arabian J. Chem.. 2017;10:S3595-S3602.
- [Google Scholar]


