

Translate this page into:
Preconcentration of trace nickel lons from aqueous solutions by using a new and low cost chelating polystyrene adsorbent
⁎Corresponding author. alialwesabi99@gmail.com (Ali Saad Alwesabi)
-
Received: ,
Accepted: ,
This article was originally published by Elsevier and was migrated to Scientific Scholar after the change of Publisher.
Peer review under responsibility of King Saud University.
Abstract
A simple and reliable method has been developed using chelating polymeric adsorbent (PSAHSB) to preconcentration of trace amount of Ni(II) ions from aqueous solutions under static loading conditions, and their determination by Ultraviolet and visible (UV–Vis) absorption spectroscopy. The influences of some analytical adsorption parameters, such as pH, temperature and contact time, the ionization constants of chelating groups in the adsorbent and desorption process were investigated. Maximum adsorption ≥98% was achieved at pH 3–7 after 20 min of contact time and the relative standard-deviation values were ≤5%. Adsorbed metal ions have been desorbed with 10 mL of 2 M HCl acid with the detection limit of 0.0157 μg m−1. The Langmuir and Freundlich isotherm equations were used to describe adsorption behavior of the system at different temperatures. Kinetic and thermodynamic behavior of the adsorbent for Ni(II) ion preconcentration was also studied. The possible adsorption mechanism of Ni (II) ions onto modified adsorbent is also discussed. This method was applied efficiently to remove Ni (II) ions from environmental water samples.
Keywords
Polystyrene
Chelating groups
Preconcentration
Ionization constants
Adsorption and desorption
Kinetics
Thermodynamics

1 Introduction
The detection of toxic metal ions in aquatic ecosystems is an important global issue because these contaminants have harmful effects on plants, animals, humans and ecosystems (Abu-Ali et al., 2019). Nickel, Ni(II) is among the most toxic metallic water pollutants in aquatic environments (Abu-Ali, 2017). It is the most common metals causing skin contact allergy, affecting about 10–20% of the general population (Chen and Thyssen, 2018). According to the WHO guidelines, the maximum permissible concentration of nickel in industrial wastewaters is 4.1 mg/L, while that in drinking water should be less than 0.1 mg/l (Gupta and Kumar, 2019). It is, therefore, essential to reduce or remove Ni(II)ions from industrial wastewaters before discharging them into the environment.
The detection of heavy metals with low concentrations is a difficult task. However, it can be achieved with existing advanced analytical methods, such as high-performance liquid chromatography (HPLC), inductively coupled plasma mass spectroscopy (ICP-MS), atomic emission or atomic absorption spectroscopies (AES, AAS), cold vapor atomic fluorescence spectroscopy (CVAFS), electro-deposition, chemical precipitation and ion exchange process (Saidur et al., 2017; Meena, 2008; Ramezankhani, 2008; Khellaf, 2009). These methods are extremely sensitive but very expensive, most of them require multi-step processing, sometimes ineffective particularly when the metal concentration is less than 100 µg/ml. They require specialized laboratory conditions and highly trained personnel (Ghasemi, 2012). An alternative approach uses chelating polymer adsorbents can be respected as the most common methods for the removal of hazard heavy metals from the aqueous solutions because of their lower costs, high removal efficiency, robustness and biodegradability, especially for metal ions at levels 10–0.001 ppm (Ramezankhani, 2008; Ghasemi, 2012; Zaira, 2011). The important characteristic of these adsorbents depends on the active chelating positions, which have the ability of chelating about metallic ions during complexation (Zhu et al., 2012; Abd El-Moniem et al., 2005; Monier et al., 2012; Atia et al., 2005). A new class of chelating polymer adsorbents was synthesized based on amino-polystyrene functionalized with chelating azo-2′-hydroxy benzene groups which are insoluble in water, acids, alkalis, and organic solvents (Basargin, 2007).
The main goal of this work is to investigate the removal of Ni (II) ions from model aqueous solutions by Polystyrene (4-azo-1′)-2′-hydroxy-5′-sulfobenzene adsorbent, which belongs to derivatives of polystyrene azo phenolic complexes, and the proposed method was successfully applied to real samples.
2 Experimental
2.1 Preparation of adsorbent
We applied PSAHSB adsorbent to adsorb trace amount of nickel ions from the model aqueous solutions. The chemical structure of adsorbent is illustrated in Fig. 1. The adsorbent was purchased from IGEM Laboratories, Russia. The adsorbent was synthesized according to procedures in (Basargin, 2005; Shyaa, 2012; Philippides, 1993). The synthesis included four successive stages: (i) nitration of polystyrene to polynitrostyrene; (ii) reduction of this product to polyaminopolystyrene; (iii) diazotization of the produced amino group; (iv) azo-coupling of the diazotized amino with a monomeric 4-hydroxybenzenesulfonic acid ligand. The adsorbent was insoluble in water, acids, alkalis, and organic solvents and do not swell. The absorbent was ground in an agate mortar and bolted through a a 200-mesh sieve (74 µm) (Shaaban, 2014).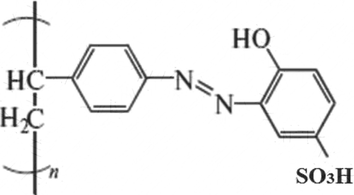
Chemical structure of the PSAHB-SO3H adsorbent.
2.2 Structure characterization
The PSAHSB adsorbent is characterized by; (i) Fourier transform infrared (FTIR) (Perkin Elmer Spectrum BX FT-IR, Shimadzu, Kyoto, Japan) in pressed KBr pellets (spectral resolution: 1 cm − 1; (ii) Atomic force microscopy (AFM) (Multimode NS3a, No. 3327, Milwaukee, USA); (iii) Potentiometric determination of the content of chelating groups and the dissociation constants of the adsorbent.
2.3 Adsorption experiments
The adsorption of Ni (II) ions on PSAHSB adsorbent was performed by static methods under ambient conditions; 25 mg of adsorbent was added into 25 mL of Ni (II) solutions (added as Ni (NO3)2·6H2O, Aldrich – Spain) in different initial concentrations with stirred at 300 rpm, then an adsorbate onto adsorbent was separated from the mixture by filtration using 0.45 μm filter paper. The pH was adjusted up to the desired value with 0.1 M HCl or 0.1MNaOH solutions by using a digital pH meter (781 pH/Ion, Metrohm, India). The adsorption isotherms, which indicate Ni (II) ions adsorption behavior, were investigated at temperatures 293.15, 313.15 and 333.15 K respectively. The residual concentration of ions in the filtrate Ce was determined by using a UV–Vis spectrophotometer (LI-295, Lasany, India) with H2Dm Dimethylglyoxime reagent (Sigma-Aldrich, Mumbai, India) as director at λ = 445 (Shpigun et al., 1986), and by helping the earlier constructed standard calibration curves. The equilibrium adsorption capacity qe (mg g−1) and degree of adsorption (R,%) were calculated according to the Eqs. (1) and (2) (Ajmal, 2000).
2.4 Adsorption kinetics
Two kinds of kinetic models were applied to investigate the kinetic mechanism of the adsorption process. The pseudo-first-order kinetics model is one of the most broadly used to describe the adsorption of metal ions from aqueous solutions (Lagergren, 1898; Khan, 2012; Din and Mirza, 2013). The linear form of pseudo-first-order equation was expressed by Eq. (3).
The other one is the pseudo-second-order model. The linearity of this model is given by Eq. (4) (Ho, 2006).
2.5 Desorption and recycle test
The study of desorption for the regeneration of the adsorbent is necessary to make the adsorption process more economical. Therefore, desorption of adsorbate from the adsorbent was carried out by washing it to a beaker with 10 mL of 1 to 4 M concentrations of HCl and HNO3 desorbing agents (Merck – Germany). Then, the system was mixed using a magnetic stirrer for 1 h. The degree of desorption of ions (D, %) from the adsorbent was determined with Eq. (5).
3 Results and discussions
3.1 Characterization of adsorbent
3.1.1 FTIR analysis before and after Ni complexation
The FTIR spectrum of PSAHSB adsorbent was shown in Fig. 2(a). FTIR spectrum of this adsorbent confirmed the presence of functional groups characteristic of the adsorbent. Hydroxyl group was identified by the broadband attributed to stretching vibrations of O—H bonds in the range 3600–3100 cm−1, the signals at 2925, 1600, 1450, 1110, 854, 700, cm−1 associated with 2-phenol-4-sulfonic acid moiety. The peak at 1519 cm−1 is assigned to the stretching vibrations of (—N⚌N—) bonds and the peak at 3060 cm−1 attributed to Ar—H, signal at 1350 cm−1 assigned to the stretching vibrations of C—OH in the structure of adsorbent (Mondal et al., 2002). The aliphatic structure is attributed to the vibrations of C—H bonds in the range 2940–2850 cm−1. The signal 710– 680 cm−1 is assigned to deformation vibrations of C—C groups in the benzene ring. Thus, the IR spectrum confirms the structure of the adsorbent presented in Fig. 1.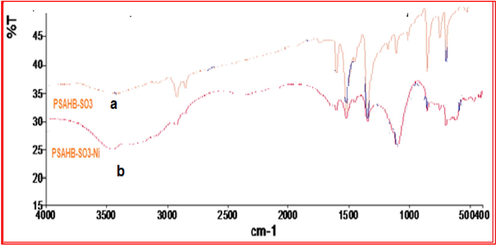
FT-IR spectra before (a) and after (b) adsorption of Ni (II) ions onto PSAHSB adsorbent.
The IR spectrum of the PSAHSB adsorbent and its complex with Ni (II) is shown in Fig. 2(b). In this study, a process is proposed based on the exchange of ions by the following active chelating groups: negatively charged of a phenolic oxygen atom with positively charged of Ni(II) ions. The groups are capable of bonding Ni(II) ions during the dissociation of H + cations (Wu and Li, 2013; Kolcu, 2019). It is clear from obtained FT-IR spectra after the adsorption, that the intensity of the relevant bands is changed (hypsochromic shift). The obtained signals in IR spectra show visibly that the maximal wavenumber of the signal —OH groups, is around 3435 cm−1, after adsorption of nickel ions, it is shifted to the 3385 cm−1. Similarly, the maximal wavenumber of signal N⚌N groups is around 1519 cm−1 before adsorption. After adsorption, it is shifted to the 1508 cm−1 (Wu and Li, 2013; Kolcu, 2019).
3.1.2 Surface morphology
Fig. 3(a) shows the scanning force microscopy SFM image of the initial surface of the adsorbent under study (Wang et al., 1998). There is an occasional horizontal interference. This interference indicates the presence of a small number of particles with low adhesion on the surface which are displaced by the probe at scanning. Fig. 3(b) clearly shows the globular structure of the surface of the adsorbent. The adsorbent was grains with a grain size in the range of 40–170 nm, a pore size in the range of 10–100 nm, pore volume 2.032 mL/g, and surface area 970 m2/g−1. This essentially led to the formation of mixed meso/macro-pores (Dutta et al., 2014).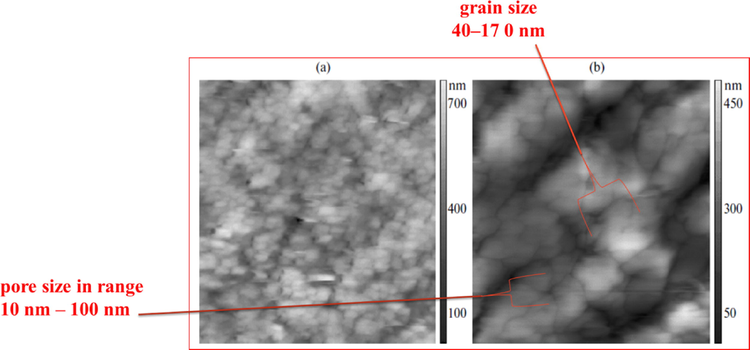
SFM image of a adsorbent surface in 2D (a) 725 × 725 pixels (b) 1200 × 1200 pixels.
3.1.3 Acidic properties of the adsorbent
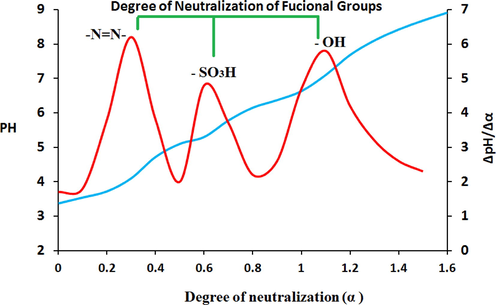
The determination of acidic dissociation constants of adsorbents plays a fundamental role in many analytical procedures such as: the examination of the physic-chemical properties of chelating adsorbents, stability and complex formation and the determination of the pH range in which active groups are ionized and capable of participating in reactions of ion exchange (Wang, 2008). The ionization constants of the adsorbent were determined by potentiometric titration following the standard procedure (Doshi, 2017; Orth, 2016; Basargin, 2006). Experiments were performed with the H+ form of the PSAHSH adsorbent and with total static capacity (SC) = 1.64 mmol g−1 (Experiment S1 and Table S1). The method is as follows:0.1 g portions of the adsorbent were placed in 40-mL bottles (10bottels), 20 mL of 1 M NaCl (to create the ionic strength μ = 1) was added to each bottle and bottles were left for 90 min. Then, different volumes of 0.02 M NaOH solutions were added to the bottles, so that the degree of neutralization of active acidic groups (α) of the adsorbent varied from 0 to SC value. At last, the mixtures were kept at 293.15 K for 24 h in a desiccator full of nitrogen to attain the ionic equilibrium of the replacement of the chelating group protons in the adsorbent by sodium cationsn in NaOH solution.
The potentiometric titration results (Table S2) were plotted as a differential titration curve in the coordinates ΔpH/Δ α–α (see Fig. 4). It can be noticed that the differential curve exhibits three jumping positions (inflection points), which can be attributed to the ionization of the betainic protons of the ionogenic groups: N⚌N—, —SO3H and —OH groups during the titration of adsorbent. These results unambiguously confirm the chemical structure of adsorbent in Fig. 1. The α values for each acidic group and their corresponding pH values (Table S3) were used for constructing pH vs. log α/(1 – α) dependences Fig. 5. The pKion can be determined either graphically by the plot in Fig. 5 or mathematically by using the Henderson–Hasselbalch equation (Eq. (6)) (Po and Senozan, 2001).
(a) Integral and (b) differential curves of potentiometric titration for adsorbent.
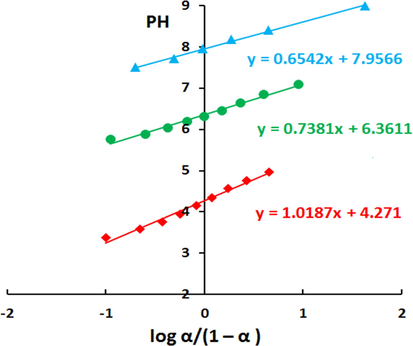
Determination of dissociation constants for PSAHSB by the graphical method.
The pKion values were tabulated in Table 1. It is clear that the pKion values are relatively strong. They lead to a higher affinity of Ni (II) ions towards the adsorbent, and that made the adsorption faster and form more stable complex.
Ionization stages of chelating groups
pKion (graphical)
pKion (calculated), n = 3
st/
n(±RSD %)
pKi1 of 1st IS of —N⚌N—
4.33
4.31 ± 0.12 (±2.83%)
pKi2 of 2nd IS of —SO3H
6.33
6.35 ± 0.04 (±0.61%)
pKi3 of 3th IS —OH
7.95
7.68 ± 0.03 (±0.32%)
3.2 Effect of pH and initial Ni (II) concentration
The pH of the nickel solution plays a major role in all adsorption process, especially on the adsorption capacity. The degree of adsorption is significantly affected by the surface charge on the adsorbent, which is highly dependent on the pH of the solution (Leyva-Ramos, 1989). The optimal pH for the ideal adsorption was determined experimentally from the plot of the adsorption degree (R %) vs pH in the range of 1 to 10. The Fig. 6 shows the effects of pH on the adsorption of Ni (II) ions onto PSAHSB adsorbent. The adsorption degree (R, %) was calculated to be ≥98% in the pH range of 3 to 7. The adsorption of trace amount of nickel ions increased sharply within the pH range of 1–3, then remained constant within the 3–7 pH range, but decreased sharply at pH large than 8, which demonstrated that the adsorption was strongly conditioned by the pH. At low pH, the R% was low also, due to the increase in the positive charges on active chelating sites of N⚌NH+, C—OH2+ in acidic form, leading up to electrostatic repulsion between the Ni 2+ ions and these active sites on the adsorbent surface. The increase in pH leads to decrease in electrostatic repulsion because of the reduction in the positively charged surface, thus resulting in higher adsorption (Özcan et al., 2004). In the basic solution at pH large than 7, the adsorbent surface becomes negatively charged, In addition, the degree of adsorption decreased rapidly where Ni 2+ ions precipitated as nickel hydroxide. As shown in Fig. 6, it is clear that the adsorption of Ni ions increased with an increase in initial Ni concentration. Increasing concentration gradient acts as increasing the driving force, and in turn, leads to an increase in equilibrium adsorption until adsorbent saturation is reached.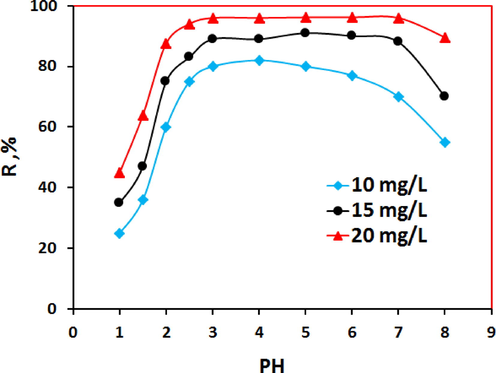
Effect of pH on Ni(II) adsorption on 20 mg PSAHSB, 300 rpm, 90 min & 293.15 K.
3.3 Effect of contact time
The adsorption of Ni (II) on the adsorbent was achieved in less than 20 min at 293.15 K as shown in Fig. 7. The removal amounts of Ni ions by PSAHSB adsorbent were maintained in the same rate even extending the contact time. Noteworthy, the adsorption degree was calculated to be ≥98% at a concentration of 0.98 μg _ mL−1 of nickel ions. Based on these results, PSAHSB adsorbent was proved to be an efficient adsorbent possessing relatively large adsorption capacity. An increase in the temperature to 333 K shortened the time of adsorption but it led to the partial degradation of formed complex and a decrease in the value of R as shown in Fig. 7.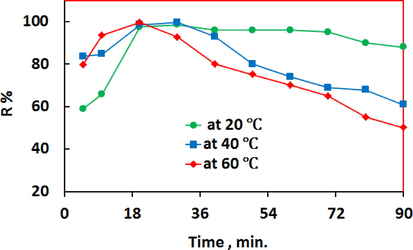
Effect of contact time on the adsorption equilibrium at different temperatures, PH = 5.5.
3.4 Adsorption kinetic
The liner plot of
vs. t and t/qm vs. t for the pseudo-first-order model and the pseudo second-order model respectively were shown in Fig. 8(a and b). The parameters of the two models were shown in Table. 2. The obtained results suggest that the kinetic data are fit with the pseudo second-order kinetic model. Comparison of experimental and calculated qe values, the qe of this model is approximate to the experimental data and the R2 is 0.999, which is very close to1. It is clear from Table. 2, that the rate constant of the pseudo second-order model (k2) is very small (0. 0.006 g/min.mg), indicating that the adsorption equilibrium can occur in a short time.![Kinetic model for Ni(II) adsorption. (a) Pseudo-firstorder, (b) pseudo-second order models [initial Ni(II) conc. = 25 mg/L; contact time = 5–90 min; T = 293; V = 25 mL; pH = 6].](/content/184/2020/13/9/img/10.1016_j.arabjc.2020.07.003-fig8.png)
Kinetic model for Ni(II) adsorption. (a) Pseudo-firstorder, (b) pseudo-second order models [initial Ni(II) conc. = 25 mg/L; contact time = 5–90 min; T = 293; V = 25 mL; pH = 6].
Kinetic models
Pseudo-first-order kinetic model
Pseudo-second-order kinetic model
Parameters
qe (exp.)
qe (cal.) mg/g)
k1 (1/min)
R2
qe (cal.) (mg/g)
k2 (g/min.mg)
R2
Values
14.22 ± 0.11
2.81 ± 0.04
0.06 ± 0.31
0.945
14.50 ± 0.19
0.006 ± 0.71
0.999
3.5 Adsorption isotherm
The fit of adsorption data to an isotherm is important to both theoretical and practical applications. In order to optimize the adsorption system, it is essential to establish the most appropriate correlations for the equilibrium data of each system (Altınışık et al., 2010). Equilibrium isotherm equations are used to describe the experimental adsorption data, and to understand the adsorption mechanism (Bulut et al., 2008). In this work, three different temperatures at initial pH = 6 ± 0.02 were used to describe the adsorption isotherms which was illustrated in Fig. 9(a).![(a) Adsorption isotherm at three different temperatures, (b) Langmuir and (c) Freundlich isotherms for Ni(II) ions adsorption on PSAHSB adsorbent [initial Ni(II) conc. = 0.01–1.5 mg/L; pH = 6; Adsorbent dose = 25 mg; t = 20 min].](/content/184/2020/13/9/img/10.1016_j.arabjc.2020.07.003-fig9.png)
(a) Adsorption isotherm at three different temperatures, (b) Langmuir and (c) Freundlich isotherms for Ni(II) ions adsorption on PSAHSB adsorbent [initial Ni(II) conc. = 0.01–1.5 mg/L; pH = 6; Adsorbent dose = 25 mg; t = 20 min].
The Langmuir and Freundlich models are adopted to correlate the experimental data (Chen and Wang, 2006; Wang, 2012). The Langmuir model is based on the assumption that the maximum adsorption occurs when a saturated monolayer of solute molecules is present on the adsorbent surface, the energy of adsorption is constant and there is no migration of adsorbate molecules in the surface plane. The equation of the Langmuir adsorption model was expressed in linear form as (Eq. (7))
The Freundlich model assumes that different sites with several adsorption energies are involved. The equation of Freundlich adsorption model was expressed in linear form as Eq. (8) (Bulut et al., 2008).
The experimental data of Ni (II) ions adsorption (Fig. 9) (a) were regressively analyzed with the Langmuir and Freundlich adsorption model (Fig. 9b & c) with the relative values calculated from the two models in Table 3. It can be concluded that Langmuir adsorption model was coincides with the experimental data better than Freundlich model,which indicates that the Langmuir model with complete monolayer coverage of the particles can fit the experimental data very well (Tan, 2007).
T(k)
qm (mg/g)
Langmuir isotherm
Freundlich isotherm
KL (L/mg)
R2
KF (mg/g)
nF (L/g)
R2
293.15
14.9 ± 1.43
4.50 ± 0.44
0.986
2.39 ± 0.63
0.743 ± 0.10
0.595
313.15
14.9 ± 2.03
4.84 ± 0.13
0.992
4.91 ± 0.90
0.764 ± 0.06
0.693
333.15
15.0 ± 2.30
6.14 ± 0.52
0.997
9.90 ± 0.05
0.964 ± 0.03
0.862
3.6 Adsorption Thermodynamics**
The thermodynamic parameters including free energy
, enthalpy
and entropy
can be calculated from the slope and intercept of the plot of lnKd vs. 1/T (Fig. 10) by applying the following Eq. (9) & Eq. (10) equations:
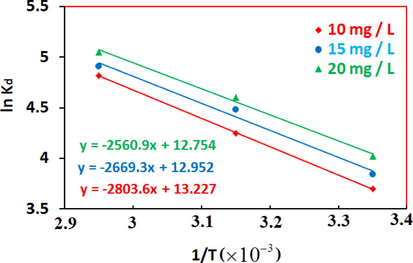
Effect of temperature on the distribution coefficients of Ni onto PSAHSB adsorbent at different initial Ni solution concentrations.
The thermodynamic parameters were collected as shown in Table 4.The positive values of ΔH0 show an endothermic process (Hosseini-Bandegharaei, 2011), where the Ni (II) ions were solvated in water and when these ions get adsorbed, they require energy to complete their hydration process (Chen and Wang, 2006). The ΔG0 was negative as expected for a spontaneous process under the conditions applied. The decreases in free energy with the increase of T indicated more efficient adsorption at high temperature. The positive value of ΔS0 reflects the affinity of PSAHSB toward Ni (II) ions in aqueous solutions (Bulut et al., 2008; Genç-Fuhrman et al., 2004; Soner Altundoğan, 2000). The result of Ni (II) ions adsorption on PSAHSB was a spontaneous and endothermic process.
C0(μg/ml)
ΔH0(KJ/ml)
ΔS0(J/mol.K)
ΔG0(KJ/mol)
293.15 K
313.15 K
333.15 K
10
23.306
110.94
−32.202
−34.393
−36.561
15
22.193
108.00
−31.601
−33.703
−35.932
20
21.042
103.63
−30.032
−32.084
−34.123
3.7 Desorption and reusability
As shown in Fig. 11(a), the HNO3 is a weak desorbing agent. This is evidence of the strong bond between Ni ions and the adsorbent. Only when10ml 2 M HCl acid was used; a significant increase in the degree of desorption was realized. It was found that the desorption degree increased with increasing the HCl concentration. Desorption mechanism is based on the exchange of hydrogen ions with the Ni (II) ions.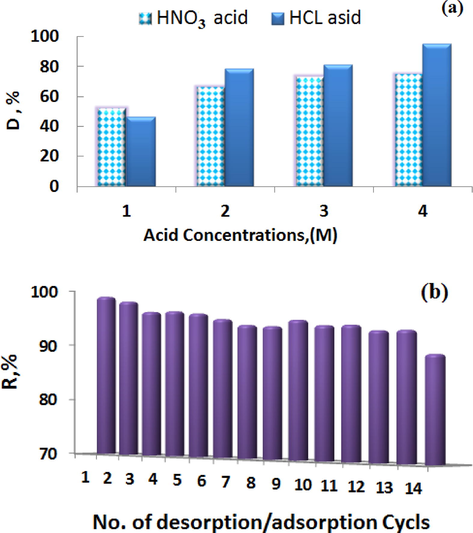
(a) Desorption test and (b) Adsorption–desorption cycles of adsorption of Ni on PSAH adsorbent.
On the other hand, results presented in Fig. 11(b) show the cyclic adsorption–desorption performance to estimate the ability of regeneration. The adsorption degree showed consistently at a level of ˃90% for each cycle after desorption with 12 cycles. The results proved the high regeneration ability of the adsorbent.
3.8 Effect of coexisting ions
The effects of coexisting ions such as sodium, potassium, calcium, barium, iron (II) and (III), magnesium, chromium and cadmium, usually found in natural samples were examined using model solutions containing 10 μg of Ni(II)) and excess matrix ions in 50 mL of model solutions. The tolerance limits (error ≤ 4.3%) are given in Table 5. The results show that the presence of high concentrations of major cations has no obvious effect on the studied Ni(II)) ion recoveries.
Interfering ions (x)
Added As
Tolerance limit
[x]:[Ni]
R,% ±RSD
Na+
NaCl
50,000
98 ± 3.43
К+
KCl
50,000
99 ± 0.92
Ca2+
CaCl2
5000
100 ± 3.51
Mg2+
Mg(NO3)2
5000
99 ± 1.56
Cu2+
Cu(NO3)2
1000
100 ± 0.65
NH4+
NH4Cl
50,000
98 ± 0.99
Ba2+
Ba(NO3)2
5000
99 ± 2.37
Zn2+
Zn(NO3)2
5000
102 ± 1.15
Al3+
Al(NO3)3
1000
99 ± 2.68
Pb2+
Pb(SO4)2
5000
98 ± 1.97
Mn2+
Mn(NO3)2
1000
100 ± 2.55
Fe2+
Fe(NO3)2
5000
99 ± 4.34
Cd2+
Cd(NO3)2
5000
102 ± 4.76
Cr+3
CrCl3
1000
99 ± 27
Fe3+
FeCl3
500
101 ± 18
3.9 Analytical applications
The analytical applicability of modified PSAHSB adsorbent was tested for the collection of metal ions from real samples (Tap water, Potatoes and Carrot) obtained from Hodeida city, Yemen. The real samples tested by direct and standard addition through batch mode under optimized conditions. The Ni (II) ions were pre-concentrated and determined. The results (Table 6), showing that recoveries of Ni (II) ions (≥95%) could be made with a good precision of RSD < 5%, indicate the reliability of the present method for metal analyses in the real samples without significant interference.
The sample
Added (μg /l)
Spiked sample found (μg/l)
st /
n(±RSD %)
% R
Potatoes
00.00
0.03 ± 0.04 (±4.49%)
ـــ
10.00
00.009.91 ± 0.01 (±1.11%)
0.57 ± 0.02 (±4.89%)98.86
ـــ
Carrot
10.00
00.0010.45 ± 0.05 (±0.23%)
3.11 ± 0.01 (±0.20%)98.81
ـــ
Tap water
10.00
13.5 ± 0.01 (±0.04%)
104. 00
4 Conclusion
A new and low-cost and eco-friendly polystyrene (4-azo-1′)-2′-hydroxy-5′-sulfobenzene adsorbent was applied to investigate the removal of Ni2+ from aqueous solutions. The PSAHSB adsorbent contains functional groups capable of complexing or ion exchanging with Ni (II) ions with the high stability. Optimum pH of adsorption was located in the range of 3–7 with adsorption degree ≥98. The adsorption capacity of Ni ions on adsorbent was increased with the increasing of pH, amount of nickel and temperature of the solution. The adsorption could be reached the equilibrium within 20 min at 293.15 K. The obtained results showed that the Langmuir isotherm model fitted the experimental data well. The positive value of ΔH and negative value of ΔG indicate the endothermic and spontaneous nature of the sorption for Ni (II) ions. The tolerance limits of interfering ions on the recovery of analyte ions are quite high. PSAHSB adsorbent seems to be stable up to at least 12 cycles. The results acquired from the analysis of real samples confirmed the reliability of the method, and demonstrated that the PSAHSB adsorbent is a promising adsorbent to be applied to environmental samples for the determination of trace Ni (II).
Acknowledgements
This work was financially supported by the University of Science and Technology (UST), Sana'a, Yemen according to decree No. 2014/15/N ST8/00319.
References
- Heavy metal ions removal by chelating resin. Pigm. Resin Technol.. 2005;34(6):332-339.
- [Google Scholar]
- Inhibition biosensor based on DC and AC electrical measurements of bacteria samples. Procedia Technol.. 2017;27:129-130.
- [Google Scholar]
- Development of novel and highly specific ssDNA-Aptamer-based electrochemical biosensor for rapid detection of Mercury (II) and Lead (II) ions in water. Chemosensors. 2019;7(2):27.
- [Google Scholar]
- Adsorption studies on Citrus reticulata (fruit peel of orange): removal and recovery of Ni (II) from electroplating wastewater. J. Hazard. Mater.. 2000;79(1–2):117-131.
- [Google Scholar]
- A natural sorbent, Luffa cylindrica for the removal of a model basic dye. J. Hazard. Mater.. 2010;179(1):658-664.
- [Google Scholar]
- Studies on the uptake behavior of a magnetic Co3O4-containing resin for Ni (II), Cu (II) and Hg (II) from their aqueous solutions. Sep. Purif. Technol.. 2005;46(3):208-213.
- [Google Scholar]
- Preconcentration of gold on chelating polymer adsorbents and its determination in rocks and ores. J. Anal. Chem.. 2005;60(3):234-239.
- [Google Scholar]
- Physicochemical properties of complexing para-substituted polystyrene sorbents containing functional amino groups. Russ. J. Phys. Chem.. 2006;80(1):115-119.
- [Google Scholar]
- Sorption of phosphorus (V) by polymeric sorbents based on aminopolystyrene and 4-amino-N-azobenzenesulfamide. Russ. J. Inorg. Chem.. 2007;52(10):1638-1642.
- [Google Scholar]
- Adsorption of malachite green onto bentonite: equilibrium and kinetic studies and process design. Microporous Mesoporous Mater.. 2008;115(3):234-246.
- [Google Scholar]
- Metal Allergy: From Dermatitis to Implant and Device Failure. Springer; 2018.
- Adsorption of Ni(II) from aqueous solution using oxidized multiwall carbon nanotubes. Ind. Eng. Chem. Res.. 2006;45(26):9144-9149.
- [Google Scholar]
- Adsorption of CI Basic Blue 9 on cyclodextrin-based material containing carboxylic groups. Dyes Pigm.. 2006;70(3):204-211.
- [Google Scholar]
- Biosorption potentials of a novel green biosorbent Saccharum bengalense containing cellulose as carbohydrate polymer for removal of Ni (II) ions from aqueous solutions. Int. J. Biol. Macromol.. 2013;54:99-108.
- [Google Scholar]
- Effectiveness of N, O-carboxymethyl chitosan on destabilization of Marine Diesel, Diesel and Marine-2T oil for oil spill treatment. Carbohydr. Polym.. 2017;167:326-336.
- [Google Scholar]
- Hierarchically porous carbon derived from polymers and biomass: effect of interconnected pores on energy applications. Energy Environ. Sci.. 2014;7(11):3574-3592.
- [Google Scholar]
- Adsorption of arsenic from water using activated neutralized red mud. Environ. Sci. Technol.. 2004;38(8):2428-2434.
- [Google Scholar]
- Kinetics and isotherms studies for the removal of Ni (II) from aqueous solutions using Rosa canina L. In: International Congress on Informatics, Environment, Energy and Applications-IEEA. 2012.
- [Google Scholar]
- Equilibrium and thermodynamic studies on the adsorption of the dye tartrazine onto waste “Coconut Husks” carbon and activated carbon. J. Chem. Eng. Data. 2010;55(11):5083-5090.
- [Google Scholar]
- Removal of nickel (II) from aqueous solution by biosorption on A. barbadensis Miller waste leaves powder. Appl.Water Sci.. 2019;9(4):96.
- [Google Scholar]
- Second-order kinetic model for the sorption of cadmium onto tree fern: a comparison of linear and non-linear methods. Water Res.. 2006;40(1):119-125.
- [Google Scholar]
- Removal of Hg(II) from aqueous solutions using a novel impregnated resin containing 1-(2-thiazolylazo)-2-naphthol (TAN) Chem. Eng. J.. 2011;168(3):1163-1173.
- [Google Scholar]
- Biosorption and desorption of nickel on oil cake: batch and column studies. Bioresour. Technol.. 2012;103(1):35-42.
- [Google Scholar]
- Khellaf, N., 2009. Growth response of the duckweed Lemna minor to heavy metal pollution. vol. 6.
- Characterization and spectroscopic study of enzymatic oligomerization of phenazopyridine hydrochloride. J. Mol. Struct.. 2019;1188:76-85.
- [Google Scholar]
- Zur theorie der sogenannten adsorption geloster stoffe. Kungliga svenska vetenskapsakademiens. Handlingar. 1898;24:1-39.
- [Google Scholar]
- Effect of temperature and pH on the adsorption of an anionic detergent on activated carbon. J. Chem. Technol. Biotechnol.. 1989;45(3):231-240.
- [Google Scholar]
- Adsorptive removal of heavy metals from aqueous solution by treated sawdust (Acacia arabica) J. Hazard. Mater.. 2008;150(3):604-611.
- [Google Scholar]
- Synthesis and characterization of a new resin functionalized with 2-naphthol-3, 6-disulfonic acid and its application for the speciation of chromium in natural water. Talanta. 2002;56(1):145-152.
- [Google Scholar]
- Adsorption of Cu (II), Cd (II) and Ni (II) ions by cross-linked magnetic chitosan-2-aminopyridine glyoxal Schiff's base. Colloids Surf., B. 2012;94:250-258.
- [Google Scholar]
- pKa determination of graphene-like materials: Validating chemical functionalization. J. Colloid Interface Sci.. 2016;467:239-244.
- [Google Scholar]
- Adsorption of Acid Blue 193 from aqueous solutions onto Na–bentonite and DTMA–bentonite. J. Colloid Interface Sci.. 2004;280(1):44-54.
- [Google Scholar]
- The Henderson-Hasselbalch equation: its history and limitations. J. Chem. Educ.. 2001;78(11):1499.
- [Google Scholar]
- Ramezankhani, R., et al., 2008. A mathematical model to predict nickel concentration in Karaj river sediments. vol. 5.
- Recent advances in DNA-based electrochemical biosensors for heavy metal ion detection: a review. Biosens. Bioelectron.. 2017;90:125-139.
- [Google Scholar]
- Synthesis of a new chelating resin bearing amidoxime group for adsorption of Cu (II), Ni (II) and Pb (II) by batch and fixed-bed column methods. J. Environ. Chem. Eng.. 2014;2(1):632-641.
- [Google Scholar]
- Flow-injection analysis-spectrophotometric determination of nickel. J. Anal. Chem. USSR. 1986;41(7):925-928.
- [Google Scholar]
- Synthesis, characterization and thermal study of polyimides derived from polystyrene. J. Univ. Anbar Pure Sci.. 2012;6(1):21-27.
- [Google Scholar]
- Arsenic removal from aqueous solutions by adsorption on red mud. Waste Manage.. 2000;20(8):761-767.
- [Google Scholar]
- Sorption and desorption of Th (IV) on nanoparticles of anatase studied by batch and spectroscopy methods. Colloids Surf., A. 2007;296(1–3):109-116.
- [Google Scholar]
- Dissociation behaviors of carboxyl and amine groups on carboxymethyl-chitosan in aqueous system. J. Polym. Sci., Part B: Polym. Phys.. 2008;46(14):1419-1429.
- [Google Scholar]
- Stable organic–inorganic hybrid of polyaniline/α-zirconium phosphate for efficient removal of organic pollutants in water environment. ACS Appl. Mater. Interfaces. 2012;4(5):2686-2692.
- [Google Scholar]
- Scanning force microscopy of DNA molecules elongated by convective fluid flow in an evaporating droplet. Biophys. J.. 1998;75(1):513-520.
- [Google Scholar]
- Synthesis and characterization of poly (HEA/MALA) hydrogel and its application in removal of heavy metal ions from water. Chem. Eng. J.. 2013;215:894-902.
- [Google Scholar]
- Equilibrium kinetics and isotherm studies of Cu (II) adsorption from waste water onto alkali activated Oil Palm Ash. Am. J. Appl. Sci.. 2011;8(3):230-237.
- [Google Scholar]
- Competitive adsorption of Pb (II), Cu (II) and Zn (II) onto xanthate-modified magnetic chitosan. J. Hazard. Mater.. 2012;221:155-161.
- [Google Scholar]
Appendix A
Supplementary material
Supplementary data to this article can be found online at https://doi.org/10.1016/j.arabjc.2020.07.003.
Appendix A
Supplementary material
The following are the Supplementary data to this article:Supplementary data 1
Supplementary data 1


