

Translate this page into:
Preparation, characterization and catalytic activity of WO3 supported on sulfated tin oxide catalysts
⁎Corresponding author. Mobile: +963 944359267; fax: +963 21 2663132. mnalaya@myway.com (M. Nasouh Alaya)
-
Received: ,
Accepted: ,
This article was originally published by Elsevier and was migrated to Scientific Scholar after the change of Publisher.
Peer review under responsibility of King Saud University.

Abstract
Solid acid catalysts of 15 wt.%SO4/SnO2 loaded with 5–45 wt.%WO3 were prepared, calcined at 400–800 °C, and then characterized by TG–DTA, XRD, FT-IR spectra and nitrogen adsorption techniques. The surface acidity was determined by potentiometric titration with n-butylamine in acetonitrile and FT-IR spectra of chemisorbed pyridine.
The presence of sulfate ions together with WO3 hindered the crystallization of tin oxide and the products at a lower temperature of ⩽ 500 °C found amorphous. The crystallinity of tin oxide increased with raising the calcination temperature to provide nanocrystalline cassiterite structure, whereas, increasing WO3 loading up to 25 wt.% decreases the process. Careful control of calcination temperature and WO3 loading was found to have a critical effect on the specific surface area and therefore on the resulted surface acidity.
The surface acidity measurements indicate that the catalysts possess very strong acid sites that designate both of Brønsted and Lewis acid sites.
Catalytic application toward esterification of propionic acid with n-butanol was tested and the effect of various parameters, i.e., reaction temperature, reactant molar ratio, weight of the catalyst, WO3 loading and calcination temperature was also investigated. The highest conversion level was found for products loaded with 25 wt.%WO3 and calcined at 400 °C. Although both of Brønsted and Lewis acid sites are responsible for the reaction, the former acid sites found more effective on catalyzing the esterification reaction.
Keywords
Sulfated SnO2
WO3
TG–DTA
XRD
FTIR
Acidity
Activity

1 Introduction
Solid acids have been extensively used as catalysts or catalyst carriers in petroleum chemistry and organic synthesis for many years. Applications were always found for many reactions including esterification, etherification, hydration, hydrolysis, alkylation, isomerization, and others. Materials that have, for example, been utilized as solid acids involve metal oxides, mixed oxides, cation exchange resins and zeolites. In the same extend, metal oxides such as ZrO2, TiO2, Al2O3, Fe2O3, and SnO2 loaded with sulfate ions or acidic metal oxides such as WO3 and MoO3 found to increase the surface acidity of the oxides and may produce superacids (Yamaguchi, 1990; Arata, 1996), and also increase the surface areas (Ahmed et al., 2008; Khder et al., 2008). Sulfated tin oxide is proposed to possess the strongest surface acidity with reported value higher than that of sulfated zirconia (Ho < −14.6) (Matsuhashi et al., 1990).
Esterification of carboxylic acids is one of the fundamental reactions in organic chemistry and chemical engineering industry. The production of esters plays a major role in the production of flavors and fragrances, solvents, plasticizers, plastics, medicine and surface-active agents (Ali et al., 2007; Jermy and Pandurangan, 2005). Kinetically, the esterification reactions are, in general, slow and catalysts are always utilized in the liquid phase for process acceleration. Conventional method of esterification reaction involves the use of mineral acids such as H2SO4, HCl, HF, and ClSO2-OH (Rao et al., 1979; Dash and Parida, 2007; Liu et al., 2006) or Lewis acid such as AlCl3 (Rao et al., 1979). The uses of such acids are hazardous, pollutant and corrosive which emphasize replacement by solid acid catalysts for cleaner technology.
Several heterogeneous eco-friendly catalysts are reported in the literature for esterification reactions including ion exchange resins (Liu and Tan, 2001; Lee et al., 2002; Ali et al., 2007), zeolites (Tanaka et al., 2001; Kirumakki et al., 2006), sulfated oxides (Yadav and Mehta, 1994; Khder et al., 2008), fibrous polymer-supported sulfonic acid and (Lilja et al., 2002, 2005), heteropoly acids supported on oxide (Bahatt and Patel, 2005; Parida and Mallick, 2007; Khder, 2008). Because n-butyl propionate ester possesses a high boiling point temperature (419.8 K) and a high electrical resistance, it is considered to be a good non-volatile solvent i.e. non-volatile organic compound (non-VOC), to meet with the more strict environmental regulations for reducing the VOCs' emission. Knowing that n-butyl propionate can be synthesized from n-butanol and propionic acid by a catalytic esterification, the existence of azeotropes e.g. butanol/water, propionic acid/water and butyl propionate/water leads to some difficulties in the subsequent distillation and purification steps (Liu and Tan, 2001; Lee et al., 2002).
Work concerning esterification process of carboxylic acids with alcohols using sulfated tin oxide catalyst or WO3 supported on sulfated tin oxide is considerably rare due to the difficulty in this catalyst preparation.
We now report on the process preparation and characterization of a series of catalysts based on a 15 wt.%SO4/SnO2 support loaded with 5–45 wt.%WO3, and exploited to optimize a model catalytic system for esterification of propionic acid with n-butanol.
2 Experimental
2.1 Materials and catalyst preparation
Tin oxide gel was prepared by a dropwise addition of ammonia solution (15 wt.%) to 0.5 M solution of SnCl4·5H2O (Riedel-de Haen), up to a final pH value of 8, with continuous vigorous stirring for 4 h. The gel was left overnight then washed by decantation with 1% ammonium acetate (Matsuhashi et al., 1990; Khder et al., 2008) until all chloride ions were eliminated (silver nitrate test). The resulting tin hydroxide gel was mixed vigorously for 4 h with an appropriate amount of 1 M H2SO4 solution giving the final of 15 wt.%. The obtained sulfated tin hydroxide gel was dried at 120 °C for 24 h. The dried sample was designated as SS.
To load the sulfated tin hydroxide material with WO3, appropriate amounts of ammonium paratungstate (APT) solution (30 g/L) (Prolabo) was added to an accurately weighed dried SS material, the resulted gels were vigorously stirred for 4 h, then dried at 120 °C overnight.
The resulting prepared catalysts were calcined at 400, 500, 650 and 800 °C for 4 h. The samples were designated as xWSS-y, where x is the weight percent of WO3 loaded and y is the temperature of calcination; for example, 25 wt.%WO3 loaded on 15 wt.% /SnO2 calcined at 500 °C is expressed as 25WSS-500.
2.2 Techniques
Thermal analysis (TG–DTA) of uncalcined samples was performed in air atmosphere using Linseis Thermal Analyzer, Type STA PT-1600 (Germany). A weight of 40–60 mg was placed in a crucible of 100 μL capacity, and the heating was programmed from 25 °C up to 1000 °C at a constant heating rate of 10°/min.
The X-ray powder diffractograms, of all the prepared samples calcined at 800 °C as well as for all calcination products of 25WSS catalysts, were recorded on Philips Diffractometer Type PW (1830). The pattern was obtained with Ni-filtered CuKα radiation (λ = 1.5418 Å) at 40 kV and 30 mA, at a scanning speed of 1° in 2θ, the scanning range 2θ of 20–70°. The spacing d corresponding to 2θ of the peaks were calculated and correlated with those of ASTM to determine the existing phases. The average crystallite size d of the strongest peaks at 2θ = 26.15° (110), 33.49° (1 0 1) and 51.35° (2 1 1) were determined from Scherrer equation (Ristic et al., 2002):
The specific surface areas of all the samples were determined by nitrogen physisorption at 77 K, applying BET method, using Gemini III 2375 Surface Area Analyzer apparatus. Prior to any adsorption measurement, the sample was degassed at 200 °C for 6 h under a reduced pressure of 10−4 Torr.
The FT-IR spectra of the samples were recorded using Jasco FT-IR-460 spectrophotometer in the range of 1200–1700 cm−1, at a resolution of 4 cm−1; by mixing 0.005 g of the sample with 0.1 g KBr in 13 mm diameter self supporting disks were used.
The total acidity of the solid samples was measured by means of potentiometric titration method (Rao et al., 2006; Bennaradi et al., 2007). The dry solid (0.1 g) was suspended in 10 mL acetonitrile (Lab-Scan), and agitated for 3 h. The suspension was then titrated with 0.1 N n-butylamine (Merck) at 0.05 mL/min. The electrode potential variation was measured with Inolab Digital pH-mV model using a double junction electrode. The nature of acid sites presented on the surface of the catalyst was determined with FT-IR transmission spectra of adsorbed pyridine (Scharlau). Prior to the pyridine adsorption (Khder et al., 2008; Khder and Ahmed, 2009), the samples were degassed at 200 °C for 3 h under high vacuum followed by suspending in a dried pyridine. Then, the excess pyridine was removed by evaporation at70 °C. A mixture of 0.005 g sample with 0.1 g dried KBr was pressed into 13 mm disk, and the FT-IR spectra of the samples were recorded using Jasco FTIR-460 spectrophotometer within the range of 1200–1700 cm−1, at a resolution of 4 cm−1.
2.3 Determination of the catalytic activity
The catalytic activity of the prepared catalysts was tested for the esterification of propionic acid (Merck) with n-butanol (SRL). The esterification reaction was carried out in a 100 mL flat-bottomed flask, equipped with a reflux condenser, containing a stirring mixture of propionic acid (0.05 M), n-butanol (0.10 M) and the catalyst (0.2 g). The stirring rate in all the experiments was 600 rpm, at 90 °C for 4 h. The reaction mixture was then immediately filtered and quenched to stop the reaction. Liquid samples of 0.5 mL volume were withdrawn and the amount of unreacted acid was titrated with 0.1 N NaOH. The effects of reaction temperature, catalyst amount, the initial molar ratio between the acid and alcohol (PA:B), WO3 content and calcination temperature were all studied.
3 Results and discussion
3.1 Thermal analyses
Figs. 1 and 2 illustrate the TG and DTA curves of the original prepared samples. All TG curves for all samples show three characteristic steps at 50–200, 430–550 and 560–760 °C with weight loss of 3.4–5.6 wt.%, 7.7–9.4 wt.% and 0.9–4.2 wt.%, respectively. These steps accompanied in DTA curves with endothermic peaks that observed at 110–135, 460–500 and around 630 °C, respectively. These thermal effects are due to desorption of physically adsorbed water, partial dehydroxylation and decomposition of sulfate species bounded to the tin oxide surface, respectively (Gutierrez-Baez et al., 2004; Hino et al., 2007; Khder et al., 2008).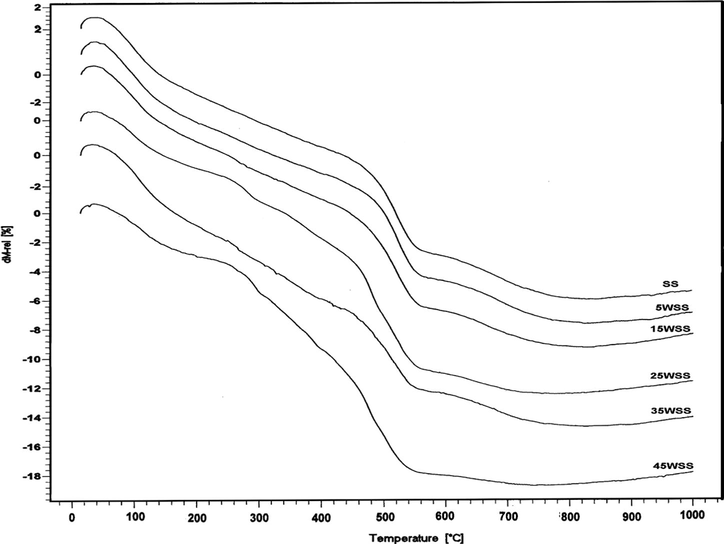
TG curves of SS and WSS catalysts.
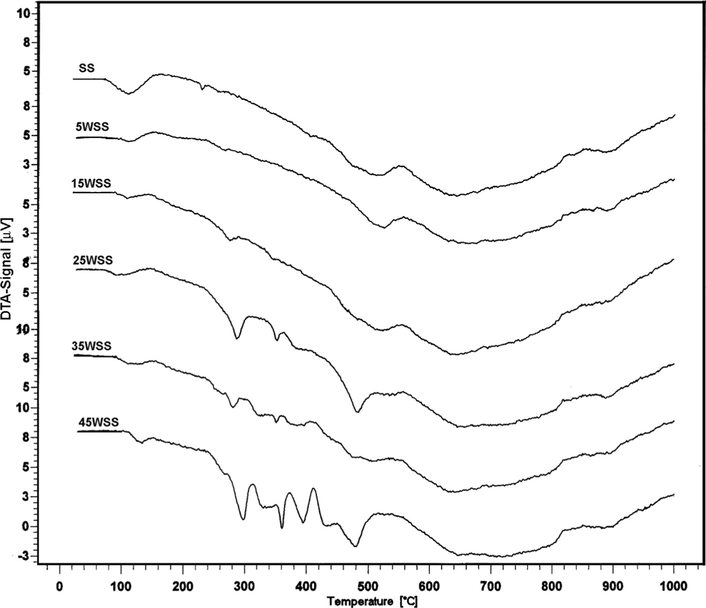
DTA curves of SS and WSS catalysts.
In addition to the above thermal effects, the TG patterns of SS, 5WSS and 15WSS samples show a gradual step in the range of 200–400 °C, which appear in DTA curve as an endothermic peak located at 229 °C for SS sample and shifted to a higher temperature (∼276 °C) with an increase in wt.%WO3 loading. This thermal effect is due to partial dehydroxylation and removal of some ammonia as a result of partial decomposition of tungstate species. The TG curves of the samples that loaded with ⩾25 wt.%WO3 show two steps at 200–300 and 300–400 °C with weight loss of 2.3–2.4 wt.% and 2.2–4.0 wt.%, respectively. These steps are accompanied in DTA with endothermic effects, which their peaks are located at 280–288, ∼340 and 368–380 °C which correspond to the decomposition of APT and evolution of ammonia, and formation of amorphous ammonium tungsten bronze (ATB) (French and Sale, 1981; Khder and Ahmed, 2009). The DTA curves of 35WSS and 45WSS samples show two exothermic effects at 410 and 425 °C attributed to the decomposition of ATB and the formation of crystalline WO3, respectively (Khder and Ahmed, 2009; Fait et al., 2008). The thermal effects at 270–370 °C may be due to two effects, the first is endothermic which is resulted from the loss of water molecules and dehydroxylation, and the second effect is exothermic as consequence of tin oxide crystallization (Gutierrez-Baez et al., 2004), the latest effect does not appear because the endothermic effect is more pronounced. It was proved that the interaction between sulfate ions and tin oxide stabilizes the crystal size against sintering and inhibiting the crystallite aggregate (Gutierrez-Baez et al., 2004). Moreover, the addition of ATP to sulfated SnO2 was also found to hinder the crystallization of SnO2 (Khder and Ahmed, 2009). These were proved in this work, with no sharp exothermic signals observed indicating a distinct crystallization process of WO3 phase, which may have resulted from the high dispersion of WO3 on the SnO2 surface.
Table 1 shows the values of TG% at different calcination temperatures. It is clear that the TG% depend on the percentage of WO3 loading which shows similar trend on decreasing at all calcination temperatures up to a certain wt.% of WO3 then increases, whereas, at 500 °C and 600 °C it is decreased then increased. These trends may be due to the variation in the amount of chemically bonded water, the decomposition of ATP and sulfate ions.
Catalyst
Calcination temperature (°C)
200
400
500
650
800
SS
5.6
10.8
14.7
22.1
24.8
5WSS
5
9.2
12.6
18.5
20.8
15WSS
4.6
8.7
12.1
16.4
19.2
25WSS
3.4
8.1
13.45
18.2
19
35WSS
4.5
9.4
12.2
15.8
17.2
45WSS
3.1
9.25
15.35
18.68
19
3.2 X-ray diffraction
The X-ray diffractograms of SS and xWSS samples calcined at 800 °C are shown in Fig. 3. All samples show peaks at 2θ = 26.15°, 33.49° and 51.35° which may correspond to tetragonal cassiterite structure (JCPDS No. 41-1445). The intensities of these peaks are gradually decreased, while their widths increased progressively with the increase in the percentage of WO3 loaded. The characteristic peaks of WO3 phase at 2θ = 23.12°, 23.59° and 24.38° (JCPDS No. 46–1096) were only observed for samples loaded with ⩾25 wt.%WO3, at lower loading percentage, however, these peaks do not appear which mean that WO3 crystals transformed into very small WO3 crystals or dispersed completely over SS support.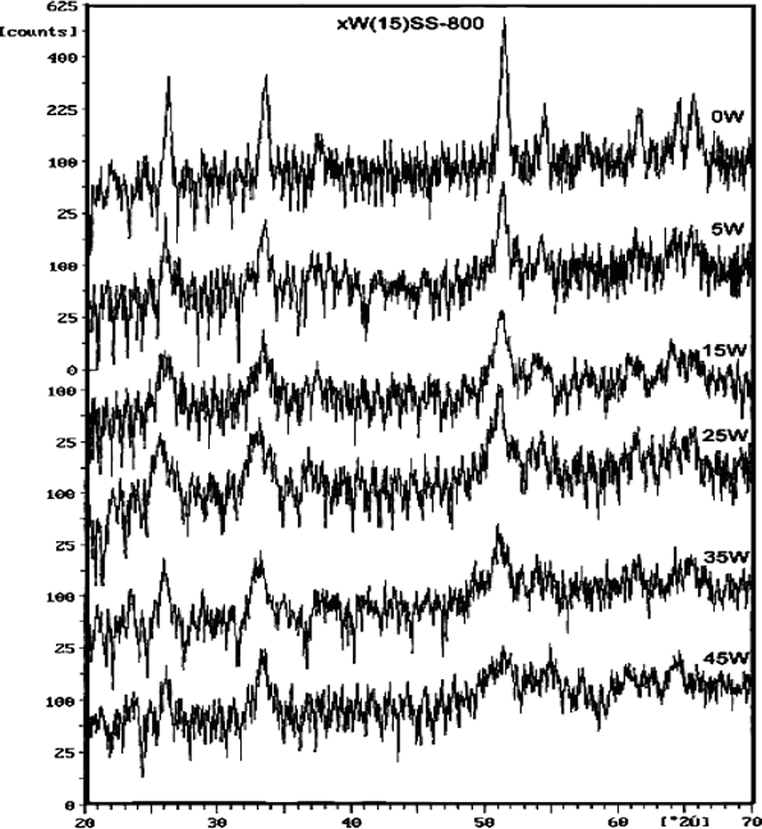
XRD patterns of xWSS catalysts calcined at 800 °C.
The effect of calcination temperature on the crystallinity of 25WSS sample is shown in Fig. 4. The products calcined at 400 and 500 °C showing amorphous structure with no diffraction lines that characterize WO3 were observed, whereas, products calcined at temperature ⩾650 °C, exhibit characteristic peaks of cassiterite structure that increase in intensities with increasing the calcination temperature.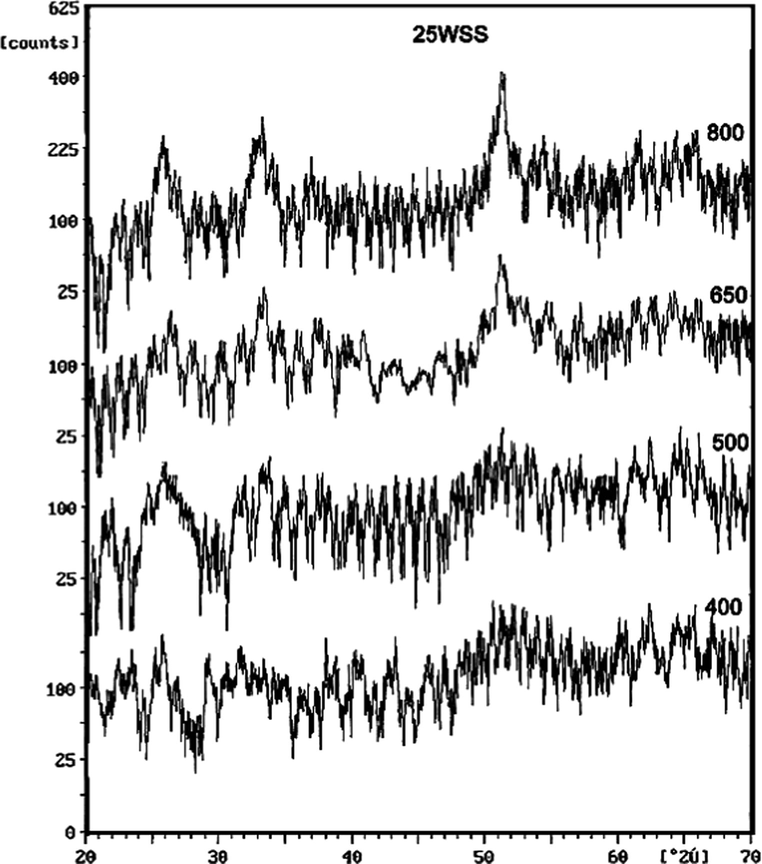
XRD patterns of 25WSS catalyst calcined at different temperatures.
The calculated average crystallite size of the peaks appeared at 26.15°, 33.49° and 51.35° that correspond to 110, 101 and 211 planes are listed in Table 2. The results show that SnO2-800 phase existed as nano-crystalline phase, measuring the crystallite size indicates a value of 23.06 nm for 110 planes and 17.30 nm for 101 and 211 planes. Increasing the loading of sulfated tin oxide with 5–25 wt.%WO3 leads to a decrease in tin oxide crystallinity, further increase of WO3 content above 25 wt.% leads to an increase in the crystallite size which may be due to the formation of detectable WO3-like species.
Catalyst
d (nm) (1 1 0)
d (nm) (1 0 1)
d (nm) (2 1 1)
SS
23.06
17.30
17.30
5WSS
17.30
11.53
17.30
15WSS
9.88
7.68
9.88
25WSS
6.29
5.77
8.64
35WSS
17.30
11.53
9.88
45WSS
17.30
13.83
11.53
3.3 FT-IR spectra
The FT-IR spectra of the original samples and the 400 °C products of xWSS are shown in Figs. 5 and 6, respectively. The spectra show vibration bands at 588 and 659 cm−1 which are assigned to the stretching vibration of O–Sn–O bonds in the framework (Zhang and Gao, 2004; Salavati-Niasari et al., 2010; Sarkar et al., 2010). The bands at 800–806 cm−1 are assigned for stretching vibrations of O–W–O groups, with shoulders appeared at 753 cm−1 assigned for the W–O vibration of the surface tungstate species (Armendairiz et al., 2003), and the 960 cm−1 bands are assigned for the stretching vibration of octahedrally coordinate species on the support surface (Khder and Ahmed, 2009). The spectra show that bands at 1260–900 cm−1 are attributed to chelating bidentate sulfate on the SnO2 support (Yamaguchi et al., 1986). Peaks at 982 and 1029 cm−1 are assigned to asymmetric stretching frequencies of partially ionized S⚌O and S–O bonds, the bands at 1259 cm−1 are assigned to stretching vibration of S–O bonds, and bands at 1394 cm−1 are assigned for asymmetric stretching vibration of S⚌O at sulfate ion bonded to the tin oxide surface (Sohn et al., 2006). The bands appeared at 1618–1628 cm−1 are attributed to the bending vibration of water (Cui et al., 2007). The broad bands and shoulders that appeared at ∼3030, 3136–3149 and 3406–3423 cm−1 are attributed to the stretching vibrations of water and OH groups, that coexist with the bending vibration bands of adsorbed water at ∼1618 cm−1 (Salavati-Niasari et al., 2010; Triwahyono et al., 2003), which are all decreased when the samples calcined at 400 °C. This results is in agreement with TG-DTA results, since the first step in TG curves and first endothermic peak in DTA curves are attributed to the desorption of water molecules.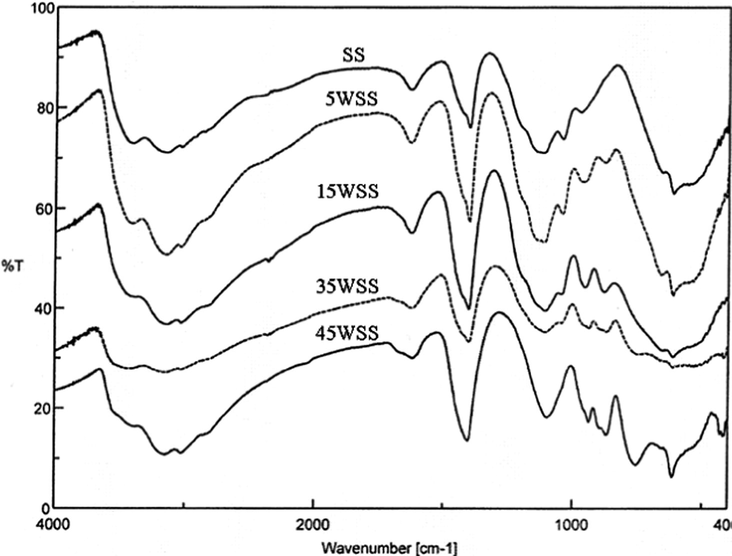
FT-IR spectra of the uncalcined xWSS catalysts.
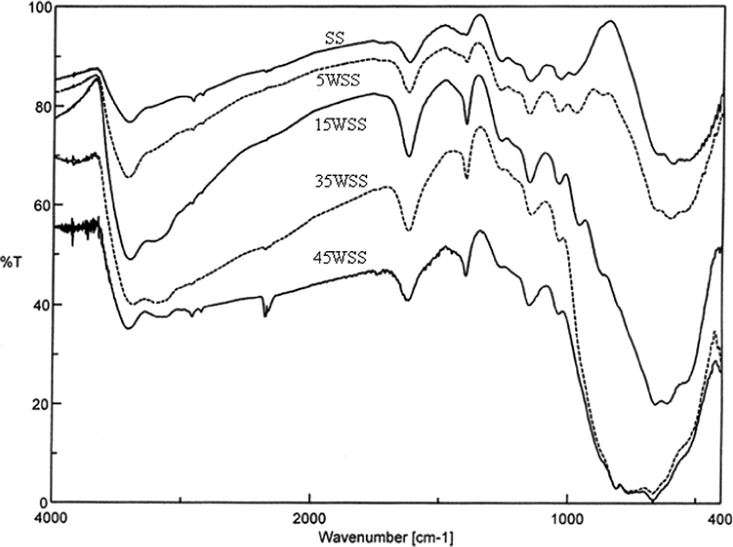
FT-IR spectra of xWSS catalysts calcined at 400 °C.
Fig. 7 shows the FT-IR spectra in the range of 400–2000 cm−1 for 25WSS catalyst calcined at different temperatures. The spectra reveal that the raising of the calcination temperature to values ⩾650 °C results in the disappearance of the characteristic bands of S–O and S⚌O which appear at 1000–1500 cm−1, presumably due to the decomposition of sulfate ions bonded with SnO2, which is also in agreement with thermal analysis results.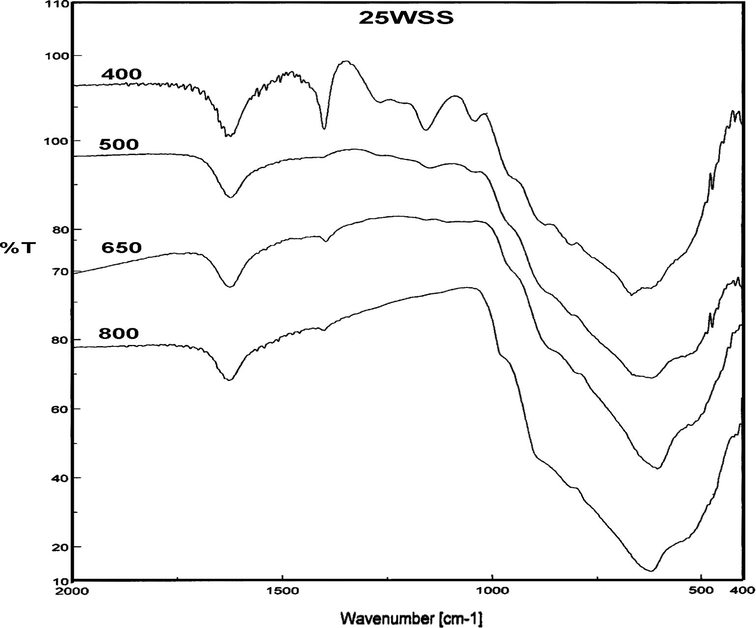
FT-IR spectra of 25WSS catalyst calcined at different temperatures.
3.4 Specific surface area
The specific surface areas of the prepared catalysts were determined from the analysis of nitrogen adsorption data performed at 77 K according to the Bruner–Emmett–Teller method (BET method). The calculated SBET values are presented in Table 3, in which by examination illustrate the following points: (i) Thermal treatment at 400 °C causes an increase in SBET for SS and xWSS catalysts, the highest increase was observed for 25 wt.%WO3 loading. (ii) The increase of the calcination temperature from 400 to 500 °C was accompanied with a slight decrease in the specific surface area. Further increase of the calcination temperature causes a drastic decrease in SBET for SS sample which is due to the decomposition of sulfate species, crystallization and sintering of SnO2, but for WO3 loaded samples the decrease in SBET becomes less as the WO3 content increased, except for the sample loaded with 45 wt.%WO3 which shows an increase in SBET up to 500 °C then decreased slightly with further increases in the calcination temperature. (iii) The increase of WO3 loading causes a gradual decrease in the surface area for 400 °C and for 500 °C products, whereas for products prepared at ⩾ 650 °C the SBET increased gradually with increasing WO3 content to show maximum at 25 wt.%WO3 loading. Increasing the loading to 35 wt.%WO3 exhibits a decrease in SBET value which then increased again for 45 wt.%WO3 loading.
Catalyst
SBET (m2/g)
Ei (mV)
Acidity (mmol/g)
Catalyst
SBET (m2/g)
Ei (mV)
Acidity (mmol/g)
SS-200
64.9
207
0.0590
25WSS-200
2.4
312
0.0110
SS-400
131
435
0.1100
25WSS-400
96.7
482
0.0550
SS-500
101
525
0.1100
25WSS-500
87.4
463
0.0550
SS-650
26.6
410
0.0540
25WSS-650
53.2
142
0.2030
SS-800
8.12
75
0.0140
25WSS-800
35.5
184
0.1050
5WSS-200
39.8
278
0.0660
35WSS-200
38.5
248
0.1350
5WSS-400
126
518
0.2040
35WSS-400
86.9
465
0.1400
5WSS-500
100
521
0.1230
35WSS-500
77.5
302
0.0795
5WSS-650
35.5
325
0.0820
35WSS-650
36.3
163
0.0760
5WSS-800
22.4
250
0.0480
35WSS-800
27.1
130
0.0560
15WSS-200
12.4
314
0.1195
45WSS-200
6.43
260
0.1200
15WSS-400
114
473
0.0625
45WSS-400
62.6
383
0.0600
15WSS-500
101
450
0.0575
45WSS-500
66.4
310
0.0600
15WSS-650
50.1
119
0.1050
45WSS-650
45.8
161
0.0530
15WSS-800
34.1
161
0.1280
45WSS-800
37.8
107
0.0470
The loaded WO3 forms a surface over layer that reduces the surface diffusion of SnO2 and inhibits sintering (Iglesia et al., 1993) which leads to an increase in the surface area. For WO3 loading at ⩾ 35 wt.%, the formation of crystalline WO3 phase leads to a decrease in the surface area (Gregoio and Keller, 2004).
3.5 Surface acidity measurements
The surface acidity measurements of the prepared catalysts by means of potentiometric titration with n-butylamine (Bennardi et al., 2007; El-Sharkawy et al., 2007) were performed to estimate the amount of acid sites and their relative acid strengths. n-Butylamine is a strong base and can be adsorbed on to the acid sites of different strengths and types, thus it titrates both Lewis and Brønsted sites (Tanabe, 1981). On the other hand, the acid strengths of these sites may be classified according to the following scale (Cid and Pecchi, 1985; Sharma et al., 2004): Ei > 100 mV indicates very strong acid sites, 0 < Ei < 100 mV indicates strong acid sites, −100 < Ei < 0 indicates weak acid sites and Ei < −100 mV indicates very weak acid sites. Representative titration curves obtained for some catalysts are shown in Fig. 8. The computed amounts of the acid sites (mmol/g) as well as the values of Ei are listed in Table 3.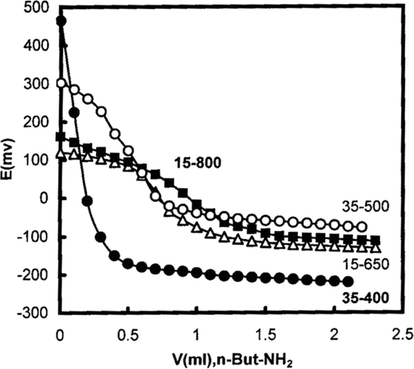
Potentiometric titration curves of some selected catalysts.
The results of the acidity measurements indicate that the strengths of the acid sites and the total surface acidity are both depend on calcination temperature and wt.%WO3 loading. The results reveal the following points: (i) SS and xWSS samples possess very strong acid sites, with Ei values in the range of 107–525 mV, except for SS-800 sample which possesses strong acid sites, Ei = 75 mV. (ii) The acid site strengths of SS and 5WSS samples are maxima for 500 °C products, whereas for the other catalysts the acid site strengths are decreased with an increase in the calcination temperature. (iii) The amount of the surface acidity show maxima at 400 °C for SS, 5WSS and 35WSS samples, whereas for 15WSS and 25WSS samples exhibit minimum acidity values at 500 °C, and in the same extend the surface acidity of 45WSS samples decreased gradually with raising the calcination temperature. (iv) Loading SS with 5 wt.%WO3 for 400 and 500 °C products causes an increase in the surface acidity; further increase of WO3 loading up to 25 wt.% causes a decrease of the surface acidity, which then shows maximum acidity value with 35 wt.%WO3 loading. (v) The amounts of surface acidity values for 650 and 800 °C products show maximum for 25 wt.%WO3 and 15 wt.%WO3 loading, respectively.
The FT-IR spectra of pyridine adsorbed on the prepared catalysts with different WO3 loadings that calcined at 500 °C as well as for 25WSS catalysts calcined at different temperatures are shown in Figs. 9 and 10, respectively. The spectra show absorption bands at 1400–1440 cm−1 for adsorbed pyridine by hydrogen bonds (Maksimov et al., 2000; Pizzio et al., 2003). The absorption bands appeared at 1458, 1509, 1562, 1580 and 1620 cm−1 are attributed to the pyridine adsorbed on Lewis acid sites (Tanabe, 1981; Villabrille et al., 2002; Rao et al., 2006). The bands at 1544, 1640 and 1650 cm−1 are due to the pyridine adsorbed on Brønsted acid sites with the formation of pyridinum ion (Tanabe, 1981; Villabrille et al., 2002; Pizzio et al., 2003; Khder and Ahmed, 2009). The entire spectra show a characteristic peak at 1490 cm−1 attributed to the adsorption of pyridine on Brønsted or/and Lewis acid sites (Khder and Ahmed, 2009; Tyagi et al., 2009). These results revealed that all the samples contain both of Lewis and Brønsted acid sites at different ratios depending on the WO3 content as well as on the calcination temperature. The same results show clearly that the intensities of the bands at 1544 and 1490 cm−1 are the highest for 25WSS catalyst. This sample was chosen hereafter to study the effect of calcination temperatures (Fig. 10). It is clear that the intensities of the bands at 1544 and 1640 cm−1 which attributed to pyridine adsorbed on Brønsted sites as well as the bands at 1490 cm−1 are maxima for the products calcined at 400 and 500 °C, also the bands at 1460 and 1580 cm−1 which ascribed the pyridine adsorbed on strong Lewis acid sites are maxima for the products calcined at 500 °C.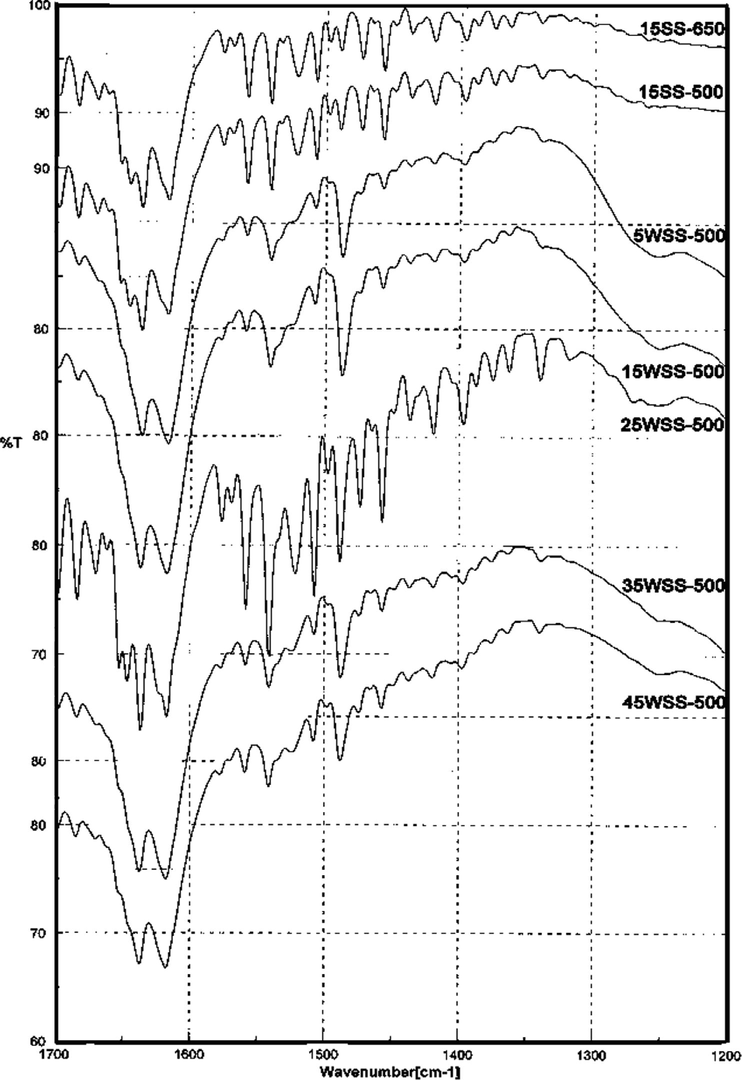
FT-IR spectra of pyridine adsorbed on xWSS catalysts calcined at 500 °C.
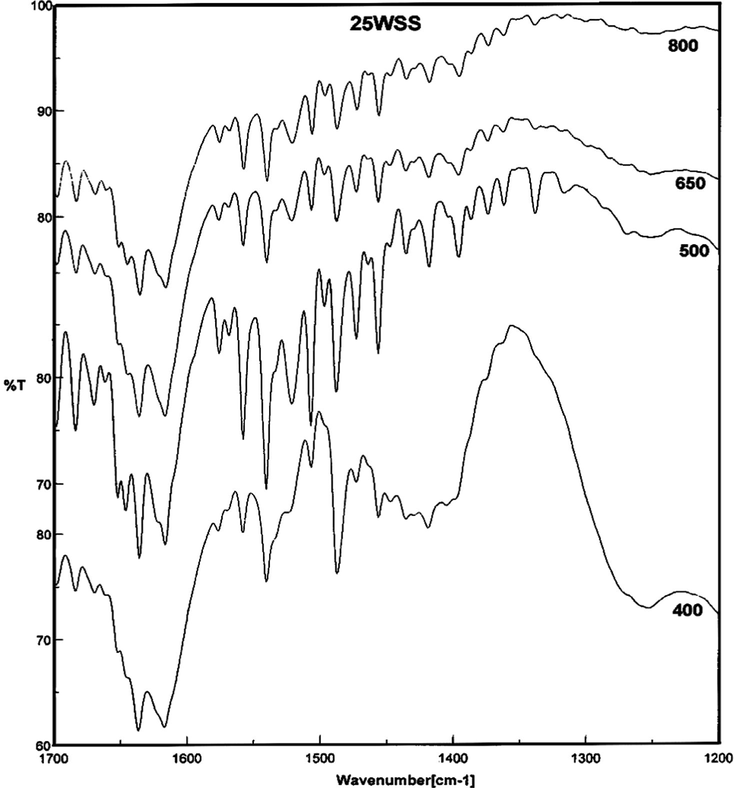
FT-IR spectra of pyridine adsorbed on xWSS catalyst calcined at different temperatures.
The generation of strong Lewis acidity by sulfate species may be due to the presence of surface sulfur complex which has a covalent S⚌O bond that acts as electron-withdrawing species followed by the inductive effect. Thus, the inductive effect of S⚌O makes the Lewis acid strength of Sn4+ stronger (Furuta et al., 2004), (see structure A in Scheme 1). In addition, the presence of water or OH-surface groups on the catalyst give Brønsted acid sites, and the adsorption of water molecules would convert Lewis acid sites into Brønsted acid sites. Furthermore, the addition of WO3 to the support (SS catalyst) followed by calcination, causes changes in the textural and acidic properties that lead to tungsten-support interaction. This interaction could occur by different ways. For example, WO3 could replace sulfate groups and interact directly with SnO2 surface and/or interact with sulfate groups, as illustrated in structures B and C in Scheme 1 (Khder and Ahmed, 2009). In view of the TG curves, Fig. 1, the final weight loss at temperatures between 500 and 800 °C is due to the decomposition of sulfate species that leads to the ultimate formation of SO3 moieties (Xia et al., 2002; Ahmed et al., 2008). The WO3 content clearly affects the decomposition of sulfate ions, increasing the WO3 loading decreases the percent weight loss. The same result was proven by the surface acidity and SBET values of the catalysts, the samples with higher WO3 content (⩾35 wt.%WO3) or higher calcination temperatures (⩾ 650 °C) show loss of acidity and SBET that is probably due to the agglomeration of crystalline WO3 on the surface.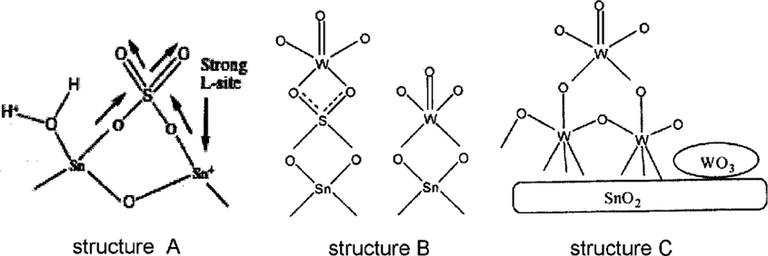
Possible structures of the catalyst surface.
3.6 Catalytic activity
The esterification of propionic acid with n-butanol is an electrophilic substitution reaction, and it is extremely slow since the rate is dependent on the autoprotolysis of the carboxylic acid (Lilja et al., 2002), and for the acceleration acid catalyst is generally utilized. The esterification reaction has been recorded to be a straight forward reaction that is subjected to general Brønsted acid catalysts (Sharma et al., 2004; Lilja et al., 2005; Ali et al., 2007), and in some cases recorded to be catalyzed by Lewis acid sites (Barbosa et al., 2006; Rao et al., 1979), or by both of Brønsted and Lewis acid sites (Wang and Li, 2004; Samantaray and Parida, 2003; Khder et al., 2008).
In general, the esterification reaction is dependent on: (i) temperature of reaction, (ii) catalyst amount, (iii) reactant proportion, (iv) stirrer speed and (v) operating pressure (Rao et al., 1979). During the course of this research, optimization of conditions i.e. reaction temperature, catalyst amount, reactant molar ratio, the content of WO3 in the catalyst and calcination temperature were all presented hereafter for the esterification of propionic acid with n- butanol over the prepared catalysts. All reactions were performed previously at optimized stirrer speed of 600 rpm (Ali et al., 2007).
3.6.1 Effect of reaction temperature
The reaction was studied over 25WSS-400 catalyst at reaction temperatures within the range of 50–110 °C. The reactions were performed at the molar ratio of 1:2 for acid/alcohol (PA:B), 0.2 g catalyst weight and 4 h reaction period.
The percentage conversion of propionic acid at different reaction temperatures is given in Table 4. The result shows 100% selectivity with n-butyl propionate as the only product. Kinetically, increasing the reaction temperature up to 90 °C increases the conversion of propionic acid very rapidly, further increase of temperature to 110 °C does not enhance the conversion, and only a very slight increase was observed. The increase of the temperature is well established to bring more collisions with sufficient energy (activation energy) to break the bonds, form products and thus subsequently result in higher values of propionic acid conversion (Ali et al., 2007). These conclude that the higher reaction temperature favors the formation of ester (Khder, 2008). A temperature of 90 °C was selected, hereafter, for subsequent experiments.
RT, °C
Con.%
Effect of RT
50
<1.00
70
13.16
80
41.76
90
83.02
110
83.75
3.6.2 Effect of catalyst amount
It is well known that the determination of catalyst weight is a critical measurement for the reaction in order to evaluate the available active sites for this reaction. The weight of the added catalyst (25WSS-400) was studied at 90 °C for reactant molar ratio of PA:B = 1:2 and reaction time of 4 h. The results show that the percentage conversion of propionic acid reaches 39.14%, 66.61% and 67.67% when the weight of the catalyst is 0.1, 0.2 and 0.3 g, respectively. The increase in conversion by an increase in the weight of the catalyst from 0.1 to 0.2 g is very high as compared to the reaction conversion when the weight increases from 0.2 to 0.3 g. For subsequent reaction catalyst weight of 0.2 g was selected as a standard.
3.6.3 Effect of reactant molar ratio
The percentage conversion of propionic acid at 90 °C over 0.2 g of 25WSS-400 catalyst was determined after 4 h reaction for the acid/ alcohol molar ratios of 1:1, 1:2 and 1:3, and found to be 66.61%, 83.02% and 52.89%, respectively. These results indicate that the optimum percentage conversion of propionic acid obtains at 1:2 M ratio of acid/alcohol. These observations are in agreement with esterification results of acetic acid with amyl alcohol over TPA/SnO2 catalysts (Khder, 2008) and sulfated tin oxide catalysts (Khder et al., 2008).
The decrease in catalytic activity may be explained on the basis of the fact that the increase in alcohol concentration hinders the esterification reaction by blocking the active sites on the catalyst surface or may be due to the dilution of propionic acid by excess alcohol. Thus, there is a competitive adsorption of the alcohol on the acid sites, which reduces the efficiency of the catalyst (Khder, 2008; Khder et al., 2008).
3.6.4 Effect of WO3 content and calcination temperature
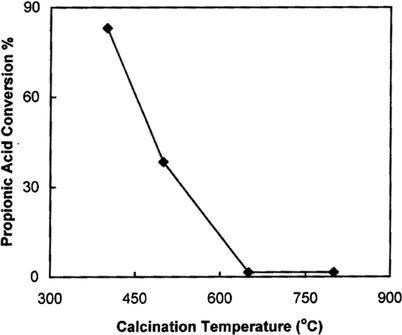
The effect of WO3 loading on 15 wt.%SO4/SnO2 catalyst was studied for the catalysts calcined at 400 and 500 °C. The reactions are performed for acid/alcohol molar ratio of 1:2 using 0.2 g catalyst at 90 °C reaction temperature for 4 h, and the resulting data are listed in Table 5 and represented in Fig. 11. The results can be summarized as follows; (i) SS catalyst shows high catalytic activity, this activity decreases slightly from 76.72% to 65.08% upon raising the calcination temperature from 400 to 500 °C, respectively. The high catalytic activity is due to the presence of very strong Brønsted acid sites. (ii) The catalytic activities of xWSS catalysts for 400 °C products are higher than those of 500 °C products. (iii) The xWSS catalysts calcined at 400 °C show a slight decrease in the percentage conversion of propionic acid from 77.69% to 71.38% when the wt.%WO3 loading increases from 5 wt.% to 15 wt.%. Further increase in WO3 loading to 25 wt.% causes an increase in the conversion to 83.02%, with a slight change for more WO3 loading. Furthermore, catalyst prepared at 500 °C and loaded with 5 wt.%WO3 causes a slight increase in the conversion, but further increase in WO3 loading causes a gradual decrease in the conversion of propionic acid to show minimum at 35 wt.% loading. (iv) The conversion of propionic acid over 25WSS catalysts that calcined at different temperatures (Fig. 12) always decreases with the raise of calcination temperature up to 650 °C to attain 1.55%, with no more change observed after. The low catalytic activity for ⩾ 650 °C products is due to the loss of Brønsted acid sites, the decomposition of sulfate and the sintering effect. The above results indicate that the esterification reaction of propionic acid with n-butanol is catalyzed mainly by Brønsted acid sites and to a lesser extent by Lewis acid sites.
Products calcined at 400 °C
Products calcined at 500 °C
Catalyst
Con.%
Catalyst
Con.%
SS
76.72
SS
65.08
5WSS
77.69
5WSS
70.41
15WSS
71.38
15WSS
50.04
25WSS
83.02
25WSS
38.40
35WSS
77.20
35WSS
29.18
45WSS
81.57
45WSS
35.01
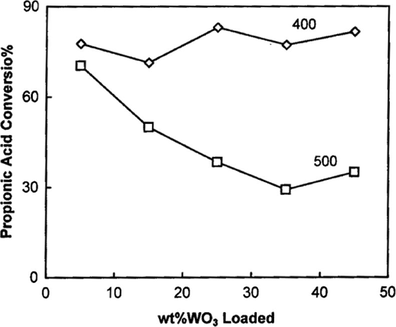
Effect of WO3 content on catalytic activity over xWSS catalysts calcined at 400 and 500 °C.
Effect of calcination temperature on the catalytic activity over 25WSS catalyst.
The prepared xWSS catalysts especially that calcined at 400 °C are more efficient for esterification of propionic acid with n-butanol than other reported solid acid catalysts. For example, the formation of n-butyl propionate over cation exchange resins (Amberlyst) and zeolite HZSM-5 catalysts (Liu and Tan, 2001) attains 30–56% conversion, whereas applying the same reaction conditions (PA:B = 1:1, reaction temperature 110 °C for 4 h) using 25WSS-400 catalyst prepared during the course of this research attains 66.61% conversion. Also, the formation of n-butyl propionate over heteropolyacid supported onto natural alumina (Sharma et al., 2004) measures 26–33% conversion, whereas over 25WSS-400 catalyst attains 41.76% conversion at the same reaction conditions (PA:B = 2:1, reaction temperature of 80 °C for4 h).
4 Conclusions
The load of 15 wt.% /SnO2 with 5–45 wt.%WO3 affects the physicochemical properties and catalytic activities of the prepared catalysts. These properties depend on the loading percentage as well as on the calcination temperature. The presence of both sulfate ions and WO3 hinders the crystallization of SnO2. Additionally, loaded WO3 material dispersed completely over the support when the percentage of loading is ⩽25 wt.%. The decomposition of sulfate ions occurs at >500 °C. The loading of WO3 on the support causes a decrease in the specific surface area and at the same time changes the surface acidity. The prepared catalysts are nanocrystalline and possess very strong acidic sites, and contain both Brønsted and Lewis acid sites.
The eco-friendly xWSS catalysts are active for the esterification of propionic acid with n-butanol. The catalytic activity is highest for 400 °C products, 25 wt.% loading, reactant molar ratio PA:B = 1:2 and reaction temperature of 90–110 °C. Both of Brønsted and to a lesser extent Lewis acid sites proved to be essential for catalytic formation of n-butyl propionate.
Acknowledgment
The authors would like to thank Dr Nael G. Yasri, University of Aleppo (Syria), for technical assistance.
References
- Structural characterization of sulfated zirconia and their catalytic activity in dehydration of ethanol. Colloids Surface A: Physicochem. Eng. Aspects. 2008;317(1–3):62-70.
- [Google Scholar]
- Synthesis of esters: development of the rate expression for the Dowex 50 Wx8-400 catalyzed esterification of propionic acid with 1-propanol. Chem. Eng. Sci.. 2007;62:3197-3217.
- [Google Scholar]
- Preparation of superacids by metal oxides for reactions of butanes and pentenes. Appl. Catal. A: Gen.. 1996;146:3-32.
- [Google Scholar]
- One-step synthesis and characterization of ZrO2–WO3 prepared by hydrothermal method at autogenous pressure. J. Mater. Chem.. 2003;13:143-149.
- [Google Scholar]
- Esterification of 1° and 2° alcohol using an ecofriendly solid acid catalyst comprising 12-tungstosilicic acid and hydrous zirconia. J. Mol. Catal. A: Chem.. 2005;238:223-228.
- [Google Scholar]
- Solvent free esterification reactions using Lewis acids in solid phase catalysis. Appl. Catal. A: Gen.. 2006;313(2):146-150.
- [Google Scholar]
- Supported trifluromethanesulfonic acid as catalyst in the synthesis of flavone and chromone derivatives. Appl. Catal. A: Gen.. 2007;324:62-68.
- [Google Scholar]
- Potentiometric method for determining the number and relative strength of acid sites in colored catalysts. Appl. Catal.. 1985;14:15-21.
- [Google Scholar]
- Direct oxidation of n-heptane to ester over modified sulfated SnO2 Catalysts under mild conditions. J. Hazard. Mater.. 2007;147:800-805.
- [Google Scholar]
- Esterification of acetic acid with n-butanol over manganese nodule leached residue. J. Mol. Catal. A: Chem.. 2007;266:88-92.
- [Google Scholar]
- Structural characterization and catalytic activity of molybdenum oxide supported zirconia catalysts. Microporous Mesoporous Mater.. 2007;102:128-137.
- [Google Scholar]
- Thermal decomposition of ammonium paratungstate tetrahydrate under non-reducing conditions, characterization by thermal analysis, X-ray diffraction and spectroscopic methods. Thermochim. Acta. 2008;469:12-22.
- [Google Scholar]
- A reinvestigation of thermal decomposition of ammonium paratungstate. J. Mater. Sci.. 1981;16(2):3427-3436.
- [Google Scholar]
- Catalytic action of sulfated tin oxide for etherification and esterification in comparison with sulfated zirconia. Appl. Catal. A: Gen.. 2004;269:187-191.
- [Google Scholar]
- Activation and isomerization of hydrocarbons over WO3/ZrO2 catalysts: I- Preparation, characterization, and X-ray photoelectron spectroscopic studies. J. Catal.. 2004;225:45-55.
- [Google Scholar]
- Effects of the SO4 groups on the textural properties and local order deformation of SnO2 rutile structure. Langmuir. 2004;20(10):4265-4271.
- [Google Scholar]
- Meta- Stannic acid as an effective support for the preparation of sulfated and tungstated stannias. Appl. Catal. A: Gen.. 2007;321:147-154.
- [Google Scholar]
- Isomerization of alkanes on sulfated zirconia: promotion by Pt and by adamatyl hydride transfer species. J. Catal.. 1993;144:238-253.
- [Google Scholar]
- A high efficient catalyst for the esterification of acetic acid using n-butyl alcohol. J. Mol. Catal. A: Chem.. 2005;239(1–2):146-154.
- [Google Scholar]
- Surface characterization and catalytic activity of sulfated tin oxide catalyst. Catal. Commun.. 2008;9:769-777.
- [Google Scholar]
- Preparation, characterization and catalytic activity of tin oxide-supported 12-tungstophosphoric acid as a solid catalyst. Appl. Catal. A: Gen.. 2008;343:109-116.
- [Google Scholar]
- Selective nitration of phenol over nanosized tungsten oxide supported on sulfated SnO2 as a solid acid catalyst. Appl. Catal. A: Gen.. 2009;354(1-2):153-160.
- [Google Scholar]
- Esterification of alcohols with acetic acid over zeolites Hβ, HY and HZSM5. Appl. Catal. A: Gen.. 2006;299:185-192.
- [Google Scholar]
- Kinetics of catalytic esterification of propionic acid and n-butanol over Amberlyst 35. Ind. Eng. Chem. Res.. 2002;41:2882-2887.
- [Google Scholar]
- Kinetics of esterification of propionic acid with methanol over fibrous polymer-supported sulphonic acid catalyst. Appl. Catal. A: Gen.. 2002;228:253-267.
- [Google Scholar]
- Esterification of propionic acid with ethanol, 1-propanol and butanol over a heterogeneous fiber catalyst. Chem. Eng. J.. 2005;115:1-12.
- [Google Scholar]
- Effect of carbon chain length on esterification of carboxylic acids with methanol using acid catalysis. J. Catal.. 2006;243:221-228.
- [Google Scholar]
- Liquid-phase esterification of propionic acid with n-butanol. Ind. Eng. Chem. Res.. 2001;40:3281-3286.
- [Google Scholar]
- Synthesis and study of acid catalyst 30%WO3/SnO2. J. Mol. Catal. A: Chem.. 2000;158:435-438.
- [Google Scholar]
- Solid catalyst treated with anion: XIX. Synthesis of the solid superacid catalyst of tin oxide treated with sulfate ion. Appl. Catal.. 1990;59:205-212.
- [Google Scholar]
- Silicotungstic acid supported zirconia: An effective catalyst for esterification reaction. J. Mol. Catal. A: Chem.. 2007;275:77-83.
- [Google Scholar]
- Supported Keggin type heteropolycompounds for ecofriendly reactions. Appl. Catal. A: Gen.. 2003;256:125-139.
- [Google Scholar]
- Esterification of 1-butanol with propionic acid in a stirred tank batch reactor. Chem. Petro-Chem. J. 1979:7-12.
- [Google Scholar]
- Structure and reactivity of zirconium oxide-supported ammonium salt of 12-molybdophosphoric acid catalysts. Appl. Catal. A: Gen.. 2006;300:139-146.
- [Google Scholar]
- Dependence of nanocrystalline SnO2 particle size on synthesis route. J. Non-Crystal Solids. 2002;303(2):270-280.
- [Google Scholar]
- Synthesis, characterization and optical properties of tin oxide nanoclusters prepared from a novel precursor via thermal decomposition route. Inorg. Chim. Acta. 2010;363(8):1719-1726.
- [Google Scholar]
- SO42-/TiO2-SiO2 mixed oxide catalyst, 3. An eco-friendly catalyst for esterification of acetic acid. React. Kinet. Catal. Lett.. 2003;78:381-387.
- [Google Scholar]
- Investigation of the catalytic efficiency of a new mesoporous catalyst SnO2/WO3 towards oleic acid esterification. J. Mol. Catal. A: Chem.. 2010;327:73-79.
- [Google Scholar]
- Heteropolyacid supported onto neutral alumina: characterization and esterification of 1° and 2° alcohol. J. Mol. Catal. A: Chem.. 2004;214(2):281-286.
- [Google Scholar]
- New solid superacid catalyst prepared by doping ZrO2 with Ce and modifying with sulfate and its catalytic activity for acid catalysis. Catal. Today. 2006;116(2):143-150.
- [Google Scholar]
- Solid acid and base catalysts. In: Anderson J.R., Boudart M., eds. Catalysis Science and Technology. Vol vol. 2. Berlin, Heidelberg and New York: Springer-Verlag; 1981. p. :231-273. Ch. 5
- [Google Scholar]
- Application of zeolite membranes to esterification reactions. Catal. Today. 2001;67(1–3):121-125.
- [Google Scholar]
- Solvent free synthesis of 7-isopropyl-1, 1-dimethyltetralin by the rearrangement of longifolene using nanocrystalline sulfated zirconia catalyst. J. Mol. Catal. A: Chem.. 2009;301:67-78.
- [Google Scholar]
- Equilibrium adsorption of molubdosilicic acid solution on carbon and silica: basic studies for the preparation of ecofriendly acidic catalysts. J. Colloid Interface Sci.. 2002;251:151-159.
- [Google Scholar]
- Kinetics of acetic acid esterification with 2-ethoxyethanol over an Al-pillared clay catalyst. React. Kinet. Catal. Lett.. 2004;83:195-203.
- [Google Scholar]
- Effect of ZrO2 loading on the structure, acidity and catalytic activity of the SO42-/ZrO2/MCM-41 acid catalyst. J. Catal.. 2002;205(2):318-331.
- [Google Scholar]
- Heterogeneous catalysis in esterification reactions: Preparation of phenethyl acetate and cyclohexyl acetate by using a variety of solid acids. Ind. Eng. Chem. Res.. 1994;33:2198-2208.
- [Google Scholar]
- Structure of acid sites on sulfur-promoted iron oxide. J. Phys. Chem.. 1986;90(14):3148-3152.
- [Google Scholar]
- Synthesis and characterization of nanocrystalline tin oxide by sol–gel method. J. Solid State Chem.. 2004;177:1425-1430.
- [Google Scholar]


