

Translate this page into:
Preperation of sodium alginate-based SA-g-poly(ITA-co-VBS)/RC hydrogel nanocomposites: And their application towards dye adsorption
⁎Corresponding author. alkaimayad@gmail.com (Ayad F. Alkaim)
-
Received: ,
Accepted: ,
This article was originally published by Elsevier and was migrated to Scientific Scholar after the change of Publisher.
Abstract
Abstract
A superabsorbent polymer, Sodium Alginate-g-Poly (Itaconic acid-co-Sodium 4-vinyl benzenesulfonate)/ Ricinus communis (SA-g-P(ITA-co-VBS)/ RC) hydrogel, was prepared by free-radical graft co-polymerization for sequestration of toxic malachite green (MG) dye as a cationic dye model. The surface morphological of shape and composition of the prepared hydrogel used have been characterized by FESEM, EDX, TEM, FTIR, X-ray diffraction XRD, and TGA. Optimizing the synthesis conditions for prepared a hydrogel with the highest swelling ratio have been studied, the results show that employing 0.08 g KPS and 0.09 g MBA, 1.0 g ITA, 2.0 g VBS, 1.0 g SA, and 1.0 g RC, the composites greatest swelling capacity in distilled water was 3400 %. It was discovered that the dye adsorption capacity of the polymer was greatly impacted by the monomer VBS level in the hydrogel, which gives it a better ability to swell. The porosity of the hydrogel spheres, thus significantly enhancing the MG adsorption capacity with the rate-limiting controlled by chemical adsorption, intraparticle diffusion, and film diffusion. Study the influence of different reaction conditions on the removal of MG dye from aqueous solution are adsorbent dose, pH, zero-point charge, temperature, thermodynamic adsorption, adsorption isotherm, and kinetic models have been done. Additionally, (SA-g-P(ITA-co-VBS)/RC) demonstrated strong MG dye adsorption capabilities and reusability in at least four adsorption-desorption cycles this process indicating its considerable potential for use as the adsorbent for dye removals from aqueous solution.
Keywords
Adsorption
Super-adsorbent
Swelling
Sodium alginate
Itaconic acid
Hydrogel

1 Introduction
Widespread use of dyes in the textile, tannery, paper, paint, and other sectors results in large amounts of wastewater containing dye (Hairong et al., 2021). Malachite green MG is cationic (basic) dye, IUPAC 4-([4-(Dimethyl amino) phenyl](phenyl)methylidene)-N,N-dimethylcyclohexa-2,5-dien-1-iminium chloride,Other names, Basic green 4; Aniline green; Diamond green B; Victoria green B, Molar mass: 364.911 g/mol و Chemical formula: C23H25ClN2 (chloride), MG is traditionally used as a dye for materials such as silk, leather, paper and antimicrobial in aquaculture (Ahmad and Alrozi, 2011). Its application extents in the aquaculture, commercial fish hatchery and animal husbandry as an antifungal therapeutic agent, while for human it is used as antiseptic and fungicidal. However, its oral consumption is carcinogenic. The available toxicological information reveals that in the tissues of fish and mice MG easily reduces to persistable leuco-Malachite Green, which acts as a tumor promoter. Thus, the detection of MG in fishes, animal milk and other food stuff designed for human consumption are of great alarm for the human health. Studies also confirm that the products formed after the degradation of MG are also not safe and have carcinogenic potential. Thus it becomes necessary to remove such a toxic dye from wastewater before it released into aquatic environment (Bello et al., 2012; Peter et al., 2023; Tianyu et al., 2023).
Due to its affordability, ease of use, high efficacy, and environmental friendliness, adsorption is one of the most widely utilized treatment methods. Many adsorbents, including clay, hydrogel, activated carbon, and graphene oxide, have been employed (Aljeboree et al., 2019; Raoudha, 2022). Hydrogels are as known superabsorbent polymers smart materials due to their many-sided and bio-compatible characteristics. They are three-dimensional cross-linked network systems made of polymers that are soluble in water yet inflate when exposed to it. This allows them to absorb water and biological fluids into their structure without losing their structural integrity. They can absorb water because the polymer chain contains hydrophilic groups like –OH, –CONH, –CONH2, –COOH, and -SO3H(Chenxi, 2022; Sevda et al., 2021). They are capable of absorbing additional biological fluids, and their enlarged state allows them to retain a lot of fluids. Have attracted major regard for biomedical, environmental, energy, and engineering applications due to their rise in water absorptivity and bio-compatibility. Although numerous kinds of hydrogels has been developed, there is still a requirement for hydrogels that are non-toxic, ecologically friendly (eco-friendly), and facilely prepared with desired properties(Hemant et al., 2021). Many inorganic clay minerals, such as kaolin, bentonite, and attapulgite, as well as natural polymeric materials, such as polysaccharides (sodium alginate, starch, cellulose, and chitosan), have been used to create eco-friendly organic–inorganic superabsorbent composites to lower production costs and improve performance (El Shafey et al., 2021; Soulaima et al., 2021). Itaconic acid (ITA) is an unsaturated monomer acid that has two ionizable groups that allow for the formation of hydrogen bonds. Itaconic acid (ITA) is typically derived from sustainable feedstocks and resembles carbohydrate resources like hydrolyzed starch (Dijana et al., 2016; Parisa et al., 2022; Thiemo, 2017) The nature of the imbibing feature of hydrogels can be improved by a small amount of itaconic acid monomer. Additionally, itaconic acid exhibits outstanding absorption qualities in the fields of polymer chemistry, environmental chemistry, pharmaceuticals, drug delivery, and agriculture(Issa and Elena, 2001; Juy et al., 2010; Tao et al., 2023).
In this study, a surface Sodium Alginate-g-Poly (Itaconic acid-co-Sodium 4-vinyl benzenesulfonate)/ Ricinus communis (SA-g-P(ITA-co-VBS)/ RC) hydrogel. The prepared surface was used for efficient dye adsorption and removal with rapid separation, pH sensitivity, efficient adsorption, and reusability. The adsorption kinetics, adsorption thermodynamics and other features were explored via adsorption experiments with simulated dye wastewaters. Finally, the adsorption rate and mechanism were investigated by using adsorption kinetics, isotherms, and thermodynamics models.
2 Experimental part
2.1 Materials
All the chemical reagents utilized in the polymer synthesis: from Sigma-Aldrich, such as Sodium alginate (SA, Formula: C6H9NaO7, Molar mass: 216.12 g/mol, purity: 99.8 %), Itaconic acid (ITA, Formula: C5H6O4, Molar mass: 130.099 g/mol, purity 99.%), N, N′-methylene bisacrylamide (MBA, Formula: C7H10N2O2, Molar mass: 154.169 g/mol, purity:98 %) was used as the cross-linking agent, potassium persulphate (KPS, Formula: K2S2O8, Molar mass: 270.322 g/mol, purity:98.8 %) was used as the initiator. Sodium hydroxide (NaOH), hydrochloric acid (HCl), acetone(C3H6O), and malachite green (MG) were obtained from Sigma-Aldrich. No pretreatment was applied to the compounds, and all solutions were made in distilled water.
2.2 Preparation of activated carbon (AC)
The Ricinus communis (RC) commonly known as castor plant is a perennial shrub, obtained from farms in Iraq. Initially, Ricinus communis (RC) leaves are washed with distilled water to get rid of suspended dust, then dried in the sun and ground to obtain a powder-sieved particle size of 25–––50 µm. To prepare of acid-activated carbon of Ricinus communis (ACRC). About 100 g were impregnated with 4 % HCl with stirring for about 2 h. and washed in distilled water several times to remove the residual acid from pores of carbon until the pH reached 7 ± 0.3. Then it was dried in the oven at 60 ± 5 °C for 24 h. Finally, the material is burned at a temperature (300 °C) for 2 hr to obtain activated carbon (ACRC). Then ground, sieved to get the particle size of 25–––50 µm, (ACRC) was stored in a bottle and airtight to apply in experiments.
2.3 Preparation of (SA-g-P(ITA-co-VBS)/ RC) hydrogel
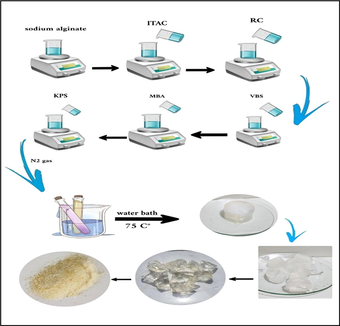
Synthesis of super-absorbent (SA-g-P(ITA-co-VBS)/ RC) hydrogel. A series of hydrogel utilizing several amounts of sodium alginate, initiator, cross-linked, monomers (ITA, VBS), and Ricinus communis (RC) were prepared in the following way: Sodium alginate SA (0.1–2) g was dissolved in deionized water 20 ml was taken in a 250 ml beaker and magnetic stirrer for 1 hr at 600 rpm. Suitable amounts of RC (0–2 g) were added with stirring to form a solution and after stirring 10 min, (0.5-2g) of Itaconic acid ITA was dissolved in 10 ml of deionized water, a certain amount of VBS (0.5–3 g), N, N’-methylene-bis-acrylamide (MBA) (0.005–0.1 g) and potassium persulfate KPS (0.03–0.1 g), dissolved in 3 ml of water were added. The following step involved a 2-hour free radical copolymerization reaction at 75 °C. It has been determined that the creation of the transparent, insoluble hydrogel known as (SA-g-P(ITA-co-VBS)/RC). To obtain particles with the sizes of 180–425 µm for the swelling and dye adsorption tests as shown in Scheme 1, the hydrogel was thoroughly washed with an ethanol/water mixture (4:1 v/v), dried in an oven, and sieved. The mechanism of SA-g-P(ITA-co-VBS)/RC is then proposed as shown in Scheme 2. The (SA-g-P(ITA-co-VBS)/RC) hydrogel was optimized for improved swelling in water by varying several reaction parameters, including reaction contact time, temperature variation, solvent volume, pH, and quantity variations of monomer, initiator, and cross-linker.
Preparation of (SA-g-P(ITA-co-VBS)/ RC) Hydrogel.
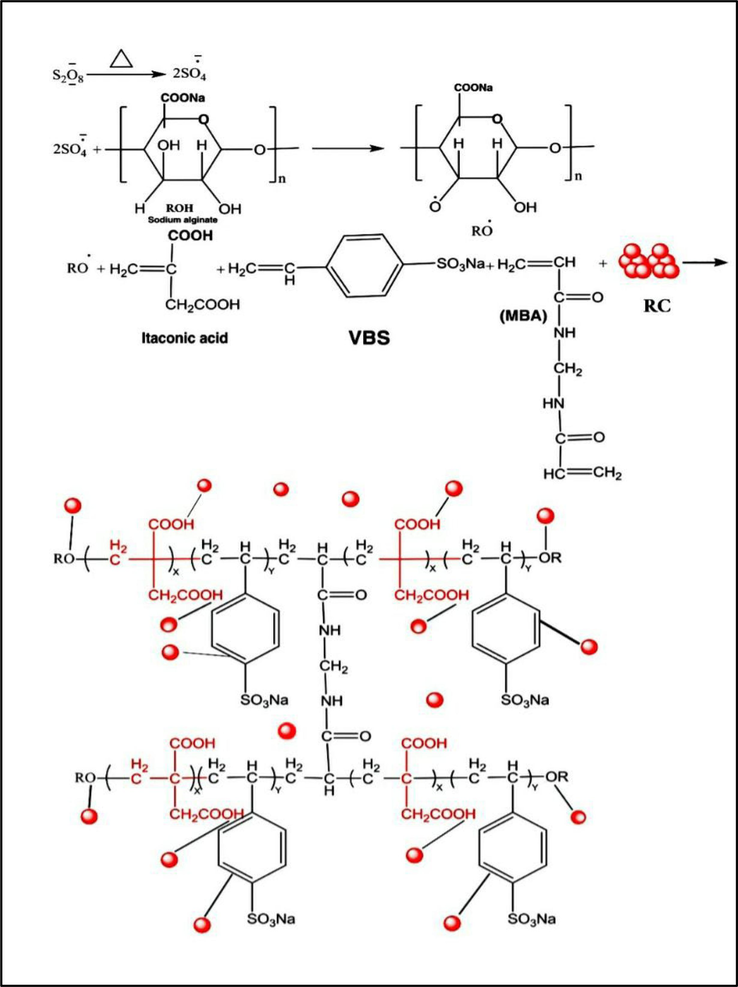
Mechanism of SA-g-P(ITA-co-VBS)/RC Hydrogel.
2.4 Swelling studies of (SA-g-P(ITA-co-VBS)/ RC) hydrogels
The pre-weighted (SA-g-P(ITA-co-VBS)/RC) hydrogel was stored in deionized water for 24 h at 25 °C without any interruption. After being blotted using filter paper to remove excess water, the swollen (SA-g-P(ITA-co-VBS)/ RC) hydrogel was weighed. The swollen (SA-g-P(ITA-co-VBS)/RC) hydrogel was weighed using an analytical weighing scale. The following equation was used to calculate the maximum swelling percentage:
While Wd stands for the weight of the dried (SA-g-P(ITA-co-VBS)/ RC) hydrogel, Ws stands for the weight of the swelling hydrogel.
2.5 Adsorption studies
Malachite Green MG dye was chosen as the model cationic dye to study the adsorption characteristics of (SA-g-P(ITA-co-VBS)/ RC) super-absorbent hydrogel from the aqueous solution using the batch method. To conduct equilibrium adsorption tests, 0.05 g of hydrogel was added to 100 ml of MG dye solution after one hour. The effect of several parameters like initial MG dye concentration, Temperature, pH solution, zero-point charge, and the adsorbent dose was studied and optimized. The initial concentration was picked at 700 mg/L for the studies of temperature, PH solution, co-monomer ratio, adsorbent dose, and regeneration. solution pH (adjusted by 0.1 N NaOH or HCl solutions). The solutions were then placed in a shaker water bath with rpm 200 at 25 °C. After 1 h, solutions of MG dye were centrifuged and then analyzed using a UV–Vis spectrophotometer at λmax = 625 nm. The percentage removal % and adsorption efficiency of MG calculate by equations (2),3:
2.6 Determination of point zero charge (pHpzc) of SA-g-P(ITA-co-VBS)/ RC hydrogel
The point at which a hydrogel surface has a potential zero charge is known as its zero-point charge (pHpzc). By using a pH titration technique, the pHpzc was determined. Each conical flask solution pH value was changed to a range of 2–10 by adding 0.1 N NaOH and HCl solution. The hydrogel was submerged in the prepared solutions, agitated at 120 rpm, and kept at room temperature (25 °C) for 24 h before the pH of the final solution was recorded. The value of pHpzc is the point where the curve pH final vs pH initial crosses the line pH initial = pH final.
2.7 Characterization
Several contemporary techniques, including FESEM, EDX, FTIR, TGA, TEM, and XRD, were used to characterize the SA-g-P(ITA-co-VBS)/RC) hydrogel. Transform infrared spectroscopy (FTIR) was used to study the functional groups and structure of the hydrogel as it was initially synthesized, and scans between 400 and 4000 cm−1 were made. Field-emission scanning electron microscopy (FESEM) was utilized to acquire the morphologies of the surface and the cross-section of their interior structure. An energy-dispersive X-ray spectroscopy (EDX) examination was then employed to ascertain the composition of the hydrogel. The crystalline properties of the prepared hydrogel were identified using the X-ray diffraction (XRD) technique with a diffraction angle between (10°-90°). To calculate the weight changes in the hydrogel from room temperature up to 600 °C under N2 at a heating rate of 5 °C/min, the thermogravimetric analysis (TGA) method was used.
3 Result and discussion
3.1 Characterization of obtained (SA-g-P(ITA-co-VBS)/ RC) hydrogel samples
Field-emission scanning electron microscopy (FESEM) and transmission electron microscopy (TEM) were used to observe the morphology and particle size of the fabricated hydrogel. Fig. 1 shows an FESEM image of RC, (SA-g-P(ITA-co-VBS)), (SA-g-P(ITA-co-VBS)/ RC) and MG adsorbed (SA-g-P(ITA-co-VBS)/ RC) hydrogel. The RC was found to have a homogeneous and smooth surface with no irregularities (Fig. 1(a)). The FESEM image of (SA-g-P(ITA-co-VBS) exhibited a three-dimensional porous network structure with interconnected channels of pores and a much rougher surface (Fig. 1(b)). It is seen in the FESEM image of (SA-g-P(ITA-co-VBS)/ RC) that it has a layered morphology and appears comparatively less uniformity and more roughness after the attachment of RC with the hydrogel and the considerably high adsorption efficiency of (SA-g-P(ITA-co-VBS)/ RC) was due to the presence of these interconnected channels of pores in its structure (Fig. 1(c)). After the adsorption of MG dye, the surface area of hydrogel becomes rough representing the successful surface adsorption (Fig. 1(d)). Fig. 1(e-g) shows TEM images of RC, (SA-g-P(ITA-co-VBS), and (SA-g-P(ITA-co-VBS)/ RC). It can be seen that RC exhibited a spherical shape, also (SA-g-P(ITA-co-VBS) appears as irregular balls along with some patchy shapes and tends to form chain-like totals at 50 nm. Moreover, the surface of the (SA-g-P(ITA-co-VBS)/ RC) is covered by a transparent layer, where RC was observed embedded inside the (SA-g-P(ITA-co-VBS)/ RC) and RC plays a pivotal role in improving stability and increase surface area as a requisite constituent of synthesize eco-friendly hydrogel. EDX analysis was performed to investigate the elemental composition of (SA-g-P(ITA-co-VBS)/ RC). As observed from (Fig. 1(h)), Ca, C, and O peaks confirm the formation of (SA-g-P(ITA-co-VBS)/ RC). Moreover, the Ca, C, and O contents were found to be 6.46 %, 49.48 %, and 44.04 %, respectively (Vaishnavi et al., 2024).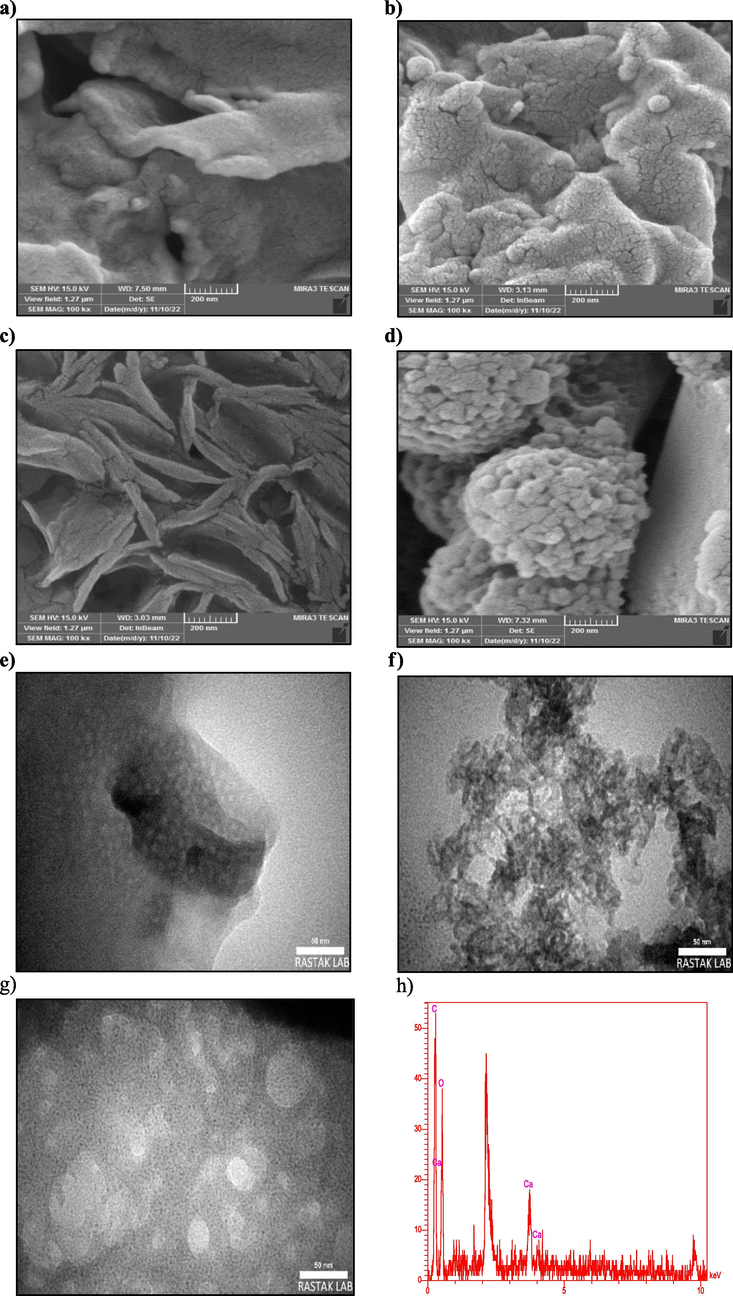
FESEM images of (a) RC, (b) (SA-g-P(ITA-co-VBS), (c) (SA-g-P(ITA-co-VBS)/ RC), (d) MG loaded (SA-g-P(ITA-co-VBS)/ RC), (e) TEM images of RC, (f) (SA-g-P(ITA-co-VBS), (g) (SA-g-P(ITA-co-VBS)/ RC) and (h) EDS of (SA-g-P(ITA-co-VBS)/ RC).
The thermal stability was investigated by the TGA technique of RC, (SA-g-P(ITA-co-VBS, and (SA-g-P(ITA-co-VBS)/ RC) as shown in Fig. 2. The temperature range of 200–283 °C was primarily where SA lost weight. With a weight loss of 40.02 % caused by the SA molecule decomposition, the maximum decomposition temperature was 251 °C. The first and second weight losses were from SA thermal disintegration, while the functional groups of ITA and VBS broke down at temperatures between 30 and 140 °C as a result of the loss of adsorbed water and the branched chains release of CO2. The decomposition third at 330 to 600 °C with weight loss of 43.7 % (SA-g-P(ITA-co-VBS and 21.5 % (SA-g-P(ITA-co-VBS)/ RC) implying the loss of cross-linked network structure and formation of the anhydride with the removal of water molecules from the carboxylic groups of polymer chains. Fig. 3 demonstrates that (SA-g-P(ITA-co-VBS)/RC) decomposes at a slower rate than (SA-g-P) (ITA-co-VBS). According to the TGA data, the RC might act as a thermal barrier, increasing the thermal stability of hydrogel(Shweta et al., 2022; Sourbh, 2018).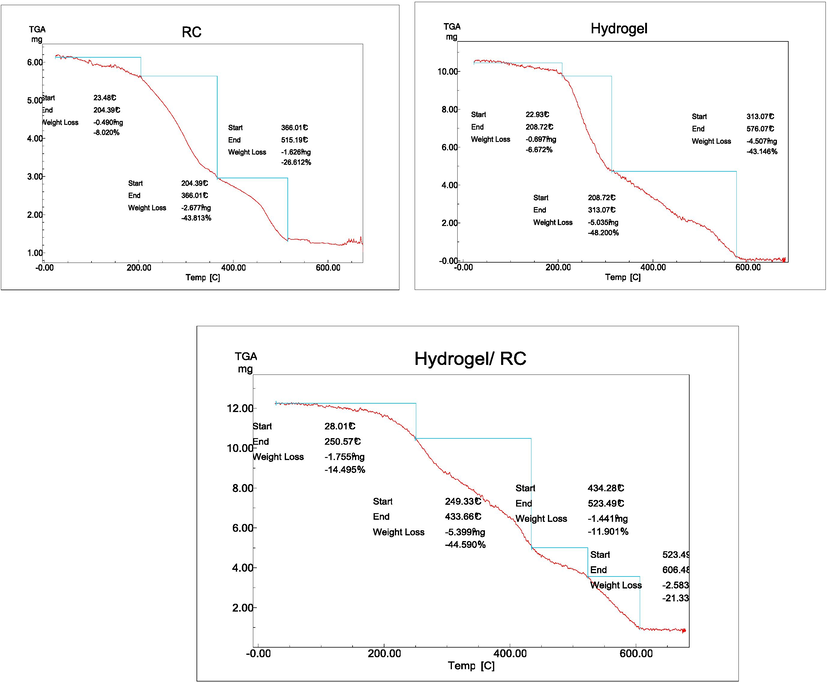
TGA analysis curve of the RC, hydrogel, hydrogel/RC.
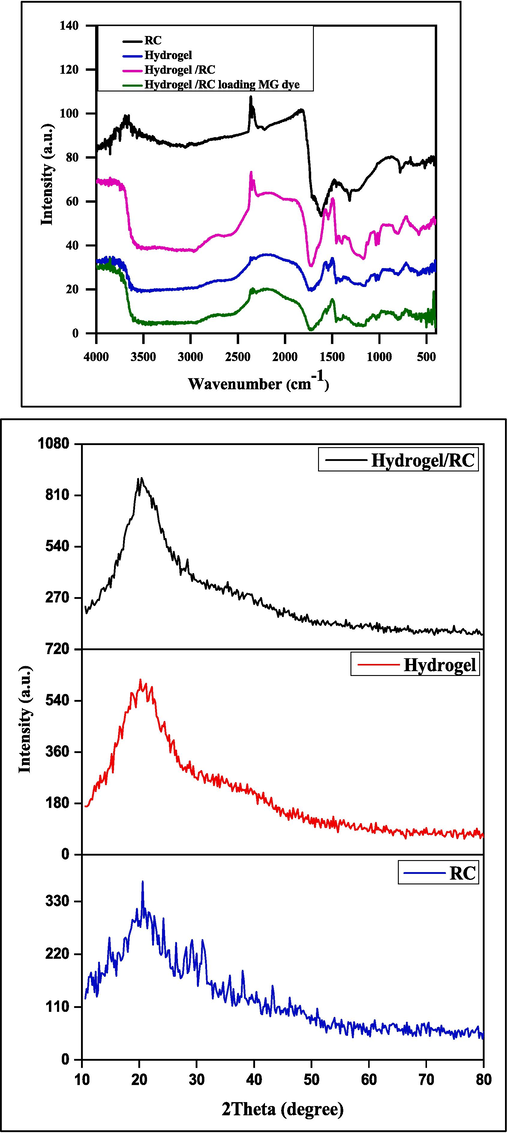
FTIR analysis (a) for RC, and (SA-g-P(ITA-co-VBS), and (SA-g-P(ITA-co-VBS)/ RC) before and after adsorption of MG dye and (b) XRD analysis for RC, and (SA-g-P(ITA-co-VBS), and (SA-g-P(ITA-co-VBS)/ RC).
FTIR spectra of RC, (SA-g-P(ITA-co-VBS), (SA-g-P(ITA-co-VBS)/ RC) and, MG loaded-hydrogel as shown in Fig. 3. It is observed that there is a broad peak in the spectrum at 2500 to 3600 cm−1 in the spectrum of alginate and is attributed to the –COOH groups, and little change was observed in peak intensity after modification of alginate with RC (Zhao et al., 2017). The peak in the region of 3300–2500 cm-1 may belong to –OH in carboxyl. Peaks near, 3500 cm-1 area can be related to free –OH and water in organic compounds.
The grafting of ITA on SA is supported by a new characteristic adsorption band 1720 cm−1, assigned to C = O stretching of poly (Itaconic acid) in the spectrum of SA-g-P(ITA-co-VBS)/ RC. Moreover, the RC of the broad band at 1600 cm−1 is assigned to the stretching band of (C = O) groups (Noor et al., 2017).
The XRD patterns of RC, (SA-g-P(ITA-co-VBS), and (SA-g-P(ITA-co-VBS)/ RC) are shown in Fig. 3. RC appears at one dispersion peak at 2θ = 18.6° due to its semi-crystallinity. thus (SA-g-P(ITA-co-VBS)/ RC), soft and weakened peaks appear at 2θ = 18.6, and 20°. This shows the semi-crystallinity structure of the (SA-g-P(ITA-co-VBS)/ RC), also results show the amorphous peack of RC have been merge with a peaks of hydrogel prepared to give higher intensity as in Fig. 3 b. These characteristic peaks disappeared in the XRD patterns of the (SA-g-P(ITA-co-VBS) and a new weak dispersion peak appeared at 2θ = ∼21.0°, indicating that graft copolymerization weakened the structure of hydrogel (Muhammad and Jalal-ud-Din, 2014; Noor et al., 2017).
3.2 Optimization of the swelling behavior for the synthesis of (SA-g-P(ITA-co-VBS)/ RC) hydrogel
3.2.1 Effect of RC amount on the swelling behavior
The impact of RC quantity on water absorption is seen in Fig. 4a. When the amount of RC was increased from 0.1 to 2 wt%, the hydrogel water absorption initially increased and then dropped. Chemical cross-linking between RC and a polymer chain could create a cross-linked polymer network with RC particles serving as additional cross-linking points. The presence of the RC particles reduces the physical entanglement of the grafted polymer network chain and weakens the hydrogen-bonding connection between the polymer carboxyl groups. However, with excessive RC (>1 wt%), the additional RC particles enhanced the degree of cross-linking, reducing the water molecules’ penetration space. Furthermore, generating hydrogel with a high water swelling capacity requires proper RC loading (Mengna et al., 2021).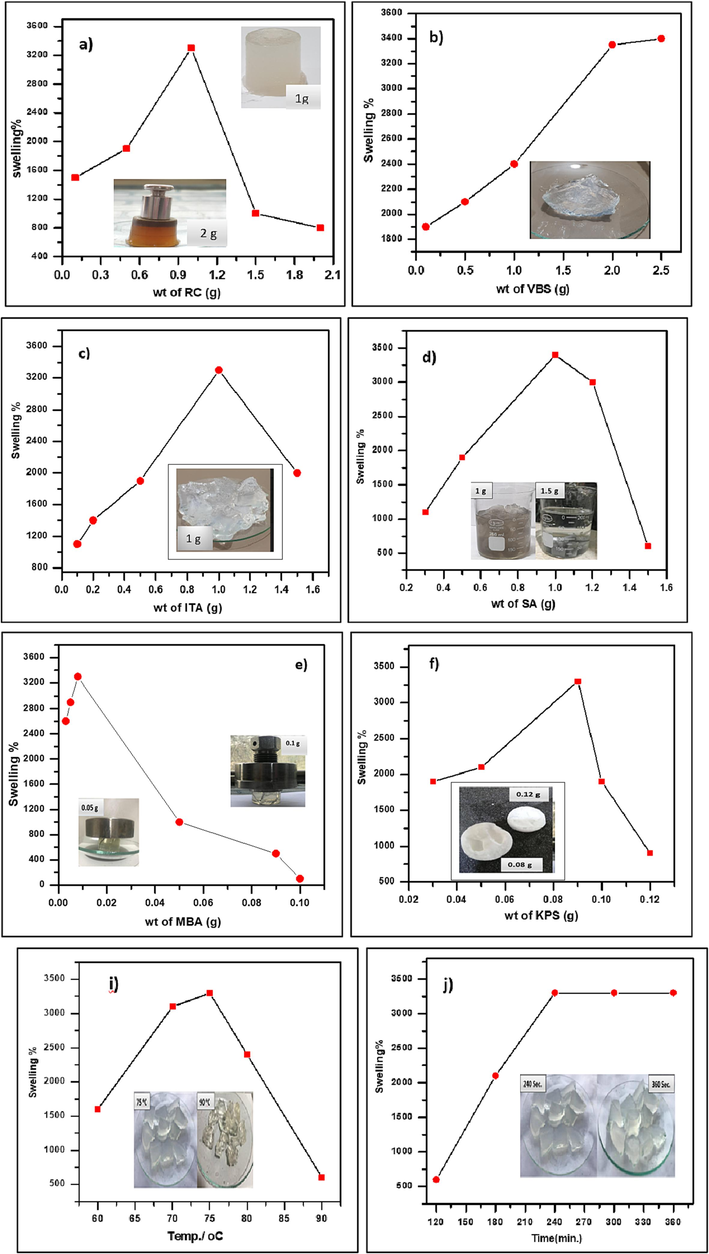
Variation of swelling percentage % with a) amount of RC, b) amount of monomer VBS, c) amount of monomer ITA, d) amount of SA, e) amount of cross-linker (MBA), f) amount of initiator (KPS), g) pH, h) solvent, i) temperature, j) reaction time.
3.2.2 Effect of VBS amount on the swelling behavior
By changing the monomer amount from 0.1 to 2.5 g, (SA-g-P(ITA-co-VBS)/RC) hydrogel percentage swelling and water absorbance efficiency were evaluated. The hydrogel's capacity to absorb water grew as the monomer concentration rose from 1900 % to 3400 %, as shown in Fig. 4 b. Nevertheless, water absorption decreased noticeably when VBS exceeded 3400 %. This is because the interaction of the –COO groups with more Na+ weakened the repulsive force. The synthesis of ITA homopolymers and a rise in viscosity, which impeded the movement of free radicals onto active sites, could be blamed for the small change in stability in percentage swelling at large amounts of monomer. Additionally, the hydroxyl group (a weak hydrophilic group) may be the cause of the network contraction since it creates a hydrogen bond with two nearby chains (Sourbh et al., 2022).
3.2.3 Effect of Itaconic acid amount on the swelling behavior
The swelling percentage of the SA-g-P(ITA-co-VBS)/RC hydrogel was maximum at 1.0 g of ITA (Fig. 4 c). The chain propagation sites on the graft copolymer network have more ITA molecules available as the ITA amount is increased from 0.1 to 1.5 g. The hydrogel swelling percentage rose with the ITA amount and reached a maximum (3400 %) at 1 g due to the higher hydrogel swelling percentage. A concentration greater than 1.0 g accelerated the homo-polymerization reaction, increasing the viscosity of the reaction mixture and impeding the passage of free radicals, and a reduction in the percentage of hydrogel swelling (Sourbh et al., 2022).
3.2.4 Effect of sodium alginate amount on the swelling behavior
When the amount of SA was increased from 0.5 to 2.5 g, the influence on the hydrogel ability to absorb water rose, and as the amount of SA was increased further, the effect diminished, as shown in Fig. 4d. With a SA content of 2 g, the greatest swelling (3400 %) was achieved. The monomer was in excess in the reaction system when SA was present in low amounts. There can be no connection between the water swelling and the homo-polymer that was produced when too much ITA and VBS were mixed. The swelling increased with decreasing homo-polymer content and increasing SA concentration at a certain crosslinking density. Furthermore, when the SA amount exceeded 2 g, the SA solution viscosity increased, the initiation efficiency decreased, and the reactive sites were unable to sufficiently grow. The water swelling was reduced as a result of the grafting ratio being reduced. With a significantly larger SA content, the system's viscosity drastically rose, limiting the mobility of the monomer and lowering the conversion rate. As a result, it is possible to anticipate a less developed 3D polymer network and reduced water absorption capacity (Thakur, 2018).
3.2.5 Effect of cross-linker amount on the swelling behavior
A cross linker plays an important role in the synthesis of an SA-g-P(ITA-co-VBS)/ RC hydrogel due to the prevention of the dissolving of the hydrophilic polymer networks in an aqueous phase. and effectively makes the hydrogel insoluble. The presence of crosslinking chains is essential to controlling crosslinking density and fluid absorbency. SA-g-P(ITA-co-VBS)/ RC hydrogel swelling studies were carried out at different cross-linker (MBA) amounts varying from 0.003 to 0.1 g (Fig. 4 e). The hydrogel showed maximum swelling of 3400 % at 0.03 g. For cross-linker amounts of more than 0.03 g, hydrogel swelling started to reduce. It could be because the hydrogel network developed a significant number of cross-linked chains, resulting in a stiff structure. On increasing the cross-linker amount, the cavities between polymer chains in the hydrogel were reduced, consequently, the amount of water retained in the composite cavities was decreased (Xiaoning et al., 2012).
3.2.6 Effect of initiator amount on the swelling behavior
Changes in the initiator from 0.03 g to 0.12 g were made to assess the impact of the initiator KPS quantity on the SA-g-P(ITA-co-VBS)/RC hydrogel swelling percentage (Fig. 4f). The best percent swelling (3400 %) was achieved at 0.09 g, after which the swelling percent started to decline. The swelling was originally improved by increasing the initiator quantity up to this point. The swelling increased from 1900 to 3400 % when the amount of KPS was raised from 0.03 g to 0.09 g. The swelling was reduced to 141 g/g after an additional rise in KPS to 0.09. This rise could be explained by the Alginate chains being attacked by the sulfate anion-radical. Increasing KPS further reduced the percentage of swelling, which caused the reaction to stop (Thakur, 2018).
3.2.7 Effect of pH on the swelling behavior
According to Fig. 4g, the pH has a significant impact on the SA-g-P(ITA-co-VBS)/RC hydrogel ability to swell in the pH range of 2–11. The SA-g-P(ITA-co-VBS)/RC hydrogel swelled significantly because the charge density was balanced at pH neutral. Hydrogel swelling decreased with each low (acid) or high (base) pH; the best percentage of swelling was reported at pH 7. Low swelling was caused by the collapse of the hydrogel matrix three-dimensional structure and the protonation of groups COO– at an acidic pH, which reduced electrostatic repulsions. Low swelling was induced by the collapse of the 3D structure of the hydrogel at the basic pH condition where carboxylic groups were ionized into groups COO– (Refaie et al., 2019).
3.2.8 Effect of solvent on the swelling behavior
According to Fig. 4 h, the solvent volume (13–21 ml) had an impact on the grafting of TIA onto SA. Swelling % initially increased up to 20 ml of solvent and then reduced once the volume of solvent exceeded 20 ml. The propagation phase of the polymerization reaction, which initially increased the swelling percentage, may be responsible for the hydroxyl radical that water produces. Increased solvent volume resulted in the production of too many hydroxyl radicals, which caused the reaction to come to an abrupt end and further complicated the process of graft copolymerization (Sourbh, 2018).
3.2.9 Effect of temperature on the swelling behavior
The investigation of the grafting of a monomer onto the backbone (SA) was done at various temperatures between 60 and 90 °C, as shown in Fig. 4i. Enhanced the temperature of SA-g-P(ITA-co-VBS)/ RC hydrogel swelling percentage at a maximum temperature at 75 °C with values 400. Up to a temperature of 75 °C, the percentage of swelling increased because of improved monomer transport and the activation of macro radicals. Higher temperatures allowed for the efficient decomposition of KPS and the activation of free radicals, which was thought to improve SA-g-P(ITA-co-VBS)/RC hydrogel swelling. Excessive cross-linking took place at temperatures higher than 75 °C, resulting in a more compact and inflexible structure and lowering swelling (Mengna et al., 2021).
3.2.10 The swelling capacity of hydrogel over time
According to Fig. 4 j, the percentage of swelling increased with time from 120 to 210 min before decreasing from 210 to 240 min. Initial percentage swelling increases could be attributed to the development of additional active sites on SA and monomer through radical and substrate interactions. After 210 min, there are fewer radical active sites available, and their number decreases, which is why the percentage of swelling starts to reduce. According to the results, the best equilibrium time was reached after 120 min (Refaie et al., 2019).
3.3 Effect of different parameters on the adsorption process
3.3.1 Effect of pH
By adjusting the pH of the MG dye solution from 3 (strongly acidic) to 10 (very alkaline) while maintaining constant hydrogel weight (0.05 g), the impact of solution pH on the adsorption effectiveness of hydrogel was examined. Fig. 5 illustrates the adsorption capacity increased with increasing pH solution. Adsorption capacity rose relatively when the pH of the solution was altered from 2 (Qe = 1248.33 mg/g) to pH 7 (Qe = 1348.55 mg/g), but it increased significantly when the pH was changed to 10 (Qe = 1380.11 mg/g), and the best adsorption capacity was attained at pH 7.The competing adsorption between cationic dye and the anionic sites of the hydrogel led to lower efficiency in acid solutions. The H+ ions reduce the total number of adsorption sites available for MG dye molecules, reducing adsorption efficiency. Therefore, pH 7 was selected as the ideal solution pH for adsorption investigations(Hemant et al., 2021).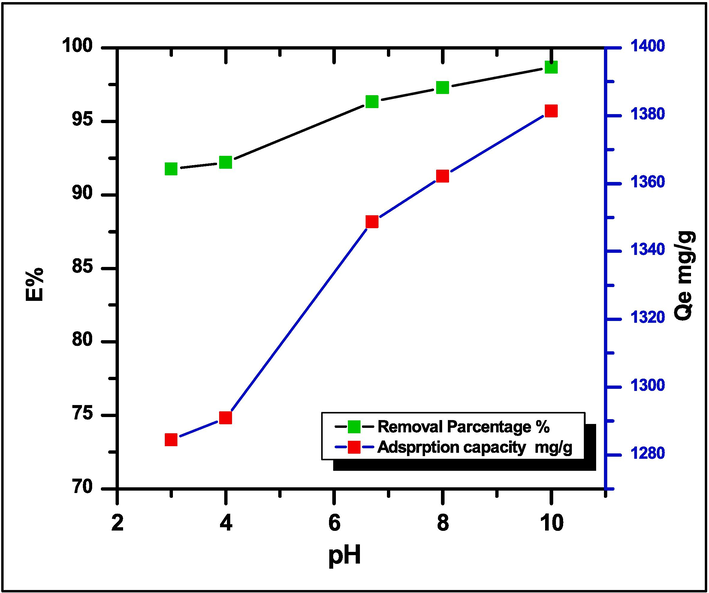
Effect of pH solution on the adsorption of MG dye on SA-g-P(ITA-co-VBS)/ RC hydrogel (Exp. Condition: Temp. = 25 °C, equilibrium time 1 h).
3.3.2 Point of zero charge (pHpzc)
The pHpzc estimation was done using the pH drift method. The pH pzc, which is typically defined as the point when the pH final vs. pH initial curve crosses the line pH initial = pH final, has a value of 4.2 for the nanocomposite (Fig. 6). The surface of the nanocomposite hydrogel exhibits a net positive charge at pH < pHpzc, but it exhibits a net negative charge at pH > pHpzc. The number of OH– ion in an aqueous solution increases at alkaline pHs (pH > pHpzc), and the functional groups in the structure of adsorbers have a negative charge, which can be useful in the process of removing MG dye (Hemant et al., 2021; Sevda et al., 2021).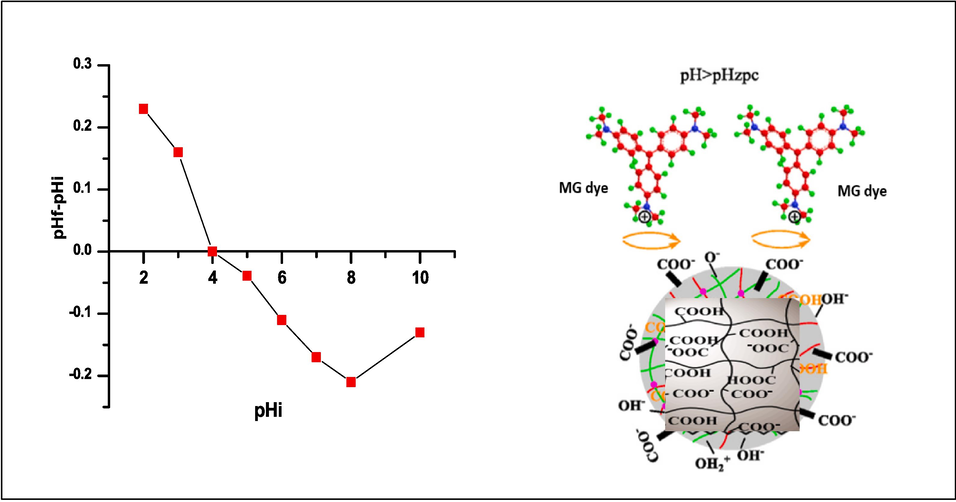
Point Zero charge of SA-g-P(ITA-co-VBS)/ RC, at Temp. = 25 °C, contact time 24 h, and mass adsorbent 0.05 gm/ 100 ml).
3.3.3 Adsorbent dose
The effect of SA-g-P(ITA-co-VBS)/ RC adsorbent dose onto MG dye adsorption was examined in the range of various doses (10–100 mg) at pH 7 and MG dye concentration of 700 mg/L as shown in (Fig. 7). Increased hydrogel weight results in greater dye removal percentages; 0.05 g/L of hydrogel weight resulted in 96.333 % dye absorption. The improvement in removal capacity with increasing adsorbent mass could be explained by the presence of additional adsorption active sites on the adsorbent. Because of the strong competition between the adsorbent and active sites on the adsorbent, the removal percentage remains practically constant at an adsorption dose of 0.05 g (Asmaa et al., 2023; Vahid et al., 2023).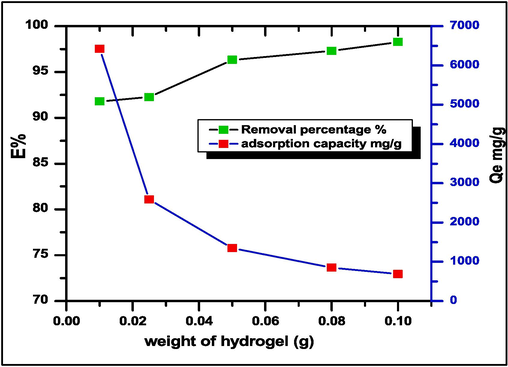
Effect of the mass amount of adsorbent SA-g-P(ITA-co-VBS)/ RC hydrogel on the percent removal and amount of adsorbed MG dye, initial concentration = 700 mg.L-1, Temp. = 25 °C, contact time 1hr., pH = 7.
3.3.4 Dye adsorption studies
The current study research concentrated in particular on the effect of color removal from wastewater using SA-g-P(ITA-co-VBS)/RC hydrogel. Malachite green (MG), a poisonous form of synthetic cationic dye, was selected as an adsorbate for interactions with hydrogels and other molecular structures. Fig. 8 (a,b) shows a real picture of MG dye before and after adsorption from an aqueous solution utilizing SA-g-P(ITA-co-VBS)/ RC hydrogel. A group of factors affecting the adsorption process was studied, namely the initial concentration of dye, temperature, co-monomer ratio, and adsorbent dose. The equilibrium and dynamic investigations were conducted in water for 24 h at 25 °C. As can be seen in Fig. 8c, the ratio of dry hydrogel to water absorption initially increased over time before equilibrating. According to the image in Fig. 8c, the SA-g-P(ITA-co-VBS)/RC hydrogel acquired its maximum capacity for swelling in 420 min and absorbed water up to nearly 47 times its own dry weight (Pinar et al., 2019).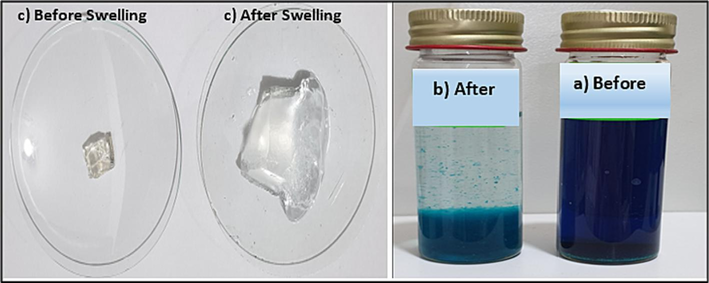
Images of a) before and b) after dye adsorption studies by SA-g-P(ITA-co-VBS)/ RC hydrogel, and c) image of swollen SA-g-P(ITA-co-VBS)/ RC hydrogel in water (Co = 700 mg/ L; m = 0.05 g; pH = 7; T = ∼25 °C).
3.4 Reusability
Four adsorption–desorption cycles were used to test the SA-g-P(ITA-co-VBS)/RC hydrogel reusability. Adsorbent recovery is a crucial step in the application of adsorption since it helps to demonstrate adsorbent regeneration. As a result, both the economic value of the adsorption process and the recovery technique of the adsorbed material will considerably rise. A basic medium, a neutralizing media, and an acidic medium were used to study the adsorbed basic MG dye desorption behavior from the network of SA-g-P(ITA-co-VBS)/RC hydrogel.The performance regeneration of the SA-g-P(ITA-co-VBS)/RC hydrogel was studied to limited its feasibility for industrial utilization. The adsorbent utilized hydrochloric acid 0.1 N as shown in Fig. 9. When H+ ion concentrations are high, the electrostatic connection between basic MG dye molecules and carboxylate ions (COO–) becomes very weak. The network SA-g-P(ITA-co-VBS)/RC hydrogel demonstrated outstanding stability against MG dye adsorption, at the first cycle 96.33 %, second cycle 94.87 %, third cycle 90.98 %, and at the fourth 88.88 % sequential adsorption–desorption cycles. This may be because carboxylic acid (–COOH) is formed. This indicated the excellent adsorption efficiency of fabricated SA-g-P(ITA-co-VBS)/ RC hydrogel towards MG dye removal and can be utilized as a stable adsorbent for toxic dyes and the high recyclability of the hydrogel nanocomposite makes it suitable for practical applications and appear a best recycling performance by low cost-effective (Xinyou et al., 2018).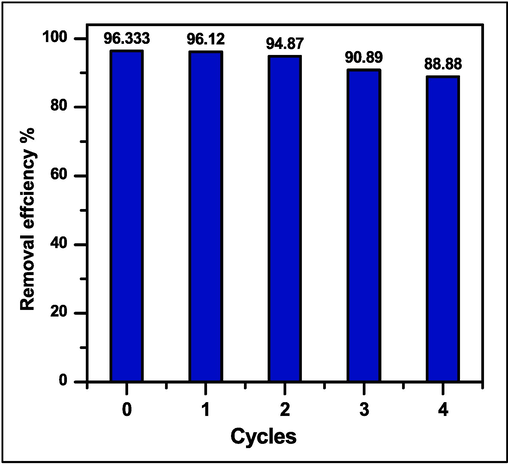
Cycle adsorption efficiency (%) of SA-g-P(ITA-co-VBS)/ RC hydrogel.
3.5 Effect of temperature and thermodynamic adsorption
Three main thermodynamic factors were studied are change free energy (ΔG), change enthalpy (ΔH), and change entropy (ΔS), to identify the adsorption mechanism of MG dye on the surface of the SA-g-P(ITA-co-VBS)/RC hydrogel, as shown in the equations below (Aljeboree et al., 2014; Aljeboree et al., 2017):
Where ΔG: Gibbs free energy (J.K−1.mol.-1), R is the gas constant (8.314 J.K -1.mole-1), T is the absolute temperature in Kelvin. Xm is the maximum adsorption value at a specific equilibrium concentration (Ce). The slope and intercept of the van't Hoff plot of ln KL vs 1/T provide the values of ΔH and ΔS. According to the results, all initial concentrations of MG dye showed an increase in their equilibrium adsorption capability as the solution temperature rose (Gouamid et al., 2013). As seen in Fig. 10, the enhanced magnitude of the reverse (desorption) phase in the mechanism causes SA-g-P(ITA-co-VBS)/RC hydrogel absorption efficiency to increase with increasing temperature. This may be caused by the endothermic impact of the environment during the adsorption technique.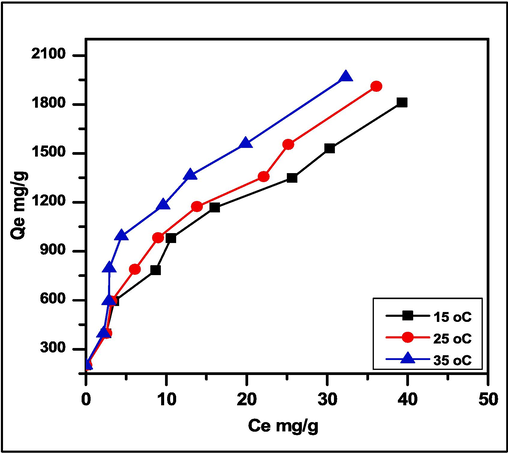
Effect of temperature on the adsorption of MG dye on the surface of SA-g-P(ITA-co-VBS)/ RC hydrogel (pH 7, mass adsorbent 0.05 gm/ 100 ml).
The ΔH and ΔS values can be calculated from the slope and intercept of the vant Hoff plots by producing a graph of ln Xm vs 1000 K/T (Fig. 11). Table 1 summarizes the thermodynamic parameters that were determined at three different temperatures. The adsorption processes may be spontaneous given the value of ΔG is negative. Additionally, the value of ΔH positive denotes that the adsorption processes are endothermic, which is supported by the fact that the adsorption capacity increases as the temperature rises. While the adsorption of MG dye by SA-g-P(ITA-co-VBS)/RC hydrogel results in increased randomization at the solid–liquid interface, as seen by the positive value for ΔS (Aljeboree et al., 2017; Honglin et al., 2023).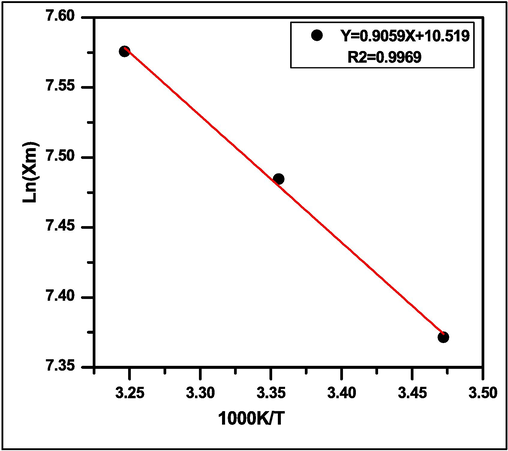
Van’t Hoff plot for the determination of thermodynamic parameters.
SA-g-P(ITA-co-VBS)/ RC hydrogel adsorbent/MG adsorbate
T/K
Keq
ΔG(kJ.mol−1)
ΔH(kJ.mol−1)
ΔS(J.K−1.mol−1)
288
48.92
−9.153
7.531653
87.45
298
54.76
−9.751
303
60.00
−10.314
3.6 Adsorption isotherm
Adsorption data is typically represented as the value of an equilibrium isotherm model, where the adsorption capacity (Qe mg/g) is the ratio of the sorbent solid-phase concentration to its liquid-phase concentration (Ce mg/L). When using a dynamic model of the adsorption process, it becomes necessary to know how the adsorbate is distributed between the solid and liquid phases; adsorption equilibrium studies can provide this data. The validity of the experimental results has been predicted using two different models. Two of the most popular models, the Freundlich isotherm and the Langmuir isotherm, were utilized in this work to describe the adsorption model (Dariya and Alec, 2023). The nonlinear form of the isotherm Langmuir and isotherm Freundlich models is given as:
qe: Quantity adsorbed per unit mass of adsorbent at equilibrium (mg/g), Ce: Equilibrium concentration of adsorbate in solution after adsorption (mg/L), qm: Empirical Langmuir constant which represents best adsorption efficiency (mg/g) of the total number of surface sites per mass of adsorbent and it may vary among different compounds because of differences in adsorbate sizes, KL: empirical Langmuir constant (L/mg) or the equilibrium constant of the adsorption reaction. Kf: Empirical Freundlich constant or capacity factor (L/mg) or the dye quantity adsorbed for unit equilibrium concentration, 1/n: Freundlich exponent, if the value of n is equal to unity, the adsorption is linear; if below to unity, then adsorption process is chemical and if the value is above unity, then adsorption is a physical process (Ye-Sol and Jin-Hyun Isotherm, 2019, Yongde et al., 2020; Zoya et al., 2019). Fig. 12 shows a plot of qe vs. Ce, where the values of Kf and 1/n are determined by the intercept and slope in the same order. According to Table 2, the correlation coefficient (R2) values of MG dye onto SA-g-P(ITA-co-VBS)/RC hydrogel for the Freundlich model at temperature 25 °C are (R2 = 0.9959).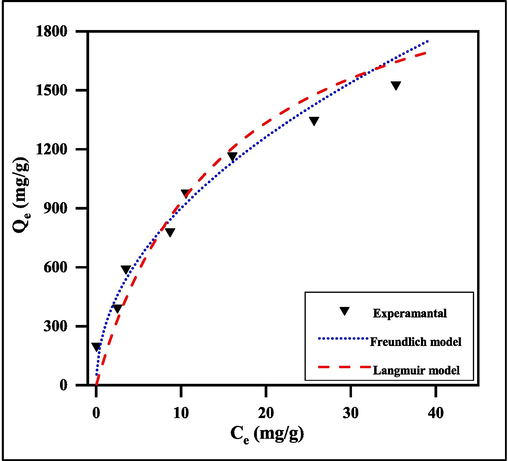
Adsorption of MG onto SA-g-P(ITA-co-VBS)/RC hydrogel using many nonlinear adsorption models at 25 °C, conc. = 700 mg. L-1, pH of solution 7, and weight of surface 0.05 g/100 ml).
Temperature/ oC
25 °C
Freundlich
Kf
292.65 ± 47.44
1/n
0.4879 ± 0.0502
R2
0.9959
Langmuir
qm(mg/g)
235.66 ± 31.702
KL(L/mg)
0.06 ± 0.021
R2
0.9300
3.7 Adsorption kinetics modeling
It is necessary to identify the adsorption mechanism using adsorption kinetic models because the adsorption velocity is an important means of expressing the efficiency of the adsorbent. The change of the amount adsorbed (qt) as a function of time is depicted in Fig. 13. In the beginning stages of adsorption, the rate of MG dye adsorption is high. The majority of dye adsorption occurs within 10 min, indicating a rapid rate of dye adsorption by SA-g-P(ITA-co-VBS)/RC hydrogel. The pseudo-first-order kinetic (Lagergren, 1898), pseudo second-order kinetic (Ho and McKay, 1999), and Elkovich equation (Low, 1960) of MG dye adsorption by SA-g-P(ITA-co-VBS)/RC hydrogel were examined. Table 3 is a list of the results of the fitting. The following pseudo-first-order equation is a straightforward kinetic study of adsorption:
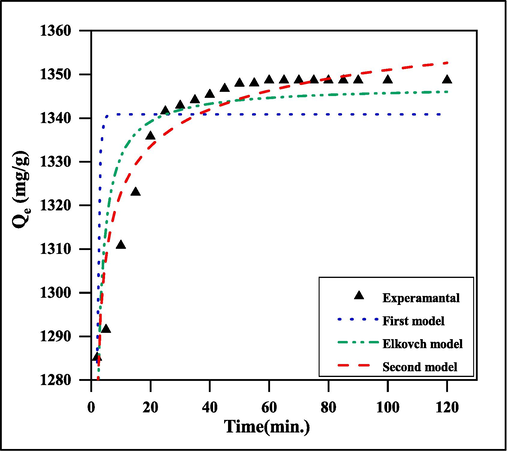
Adsorption rate curve models fitted to experimental MG dye adsorption on the surface of SA-g-P(ITA-co-VBS)/ RC hydrogel a) kinetic first model; b) kinetic second model; and c) kinetic Elkovich model.
Type
Parameters
Value
Stand. Error
R2
Pseudo-First-order
qe (mg g−1)
1247.36
2.2653
0.3768
kf (min−1)
8.184
1.0118
pseudo-second-order
qe (mg g−1)
1339.83
3.3684
0.9857
k2 (gmg−1 min−1)
1.589
0.1363
Elkovich
α(mg g−1 min−1)
40.765
3.1005
0.8777
β (g min−1)
5.369
1.3407
Where qt is the amount of adsorbate adsorbed at time t (mg/g), qe is the adsorption capacity in the equilibrium (mg/g), k1 is the pseudo-first-order rate constant (min−1), and t is the contact time (min). Based on adsorption equilibrium capacity, a pseudo-second-order equation could be written as follows:
Where k2 is the pseudo-second-order rate constant (g.gm−1. min−1).
For general chemisorption applications, the Elkovich equation is utilized. A wide range of slow adsorption rates is covered by the equation, which has been successfully used in several chemisorption processes. For systems where the adsorbing surface is heterogeneous, the same equation, which is written as follows:
The change of dye adsorption on SA-g-P(ITA-co-VBS)/RC hydrogel with shaking duration (0–120 min) and various initial dye solution concentrations of (100–1000) mg/L are shown in Fig. 13. The dye adsorption started rather quickly, slowed down over time, and eventually achieved a constant value (equilibrium time). The initial higher rate might have been caused by the adsorbent having an exposed surface area. If it was noted that the adsorption of MG dye applies to the pseudo-first-order model, as it has a high correlation coefficient. Additionally, compared to the q values estimated from the pseudo-second-order model, the q values calculated (qe cal.) from the chemisorption kinetic model were more compatible with the experimental q values (qe exp.) (Bahareh, 2020; Ru et al., 2021; Urooj et al., 2019).
3.8 Comparative adsorption between different surfaces to remove dye
A comparison of the wear of adsorbents on natural Ricinus communis (Rc) and acid-treated Ricinus communis (ACRC) surfaces was conducted. In this study, a sample of 100 ml of MG dye was employed. It was then added to a conical flask containing 0.05 g of material from two surfaces, shaken for one hour, and the supernatant was separated by centrifugation. The residual dye concentration was then determined utilizing a UV–Visible spectrophotometer at the λmax nm. Fig. 14 displays the significant data for the dye removal percentage (E%) for (RC > ACRC).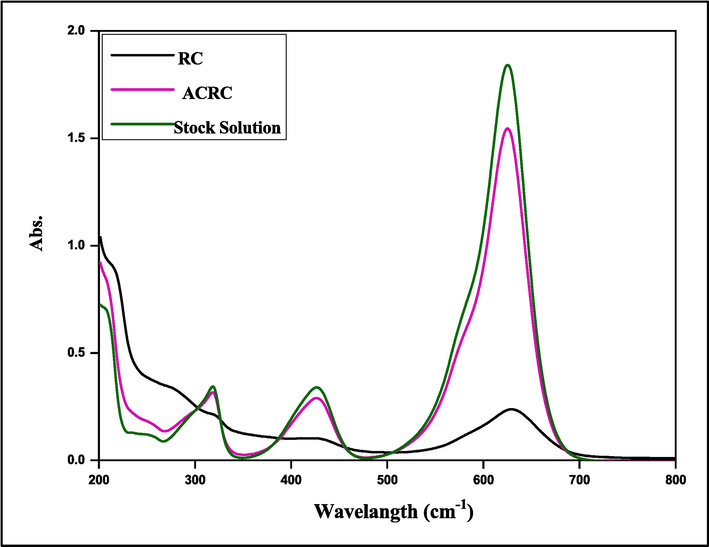
Absorption spectrum at different surfaces to remove MG dye.
4 Conclusion
Here, we have prepared SA-g-P(ITA-co-VBS)/RC hydrogel beadby a simple copolymerizationand low-cost technique. Several characterization techniques revealed the successful fabrication of the superadsorbent hydrogel. The non-linear approach of adsorption isotherm models were used to examine the MG dye adsorption kinetic and equilibrium data at various process parameters. The higher activitry of the surface for removing of MG dye attributed to the abundance of such chemical functions on the beads increased the uptake capacity, resulting in efficiencies above 91–99 % across a broad spectrum of initial concentrations, pH of solution and temperatures. The results showed that the pseudo-second-order model adequately matches the experimental data. With 0.05 g/100 L of SA-g-P(ITA-co-VBS)/RC hydrogel, the maximum removal efficiency of 96.33 % was obtained at pH 7. The best adsorption efficiency was reported to be 1339.83 mg/g at 25 °C for the adsorption of MG onto hydrogel, which was shown to be a heterogeneous multilayer adsorption process. According to thermodynamics studies, and negative value of Gibbs free energy signifies the spontaneous nature of the dye adsorption, while results of enthalpy referes to endothermic process. Also kinetics studies show the second-order adsorption kinetics model provided a clear explanation. The hydrogel can reportedly be utilized for four continuous cycles of adsorption–desorption, according to studies on regeneration and reuse. In summary, a composite hydrogel adsorbent with good reusability, excellent mechanical properties, and large adsorption capacity was prepared.
Ethical approval
The data of the current research has been conducted ethically, keeping in mind privacy, consent, and appropriate reporting of those involved in the study.
Authors' contributions
Ishraq T Hasan and Ayad F Alkaim completed the experimental part of the manuscript, while Aseel M. Aljeboree and Abdulrahman Al-Warthan wrote the manuscript text, drew figures, and coordinated the References.
Declaration of competing interest
The authors declare that they have no known competing financial interests or personal relationships that could have appeared to influence the work reported in this paper.
References
- Ahmad, M.A., Alrozi, R., 2011. Removal of malachite green dye from aqueous solution using rambutan peel-based activated carbon: equilibrium, kinetic and thermodynamic studies. Chem. Eng. J. 171, pp. 510–516.
- Kinetics and equilibrium study for the adsorption of textile dyes on coconut shell activated carbon. Arab. J. Chem.. 2017;10:S3381-S3393.
- [Google Scholar]
- Activated carbon (as a waste plant sources)-clay micro/nanocomposite as effective adsorbent: Process optimization for ultrasound-assisted adsorption removal of amoxicillin drug. Plant Archives. 2019;19:915-919.
- [Google Scholar]
- Aljeboree, A.M., Alkaim, A.F., Al-Dujaili, A.H., 2014. Adsorption isotherm, kinetic modeling and thermodynamics of crystal violet dye on coconut huskbased activated carbon. Desalination and Water Treatment 21, p. http://www.tandfonline.com/loi/tdwt20.
- Asmaa, E.E., Sayed, K.A., Ghada, A.M., Yasser, M.M., Afaf, R.T., Doaa, I.O., 2023. Environmentally friendly radiation EDTA modified hydrogel based on gelatin for adsorptive removal of cationic and anionic dye from synthetic wastewater. Egypt. J. Petrol., 32, pp. 30-35 :Doi: 10.1016/j.ejpe.2023.1010.1002.
- Bahareh, T., Ali, A., Evgenia, I., Mika, S., 2000. Efficient carbon interlayed magnetic chitosan adsorbent for anionic dye removal: synthesis, characterization and adsorption study. Int. J. Biolo. Macromol., 164, pp. 3621-3631: Doi: 3610.1016/j.ijbiomac.2020.3608.3207.
- Bello, O.S., Ahmad, M.A., Ahmad, N., 2012. Adsorptive features of banana (Musa paradisiaca) stalk-based activated carbon for malachite green dye removal. Chem. Ecol., 28, pp. 153–167.
- Chenxi, Z., et al., 2002. Polysaccharide-based biopolymer hydrogels for heavy metal detection and adsorption. J. Adv. Res., 44, pp. 53-70 :Doi: 10.1016/j.jare.2022.1004.1005.
- Dariya, G., Alec, L., Ivan, G., 2023. Composite hydrogels basedon poly (ethylene glycol) and cellulose macromonomersas fortified materialsfor environmental cleanupand clean water safeguarding. Int. J. Mol. Sci., 24, p. 7558.Doi: 7510.3390/ijms24087558.
- Synthesis, swelling properties and evaluation of genotoxicity of hydrogels based on (meth)acrylates and itaconic acid. Mater. Res.. 2016;19:1070-1079.
- [Google Scholar]
- El Shafey, A.M., Abdel-Latif, M.K., Abd El-Salam, H.M., 2021. The facile synthesis of poly(acrylate/acrylamide) titanium dioxide nanocomposite for groundwater ammonia removal. Desalinat Water Treat 212, pp. 61–70:doi: 10.5004/dwt.2021.26637.
- Gouamid, M., Ouahrani, M.R., Bensaci, M.B., 2013. Adsorption equilibrium, kinetics and thermodynamics of methylene blue from aqueous solutions using date palm leaves. Energy Proc., 36, pp. 898-907: Doi: 810.1016/j.egypro.2013.1007.1103.
- Super-adsorbent poly(acrylic acid)/laponite hydrogel with ultrahigh mechanical property for adsorption of methylene blue. J Environmental Chemical Engineering. 2021;21:01323.
- [Google Scholar]
- Graphene oxide crosslinked hydrogel nanocomposites of xanthan gum for the adsorption of crystal violet dye. J. Mol. Liq.. 2021;323:115034
- [Google Scholar]
- Ho, Y.S., McKay, G., 1999. Pseudo-second order model for sorption processes. Process Biochem., 34, pp. 451-465 :Doi: 410.1016/S0032-9592(1098)00112-00115.
- Honglin, Z., Sunni, C., Hanyi, D., Jie, H., Yangchao, L., 2023. Removal of anionic and cationic dyes using porous chitosan/carboxymethyl cellulose-PEG hydrogels: Optimization, adsorption kinetics, isotherm and thermodynamics studies. Int. J. Biol. Macromol., 231, p. 123213.
- Issa, K., Elena, R., 2001. Absorption of metal ions and swelling properties of poly(acrylic acid-coitaconic acid) hydrogels, J. Macromol. Sci.—Pure Appl. Chem., A38(2001), pp. 543–558.
- Study of itaconic acid production by Aspergillus terrus MJL05 strain with different variable Rev. Colomb. Biotecnol. 2010;2:187-193.
- [Google Scholar]
- About the theory of so-called adsorption of soluble substances. Kungliga Suensk Vetenskapsakademiens Handlingar. 1898;241:1-39.
- [Google Scholar]
- Mengna, C., Xuelong, C., Caiyan, Z., Baozheng, C., Zewen, L., Dongyu, Z., Zhe, W., 2021. Kaolin-enhanced superabsorbent composites: synthesis, characterization and swelling behaviors. Polymers 13, p. 1204: Doi: 1210.3390/polym13081204.
- Muhammad, A.M., Jalal-ud-Din, B., Rubab, Z., 2014. Synthesis, swelling behavior, and network parameters of novel chemically crosslinked poly (acrylamide-co-methacrylate-co-acrylic acid) hydrogels. Design. Monomers Polymers 17,, p. Doi: 10.1080/15685551.15682013.15840501.
- Synthesis and swelling behavior of metal-chelating superabsorbent hydrogels based on sodium alginate-g-poly(AMPS-co-AA-co-AM) obtained under microwave irradiation. Polym. Bull.. 2017;74:4453-4481.
- [Google Scholar]
- Parisa, M., Pakdela, S.J., Peighambardousta, R., Foroutana, N.A., Hassan, A., 2022. Decontamination of Fuchsin dye by carboxymethyl cellulose-graft-poly(acrylic acid-co-itaconic acid)/carbon black nanocomposite hydrogel. Int. J. Biol. Macromol., 222, pp. 2083-2097.
- O.O. Peter , O.A. Timothy, C.W. Wycliffe , O.O. Elizabeth and E.O. Mayowa, Ozonation, electrochemical, and biological methods for the remediation of malachite green dye wastewaters: A mini review, Sustainable Chemistry for the Environment, 3(2023), p. 100033: Doi: 100010.101016/j.scenv.102023.100033.
- Selective adsorption of cationic dyes from colored noxious effluent using a novel N-tert-butylmaleamic acid based hydrogels. React. Funct. Polym.. 2019;124:189-198.
- [Google Scholar]
- Raoudha, S. et al., 2002. Synthesis and characterization of a new meso-tetrakis (2,4,6-trimethylphenyl) porphyrinto) zinc(II) supported sodium alginate gel beads for improved adsorption of methylene blue dye. Int. J. Biol. Macromol., 202, pp. 161-176 :Doi: 110.1016/j.ijbiomac.2022.1001.1087.
- Sodium alginate-g-poly(acrylic acid-co-2-hydroxyethyl methacrylate)/montmorillonite superabsorbent composite: Preparation, swelling investigation and its application as a slow-release fertilizer. Arab. J. Chem.. 2019;12:847-856.
- [Google Scholar]
- Ru, J. et al., 2021. Magnetic NiFe2O4/MWCNTs functionalized cellulose bioadsorbent with enhanced adsorption property and rapid separation. Carbohydr. Polym., 252, p. 117158: Doi: 117110.111016/j.carbpol.112020.117158.
- P. Sevda, J. Seyed, F. Rauf , A. Nasser and R. Bahman Crystal violet dye sorption over acrylamide/graphene oxide bonded sodium alginate nanocomposite hydrogel, Chemosphere 270(2021), p. 129419.
- Adsorption of cationic dyes onto carrageenan and itaconic acid-based superabsorbent hydrogel: Synthesis, characterization and isotherm analysis. J. Hazard. Mater.. 2022;421:126729
- [Google Scholar]
- Rachid Highly synergic adsorption/photocatalytic efficiency of Alginate/Bentonite impregnated TiO2 beads for wastewater treatment. J. Photochem. Photobiol. A Chem. 412 2021113215
- [Google Scholar]
- Highly efficient poly(acrylic acid-co-aniline) grafted itaconic acid hydrogel: Application in water retention and adsorption of rhodamine B dye for a sustainable environment. Chemosphere. 2022;303:134917
- [Google Scholar]
- Sourbh, T., 2018. Synthesis, characterization and adsorption studies of an acrylic acid-grafted sodium alginate-based TiO2 hydrogel nanocomposite. Adsorpt. Sci. Technol., 36, pp. 458–477.
- X. Tao, G. Qianru, J. Lianghao, Y. Tianyu, H. Wei , Z. Xinyu and Z. Shaobing Multifunctional Hydrogels for the Healing of Diabetic Wounds, Advanced Healthcare Materials, 13(2023), p. e2301885:DOI: 2301810.2301002/adhm.202301885.
- Thakur, S., 2018. Synthesis, characterization and adsorption studies of an acrylic acid-grafted sodium alginate-based TiO2 hydrogel nanocomposite. Adsorpt. Sci. Technol. 36, pp. 458–477.
- Efficient itaconic acid production from glycerol with Ustilago vetiveriae TZ1. Biotechnology for Biofuels and Bioproducts 2017:131.
- [Google Scholar]
- Y. Tianyu, Z. Xinyu , S. Shuai, X. Tao and Z. Shaobing Covalently crosslinked sodium alginate/poly(sodium p-styrenesulfonate) cryogels for selective removal of methylene blue, Carbohydrate Polymers, 301(2023), p. 120356 :Doi: 120310.121016/j.carbpol.122022.120356.
- K. Urooj , H. Young-Jung, W.L. Ji and P. Soo-Jin, Chemically modified activated carbon decorated with MnO2 nanocomposites for improving lithium adsorption and recovery from aqueous media, Journal of Alloys and Compounds, 794(2019), pp. 425-434: Doi: 410.1016/j.jallcom.2019.1004.1211.
- Vahid, B., Hossein, P., Mohammad, S.A., Dariush, S., Siamak, J., 2023. Synthesis and characterization of bio-nanocomposite hydrogel beads based on magnetic hydroxyapatite and chitosan: a pH-sensitive drug delivery system for potential implantable anticancer platform. Polym. Bull., 23, pp. 1223: Doi: 1210.1007/s00289-00023-05072-00281.
- A novel Chitosan-Barbituric acid hydrogel supersorbent for sequestration of chromium and cyanide ions: Equilibrium studies and optimization through RSM. Sep. Purif. Technol.. 2024;330:125475
- [Google Scholar]
- Enhanced swelling properties of a novel sodium alginate-based superabsorbent composites: NaAlg-g-poly(NaA-co-St)/APT. J. Appl. Polym. Sci.. 2012;125:1822-1832.
- [Google Scholar]
- Synthesis of a three-dimensional network sodium alginate–poly(acrylic acid)/attapulgite hydrogel with good mechanic property and reusability for efficient adsorption of Cu2+ and Pb2+. Environ. Chem. Lett.. 2018;16:653-658.
- [Google Scholar]
- Ye-Sol, K., Jin-Hyun, K., 2019. Isotherm, kinetic and thermodynamic studies on the adsorption of paclitaxel onto Sylopute. J. Chem. Thermodynam., 130, pp. 104-113: Doi: 110.1016/j.jct.2018.1010.1005.
- Jing and X. Shuhu Adsorption of toxic dye Eosin Y from aqueous solution by clay/carbon composite derived from spent bleaching earth. J. Hazard. Mater. 2020:4656-5544.
- [Google Scholar]
- Zhao, Y., Chen, Y., Zhao, J., Tong, Z., Jin, S., 2017. Preparation of SA-g-(PAA-co-PDMC) polyampholytic superabsorbent polymer and its application to the anionic dye adsorption removal from effluents. Sep. Purif. Technol., 188, pp. 329-340.
- Zoya, Z., Aisha, A., Elham, S.A., 2019. Adsorption of methyl red on biogenic Ag@Fe nanocomposite adsorbent: Isotherms, kinetics and mechanisms. J. Mol. Liquids, 283, pp. 287-298 :Doi: 210.1016/j.molliq.2019.1003.1030.


