

Translate this page into:
Prospective of the LDI MS to characterization the corrosion products of silver-copper alloys on an example of the Ag-Cu-X (X- Zn, Pd, In) system
⁎Corresponding author. stevad@gmail.com (Dimitrijević P. Stevan)
-
Received: ,
Accepted: ,
This article was originally published by Elsevier and was migrated to Scientific Scholar after the change of Publisher.
Peer review under responsibility of King Saud University.
Abstract
This work presents the perspective of applying the laser desorption/ionization mass spectrometry (LDI MS) for characterization the anode film of the Ag60Cu26Zn14, Ag58.5Cu31.5Pd10, and Ag63Cu27In10 alloys (at high concentrations of chloride ions in solutions). The reference LDI mass spectra of anode films of pure Ag and Cu have been used for the identification of product corrosion. Knowing the clusters detected in the reference spectra lead to the facilitating identification of the LDI mass spectrum of the sample and reduces the analysis time. The LDI MS analysis of these alloys revealed that the predominant corrosion product are AgCl (from AgnCln+1−/+, n = 1–3), and CuCl (from “superhalogen” CumCln− clusters, m = 1–2, n = 2–6); it also revealed Cu2(OH)3Cl (from Cu2(OH)(H2O)2+) and Cu2O (from Cu(H2O)+, Cu2O doped with chlorine). These results are in accordance with the X-ray diffraction and Raman analysis. The LDI MS spectra of alloys contain the additional peaks formed due to the mutual influences of different metals in the alloys (AgCuCl3− (AgCl-CuCl2−), AgCu2Cl4− (AgCl-CuCl-CuCl2−), and Ag2CuCl4− (AgCl-AgCl-CuCl−), which is consistent with the identified corrosion products. It should be noted that the LDI MS suggest the presence of CuCl2, which can be interpreted as the corrosion products retained in the porous films of alloys, and not detected by the other methods due to a small amount. The future theoretical and experimental studies of metal clusters, significant for metallurgy, can contribute that the LDI MS is becoming a powerful analytical tool for characterization the metal surfaces.
Keywords
Corrosion
LDI MS
Clusters
“superhalogen”
Ag-Cu alloys

1 Introduction
The silver-based alloys are widely used as the technical materials in various industries. Primary, they are the general-purpose soldering materials. The unique feature of these alloys is that they can exceptionally join various types of materials, for example, copper with stainless steel or most metals with ceramic materials (Haynes, 2014; Wang and Xue, 2016; Zhang et al., 2019). Particular categories of soldering alloys are the three-component and four-component alloys based on the Ag-Cu system, where the third or fourth component is: zinc, palladium, indium, tin, or nickel. It has been revealed that these systems are the best substitute for the Ag-Cu alloys with cadmium, because the cadmium alloys are prohibited for the general use in the EU for concentrations higher than 0.01 % (Commission Regulation (EU) No. 494/2011) due to a high toxicity of cadmium vapors during soldering, and the general toxicity of this heavy metal (Wierzbicki et al., 2011).
The Ag-Cu systems have a high corrosion resistance compared to the cheaper copper alloys. However, corrosion occurs in seawater, especially in the form of dezincification of these alloys, which are resistant only if the silver content is high (over 43 % for the Ag-Cu-Zn system). It should be noted that this resistance is conditional and insufficient at the high electrode potentials where porous surface films are formed (Dimitrijević et al., 2015; Way et al., 2020). Because corrosion is a complex physical and chemical process that significantly affects the economic viability of the application of these alloys, many methods are used to study this phenomenon, such as a scanning electron microscopy with the energy dispersion spectroscopy (SEM-EDS) (Cao et al., 2021), X-ray diffraction (XRD) (Saud et al., 2015), Raman spectroscopy (Dimitrijević et al., 2016) and atomic force microscopy (AFM) (Ma et al., 2015). Despite this, the development of new methods and expanding the application of existing methods to characterize this complex physicochemical process remains an important task. Previous research has opened the possibility of applying a laser desorption/ionization mass spectrometry for that purpose.
The laser desorption/ionization mass spectrometry was discovered 50 years ago. From then until today, this method has constantly been evolving, culminating in discovery a matrix-assisted laser desorption/ionization (MALDI). The introduction of matrices, organic compounds that absorb laser wavelengths, has enabled the MALDI MS to become the leading analytical method for various applications ranging from detection the small-bioactive to large macromolecules compounds and their distribution in tissue (ranging from plant to animals, and human tissue, so even inorganic samples) (Hillenkamp et al., 1986; Tanaka et al., 1988; Cody et al., 1990; Carre et al., 2005; Eriksson et al., 2013; Yang et al., 2015; Mandal et al., 2017; Duan et al., 2022). Commercial MALDI MS instruments are very easy to use and have the ability to put a large number of samples (from 100 in some instruments and 360 spots) in one set of measurements therefore the active researches are focused on expanding the field of application of these instruments. A part of research is focused on examining the possibility of replacing the organic matrices with the other compounds of inorganic nature (surface-enhanced LDI MS) (Tomer et al., 1983; Johnson et al., 1987; Miladinovic et al., 2010; Tata et al., 2012). On the other hand, there are the intensive researches for possibilities of application the commercial MALDI instruments without the use of matrices. The results have shown that the matrix-assisted, surface-enhanced and LDI mass spectrometry can be the methods that estimate the state of metal surface upon various treatments and conditions (Pytskii and Buryak, 2011b; Pytskii and Buryak, 2014; Dimitrijević et al., 2020; Pavlov and Attygalle, 2012; Pytskii and Buryak, 2011a; Pytskii and Buryak, 2011b; Pytskii and Buryak, 2014). Also, the LDI MS was used to characterize the numerous inorganic systems, and has proven to be very successful in identifying the heterogeneous and homogeneous metal clusters. These processes are very often closely related (Pangavhane et al., 2010; Prokeš et al., 2014; Peña-Méndez et al., 2008; Kruegel et al., 2013; Attygalle et al., 2018; Mehta et al., 2019; Pavlov et al., 2020).
This paper is a continuation of our systematic studying the possibility of this method application for characterization the anode film of Ag-Cu alloy. Previously, the LDI MS method in the positive mode was successfully applied to detect and characterize the corrosion products on the surface of Ag-Cu-X (X = Zn and Pd) alloys (Vurdelja et al., 2017; Dimitrijević et al., 2020). However, the results of a negative mode of the LDI MS are missed; hence, here the application of this mode for characterization the corrosion products of the Ag60Cu26Zn14, Ag58.5Cu31.5Pd10, and Ag63Cu27In10 alloys was investigated. The LDI mass spectra of an anode film of pure silver and copper are used as the reference mass spectrum to study the mutual influences of different metals in the alloys on the LDI MS analysis. These reference spectra should contribute to a better understanding of cluster-ions formation from the products corrosion of pure Ag and Cu, which could improve the ability to interpret the LDI mass spectra of alloys. The missing results for Ag-Cu-In, such as the positive mode LDI MS, the potentiostatic curve analysis, XRD analyses, phase and microstructure analyses (SEM/EDS), are also presented in this paper. These results are necessary to consider the advantages and limitations of the LDI MS method.
2 Experimental
Anode films on the surface of Ag60Cu26Zn14, Ag58.5Cu31.5Pd10, and Ag63Cu27In10 alloys were obtained by the potentiostatic polarization in 3.5 % NaCl solution at temperature of 25 ± 0.5 °C. The constant potential of + 500 mV versus the SCE (Saturated Calomel Electrode) in a time interval of five minutes was applied, and the measurement of current transients was recorded on an Interface 1000 Gamry potentiostat/galvanostat/ZRA (Zero Resistance Ammeter) controlled with Gamry Framework 6.25 software (Gamry Instruments Inc., Philadelphia, PA, USA). Chemical analysis of bulk solution was performed by the SpectroBlue (Spectro Analytical Instruments, Germany) ICP-OES instrument.
2.1 SEM/EDS studying
The microstructure and phase compositions were studied using a scanning electron microscope operated at 20 keV (model: JSM IT 300LV, JEOL, Tokyo, Japan) with an EDS detector (model: X-max, Oxford Instruments, Abington, UK; 126 eV resolution).
2.2 X-ray diffraction
The X-ray diffractometer Explorer (GNR Analytical Instruments Group, Novara, Italy) was used for the XRD analysis. The operating parameters for XRD were CuKα1/2 radiation (λ = 0.1542 nm) at 40 kV and 30 mA, 2θ ranging from 3° to 90° with a 0.02° step. The resulting diffractograms were compared with data from the database ICDD (PDF-2 Release 2015 RDB) using the software PDXL 2 Version 2.4.2.0.
2.3 Laser desorption/ionization mass spectrometry
The mass spectra in this work were obtained on a commercial matrix-assisted laser desorption / ionization mass spectrometer (MALDI MS), Voyager-DE PRO (Sciex, USA)). A mass analyzer is a time of flight (TOF) analyzer operating in the linear or reflector mode as the standard. A nitrogen 20 Hz pulse laser with a wavelength of 337 nm, with pulse duration of 3 ns, was installed in the mass spectrometer. All mass spectra were recorded under the following instrumental parameters: accelerating voltage 20000 V, grid voltage 94 %, laser intensity 3400 a.u., and number of laser beats 300. The experiments in this work were performed in the negative reflectron, with a delayed extraction time of 100 ns for all samples.
In particular, the experimental isotopic pattern was compared with the theoretical model for the supposed compound. The experimental isotopic pattern was determined based on values of the signal-to-noise ratio for individual signals in a particular group of peaks; the paper presents the mean values obtained on the basis of five measurements on one spot under previously determined optimal conditions.
The non-standard methods for sampling are often used in the LDI MS method, in the characterization the inorganic systems; for example, a sample can be mechanically removed from a specific surface with a wooden stick and put to a plate without the use of solution (Pavlov et al., 2009; Pavlov and Attygalle, 2012; Zheng et al., 2017). In this work, a sample for the LDI measurements was obtained by mechanically removal a part of the anode film from the electrode using the abrasive corundum polishing paper (P2000), placed in a laboratory beaker and introduced into an ultrasonic bath for ten minutes. This obtained sample was suspended in 10 μl of deionized water; 1 μl was applied to a MALDI stainless steel plate and dried at room temperature before being introduced into the instrument.
3 Results and discussion
This study added a new alloy from the Ag-Cu-Metal (where the metal is less noble metal than copper) system. The silver alloy Ag63Cu27In10 has a similar microstructure as the palladium and zinc bearing alloys and belongs to the silver brazing alloys. Fig. 1 shows the microstructure of this alloy.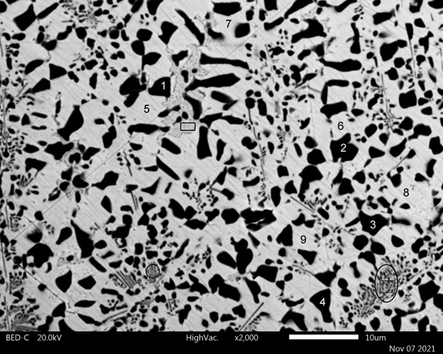
SEM micrograph of the Ag63Cu27In10 alloy.
From Fig. 1, a two-phase microstructure could be identified and is consistent with the XRD analysis (given below) and phase diagram of this ternary system (Muzzillo and Anderson, 2018). Numbers in Fig. show the places where the EDS analysis was performed. The EDS chemical analysis of both phases has confirmed the existence of Ag-rich and Cu-rich phases, and their average composition is given in Table 1.
Measured
Thermodyn. equilibrium at 350 °C
Phase/Metal
(Ag)
(Cu)
(Ag)
(Cu)
Silver, Ag
82.59
3.78
85.22
0.16
Copper, Cu
5.27
94.32
1.49
99.15
Indium, In
12.14
1.90
13.29
0.69
It is interesting to underline that the alloy tends to concentrate the whole copper in its phase, with the Cu content higher than 99.99 % at room temperature equilibrium and about 0.01 % in Ag rich phase (which then becomes a pure two-component phase). It is also illustrated with the calculated equilibrium at 350 °C given in Table 1. This temperature is chosen as the lower part of experimental phase diagrams and temperature far below any (theoretical) multiphase phase transformation reaction in the Ag-Cu-In ternary system (Chang et al., 1977).
Naturally, the composition on the right side of Table 1 has not been reached. Still, the compositions of the phases are very similar, with nearly 95 % pure copper in one phase and another as almost pure Ag-In phase (with just about 5 % of Cu). It is worth saying that the measurement of the phase composition was difficult since the areas of pure phases were only a few micrometers in any direction. Thus, the influence of another phase is almost inevitable (including the depth of the X-ray penetration at 20 kV).
The marked surfaces in Fig. 1 present the eutectic areas. They are characteristic of the ternary silver-copper alloys; this is particularly pronounced in the Ag-Cu-Zn alloys (Dimitrijevićet al., 2018) and also present in the tested Ag-Cu-Pd alloy (Dimitrijević et al., 2020). Their composition was very similar to the whole alloy composition. The composition range was: Ag 65–68 %, Cu 23–36 %, and In 7–11 %. The largest area of that type is in the lower-left corner, marked with the ellipse (rectangle inside of it presents the site of interest for the EDS analysis). The silver content was higher, and lower concentrations of the other two components were obtained, especially for copper. Small dimensions of the structures (copper-rich areas) can explain these results.
Potentiostatic polarization curves for the Ag-Cu-Zn and Ag-Cu-Pd alloys were published in the previous paper (Dimitrijevićet al., 2018), and now have been completed with the measurement for the Ag63Cu27In10 alloy, whose potentiostatic current transients are present in Fig. 2.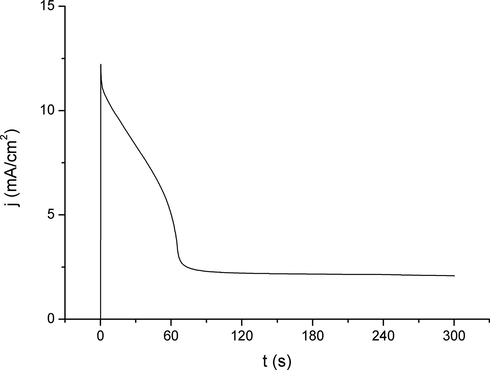
Chronoamperometric current–time curves for the Ag63Cu27In10 alloy at 25 °C in 3.5 % NaCl solution at E = +0.50 V vs SCE.
In Fig. 2, an apparent similarity can be seen between the indium alloy and the other two alloys of the Ag-Cu-X system. Characteristically the pseudo steady state was the feature for all three alloys; here, the current density (j) value was the highest among them (about 2 mA/cm2). However, this flattening of the curve for j has started earlier than for both other alloys. Additionally, the maximum value of j was between values for the alloys containing Pd and Zn, indicating that the corrosion resistivity of the In-containing alloy is just between them.
The bulk concentrations of metals in solution after the potentiostatic polarization are 297 ppb for Cu, 32 ppb for In, and < 10 ppb for Ag. The silver concentration was near the detection limit, and since the analyses were performed in triplicate, only one result was exactly 10 ppb, and two were below that value. These results indicate a rapid formation of surface layers, preventing the initial dissolution of all metals (electroleaching; practically electrochemical dealloying for this type of alloy). Surprisingly, the copper concentration was tenfold higher than the indium concentration, but this could be a consequence of the copper (I) soluble complexes formation and formation of Cu2+ ion and higher concentration of In in the Ag rich phase, which are significant subjects discussed in the explanation of Fig. 3.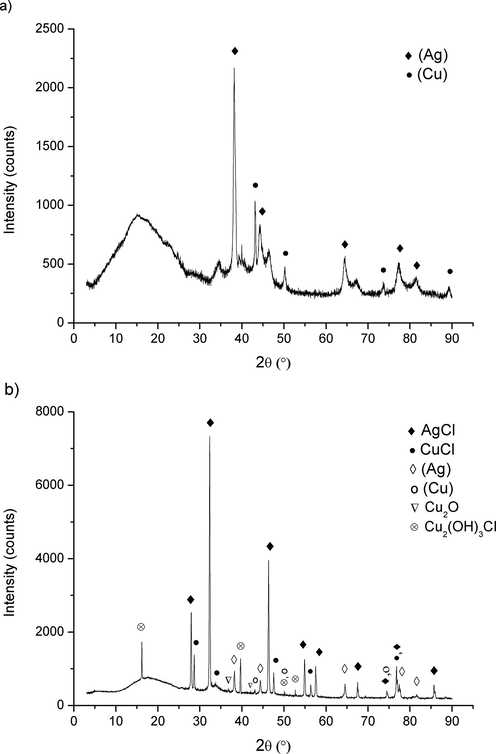
XRD pattern of Ag63Cu27In10 alloy; a) untreated, b) after anodic polarization.
The XRD analysis has provided a significant insight into the alloy structure and primary constituents of anodic film on the alloy surface. The XRD diffractograms of Ag63Cu27In10 before and after anodic polarization at the studied conditions are given in Fig. 3.
The indium-bearing silver-copper alloy is the typical two-phase alloy. From a phase diagram of the Ag-Cu-In system, the alloy is deep in a region where the silver rich (Ag) and copper reach (Cu) phases are stable (Muzzillo and Anderson, 2018). Due to the better solubility of indium in silver, it has a higher concentration in the (Ag) phase, besides that both metallurgy phases contain all three metals. Fig. 3 a) is just an explicit confirmation of the previous. Fig. 3 b) reveals that AgCl and CuCl are the main products at the alloy surface. The XRD pattern of CuCl was weak, probably due to its high porosity and lower thickness than AgCl film, since the intensity of XRD peaks is highly influenced by both (Singh et al., 2014; Serafińczuk et al., 2020). Contrary to this, the AgCl XRD pattern was apparent, suggesting that a silver chloride film was more compact and thicker than the film from copper (I) chloride. It further explains a lack of indium in bulk solution and supports the previous explanation in the paragraph.
In contrast to the other two alloys, the anodic oxidation on the surface of indium bearing one produces two valent copper in the form of Cu(OH)3Cl. Although it had no pronounced peaks, copper oxychloride features a full diffractogram pattern, suggesting that the presence was not questionable. The XRD results, together with the chemical analysis of solution, indicate that the CuCl oxidation to Cu2 + ion was the main reaction that produced two valent copper. The authors detected copper(I) oxide in Fig. 3, but it was characterized by the featureless pattern and absence of significant peaks. The only clear peak for Cu2O at about 36.5° was very weak, and no convincing evidence of its existence on the alloy surface. The second peak was even less noticeable, supporting the previous conclusion that Cu2O could be present just as the trace component.
3.1 LDI MS analysis
The LDI MS analysis consists of two parts. First, the reference mass spectra of anode films of pure Ag and Cu are shown individually. In the second part, the LDI MS of samples contains results from the negative mode of the anode films of Ag60Cu26Zn14, Ag58.5Cu31.5Pd10, Ag63Cu27In10, and positive mode of Ag63Cu27In10 (since the results of the positive mode of two other alloys have been discussed earlier (Dimitrijević et al., 2020).
Generaly, varying the laser intensity can lead to a small change in the intensity ratio of detected peaks. The spot inhomogeneity on the MALDI-plate can also cause the same effect. However, since the aim of this paper was not to determine the optimal conditions for obtaining and stability of the detected clusters, the mass spectra illustrating these observations have not been presented. It is known that the LDI mass spectra are not entirely indifferent to the solvent used for sample preparation, which is why water and ethanol are used as solvents in our research (Pavlov and Attygalle, 2012). The mass spectra recorded from both solvents differ slightly; the spectra obtained with water are presented in this paper.
3.1.1 LDI MS analysis of the reference mass spectra
As alredy mentioned, the interaction of laser radiation with silver and copper salts or oxides can lead to the formation of their heterogeneous clusters (Qin et al., 1997; Rashidzadeh and Guo, 1999). For example, the LDI mass spectrum of AgCl salt includes peaks of Ag+, Ag2+, Ag2C1+, Ag3Cl+, Ag2Cl2+, and Ag3C13+ clusters (Qin et al., 1997). On the other hand, different types of lasers were used for characterization the clusters of copper (I) chloride, copper (II) chloride, and copper trihydroq-chloride by the LDI MS: in the case of the LDI Fourier transform ion cyclotron resonance mass spectrometer (LDI FT ICR MS) was used an internal Nd:YAG laser at 355 nm; the laser microprobe mass analyzer (LAMMA) was equiped quadrupled Nd:YAG laser at 266 nm; the LDI Fourier transform mass spectrometer (FTMS) was equiped excimer laser at 248 nm, and the LDI TOF MS with nitrogen laser at 337 nm.
It should be noted that the LDI mass spectra for three compounds contain very similar clusters, such as Cu2Cl+ and Cu3Cl2+ in the positive mode, and CumCln− (m = 1–2, n = 1–5) in the negative mode, while Cu2OH+ is only detected on copper trihydroxy-chloride (Colin et al., 1998; Zhang et al., 2003; Ruttink et al., 2011). Despite these facts, Colin et al. have used the LAMMA and LDI FTMS to characterize the corrosion layer formed on the surface of copper-nickel alloys. They have identified the corrosion products by comparison the mass spectra of sample with the mass spectra of copper (I) chloride, copper (II) chloride, copper (I) oxide, and copper trihydroxy-chloride solution (Colin et al., 1998).
In this work, the referent mass spectra were the LDI MS (the negative and positive mode) of the anode films of pure Ag and Cu (Figs. 4 and 5). Analysis of the anode film of Ag using the LDI MS produced the following peaks in the positive mode (Fig. 4a): Ag+ (m/z 107.14, 109.15 calcd 106.90, 108.90), AgCl-Na+ (m/z 165.20, 167.22, 168.21 calcd 164.86, 166.86, 168.86), Ag2+ (m/z 214.19, 216.18, 218.21 calcd 213.81, 215.81, 217.81), AgCl-Na2Cl+ (m/z 223.24, 225.25, 227.26, 229, 29 calcd 222.82, 224.82, 226.82, 228.82), Ag2Cl+ (m/z 249.23, 251.24, 253.21, 255.15 calcd 248.78, 250.78, 252.78, 254.78), Ag2Cl2-Na+ (m/z 307.28, 309.29, 311.30, 313.29 calcd 306.78, 308.73, 310.73, 312.73), and Ag3Cl2+ (m/z 393.29, 395.37, 397.31, 399.23 calcd 390.65, 392.65, 394.65, 396.65, 398.65, 400.65).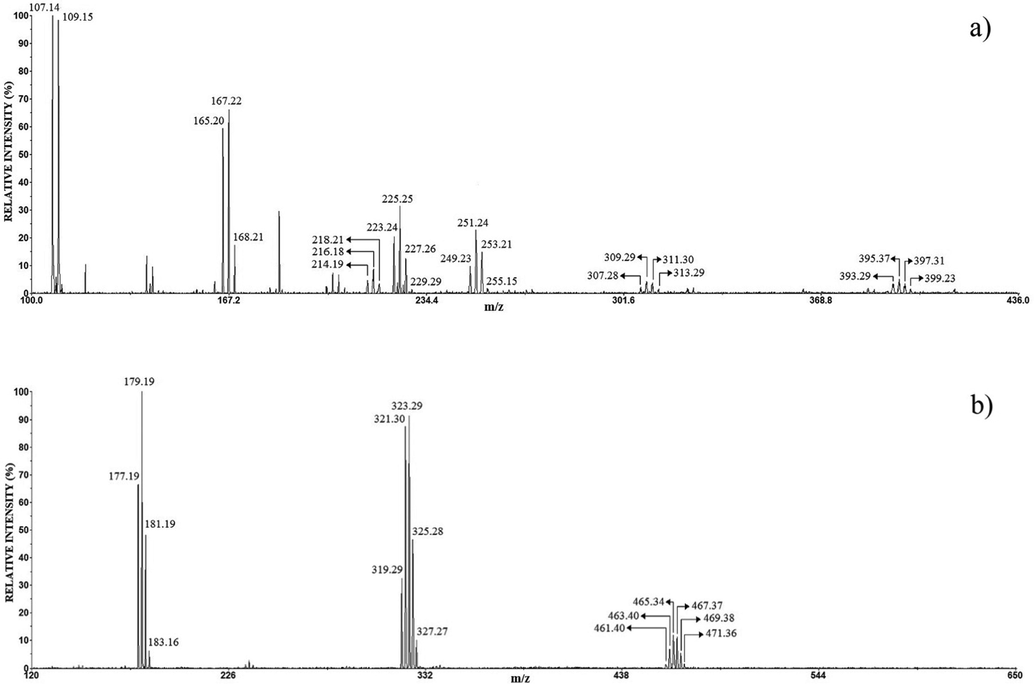
The positive (a) and negative (b) mode LDI mass spectrum of the anode film of Ag.
The positive (a) and negative (b) mode LDI mass spectrum of the anode film of Cu.
A smaller number of peaks were obtained in the negative than in positive mode LDI MS, the three characteristic peaks in Fig. 4b are: AgCl2- (m/z 177.19, 179.19, 181.19, 183.16 calcd 176.84, 178.84, 180.83, 182.84), Ag2Cl3- (m/z 319.29, 321.30, 323.29, 325.28, 327.27 calcd 318.72, 320.71, 322.71, 324.71, 326.71, 328.71), Ag3Cl4- (m/z 461.40, 463.40, 465.34, 467.37, 469.38, 471.36 calcd 460.59, 462.59, 464.58, 466.58, 468.58, 470.579, 472.59, 474.58). The dominant ions were: Ag+ and AgCl−Na+ in the positive mode, and AgCl2−, Ag2Cl3− in negative mode, in both mode the lower-intensity peaks are also clusters of silver and chlorine. Here, the results idicate that the main product of corrosion is AgCl.
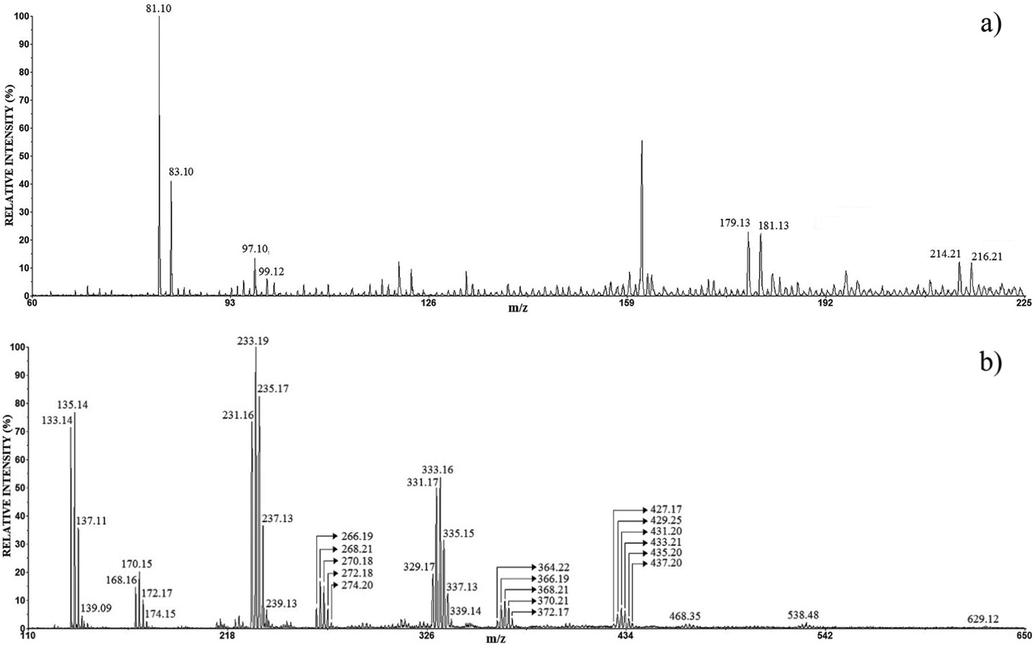
The positive mode LDI MS of the anode films of pure Cu (Fig. 5a) contain folow peaks: Cu(H2O)+ (m/z 81.10, 83.10 calcd 80.94, 82.94), and the low-intesity CuO(H2O)+ (m/z 97.10, 99.12 calcd 96.94, 98.93), Cu2(OH)(H2O)2+ (m/z 179.13, 181.13 calcd 178.88, 180.88) and Cu2O(H2O)4+ (m/z 214.21 216.21 calcd. 213.90, 215.89).
Fig. 5b demonstrates that the set of copper chloride cluster ions are detected in the negative mode: CuCl2− (m/z 133,14, 135.14, 137.11, 139.09 calcd 132.87, 134.86, 136.86, 138.86), CuCl3- (m/z 168.16, 170.15, 172.17, 174.15 calcd 167.84, 169.83, 171.83, 173.83), Cu2Cl3- (m/z 231.16, 233.19, 235.17, 237.13, 239.13 calcd 230.77, 232.76, 234.76, 236.76, 238.76), Cu2Cl4- (m/z 266.19, 268.21, 270.18, 272.18, 274.20 calcd 265.73, 267.73, 269.72, 271.73, 273.72), Cu3Cl4- (m/z 329.17, 331.17, 333.16, 335.15, 337.13, 339.14 cald 328.66, 330.66, 332.65, 334.65, 336.65, 338.65), Cu3Cl5- (m/z 364.22, 366.19, 368.21, 370.21, 372.17 calcd 363.63, 365.63, 367.63, 369.62, 371.62), Cu4Cl5- (m/z 427.17, 429.25, 431.20, 433.21, 435.20, 437.20 calcd 426.56, 428.56, 430.56, 432.55, 434.55, 436.55), peaks of very low intensity above m/z 450 indicate the presence Cu4Cl6− (m/z about 468.35), Cu5Cl6− (m/z 538.48), Cu6Cl7− (m/z 629.12). This spectrum contains clusters of the type CumCln−, m = 1–2, n = 2–6 which is similar to previously published spectra (Colin et al., 1998; Zhang et al., 2003; Ko et al., 2011; Ruttink et al., 2011). Ko et al have shown that the CuCln (n ≥ 2) belongs in the group of “superhalogen” clusters, while Cu2Cl3 and Cu2Cl4 also show the “superhalogen” properties where the core is a (CuCl)2 (Ko et al., 2011). Generally, the “superhalogen” are clusters with electron affinities higher than that of Cl (3.6 eV is the highest electron affinities among all the elements in the periodic table), while the “superalkali” are clusters with ionization energies less than the ionization energies of alkaline atoms. This is important information, because if corrosion products build the “supehalogen” or “superalkali” clusters, they are very fast and easy detection using the LDI MS. The LDI mass spectra in Fig. 5a and b show that the copper corrosion film is not composed of one dominant compound. In the positive mode, the low-intensity ions copper with oxygen (Cu2(OH)(H2O)2+, Cu2O(H2O)4+) indicates that Cu2(OH)3Cl and Cu2O are present in a small amount in sample; while the negative mode reveals the cluster-ions copper with chlorine which indicate the presence of CuCl and CuCl2. The result is consistent with the XRD analysis showed that in the case of copper, the corrosion products were CuCl, Cu2O, and Cu(OH)Cl.
Here, it is useful to emphasize that there is no overlap m/z of clusters formed from the anode film of silver and copper (comparing Figs. 4 and 5) indicating that both mode LDI MS can be used for characterization the Ag-Cu alloys.
3.1.2 LDI MS analysis of Ag60Cu26Zn14, Ag58.5Cu31.5Pd10 and Ag63Cu27In10
The negative mode LDI mass spectra of the anode films of Ag60Cu26Zn14, Ag58.5Cu31.5Pd10, and Ag63Cu27In10 are shown in Figs. 6, 7, and 8, respectively.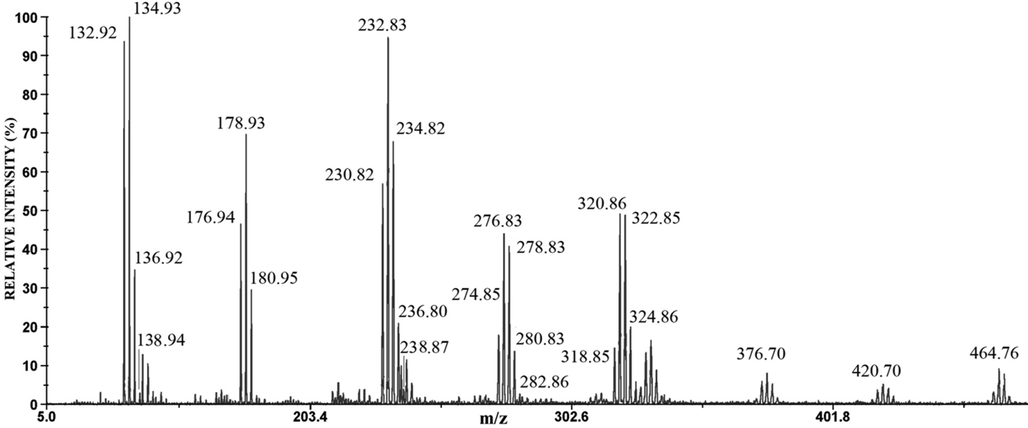
The negative mode LDI mass spectrum of the anode film of Ag60Cu26Zn14 alloy.
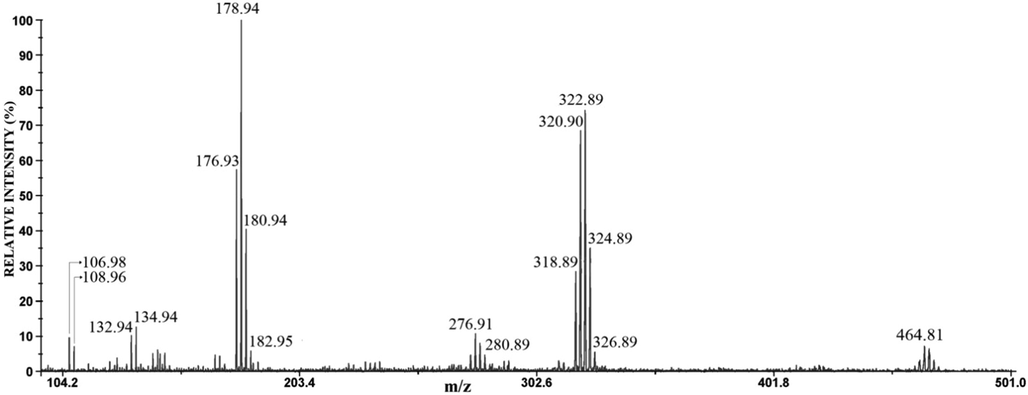
The negative mode LDI mass spectrum of the anode film of Ag58.5Cu31.5Pd10 alloy.
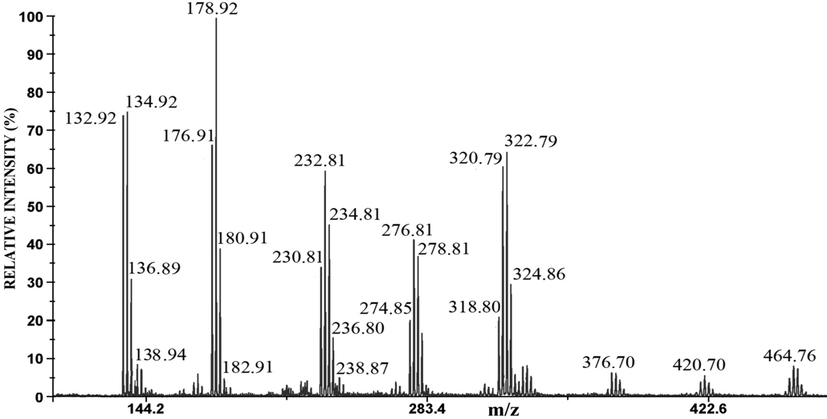
The negative mode LDI mass spectrum of the anode film of Ag63Cu27In10 alloy.
The mass spectrum of the anode film of Ag60Cu26Zn14 alloy contains eight groups of peaks around m/z 135 and 233 (the highest intensity), at m/z 179, 277, and 323 (the medium intensity), and around m/z 325, 377, 421, 465 (the lowest intensity) (Fig. 6). In the mass spectrum of the anode film of Ag-Cu-Pd (Fig. 7), there are smaller numbers of a group of peaks than in Fig. 6; the major ions are around m/z 179 and m/z 323, while ions around m/z 135, 277, and 465 have very low intensities (Fig. 7). The mass spectrum of anode film of Ag63Cu27In10 alloy (Fig. 8) is very similar to Fig. 6. The ions around m/z 179 and m/z 135 have the highest intensity, while around m/z 233, 277, 323 are of medium intensity, and around m/z 377, 421, and 465 have the lowest intensity (Fig. 8). The identification of these peaks can be quickly obtained by comparison with the mass spectra of pure Ag and Cu (Table 2).
Negative ions
m/z exp.
m/z calc.
Ag60Cu26Zn14 Fig. 4
Ag58.5Cu31.5Pd10 Fig. 5
Ag63Cu27In10 Fig. 6
CuCl2−
132.92 134.93 136.92 138.94
132.87 134.86
136.86 138.86High intensity
Low intensity
High intensity
AgCl2−
176.94 178.93 180.94 182.95
176.84 178.84
180.84 182.84Medium intensity
High intensity
High intensity
Cu2Cl3−
230.82 232.83 234.82 236.80 238.87
230.77 232.76
234.76 236.76 238.76High intensity
/
Medium intensity
Ag2Cl3−
318.85 320.86 322.85 324.86 326.80
318.72 320.72
322.71 324.71 326.71Medium intensity
Medium intensity
Medium intensity
Cu3Cl4−
328.74 330.69 332.70 334.71 336.71
328.66
330.66
332.66
334.65
336.65Low
intensity/
Low
intensity
Ag3Cl4−
460.76 462.75 464.76 466.72 468.67
460.59
462.59
464.58
466.58
468.58Low
intensity/
Low
intensity
Additionally, a detailed analysis of isotopology of these ions is presented, in order to test our approach. The results, obtained on the basis of data from the Ag60Cu26Zn14 sample (Fig. 6), are listed in Table 3. Similar results were obtained from the other two samples (due to the similarity of numerical values, they are not shown in the paper).
Ions detected in the negative mode of LDI MS for Ag60Cu26Zn14
Experimental values
Theoretical values Absolute error
(in bracket)Ions detected in the negative mode of LDI MS for Ag60Cu26Zn14
Experimental values
Theoretical values Absolute error
(in bracket)
CuCl2−
39.72 ± 0.72
39.45 (Δ0.27)
AgCl2−
30.08 ± 1.27
29.57 (Δ0.51)
42.51 ± 1.16
43.16 (Δ0.65)
47.32 ± 0.81
46.64 (Δ0.68)
14.52 ± 0.54
15.54 (Δ1.02)
20.11 ± 1.68
20.89 (Δ0.78)
1.52 ± 0.30
1.86 (Δ0.34)
2.60 ± 0.88
2.89 (Δ0.29)
Cu2Cl3−
21.13 ± 1.92
20.61 (Δ0.52)
Ag2Cl3−
11.26 ± 0.88
11.58 (Δ0.32)
39.65 ± 1.64
38.39 (Δ1.26)
32.31 ± 2.76
32.76 (Δ0.45)
26.83 ± 3.56
28.45 (Δ1.61)
33.99 ± 0.57
34.55 (Δ0.56)
10.20 ± 1.60
10.48 (Δ0.28)
16.13 ± 1.78
16.89 (Δ.76)
2.17 ± 0.67
1.92 (Δ0.25)
3.55 ± 0.44
3.87 (Δ0.32)
7.35 ± 4.62
7.49 (Δ0.14)
It can be seen from Table 3 that the differences between experimental and theoretical values are in the range from Δ0.06 to Δ1.26, but the difference in most cases is around or below Δ0.5; this suggests that the dominant ions from the reference spectra can be easily recognized in the LDI MS of sample.
To identify the low-intensity peaks, the zoomed selected part of mass spectrum of the Ag-Cu-Zn sample (from Fig. 6) are presented in Fig. 9: a) m/z 328–338; b) m/z 372–381; c) m/z 416–425; d) m/z 460–469. The corresponding theoretical isotopology of the assumed ion stoichiometries is also shown in the same Figure. Based on the reference spectra (Fig. 4b and 5b), it was found that the low-intensity peaks at m/z 328.7360; 330.6932; 332.7049; 334.7105; 336.7136 and m/z 460.7611; 462.7460; 464.7596; 466.7192; 468.6731 originate from Cu3Cl4− (Fig. 9a), and Ag3Cl4− (Fig. 9d), respectively. However, some peaks (m/z 274–282, m/z 372–381, and m/z 416–425) detected in the mass spectra of sample do not exist in the reference spectra which require an additional verification. It was identified that m/z 274.85, 276.83, 278.83, 280.83, 282.86 (calcd 274.74, 276.74, 278.74, 280.74, 282.74) correspond to AgCuCl3− (AgCl-CuCl2−), because the mean experimental value of relative abundances for their individual isotopics are in a good agreement with corresponding theoretical values (exp. 15.33 ± 0.79, 36.21 ± 0.70, 30.46 ± 3.53, 11.60 ± 0.67, 2.49 ± 0.49 calcd 15.45, 36.27, 31.92, 13.42, 2.72).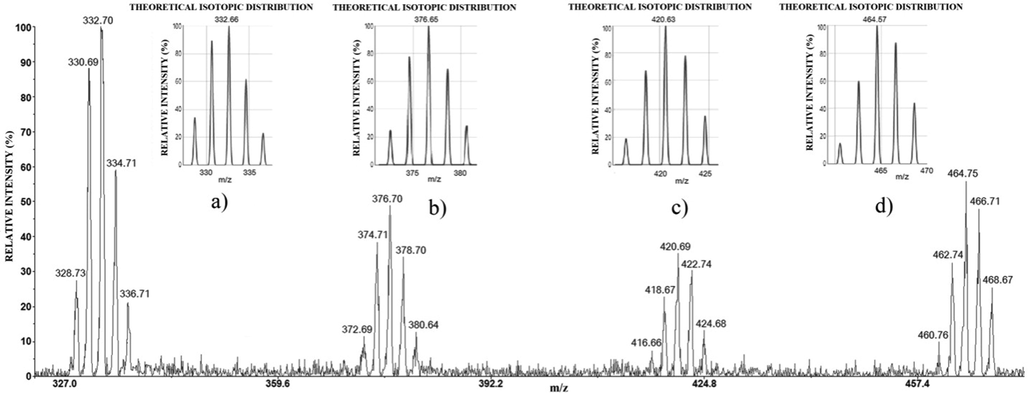
The selected part of negative mode LDI mass spectrum of Ag-Cu-Zn sample: m/z 328–338 (a); m/z 372–381 (b); m/z 416–425 (c); m/z 460–469 (d), with the corresponding theoretical isotopology of the assumed ion stoichiometries.
Also, by comparing experimental with the corresponding theoretical isotopic pattern it was identified that peaks at m/z 372.6994; 374.7102; 376.7030; 378.7078; 380.6421 and at m/z 416.6679; 418.6467; 420.6953; 422.7430; 424.6893 correspon to AgCu2Cl4− (AgCl-CuCl-CuCl2-) (Fig. 9b) and Ag2CuCl4− (AgCl-AgCl-CuCl−) (Fig. 9c), respectively.
The positive mode of anode films of the Ag63Cu27In10 alloy is presented in Fig. 10.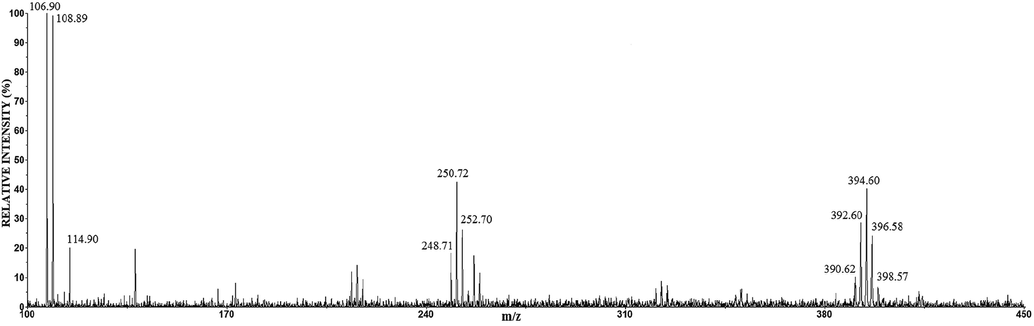
The positive mode LDI mass spectrum of anode film of the Ag63Cu27In10 alloy.
The mass spectrum of anode film of the Ag63Cu27In10 alloy (Fig. 10) is similar to the positive mode of Ag60Cu26Zn14 and Ag58.5Cu31.5Pd10 (presented in reference Dimitrijević et al., 2020). The peaks around m/z 107 have the highest intensity; while around m/z 250 and 394 are of the medium intensity. The peak at m/z 114.94 corresponds to In+. By comparison the positive mode of sample with the reference spectra (Fig. 4a), the characteristic Ag+ and Ag2Cl+ ions were identified. The reference spectrum Cu contains Cu(H2O)+, CuO(H2O)+, Cu2O(OH)4+ (Fig. 5a), while the low-intensity Cu(H2O)+, CuO(H2O)+, and Cu2O doped with chloride anion (Cu2OCl(H2O)2+ ) were recognized in the positive mode LDI MS of Ag63Cu27In10. The attention should be paid in identificationh the peak around m/z 394; according to the reference spectrum, this peak corresponds to the Ag3Cl2+ cluster (Fig. 4a); however its isotopology indicates on (CuCl)3Cu(OH)2+ (Fig. 10).
Comparing the corroded surfaces to the reference spectrum leads to these results. The predominance of silver element indicates that the analyzed corrosion products are mainly the silver-based compounds. It has been shown that the positive and negative mode LDI mass spectrum of these three alloys contains the cluster ions AgnCln+1−/+ (n = 1–3); hence it can be concluded that AgCl is the predominant corrosion product, which is in agreement with the XRD results. The LDI MS analysis of Ag60Cu26Zn14 and Ag63Cu27In10 indicates the presence CuCl, CuCl2 (due to detected CuCl2−, Cu2Cl3−, Cu3Cl4−, AgCuCl3− (AgCl-CuCl2−), AgCu2Cl4− (AgCl-CuCl-CuCl2−), and Ag2CuCl4− (AgCl-AgCl-CuCl−)), and Cu2(OH)3Cl (detected Cu2(OH)(H2O)2+). Similar to the XRD analysis, the presence of a small amount of Cu2O (detected Cu(H2O)+, CuO(H2O)+, Cu2OCl(H2O)2+ ) was also detected here, which is in accordance with the results of other authors (Zaky, 2006; Hazzazi et al., 2008). Unlike the previous cases, a very low-intensity CuCl2− ion was detected in the LDI MS of Ag58.5Cu31.5Pd10, while AgCu2Cl4− (AgCl-CuCl-CuCl2−) and Ag2CuCl4− (AgCl-AgCl-CuCl−) were not detected what suggested the presence of trace amounts of copper chloride in sample. The low-intensity ions, derived from copper chloride for the Ag58.5Cu31.5Pd10 alloy, are consistent with the low signal intensity in the Raman analysis for the said compound, as it was explained earlier (Dimitrijević et al., 2020). The negative mode LDI MS shows that the presence of Zn and In in the Ag-Cu alloys give similar results, while Pd affects the reduction of corrosion products; these findings are in agreement with the positive mode results (Dimitrijević et al., 2020), and XRD analysis. The presence of Zn leads to the formation of a zinc component in corrosion film (zinc oxychloride). Palladium leads to the Cu-Pd intermetallic and Cu rich phase with a high content of Pd with the consequence that the phase is more prone to the corrosion (similar or even nobler than Ag rich phase; here Ag rich phase act almost as pure silver, which is actually by the composition (see Table 1). The alloy with indium as the third component is specific in the way that the Cu rich phase is nearly pure copper (Table 1) and consequently has the almost identical characteristic of Cu, such as the appearance of two valent copper chloride. It should be emphasized that there is a mutual influence of silver and copper compounds on the peaks occurring in the LDI MS of alloys, as evidence are AgCuCl3− (AgCl-CuCl2−), AgCu2Cl4− (AgCl-CuCl-CuCl2−), and Ag2CuCl4− (AgCl-AgCl-CuCl−) ions. Also, the peaks can be detected in the LDI MS as there are no in reference mass spectrum, such as (CuCl)3Cu(OH)2+ clusters. However, these clusters confirm the previous observation.
The LDI MS have limitations and advantages like all methods. The advantage of the LDI MS method is that the spectra are obtained very quickly, practically without sample preparation. In our case, the introduction of reference spectra for pure metals (where corrosion products are known) provides information about the type of cluster that these products formed; thus, the identification of peaks from the sample is significantly facilitated, and hence the identification of corrosion products. The results of the LDI MS analysis are in a good agreement with the XRD analysis with small deviations. For example, the LDI mass spectra additionally suggest the possibility of CuCl2 presence; hence, it is essential to consider its origin. The formation of CuCl is followed by the second step of reaction, where the copper (I) chloride complex in the form of CuCl2− is formed and generally known to be the dominant Cu(I) spices in solution at Cl− ion concentration below 0.7 mol/dm3 (0.6 mol/dm3 in this study) (Lee and Nobe, 1986; Zhao et al., 2013). However, at potentials of about + 0.4 V vs SCE and higher (+0.5 V in this work), the oxidation of adsorbed CuCl2− from surface to Cu2+ ion becomes the most favorable reaction in the system (on Cu rich phase of the alloys in this case), making it (finally) the dominant Cu dissolved spices in solution (Lee and Nobe, 1986). According to these data, it can be assumed that a certain amount of copper (II) chloride is retained in a porous film; therefore, it can participate in the formation of “superhalogen” clusters that are easily detected in the LDI mass spectrum. On the other hand, in some cases it is difficult to distinguish the origin of the cluster, which is a limitation of the LDI MS method. However, further investigations into the stability and structure of the clusters of interest may help to overcome the problem.
4 Conclusion
The LDI MS (negative and positive mode) was used to determine the corrosion products on the surface of the Ag-Cu-M (M = Zn, Pd, and In) alloys, which are widely used in various fields of industry. In this work, the identification of the LDI MS of samples was performed using the characteristic clusters created in the reference spectra. The reference spectra were the LDI MS (negative and positive mode) of the Ag and Cu anode films, obtained under the same conditions like the anode films of sample. The results have shown that knowing the clusters appearance in the reference spectra facilitates the identification of the LDI mass spectra of the alloys. Usually, in mass spectrometry, the identification of organic compounds is performed using the databases of their fragments (these databases are an integral part of the software of modern MS instruments). Therefore, formation the databases of clusters from the reference spectra provide an opportunity for the LDI MS to become a routine method in the field of corrosion. The results also showed that the cluster ions such as, AgCuCl3− (AgCl-CuCl2−), AgCu2Cl4− (AgCl-CuCl-CuCl2−), and Ag2CuCl4− (AgCl-AgCl-CuCl−) confirm that there are the mutual influences of Ag and Cu on the LDI MS of the anode film of the Ag60Cu26Zn14, Ag58.5Cu31.5Pd10, and Ag63Cu27In10 alloys, which additionally facilitates the interpretation of their mass spectra.
The LDI MS analysis confirms the results obtained by the Raman and XRD methods, but it should be noted that LDI MS requires a much smaller amount of sample than the XRD analysis and that the reproducibility of LDIMS spectra is much better than in the case of Raman spectroscopy. It should also be noted that the LDI MS analysis provides the additional information that can open up a new view of the corrosion process. The LDI mass spectra suggest the presence of CuCl2 as a corrosion product. The copper (II) chloride complex is the characteristic corrosion product for the tested alloys at high concentrations of chloride ions but in solutions. There is a possibility that it is partly present in porous films, but due to their extremely small concentration (tenths of ppm), so far, it has not been detected by the standard methods such as the Raman and XRD analysis, but, due to a fact that the CuCl2 forms the “superhalogen” clusters, it can be easily detected in the LDI MS.
As a fast method that does not require special sample preparation, the LDI MS method, together in positive and negative modes, provides the important information in the field of corrosion testing. The increase in the scope of theoretical and experimental investigation of metal clusters can significantly contribute to solving doubts arising during the analysis of the LDI mass spectrum.
Acknowledgments
This paper was financially supported by the Ministry of Education, Science and Technological Development of the Republic of Serbia, Contract Nos.: 451-03-68/2022-14/200135; 451-03-68/2022-14/200052; 451-03-68/2022-14/200017. This publication is based upon work from the COST Action CA20130, European MIC Network – New Paths for Science, Sustainability and Standards, supported by the COST (European Cooperation in Science and Technology).
Declaration of Competing Interest
The authors declare that they have no known competing financial interests or personal relationships that could have appeared to influence the work reported in this paper.
References
- Brimstone Chemistry Under Laser Light Assists Mass Spectrometric Detection and Imaging the Distribution of Arsenic in Minerals. Dalton Trans.. 2018;25:1-21.
- [CrossRef] [Google Scholar]
- Effect of pH Values and Microstructures on Corrosion Behavior of Ag-25Cu Alloys in NaCl Acidic Solutions. J. Mater. Eng. Perform.. 2021;30:479-487.
- [CrossRef] [Google Scholar]
- Potential of laser ablation and laser desorption mass spectrometry to characterize organic and inorganic environmental pollutants on dust particles. Rapid Commun. Mass Spectrom.. 2005;19:871-888.
- [CrossRef] [Google Scholar]
- Phase diagrams and thermodynamic properties of ternary copper-silver systems. J. Phys. Chem. Ref. Data.. 1977;6:621-674.
- [CrossRef] [Google Scholar]
- Applications of laser desorption-fourier transform mass spectrometry to polymer and surface analysis. In: Lubman D.M., ed. Lasers and Mass Spectrometry. London: Oxford University Press; 1990.
- [Google Scholar]
- Characterization of the corrosion layer of copper-nickel alloys in a synthetic sweat medium by FTMS and LAMMA laser microprobes. Appl. Surf. Sci.. 1998;125:29-45.
- [CrossRef] [Google Scholar]
- The Corrosion Behavior of an Ag43Cu37Zn20 Alloy in the Natural Seawaters. Mater. Trans.. 2015;56:2088-2091.
- [CrossRef] [Google Scholar]
- Raman spectroscopy study of anodic film onAg43Cu37Zn20 alloy. Optoelectron. Adv. Mater. Rapid Commun.. 2016;10:777-780.
- [Google Scholar]
- Experimental Investigation of Microstructure and Phase Transitions in Ag-Cu-Zn Brazing Alloys. J. Mater. Eng. Perform.. 2018;27:1570-1579.
- [CrossRef] [Google Scholar]
- Complementary methods for characterization of the corrosion products on the surface of Ag60Cu26Zn14 and Ag58.5Cu31.5Pd10 brazing alloys. Corros. Rev.. 2020;38:111-125.
- [CrossRef] [Google Scholar]
- Visual authentication of steroidal saponins in Allium macrostemon Bge. and Allium chinense G. Don using MALDI-TOF imaging mass spectrometry and their structure activity relationship. Arab. J. Chem.. 2022;15:104138
- [CrossRef] [Google Scholar]
- MALDI Imaging Mass Spectrometry—A. Mini Review of Methods and Recent Developments, Mass. Spectrom. (Tokyo). 2013;2:S0022.
- [CrossRef] [Google Scholar]
- CRC Handbook of chemistry and physics: a ready-reference book of chemical and physical data. Boca Raton, Florida: CRC Press; 2014.
- Passivation and Cl¯ Induced Depassivation of Cu-Ag Alloys in Borate Buffer Solutions. Int. J. Electrochem. Sci.. 2008;3:489-508.
- [Google Scholar]
- Laser Desorption Mass Spectrometry. A Review. In: Benninghoven A., Colton R.J., Simons D.S., Werner H.W., eds. Secondary Ion Mass Spectrometry SIMS V. Springer Series in Chemical Physics. 44. Berlin, Heidelberg: Springer; 1986.
- [CrossRef] [Google Scholar]
- Novel fragmentation process of peptides by collision-induced decomposition in a tandem mass spectrometer: differentiation of leucine and isoleucine. Anal. Chem.. 1987;59:2621-2625.
- [CrossRef] [Google Scholar]
- Superhalogen properties of CumCln clusters: Theory and experiment. J. Chem. Phys.. 2011;135:244312
- [CrossRef] [Google Scholar]
- Enhancement of laser desorption ionization mass spectrometric signals of cesium iodide by elemental sulfur. Rapid Commun. Mass Spectrom.. 2013;27:763-766.
- [CrossRef] [Google Scholar]
- Kinetics and mechanisms of Cu electrodissolution in chloride media. J. Electrochem. Soc.. 1986;133:2035.
- [CrossRef] [Google Scholar]
- Corrosion product film formed on the 90/10 copper–nickel tube in natural seawater: Composition/structure and formation mechanism. Corros. Sci.. 2015;91:245-261.
- [CrossRef] [Google Scholar]
- Laser desorption ionization mass spectrometry: Recent progress in matrix-free and label-assisted techniques, Mass Spec. Rev.. 2017;38:3-21.
- [CrossRef] [Google Scholar]
- Chalcophile chemistry for enhanced detection of copper in its compounds and minerals. Polyhedron.. 2019;167:127-136.
- [CrossRef] [Google Scholar]
- Laser desorption/ionization fourier transform mass spectrometry of thin films deposited on silicon by plasma polymerization of acetylene.J.Am. Soc. Mass Spectrom.. 2010;2:411-420.
- [CrossRef] [Google Scholar]
- Thermodynamic assessment of Ag–Cu–In. J. Mater. Sci.. 2018;53:6893-6910.
- [CrossRef] [Google Scholar]
- Laser desorption ionization time-of-flight mass spectrometric study of binary As-Se glasses. Rapid Commun. Mass Spectrom.. 2010;24:2000-2008.
- [CrossRef] [Google Scholar]
- Laser Ionization Mass Spectrometry of inorganic ions. In: Lee M.S., ed. Mass Spectrometry Handbook. John Wiley & Sons Inc; 2012. p. :1207-1227.
- [Google Scholar]
- Generation and Detection of Gaseous W12O41− and Other Tungstate Anions by Laser Desorption Ionization Mass Spectrometry. J. Am. Soc. Mass Spectrom.. 2009;20:1782-1789.
- [CrossRef] [Google Scholar]
- HCN emission by a Polydesmid Millipede Detected Remotely by Reactive Adsorption on Gold Nanoparticles Followed by Laser Desorption/Ionization Mass Spectrometry (LDI-MS) J Chem Ecol. 2020;46:455-460.
- [CrossRef] [Google Scholar]
- The chemistry of gold clusters in plasma generated with maldi, laser desorption ionisation and laser ablation from various precursors. Chem. Listy.. 2008;102:1394-1398.
- [Google Scholar]
- Laser ablation synthesis of new gold arsenides using nano-gold and arsenic as precursors. Laser desorption ionisation time-of-flight mass spectrometry and spectrophotometry. Rapid Commun. Mass Spectrom.. 2014;28:577-586.
- [CrossRef] [Google Scholar]
- MALDI/SELDI mass-spectrometric surface investigation of AMg-6 and Ad-0 materials. Prot. Met. Phys. Chem. Surf.. 2011;47:756-761.
- [CrossRef] [Google Scholar]
- Laser Desorption/Ionization MassSpectrometric Study of Surface Chemistry of Ad-0 and AMg-6 Alloys. Prot. Met. Phys. Chem. Surf.. 2011;47:133-138.
- [CrossRef] [Google Scholar]
- Comparison of Thermodynamic Characteristics of Desorption and Ionization of Silver Halides from Stainless Steel and Aluminum Based Surfaces According to MassSpectrometry Data. Prot. Met. Phys. Chem. Surf.. 2014;50:121-125.
- [CrossRef] [Google Scholar]
- Time-of-flight mass spectrometric study on UV laser ablation of silver chloride. Appl. Surf. Sci.. 1997;119:321-329.
- [CrossRef] [Google Scholar]
- Generation of large gas-phase silver cluster ions by laser desorption/ionization of silver-containing salts. Chem. phys.. 1999;310:466-470.
- [CrossRef] [Google Scholar]
- Structure and dissociation characteristics of metal chloride anion clusters containing redox-active metal ions studied by laser desorption and electrospray ionization mass spectrometry and ab initio calculations. J. Mass. Spectrom.. 2011;46:223-229.
- [CrossRef] [Google Scholar]
- Microstructure and corrosion behaviour of Cu–Al–Ni shape memory alloys with Ag nanoparticles. Mater. Corros.. 2015;66:527-534.
- [CrossRef] [Google Scholar]
- Depth dependent X-ray diffraction of porous anodic alumina films filled with cubic YAlO3:Tb3+ matrix. Opt. Appl.. 2020;50:127-134.
- [Google Scholar]
- Influence of thickness on optical and structural properties of BiFeO3 thin films: PLD grown. Mater. Res. Bull.. 2014;49:531-536.
- [CrossRef] [Google Scholar]
- Protein and Polymer Analyses up to m/z 100000 by Laser Ionization Time-of-Flight Mass Spectrometry. Rapid Commun. Mass Spectrom.. 1988;2:151-153.
- [CrossRef] [Google Scholar]
- Nanoassisted Laser Desorption-Ionization-MS Imaging of Tumors. Anal. Chem.. 2012;84:6341-6345.
- [CrossRef] [Google Scholar]
- Location of double-bond position in unsaturated fatty acids by negative ion MS/MS. J. Am. Chem. Soc.. 1983;105:5487.
- [CrossRef] [Google Scholar]
- Characterization of the Ag43Cu37Zn20 alloy surface after potentiostatic polarization using LDI-TOF mass spectrometry. Corros. Rev.. 2017;35:473-481.
- [CrossRef] [Google Scholar]
- Effect of Ag on the properties of solders and brazing filler metals. J. Mater. Sci.: Mater. Electron.. 2016;27:1-13.
- [CrossRef] [Google Scholar]
- Studies into new, environmentally friendly Ag-Cu-Zn-Sn brazing alloys of low silver content. Arch. Metall. Mater.. 2011;56:147-158.
- [CrossRef] [Google Scholar]
- Isolation and characterization of bioactive compounds from Lepisorus thunbergianus (Kaulf.) Arab. J. Chem.. 2015;8:407-413.
- [CrossRef] [Google Scholar]
- Role of Cl− in breakdown of Cu–Ag alloys passivity in aqueous carbonate solutions. Electrochim. Acta.. 2006;51:2057-2062.
- [CrossRef] [Google Scholar]
- Reduction of Cu(II) in Matrix-Assisted Laser Desorption/Ionization Mass Spectrometry. J Am Soc Mass Spectrom.. 2003;14:42-50.
- [CrossRef] [Google Scholar]
- Microproperties and interface behavior of the BAg25TS brazed joint. Vacuum.. 2019;169:108928
- [CrossRef] [Google Scholar]
- Electrochemistry of high concentration copper chloride complexes. Anal. Chem.. 2013;85:7696-7703.
- [CrossRef] [Google Scholar]
- Detection and imaging of chrome yellow (lead chromate) in latent prints, solid residues, and minerals by laser-desorption/ionization mass spectrometry (LDI-MS) J. Mass Spectrom.. 2017;52:347-352.
- [CrossRef] [Google Scholar]


