

Translate this page into:
QbD-mediated RP-UPLC method development invoking an FMEA-based risk assessment to estimate nintedanib degradation products and their pathways
⁎Corresponding author. mshivashankar@vit.ac.in (Shivashankar Murugesh)
-
Received: ,
Accepted: ,
This article was originally published by Elsevier and was migrated to Scientific Scholar after the change of Publisher.
Peer review under responsibility of King Saud University.
Abstract
QbD is considered an important, fundamental, and integral part of dosage form development. Despite its significance in drug formulations, the knowledge, reference, and guidance for using QbD in analytical science have not been thoroughly documented in the literature. The present study is aimed at bridging the gap between its generated data and the unexplored terrain in formulation science. This study is novel because, for the first time, an exclusive shorter run time UHPLC method for estimating degradation products was developed through the QbD approach, validated, and proved stability indicative. Five degradation impurities were separated and well characterized. Further, the degradation pathway of the anticancer drug nintedanib (NIN) was explored for the first time in the soft gel formulation using tandem quadrupole MS abetted mass identification, and ESI/MS/MS aided structure elucidation was performed. By carefully demonstrating the step-by-step procedure for QbD-based optimization, parameters such as the analytical target profile (ATP) and critical quality attributes (CQAs) were assessed. The risk assessment was performed using failure mode effect analysis (FMEA). Critical method attributes and critical method parameters were identified based on the magnitude of the calculated risk priority number (RPN) value. Designed experiments using 4-factor two-level factorial design monitored three critical quality attributes to arrive at a method operable design space (MODS). The effect of individual method attributes was also analyzed using half-normal and Pareto charts. Control strategies design and RPN values were recalculated based on the DOE output. This RPN value is eventually identified to be significantly smaller and satisfactory within the allowable limit.
Keywords
QbD
Analytical
Degradation
UHPLC
MS
Impurities

1 Introduction
Idiopathic pulmonary fibrosis (IPF) is a progressive and eventually lethal lung disorder that leads to damage of lung function with deteriorating dyspnea and respiratory reflex (Keating, 2015). The occurrence of IPF in Europe and North America in the year 2000 was reported in nearly 6 people out of 0.1 million. Most studies showed an increase in occurrence over time (Hutchinson et al., 2015). Nintedanib binds competitively to the ATP binding pocket of fibroblast growth factor receptors, platelet-derived growth factor receptors, and vascular endothelial growth factor receptors and blocks the intracellular signaling that is crucial for the proliferation, migration, and transformation of fibroblasts representing the essential mechanism of action for IPF pathology (Mazzei et al., 2015).
The investigational drug is a salt form of nintedanib ethanesulfonate, which contains a carboxylic acid group linked to an indole ring. It is a chemically ethanesulfonic acid, namely, methyl 2-hydroxy-3-[N-[4-[methyl-[2-(4-methylpiperazin-1-yl)acetyl]amino]phenyl]-C-phenylcarbonimidoyl]-1H-indole-6-carboxylate, with a molecular weight of 649.76 g/mol and a base molecular weight of 539.62 g/mol (Togami et al., 2018). The ethane sulfonate salt is a bright yellow powder with pH-dependent solubility. The solubility increases at lower pH and decreases at higher pH. This result is largely due to the non-protonated free base, which is predominantly present as a nonpolarized moiety compared to the protonated form, which has a predominant salt structure.
Despite the continuous contributions from the pharmaceutical industry to new drug discoveries and innovations, poor manufacturing standards are a concern for the industry and the regulatory agencies. Hence, systematic approaches are mandated by the regulatory agencies and the manufacturers (Abboud and Hensley, 2003). Quality by design (QbD) is a systematic approach to new developments that begins with predefined objectives and emphasizes product and process understanding and process control based on sound science and quality risk management (ICH HARMONISED TRIPARTITE GUIDELINE, 2004). Although several guidelines and research articles for performing QbD-based formulation development have been published, a systematic understanding of analytical QbD and guidelines for its use are understandably scant. This work articulates the principles and practices of executing analytical QbD (AQbD) in quantitative systematic method development. In AQbD, the strategic purpose of the method and analytical target profile (ATP) are emphasized, while QbD addresses the outline quality target product profile (QTPP) (Jayagopal and Shivashankar, 2017).
Ultra-high-performance liquid chromatography (UHPLC) is a versatile purification technique that offers sub-2-mm particles with extended linear solvent velocities to provide dramatic improvements in resolution, sensitivity, and time of analysis. The reduced particle size to below 2 mm necessitates instrumentation for operating at pressures between 6000 and 15,000 psi. The characteristic peak width produced via UPLC is on the order of 1–2 s for a 10-min separation (Kochling et al., 2016).
UPLC coupled with a tandem quadrupole MS/MS detector is a new platform for producing molecular fragments useful for identifying degradant impurities by analyzing molecular fragmentation patterns. The present study used a scan wave enhanced product ion scanning mode provided by Waters Xevo TQS and a Micro Mass detector coupled with an Acquity UPLC-H Class. Mass Lynx V4.1 software enables a simpler check and confirms the structures of peaks of interest at a very low concentration. A standard T-wave collision cell was used simultaneously and confirms the superlative MRM quantification data and UPLC-MS/MS estimation with high speed and resolution (Plumb et al., 2004; Smith, 2018).
A forced degradation (FD) study is a necessary and integral part of drug development. A significant step in the drug development strategy is to provide valuable data on the shelf life of a drug in a shorter time (Görög and Baertschi, 2013). Mass spectrometry-mediated profiling of the forced degradation of drugs is a fairly new approach. Degradation pathways are elucidated based on a careful analysis of the fragmentation patterns of the [M+H]+ ions of the main analyte and its degradants (Devrukhakar et al., 2017, 2018).
Several literature reports on NIN mainly focus on the protocol for estimating NIN in rat plasma (Togami et al., 2018). Further, NIN is used for the treatment of several diseases, including IPF, hypertension, and ovarian cancer (Tepede and Yogaratnam, 2017; Khalique and Banerjee, 2017). An assay procedure for estimating NIN has been documented with the specificity proved via forced degradation of samples (Dasari et al., 2015). Nevertheless, no literature report is available on the method development for estimating degradation products and explaining the mechanism of the degradation pathways of NIN. Furthermore, although a few literature reports suggested the QbD-based analytical test method for different classes of drugs, they did not offer sufficient information and clarity on predefining the CQA and ATP, risk assessment, identification of critical material attributes, critical method parameters and the complete QbD-based development flow (Karmarkar et al., 2011). An extensive literature search on NIN degraded study using QbD found no study reports on the proposal methodology. Therefore, we decided to assume the task of developing a systematic protocol development using mass spectrometry. A systematic approach to defining the flow of analytical method development through the QbD approach by predefining CQA (critical quality attributes) and ATP and conducting DOE by identifying critical material attributes and method parameters is reported in this study protocol. This work highlights the practice of failure mode effect analysis (FMEA) for the impartial identification of critical method parameters (CMPs) and critical material attributes (CMAs) associated with the resolution between closely eluted peaks. This approach will be used as an input for the DOE study of the optimization of method parameters (Mohammed et al., 2015). The present study is aimed at developing a novel stability indicating test method for quantifying the degradation products of NIN through a QbD approach, identifying, and characterizing the major degradation products formed, and suggesting the most likely degradation mechanistic pathways (see Scheme 1).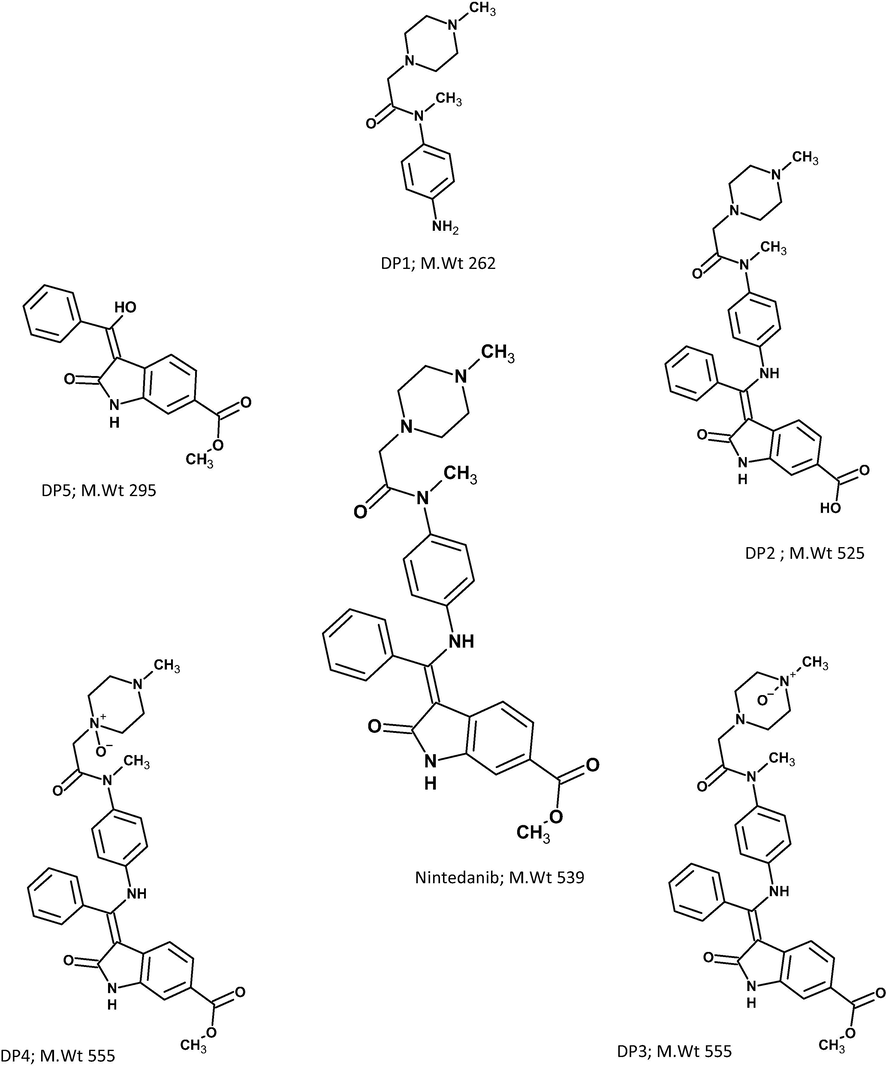
Structure of NIN and proposed structures of its degradation products.
2 Experimental section
2.1 Chemicals
The NIN sample was provided by Solaris Pharm., India. Milli-Q water (filtered through a 0.22- µm membrane filter) was obtained from the Milli-Q high quality water system (Merck Millipore). Sodium hydroxide pellets, AR grade ammonium acetate, hydrochloric acid, gradient grade acetonitrile and hydrogen peroxide were purchased from Merck Millipore.
2.2 Instruments and data management systems
The separation analysis of NIN and its degradation products was achieved on an Acquity H-Class UPLC system (Waters, USA). The system was composed of H-class QSM solvent management pumps, an H-Class FTN sample manager, an Acquity PDA eλ detector, a solvent degasser and column compartment with a heater to control temperature. The data acquisition and processing were performed using Mass Lynx V4.1 software. All precision weighing was performed on a Mettler Toledo analytical balance (XPE 205, USA), and pH Seven Excellence (Mettler Toledo, USA) was used for pH measurements.
The Acquity UPLC is integrated with both a PDA detector to study the chromatographic pattern and a Xevo TQ-S micro-quadrupole mass spectrophotometer (Waters, USA) for mass analysis. The Xevo TQ-S micro-mass spectrophotometer is equipped with Z spray dual orthogonal API sources, step wave ion transfer optics, two high resolution and high stability quadrupole analyzers (MS1/MS2) with prefilters, and a T-wave enabled collision cell for optimal MS/MS performance. A photostability chamber (Newtronic, India) with UV and fluorescent lamps was used to perform the photodegradation procedure in compliance with the ICH guideline Q1B (ICH, 1998; Agency, 2011).
Design-expert Version 11.0 was used for designing experiments. Effect and interaction analyses were performed using a half-normal plot, Pareto chart, and 2D and 3D surface response plots.
2.3 Method development through QbD
2.3.1 Defining the quality (analytical) target profile
The systematic development of analytical method development starts by defining ATP. The ATP includes all attributes that are needed to ensure the quality characteristics and purpose of the analytical method (Beg et al., 2015, 2016). Table 1 shows various elements of chromatography that are part of the target profiles for efficient method development.
ATP element
Target
Justification
Analyte
NIN and its degradation products
The degradation products of NIN shall be estimated
Sample
NIN soft gelatin capsules
Development of a method for the estimation of degradation products of NIN in NIN soft gelatin capsules.
Analytical technique
RP-HPLC/ RP-UPLC
RP-HPLC is a widely used analytical technique that facilitates a pierce separation of lipophilic substances (such as NIN, log Kow 1.89 [24] with a hydrophilic mobile phase and hydrophobic columns. High precision, quick analysis, low solvent consumption with small sample volume add additional advantages [25].
% RSD of Standard injection
Not more than 5.0%
Can be controlled by proper maintenance of chromatography and can be easily detected.
Resolution between any two impurities
Not less than 1.2
Affect quantification of impurities.
Recovery of impurities from the drug product
90.0–110.0%
Affect accuracy of impurities quantification.
Specificity
No interference due to blank and placebo, and separation between peaks
Affect quantification of impurities.
Linearity
Correlation coefficient (r): Not less than 0.99
The working concentration range will have absorbance less than 1.0 AU for a UV detector.
Precision
%RSD for replicate preparations should be not more than 5.0%
Affect quantification of impurities.
LOQ of impurities
Not less than 0.05%
Affects quantification of known and unknown impurities.
2.3.2 Forced degradation and chromatographic conditions
To generate possible degradation products before separating and identifying the products, the drug was subjected to a forced degradation protocol. A 1 mg/mL solution of the drug in methanol underwent different chemical stress conditions: first, acid hydrolysis by treating it with 2 N hydrochloric acid followed by heating it at 80 °C for 1 h using a water bath; second, alkali hydrolysis with 0.2 N sodium hydroxide maintained at room temperature for 1 h; third, 3% hydrogen peroxide at room temperature for 4 h for oxidation, heating it at 80 °C in a water bath for 4 h for hydrolysis; fourth, photodegradation by exposing the drug molecule in solution to white florescence light of 1.2 million lux hours and UV light of 200-Watt h/m2; and fifth, thermolytic degradation by exposing the solid material to 105 °C for 4 days in a hot air oven. A 5-µL aliquot of the degraded solutions was injected into an Acquity H Class UPLC system (Waters, USA) using the gradient elution mode of the Acquity UPLC HSS T3 column, a 0.005 M ammonium acetate buffer in pump A and acetonitrile in pump B. The flow rate, column temperature, and detector wavelength were set at 0.4 mL/min, 35 °C, and 250 nm, respectively.
2.3.3 Identifying CQA
In formulation process development, CQA is generally identified from the manufacturing process parameters, whereas in AQbD analysis, outcomes such as resolution, accuracy of quantification, and peak shape are the possible CQAs (Yadav et al., 2015; Taylor et al., 2015). To identify the precise CQA, the sensitivity of the drug to various degradation conditions was studied. Five major degradants were identified from the degradation chromatograms. The resolution between a set of closely eluted peaks was considered for further risk assessment to evaluate the criticality. The acid, alkali and oxidative degradation sample chromatograms are presented in Fig. 1. The retention time (Rt) and relative retention time (RRT) of the peaks are listed in Table 2.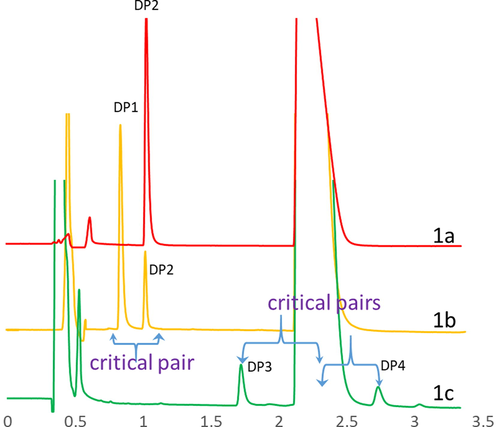
a: Chromatogram of alkali hydrolysis sample with DP 2, b: Chromatogram of acid hydrolysis sample with DP 1 & DP 2, c: Chromatogram of oxidative degradation sample with DP 3 & DP 4. All chromatograms presented between 0 and 3.5 min for clear view while the actual run time is 12 min.
Peak
Rt (min)
RRT with reference to NIN
DP1
0.93
0.40
DP2
1.13
0.48
DP3
1.99
0.84
NIN
2.35
1.00
DP4
3.09
1.31
DP5
8.62
3.67
2.3.4 Risk assessment of the preliminary method
The CMPs that possess a high risk were identified through a risk assessment study based on their criticality and influence on CQAs. In addition, risk assessment also provides probable interaction(s) among the CMPs, assessing the probabilities of successive failure(s) (Basso et al., 2018). An Ishikawa fish-bone diagram was sketched to determine the potential risks and corresponding roots that could affect the performance of an RP-HPLC method (Fig. 2) (Juran and Godfrey, 1998). The identified quality attributes of the method are subjected to an FMEA-based risk assessment. In the FMEA table, the impact of a failure to meet the quality attribute over the method objective is listed as a “potential impact” against the respective quality attribute. The method parameters (chromatography conditions) and material attributes (solvents and chemicals) that could potentially cause the failure are listed as a “potential cause”. Further, the present control through system suitability procedures and other validation studies to detect failure are assessed as a “detection mode” in the FMEA table. The severity of the failure, chance of failure occurrence and detectability of failure were rated on a scale of 1 to 10 (1 = low, 10 = high). The risk priority number was calculated by multiplication of the values assigned for severity, occurrence, and detectability, where a higher RPN value indicates a worse criticality. The quality attributes were categorized as high or low critical based on the RPN value. The accomplishments of high risk CQAs were planned through DOE and those of the low risk CQAs, through a one-time validation study.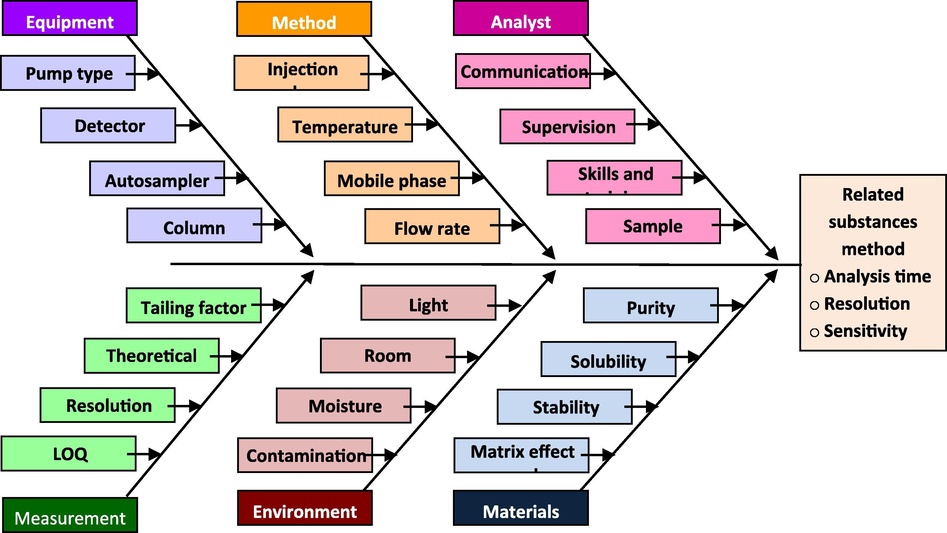
Ishikawa diagram for risk identification and assessment.
2.3.5 Identifying CMPs
All the chromatographic parameters, solvents and reagents used in the UPLC method are considered. Some of them are recognized as CMPs based on the criticality and knowledge acquired during primary method scouting. The bonded phase of the column was found to be CMP, but several columns of different bonded phases were evaluated during the preliminary method development, and only the superlative column was finalized at the end of scouting and considered for DOE.
2.3.6 Optimizing the effect of CMPs (method variables) on CQA1-3 through DOE
A fractional factorial design was chosen over a full factorial design considering the number of factors (4) to be studied. The effects and interactions of critical method parameters (CMPs1-4) identified through the risk assessment study were explored using a 2n 4-factor regular two-level factorial experimental design with replication of the center point three times. A design matrix listing eight experimental measurements was generated using the design expert tool and executed by keeping other parameters, such as the wavelength, column, injection volume, buffer, sample concentration and diluent constant, at the desired value. Diluent, placebo, acid degradation, base degradation, and oxidative degradation samples were injected in each experimental condition. The acid degradation sample was neutralized with an equimolar concentration of sodium hydroxide. An excess amount of sodium hydroxide was added to the acid sample to generate a base degradation impurity to ease the calculation of resolution between the closely eluting peaks generated in acid and base degradation. The responses observed from the experiments were presented and analyzed using the polynomial 2FI mathematical model. Using a half-normal plot, variables and interactions with less significance were ignored during further modeling and ANOVA calculations. Effects and interactions were studied using Pareto charts and 3D and 2D contour plots. Further, the design space was established using an overlay plot. The polynomial equation was framed considering a model coefficient with a p value < 0.05. The suitability of the model was further backed by evaluating parameters such as the residual sum of squares and by performing a lack-of-fit analysis. Finally, the optimum condition was projected through numerical optimization and was marked using a flag in the overlay plot, which displays all the conditions within the desirability.
2.3.7 Diluent preparation
An aliquot of 100% methanol was injected as the diluent.
2.3.8 Placebo preparation
Approximately 80 mg of placebo (equivalent to 50 mg of NIN) was diluted with 50 mL of methanol and sonicated for 15 min.
2.3.9 Composite sample for acid and base degradation
Approximately 140 mg of capsule fill content (equivalent to 50 mg of NIN) was transferred to a 50-mL volumetric flask, 30 mL of methanol added, sonicated for 15 min, 5 mL of 5 N hydrochloric acid added, and heated at 80 °C for 1 h. The heating was followed by reflux condensation supplied with cold water to prevent methanol evaporation. The degraded solution was neutralized with 5.5 mL of 5 N sodium hydroxide, allowed to cool to room temperature, and made up to volume with methanol to obtain a 1 mg/mL solution.
2.3.10 Oxidative method of sample degradation
The sample was prepared by treating the drug with 3% hydrogen peroxide and allowing it to react at room temperature for 4 h. The final concentration of 1 mg/mL was prepared as mentioned above.
2.3.11 Validation studies
A 0.002 mg/mL solution of NIN was prepared in methanol and injected six times to evaluate the system precision. A concentration range of 0.0001–0.004 mg/mL of NIN was injected to establish a linearity that covers a working concentration of 0.01% to 0.04%. A minimum concentration with a signal- to-noise ratio above 10 was predicted as the quantification limit. A 0.0002 mg/mL solution was injected six times to check the precision at the LOQ level. Nintedanib was spiked at 0.0002, 0.001, 0.002 and 0.004 mg/mL to placebo to verify recovery of the drug in the presence of a placebo matrix. Six sample preparations, each a 1 mg/mL solution of NIN equivalent using the finished dosage form, were injected, and the %RSD of the %impurity was calculated to demonstrate the precision of the method.
2.3.12 Identification of impurities and elucidation of the degradation pathway
An enhanced tandem quadrupole mass spectrometric analysis (LC-ESI-MS/MS) was used to identify the mass and elucidate the structure of degraded structural units resulting from the forced degradation study. The integrated Acquity UPLC with both PDA detectors was used to study the chromatographic pattern, and a Xevo TQ-S micro-quadrupole mass spectrophotometer (Waters, USA) was used for mass analysis. The mobile phase carrying the components that flow out of the PDA detector was delivered into the mass spectrophotometer. The MS capillary voltage, cone voltage, MS mode collision energy, MS/MS mode collision energy, and scan time were set at 3.50 kV, 20.00 V, 3.00, 20.00, and 0.5 s in ES+ ionization mode, respectively. The selected daughter ions of the degradants were transferred to a quadrupole analyzer using collision induced disassociation (CID). A mass spectrogram was generated with the use of these detectors and was, in turn, used to propose a structure.
3 Results and discussion
3.1 Preliminary method scouting
NIN is a nonpolar molecule with a Log P value of 3.7 and poor water solubility. The dissociation constant of NIN was found to be 10.86 and 7.23 (Drug bank 5.1: Properties of Nintedanib). Considering the pKa, a mobile phase of pH 2.0 to 6.2 was preferred to avoid variation in retention time and poor peak shape due to ionization. Arriving at the basic chromatographic conditions highly depends on the physicochemical properties of the molecule. A good peak shape and adequate retention time and resolution depend on the column, pH and aqueous/organic concentration. Simultaneous method developments were performed using HPLC and UHPLC to separate the degradation peaks.
Columns of various bonding phases such as end-capped C18, polar group embedded C8, moderately hydrophilic octadecyl silica gel, and phenyl-hexyl bonded silica gel were screened, and the results are reported in Table 3. Among the bonded phases that were screened, the polar group embedded C8 column, namely, Symmetry Shield RP 8, was found to be more efficient in terms of resolution, peak symmetry, and peak height, possibly because of complimentary selectivity provided by the water layer at the pore surfaces and reduced undesirable secondary interactions between free and charged silanol groups.
Column
Organic Modifier
Bonded phase
Carbon (%)
Pore size (Å)
Plate count
Resolution
Tailing
Max response
Peak count
Min
Min
Max
Mean
Min
Max
Mean
X bridge Phenyl
ACN
Phenyl-Hexyl
15
130
5534
1.0
5.6
2.4
0.7
1.4
1.1
2,974,847
10
YMC pack ODS AQ
ACN
Moderately hydrophilic C18
14
120
3239
0.9
7.3
2.7
0.7
2.7
1.2
6,842,356
9
YMC pack pro
ACN
Endcapped C18
16
120
2466
1.1
10.9
2.3
0.8
1.6
1.0
3,413,493
15
Zorbax SB C18
ACN
Stable bond C18
10
80
4180
1.1
7.9
2.9
0.8
2.2
1.2
5,463,758
7
Symmetry Shiled RP8
ACN
Polar embedded C8 silica
15
100
3345Sc
1.1
13
2.4
0.8
1.6
1.0
3,401,439
16
Symmetry shield RP8
MeOH
Polar embedded C8 silica
15
100
5203
1.1
11.4
3.3
0.8
1.3
1.0
2,497,328
10
Symmetry shield RP8
MeOH:ACN (70:30)
Polar embedded C8 silica
15
100
2309
0.9
4.7
2.3
0.9
1.8
1.1
3,363,681
11
Buffers with different pH levels were screened from 2.0 to 6.8. Because of uncharged silanol groups and cationic analytes obtained in the acid mobile phase, the peak symmetry, response, and separation at pH 2.2 were relatively better. Acetonitrile was chosen over methanol because, as an organic modifier, it efficiently eluted all the peaks with a better resolution and a shorter run time.
A minimum run time of 45 min was unavoidable, given the adequate chromatographic pattern with the Symmetry Shield RP 8 column, pH 2.2 perchlorate buffer, and acetonitrile as eluent. To minimize the run time, a change to the UPLC procedure was planned.
A stable bond C18 silica column, end-capped C18 column with a charged surface hybrid (CSH), end-capped C18 column with an ethylene bridged hybrid (BEH) and end-capped C18 column with a high-strength silica were screened, and the observations are reported in Table 4. Because mass identification of the degradation products is part of the study plan, mass compatible buffers such as 0.001 M formic acid, 0.005 M ammonium formate, and 0.005 M ammonium acetate were screened. The combination of 0.005 M ammonium acetate buffer and an Acquity HSS T3 column with high-strength end-capped silica retained all interesting peaks with a minimum resolution of 1.2 in a dramatic 12-min run time. With acetonitrile in pump B contributing 40% of the initial gradient flow at a rate of 0.4 mL/min, the chromatography was considered satisfactory. The rapid resolution was supported using a column of smaller dimensions, namely, 100 mm (L), 2.1 mm (ID), and a 1.8 µ particle size. This preliminary method was considered for optimization through DOE.
Mobile phase buffer
Rt (min)
Minimum resolution between peaks
Inference
DP1
DP2
DP3
NIN
DP3
Acquity C18 BEH
0.40
0.47
0.56
0.75
0.81
0.90
DP1 merged with diluent peak and DP4 merged with NIN peak
Acquity C18 CSH
1.27
1.55
2.01
2.71
3.20
0.95
DP1 merged with diluent peak
Acquity C18 HSS T3
1.16
1.41
1.83
3.00
3.93
1.20
Peaks are well separated
3.2 Degradation behavior of NIN
Fig. 1 depicts UPLC chromatograms generated by injecting acid hydrolysis, alkali hydrolysis and oxidative degradation solutions. Two degradation impurities, DP1 and DP5, were generated under acid degradation conditions at a Rt of 0.93 and 8.62 min, respectively. A single major degradation impurity (DP2) was formed under alkali degradation at a Rt of approximately 1.1 min, and two degradation products (DP3 and DP4) were observed in the oxidative degradation chromatogram at a Rt of approximately 1.99 and 3.09 min. As summarized in Table 5, the drug molecule was found to be more sensitive for alkali concentrations. Even at a lower alkali concentration, the drug molecule was found to degrade 70–80% of NIN and was moderately sensitive to acidic and oxidative degradation. The water hydrolysis sample showed no degradants, indicating that the drug was quite stable under neutral stress conditions. No degradation products were observed during photolysis and thermolysis.
Stress condition
Treatment
No. of degradation products (Rt in mins)
Total degradation (%)
Assay (%)
Control sample
No treatment
–
–
100.8
Acid degradation
2 M HCl heated at 80 °C, 1 h
2 (0.93 & 8.82)
1.2
98.9
Alkali degradation
0.2 N NaOH, 1 h
1 (1.13)
3.0
96.1
Oxidation
3% H2O2, 4 h
2 (1.99 & 3.09)
0.5
100.2
Thermal degradation
100 °C, 4 days
–
–
99.9
Hydrolysis
Water at 80 °C, 4 h
–
–
99.5
Photodegradation
White florescence light of 1.2 million lux hours & UV of 200-Watt h/m2
–
–
100.5
3.3 Risk assessment studies
From the degradation chromatograms and the Rt and RRT of the analyte, it is evident that peaks {DP1, DP2}, {DP3, NIN} and {NIN, DP4} elute closely and that all three separations are sensitive and further considered as critical quality attributes (henceforth denoted CQA1, CQA2 and CQA3, respectively). Table 6 illustrates the FMEA hypothesis for identifying risks associated with each CQA. The study suggests that all three resolutions have a high RPN value, and the method parameters that could act as a potential cause of the failure were identified as CMPs. Table 7 shows that the flow rate, column temperature, organic ratio and gradient program are considered CMPs to achieve the target profile and are denoted CMP1, CMP2, CMP3, and CMP4, respectively. The other CQAs, such as the LOQ precision, recovery, and specificity, are denoted CQA4-6, respectively. Table 8 shows the accomplishment plan for decreasing the high RPN value as calculated in the FMEA hypothesis. CMP1-4, which are identified as potential causes of the failure of CQA1-3, underwent a DOE study, and the accomplishment plan for CQA4-6 was obtained through validation studies. SEV- severity (1 = low, 4 = high); OCC– occurrence (1 = low, 4 = high); DET- detectability (1 = low, 4 = high). RPN -risk priority number (RPN = SEV × OCC × DET).
Quality attributes
Type of risk/failure
Potential Impact
SEV
Potential Causes
OCC
Detection Mode
DET
RPN
Specificity
Interference due to diluent peaks at Rt of impurities
Inaccurate quantification of impurities (due to merging)
3
Poor quality of reagents & solvents
3
chromatogram review
2
12
Specificity
Placebo interference (Specificity)
3
Organic concentration, flow rate, column temperature, gradient program (CMA)
3
2
12
DP1 & DP2 quantification
Merging of DP1 & DP2
3
3
3
27
DP3 quantification
Merging of DP3 & main analyte
The presence of impurity may be completely unknown
3
3
3
27
DP4 quantification
Merging of main analyte & DP4
3
3
3
27
LOQ of impurities
Poor response
Poor quantification
2
Sample concentration & analytical technique
2
Signal to Noise ratio
3
12
Recovery
Could be less than 80%
Inaccurate quantification
2
Poor solubility of impurities in diluent
2
Recovery study
3
12
Material attributes & Method parameters
Is parameter critical for CQA? (Yes/No)
Observation
CQA1
CQA2
CQA3
CQA4
Flow rate
Yes
Yes
Yes
Yes
Flow rate can alter the elution time
Injection volume
No
No
No
No
No impact on resolution
Organic concentration
Yes
Yes
Yes
Yes
Can change the elution pattern
Gradient program
Yes
Yes
Yes
Yes
Can change the elution pattern
Detection wavelength
No
No
No
No
No influence in chromatographic pattern
Column temperature
Yes
Yes
Yes
Yes
Can alter the separation between peaks
Buffer pH
No
No
No
No
No impact observed for this molecule
Column
Yes
Yes
Yes
Yes
Can alter the separation and elution pattern.
Sample temperature
No
No
No
No
No influence on separation and elution order.
Grade of acetonitrile
No
No
No
No
No interference due to diluent observed
Grade of ammonium acetate
No
No
No
No
No interference due to diluent observed
CQA
ATP
RPN
RPN remark
Accomplishment plan
Minimum resolution between DP1 & DP2 (CQA1)
Not less than 1.2
27
High
DoE with respective CMPs
Minimum resolution between DP3 & main analyte (CQA2)
Not less than 1.2
27
High
DoE with respective CMPs
Minimum resolution between main analyte & DP4 (CQA3)
Not less than 1.2
27
High
DoE with respective CMPs
LOQ Concentration (CQA4)
Less than 0.05%
9
Medium
Through validation and control strategy
Recovery (CQA5)
90.0–110.0%
9
Medium
Through validation and control strategy
Specificity (CQA6)
Blank & placebo interferenceNo Interference at analyte Rt
9
Medium
Through validation and control strategy
3.4 Analysis of DOE results for various critical method parameters (CMPs)
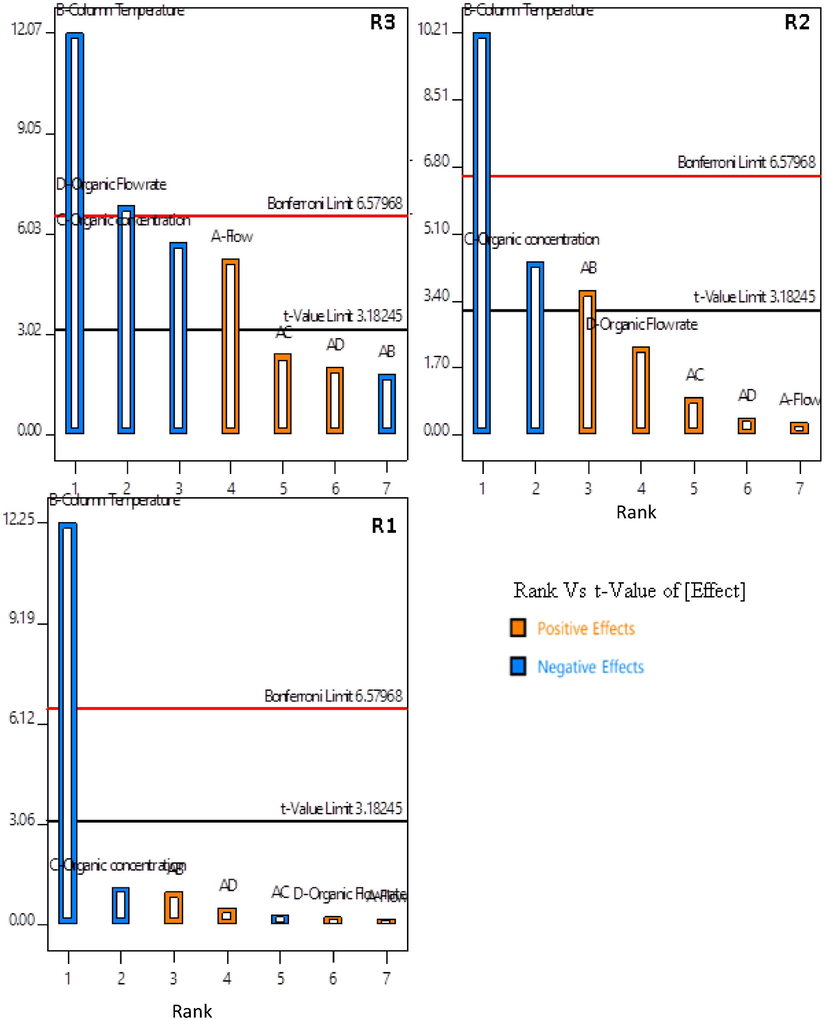
The −1 and +1 values for all four CMPs considered for DOE are presented in Table 9. CQA1-3 are monitored as responses for the DOE experiment, and they are denoted R1, R2, and R3, respectively. The DOE matrix and the responses are listed in Table 10. Figs. 3 and 4 depict the half-normal plots and Pareto charts illustrating the influence of CMAs on responses R1-3. The Pareto-ranking analysis showed that the impact of factors (i.e., column temperature, flow rate, organic concentration, gradient flow rate) on the CQAs was statistically significant (P < 0.05), and thus, the factors were designated as the CMPs for further optimization studies (see Table 12).
Symbol
Chromatographic variables
Low
High
A
Flow (mL/min) (CMP1)
0.35
0.45
B
Column temperature (°C) (CMP2)
35.0
45.0
C
Organic concentration (%) (CMP3)
35.0
45.0
D
Gradient increment (Gradient rate) (CMP4)
0.70
1.30
Std
Run
CMP1
CMP2
CMP3
CMP4
R1
R2
R3
5
2
0.35
35
45
1.3
1.39
1.68
1.27
1
5
0.35
35
35
0.7
1.47
1.82
2.46
7
6
0.35
45
45
0.7
0.47
1.07
1.18
3
11
0.35
45
35
1.3
0.51
1.35
1.13
11
7
0.4
40
40
1
0.79
1.45
1.43
10
8
0.4
40
40
1
0.75
1.46
1.60
9
10
0.4
40
40
1
0.94
1.55
1.60
4
1
0.45
45
35
0.7
0.6
1.38
1.68
6
3
0.45
35
45
0.7
1.29
1.5
2.41
8
4
0.45
45
45
1.3
0.55
1.35
1.11
2
9
0.45
35
35
1.3
1.45
1.74
2.31
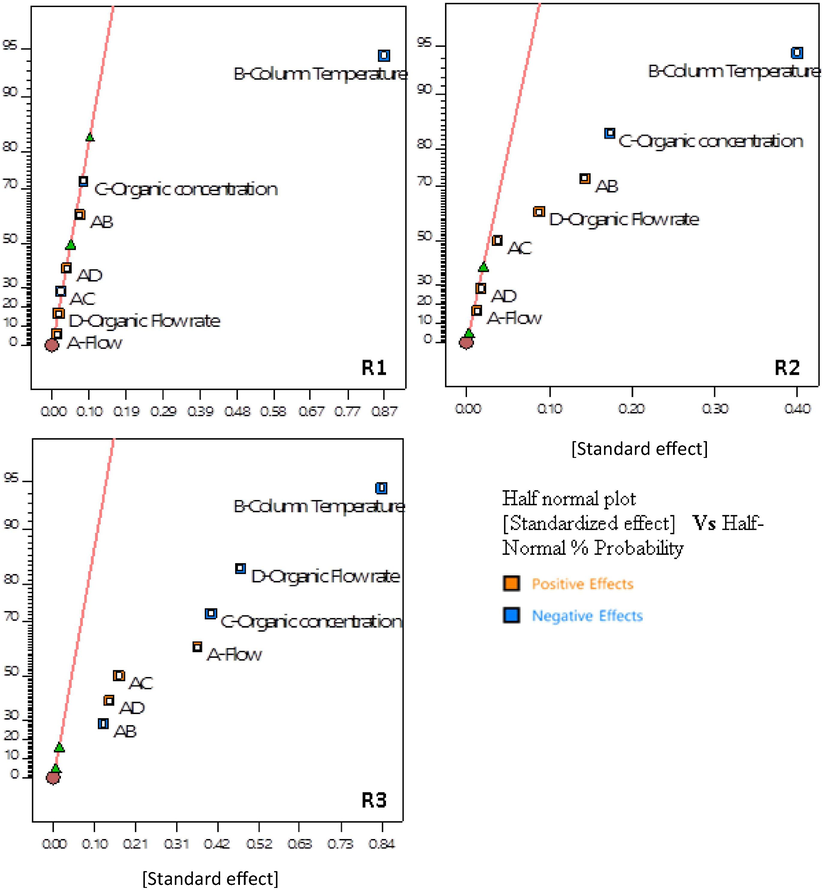
Effect analysis by half normal plots.
Pareto charts showing individual factor effects and combination effects.
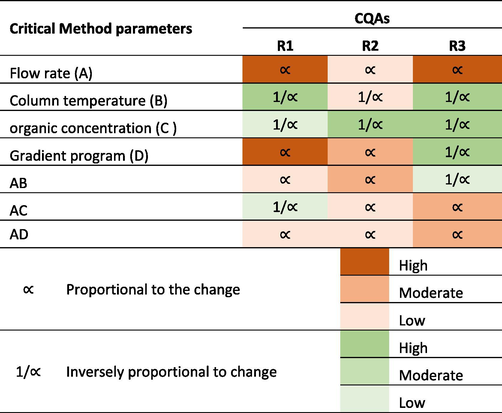
The interpretation of the effect of each CMP on the resolutions based on the DOE results is presented in Table 11.
The half-normal plot and the Pareto chart show that the column temperature has a substantial influence on all three peak resolutions R1, R2 and R3 (CQA1-3). An increase in the temperature of the chromatographic bed reduces the viscosity of the mobile phase and improves the diffusion. Considering the thermodynamic rule of reversed-phase chromatography, an increase in temperature expedites the component elution and consecutively coelutes peaks, thus decreasing the resolution.
The organic concentration is inversely proportional to the resolutions R1, R2 and R3. Acetonitrile, known for its elution strength, expedites the elution of hydrophobic compounds and thus reduces the peak spacing.
The gradient increment rate (organic flow rate) is directly proportional to R1 and R2 (CQA2) and inversely proportional to R3. The varying composition of the mobile phase and the difference in affinities between the two components causes the varied resolutions.
The flow rate and column temperature have a synergic, positive effect in maximizing R2 (CQA2). An increased linear velocity and increased diffusion resulted in narrow peaks with increased resolution.
The model analysis results are presented in Table 12. The model F-value implies that the model is significant. P-values < 0.0500 indicate that the model terms are significant. The lack-of-fit F-value implies that it is not significant relative to the pure error. A non-significant lack of fit is good with an expectation of the model to be fit.
Source
Sum of Squares
p-value
Sum of Squares
p-value
Sum of Squares
p-value
Inference
CQA1
CQA2
CQA3
Model
1.57
0.0001
0.4352
0.0086
2.59
0.0416
Significant
Residual
0.0220
0.0061
0.1092
Lack of Fit
0.0019
0.9739
3.788E-07
0.9921
0.0547
0.2921
Not significant
Pure Error
0.0201
0.0061
0.0545
Further, the response surface mapping was performed with the help of the 3D response surface and 2D contour plots for each CQA (responses), as shown in Fig. 5. The 2D plot for response 1 reveals that decreases in the column temperature and flow rate maximize the peak resolution R1 (Fig. 5A) and R2 (Fig. 5E). In contrast, an increase in flow rate and a decrease in column temperature and organic concentration increase the peak resolution R3 (Fig. 5B and 5C). The organic concentration and gradient increment rate have no significant influence over peak resolutions R1 and R2, whereas an increase in the organic concentration has a negative effect on peak resolution R2 (Fig. 5F). The desirability plot (Fig. 5G) shows that the flow rate and column temperature should be kept at the minimum to obtain a peak resolution within the desired range.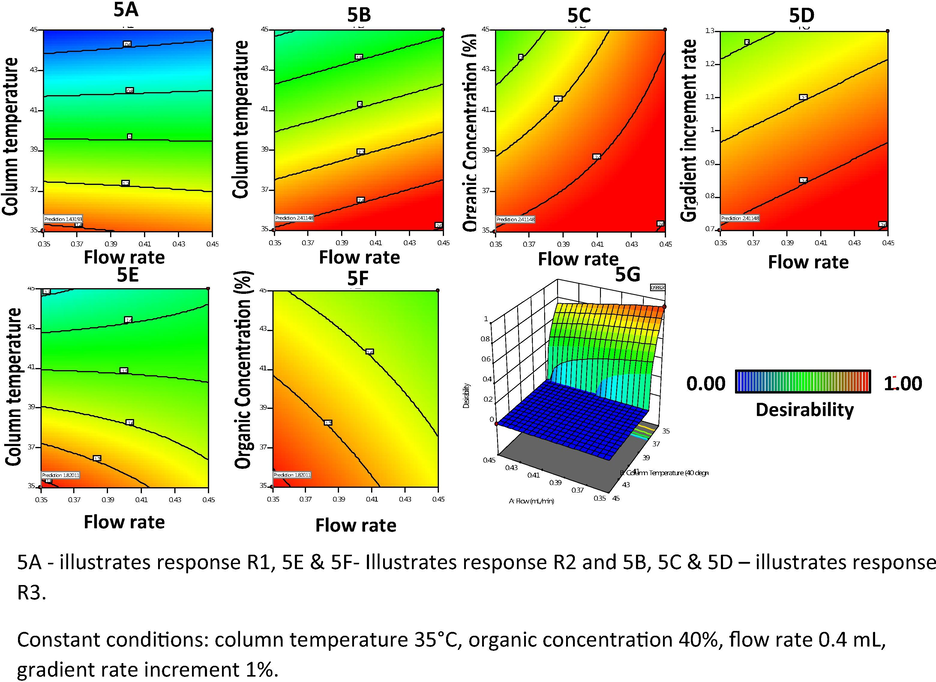
A–G 2D plots of CMAs, namely (A–F) and G desirability plot.
The final equation in terms of coded factors generated using statistical analysis of response establishes the relation between CMPs and CQAs (Table 13). The equation is used to make predictions about the response for given levels of each factor. Further, the coded equation is useful for identifying the relative impact of the factors by comparing the factor coefficients. The compilation of calculated responses and the mean response of three determinations that were performed by following the parameters (solution with high desirability value) suggested by the design tool and the mean responses of the three determinations are comparable to the calculated results.
Response
Polynomial equation
R1
RS1 = 0.8267–0.4338B – 0.0412C + 0.0362 AB + 0.0187AD + BC + CD + 0.1396 ABCD
R2
RS2 = 1.49 + 0.0063A – 0.1988B – 0.0862C + 0.0438D + 0.0712AB + 0.0187AC + 0.0088AD + BC + BD + CD
R3
RS3 = 11.82–13.15A – 0.294B + 0.1175C – 2.556D + 0.48AB – 0.36AC + 7.0 AD
3.5 Defining the design space
Finally, a design space was created by defining the desirability for all three CQAs involved in the related substances method. Apart from the interesting CMPs, the remaining chromatographic parameters that were not critical were held constant at the desired level as finalized in the initial method development and mentioned in the FMEA. An overlay plot drawing a space within which CMPs could be changed without affecting CQAs was generated for all the CMPs. The desirability was set to maximize the resolution with a minimum resolution of 1.2 for all three separations. This agreeable region is the confirmed acceptable range (yellow region, Fig. 6) within which the method variation meets the desirability. The optimum condition is marked with a flag in the overlay plot that displays all the conditions. The flagged conditions were a column temperature of 35 °C, flow of 0.4 mL/min, organic concentration of 35.0% and gradient increment rate of 1% per min. These conditions were further considered for validation with the gradient program (refer supplementary document)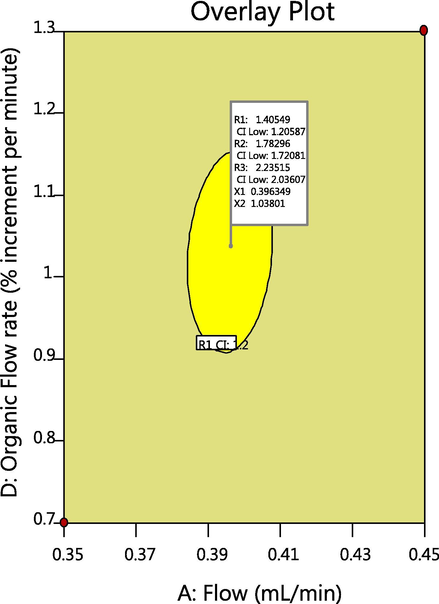
Design space with column temperature at 35 °C and organic concentration 35%.
3.6 Defining control strategies for all CQAs and CMPs
Eventually, the control strategy for the four CMPs was drawn from the DOE study, and the result is presented in Table 15. These CMPs and CMAs are kept under control and monitored closely during routine usage at the quality control laboratory.
3.7 FMEA: Risk assessment moderation
Assessing the effect of DOE on the RPN and correlating it with the values observed before performing DOE is the concluding step, i.e., with FMEA, the RPN values decreased significantly for the CMPs in Table 14 (compare with the RPN values in Table 8).
Failure Type
Recommended Actions
Control strategy
SEV
OCC
DET
RPN
% decrease in RPN
Interference due to diluent peaks at Rt of impurities
Defining chromatography grade of solvents & reagents in methodology.
Inclusion of diluent injection in the sequence.Reagents and solvents grade evaluated and mentioned in the procedure.
Diluent injection recommended in the injection sequence of test procedure.3
1
1
3
75
Placebo interference
Overlay the placebo chromatogram with sample chromatogram and evaluate.
Placebo included in the procedure to compare
3
1
1
3
75
Merging of DP1 & DP2
Define design space through DOE for critical method parameters.
MODS defined, system suitability mixture of impurities should be injected in every analysis and a minimum resolution of 1.2 set as criteria.
3
1
1
3
89
Merging of DP3 & Main analyte
3
3
1
3
89
Merging of main analyte & DP4
3
3
1
3
89
LOQ of impurities
UPLC method preferred in place of HPLC. Method should be validated for accuracy, linearity, and precision at LOQ level
UPLC method developed, validated, and proven to be accurate, precise and linear at LOQ concentration.
2
2
1
4
77
Recovery
Method to be validated for accuracy
Method validated for recovery and found accurate.
Recovery was found to be between 90.0% and 110.0% for Nintedanib1
1
3
3
75
3.8 Validation results
The method was linear from 0.0001 mg/mL to 0.01 mg/mL with an acceptable regression coefficient (r2) value of 0.998. The predicted LOQ and LOD for NIN were 0.002 and 0.00006 mg/mL, respectively. The RSD values for the method precision, injector precision and LOQ precision were 2.6%, 1.4% and 4.5%, respectively. The recovery results calculated from the “mg added” and “mg found” were between 96.1 and 104.6% for NIN in the concentration range of LOQ to 0.0004 mg/mL, Table 15 presents the individual recovery values and the inter-day and intraday precision results.
% spike level
Amount added (%w/w)
% Recovery
Mean % recovery
% RSD
Precision (%RSD)
Range
Linearity
LOQ
In triplicate
Injection
Inter-day
Intraday
LOQ (0.0002 mg/mL)
0.0002
97.3
96.6
0.7
1.40%
2.60%
3.90%
0.0002 mg/mL to 0.004 mg/mL
Correlation Coefficient (r): 0.998
0.0002 mg/mL, Precision at LOQ: 4.5%RSD
0.0002
96.3
0.0002
96.1
50 (0.001 mg/mL)
0.001
100.1
101.5
1.5
Regression Coefficient (r2): 0.996
0.001
101.3
0.001
103.2
100 (0.002 mg/mL)
0.002
104.6
99.5
4.5
Slope: 23612867.38
0.002
96.7
0.002
97.1
200 (0.004 mg/mL)
0.004
97.2
98.1
2
Intercept:
−182.89,
% Y-Intercept; 0.8%
0.004
100.4
0.004
96.8
3.9 Identification and interpretation of MS/MS fragments of degradation products
3.9.1 MS/MS CID of degradation products
The selected daughter ions of degradants were transferred to the quadrupole analyzer using collision induced disassociation (CID). A mass spectrogram was generated using these detectors that, in turn, was used to propose the structure (Schemes S1-4). A list of daughter ions obtained for each degradant product is provided in Table 16. The observed m/z is comparable with the calculated m/z (Table 17).
Rt
Name
m/z [M+H]+
ESI+ MS/MS Fragments
0.97
DP1
263
151, 136, 113
1.13
DP2
526
398, 385, 249
2.04
DP3
556
412, 399, 294, 219
2.54
NIN
540
412, 398, 385, 294, 249
3.15
DP4
556
412, 399, 294, 209
8.61
DP5
296
219, 190
Proposed molecular formula [M+H]+
Observed (m/z)
Calculated (Mol wt, [M+H]+
C31H34N5O4+
540
540.644
C30H32N5O4+
526
526.617
C17H14NO4+
296
296.302
C31H34N5O5+
556
556.643
C31H34N5O5+
556
556.643
C14H22N4O+
263
263.365
C25H22N3O3+
412
412.469
C24H21N3O3+
399
399.450
C24H20N3O3+
398
398.450
C23H19N3O3+
385
385.423
C17H14N2O3+
294
294.310
C14H23N3O+
249
282.299
C11H17N3O+
219
249.358
C11H17N3O+
207
219.288
C10H8NO3+
190
141.194
C8H10N2O+
151
151.189
C8H12N2+
136
136.198
C6H14N2+
113
113.184
3.9.2 Interpretation of fragments
The ESI positive mass spectrum of the NIN peak shows a [M + H] + ion with m/z 540. Fragment ions at m/z 412 (loss of C6H12N2O), m/z 399 (loss of CH from m/z 412), m/z 294 (loss of C7H7N from m/z 399), m/z 249 (protonated N-(4-aminophenyl)-N-methyl-2-(4-methylpiperazin-1-yl) acetamide), and m/z 219 (N-phenyl-2-(piperazine-1-yl) acetamide) were observed in the MS/MS spectrum (refer supplementary document).
3.9.3 DP1 and DP5 ([M+H]+, m/z 263 and m/z 296)
By injecting the acid catalyzed degraded sample, a major degradant was observed at retention times of 0.90 and 8.6 min, labeled DP1 and DP5, respectively. The ESI-MS/MS spectrum of m/z of 263 (DP1) shows product ions at m/z 151 (protonated N-(4-aminophenyl)-N-methylformamide from loss of 1,4-dimethyl piperazine), m/z 113 (1,4-dimethyl piperazine), and m/z 136 (protonated dimethyl-p-phenylenediamine, loss of oxygen from m/z 151) (refer supplementary document). The fragments m/z 151 and 113 are evidence of the proposed mechanism of hydrolysis at the secondary amine reactive center, resulting in the formation of amine DP1 (amine) and DP5 (alcohol), as mentioned in Scheme 2. These MS/MS data indicate that DP1 is N-(4-aminophenyl)-N-methyl-2-(4-methylpiperazin-1-yl) acetamide.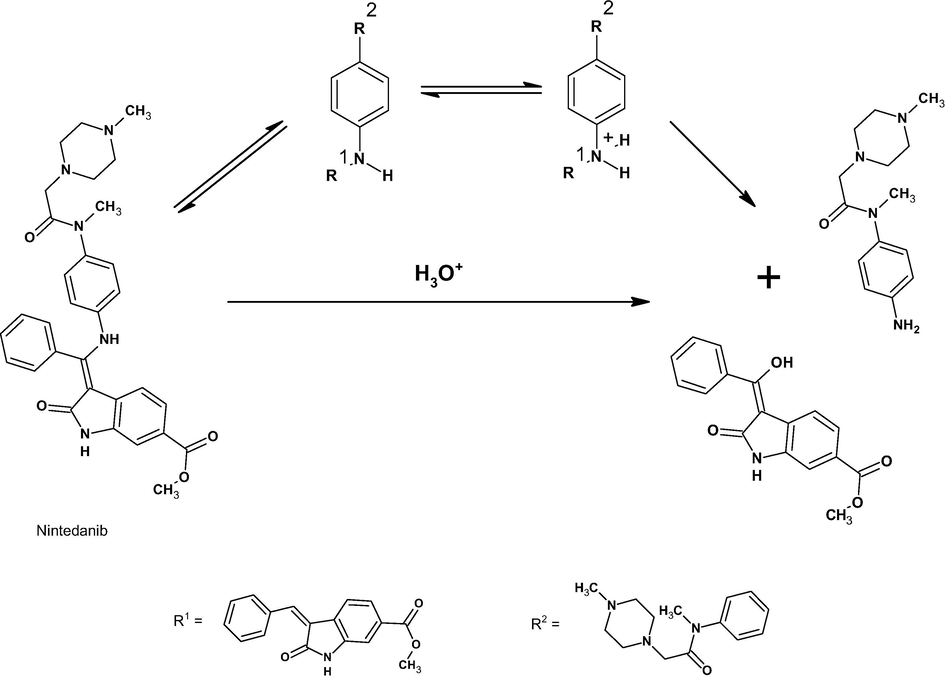
Proposed Acid hydrolysis reaction mechanism.
The ESI/MS/MS spectrum of m/z 296 (DP5) shows product ions at m/z 219 (loss of C6H6, OH) and m/z 190 (loss of CH2 from m/z 219). From the m/z fragments, it is understood that DP1 and DP5 are products of the same acid hydrolysis reaction at the secondary amine of NIN at position 19. These MS/MS data lead to the conclusion that DP5 is (3Z)-3-[hydroxy(phenyl)methylidene]-2-oxo-1H-indole-6-carboxylate (refer supplementary document).
3.9.4 DP2 ([M+H]+, m/z 526)
The chromatogram of the base hydrolysis sample shows a major degradation peak at a retention time of 0.97 min, labeled DP2. DP2 has a m/z of 526 from demethylation of NIN. The product ions at m/z 398 (loss of C6H12N2O), m/z 385 (loss of CH from m/z 398), and m/z 249 (protonated N-(4-aminophenyl)-N-methyl-2-(4-methylpiperazin-1-yl) acetamide) were observed in the ESI/MS/MS spectrum of [M+H]+ ions (m/z 526) (refer supplementary document). The absence of fragment m/z 412 when compared to Nin fragmentation and the formation of fragment ion m/z 398 indicate the presence of a methyl group at positions 11 and 10, illustrating that demethylation occurred at position 39. These MS/MS data lead to the conclusion that desmethyl NIN is (3Z)-3-[({4-[N-methyl-2-(4-methylpiperazin-1-yl) acetamido] phenyl} amino) (phenyl)methylidene]-2-oxo-1H-indole-6-carboxylic acid.
3.9.5 DP3 ([M+H]+, m/z 556), DP4 ([M+H]+, m/z 556)
The chromatogram oxidative degradation sample shows major degradation peaks at 2.39 min and 3.09 min, which are denoted DP3 and DP4, respectively. Product ions at m/z 412 (loss of (C6H12N2O2), m/z 399 (loss of CH from m/z 412), m/z 294 (loss of C7H9N from m/z 399), and m/z 219 (loss of methyl (3Z)-3-[amino(phenyl)methylidene]-2-oxo-1H-indole-6-carboxylate and piperazine ring opening at position 2) were observed in the ESI/MS/MS spectrum of [M+H]+ ions (m/z 556, DP3) (refer supplementary document). The fragment m/z 219 is evidence of ring opening at position 4 and thus N-oxide formation at position 4. These MS/MS data lead to the conclusion that NIN 4-N-oxide is 4-({[4-({[(3Z)-6-(methoxycarbonyl)-2-oxo-1H-indol-3-ylidene] (phenyl)methyl} amino) phenyl] (methyl) carbamoyl} methyl) -1-methylpiperazin-1-ium-1-olate.
The product ions at m/z 412 (loss of C6H12N2O2), m/z 399 (loss of CH from m/z 412), m/z 294 (loss of C7H9N from m/z 399), and m/z 209 (loss of methyl (3Z)-3-[amino(phenyl)methylidene]-2-oxo-1H-indole-6-carboxylate and piperazine ring opening at position 4) were observed in the ESI-MS/MS spectrum of m/z of 556 (DP4) (refer supplementary document). The fragment m/z 209 is evidence of ring opening at position 1 and thus N-oxide formation at position 1. These MS/MS data lead to the conclusion that NIN 1-N-oxide is 1-({[4-({[(3Z)-6-(methoxycarbonyl)-2-oxo-1H-indol-3-ylidene] (phenyl)methyl} amino) phenyl] (methyl) carbamoyl} methyl)-4-methylpiperazin-1-ium-1-olate.
3.9.6 Degradation mechanism
Under acid-mediated degradation, protonation followed by hydrolysis of the secondary amine resulted in DP1 (amine) and DP5 (alcohol), as depicted in Scheme 2. Under base-mediated degradation, NIN was hydrolyzed into DP2 by hydrolysis of the ester in the indole ring and methanol (Scheme 3). In the presence of hydrogen peroxide, oxidation of nitrogen atoms in the piperazine ring at positions 4 and 1 resulted in the formation of DP3 and DP4, respectively (Scheme 4).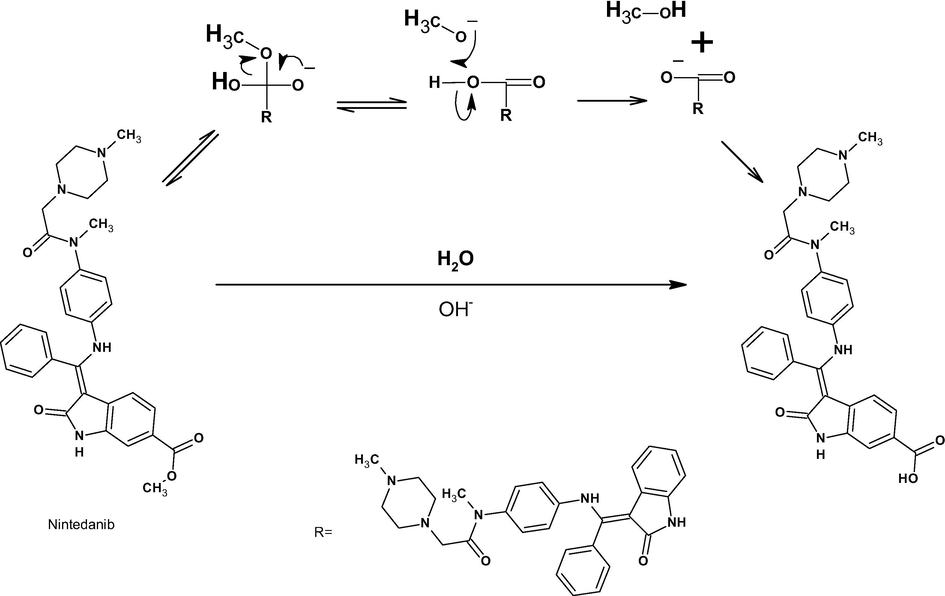
Proposed base hydrolytic reaction mechanism.
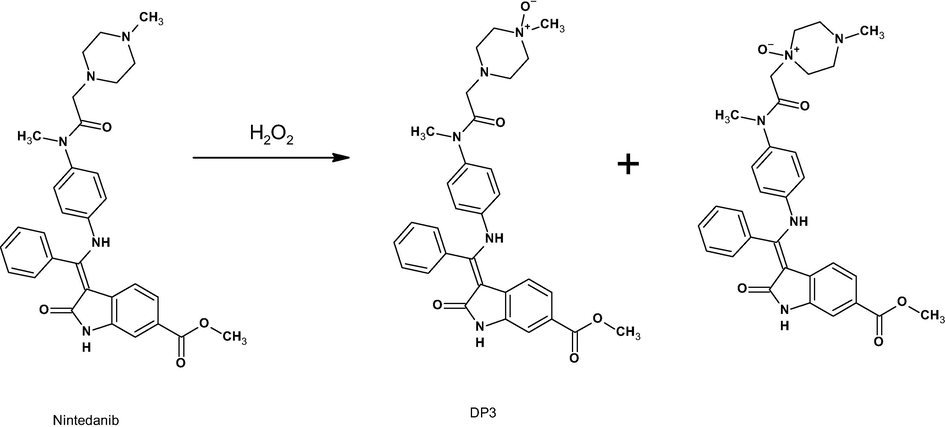
Proposed oxidative reaction mechanism.
4 Conclusion
In view of the limited information and guidelines on analytical QbD, a stepwise and systematic procedure for implementing QbD in analytical method development is methodically formulated in this article. A simple and novel experimental test method for estimating products derived from the degradation of NIN soft gelatin capsules is successfully developed using a UPLC technique with a shorter run time of 12 min. Further, for the first time it is applied to an FMEA-based risk assessment for the analytical method development of NIN. A detailed statistical analysis and design space are established through DOE for the developed method. Incidentally, the method is proved to be robust for wider conditions of variation. Control strategies are well defined to reduce the potential risk and improve the detectability of sample concentration. Important information on the possible chemical vulnerability and sensitivity of the test molecule to hydrolytic and oxidative exposure is made available through the proposed degradation pathway. This information supports and guides the formulators to design and develop proper formulated products by selecting suitable excipients and process and packaging methods. Five major degradation products are separated via chromatographic methods and characterized using MS/MS. This approach provides a detailed protocol for the formulators to monitor and characterize the potential impurities during the stability testing under scientifically acceptable specified threshold limits and within the qualifiable level as per ICH Q3 guidelines.
Declaration of Competing Interest
The authors declare that they have no known competing financial interests or personal relationships that could have appeared to influence the work reported in this paper.
References
- Abboud, L., Hensley, S., 2003. New prescription for drug makers: Update the plants. Wall Str. J. 3–9. https://www.wsj.com/articles/SB10625358403931000 (accessed June 2, 2019).
- Analytical Quality by Design (AQbD) as a multiaddressable platform for co-encapsulating drug assays. Anal. Meth.. 2018;10:5659-5671.
- [CrossRef] [Google Scholar]
- Beg, S., Sharma, G., Katare, O.P., Lohan, S., Singh, B., 2015. Development and Validation of a Stability-Indicating Liquid Chromatographic Method for Estimating Olmesartan Medoxomil Using Quality by Design, pp. 1–12.
- Beg, S., Chaudhary, V., Sharma, G., Garg, B., 2016. QbD-oriented development and validation of a bioanalytical method for nevirapine with enhanced liquid – liquid extraction and chromatographic separation, pp. 818–828. https://doi.org/10.1002/bmc.3613.
- Dasari, P., Arava, V., Life, S., Limited, S., Gogireddy, S.R., Life, S., Limited, S., Bethi, M.R., Life, S., Limited, S., Development, A.M., 2015. Development and validation of a simple and sensitive stability indicating RP-HPLC assay method for determination of Nintedanib and stress degradation studies Development and validation of a simple and sensitive stability indicating RP-HPLC assay method fo.
- A stability-indicating LC–MS/MS method for zidovudine: Identification, characterization and toxicity prediction of two major acid degradation products. J. Pharm. Anal.. 2017;7:231-236.
- [CrossRef] [Google Scholar]
- Proposal of degradation pathway with toxicity prediction for hydrolytic and photolytic degradation products of timolol. J. Pharm. Biomed. Anal.. 2018;154:7-15.
- [CrossRef] [Google Scholar]
- The role of analytical chemistry in drug-stability studies. TrAC Trends Anal. Chem.. 2013;49:55-56.
- [CrossRef] [Google Scholar]
- Global incidence and mortality of idiopathic pulmonary fibrosis: A systematic review. Eur. Respir. J.. 2015;46:795-806.
- [CrossRef] [Google Scholar]
- ICH HARMONISED TRIPARTITE GUIDELINE, 2004, In: Pharm. Dev. Q8. ICH, Geneva. https://www.ich.org/fileadmin/Public_Web_Site/ICH_Products/Guidelines/Quality/Q8_R1/Step4/Q8_R2_Guideline.pdf.
- ICH, 1998. Q1B Photostability Testing of New Active Substances and Medicinal Products. Eur. Med. Agency, pp. 1–9. http://www.ema.europa.eu/docs/en_GB/document_library/Scientific_guideline/2009/09/WC500002647.pdf.
- Analytical Quality by Design – A Legitimate Paradigm for Pharmaceutical Analytical Method Development and Validation. Mech. Mater. Sci. Eng. J.. 2017;9:10.
- [CrossRef] [Google Scholar]
- Juran, J.M., Godfrey, A.B., 1998. Juran’s Quality Control Handbook. https://doi.org/10.1108/09684879310045286.
- Quality by design (QbD) based development of a stability indicating HPLC method for drug and impurities. J. Chromatogr. Sci.. 2011;49:439-446.
- [CrossRef] [Google Scholar]
- Nintedanib: A Review of Its Use in Patients with Idiopathic Pulmonary Fibrosis. Drugs. 2015;75:1131-1140.
- [CrossRef] [Google Scholar]
- Nintedanib in ovarian cancer. Expert Opin. Investig. Drugs.. 2017;26:1073-1081.
- [CrossRef] [Google Scholar]
- A platform analytical quality by design (AQbD) approach for multiple UHPLC-UV and UHPLC-MS methods development for protein analysis. J. Pharm. Biomed. Anal.. 2016;125:130-139.
- [CrossRef] [Google Scholar]
- Mazzei, M.E., Richeldi, L., Collard, H.R., 2015. Nintedanib in the treatment of idiopathic pulmonary fibrosis, 121–129. https://doi.org/10.1177/1753465815579365.
- Mohammed, A.Q., Sunkari, P.K., Mohammed, B., Srinivas, P., Roy, A.K., 2015. Quality by Design (QbD) in Action-2 : Controlling Critical Material Attributes (CMA) during the synthesis of an API.
- Ultra-performance liquid chromatography coupled to quadrupole-orthogonal time-of-flight mass spectrometry. Rapid Commun. Mass Spectrom.. 2004;18:2331-2337.
- [CrossRef] [Google Scholar]
- Smith, K.M., 2018. Analysis of Pharmaceutical Drugs Using the ACQUITY UPLC I-Class PLUS System and the Xevo TQ-S Mass Spectrometer, Waters Technol. Br. 1–3. https://www.waters.com/waters/library.htm?locale=en_US&lid=134976284&cid=511436.
- Taylor, P., Garg, N.K., Sharma, G., Singh, B., Nirbhavane, P., Prakash, O., 2015. Journal of Liquid Chromatography & Related Quality by Design (QbD) -based Development and Optimization of a Simple, Robust RP HPLC Method for the Estimation of Methotrexate. https://doi.org/10.1080/10826076.2015.1087409.
- Togami, K., Fukuda, K., Yamaguchi, K., Chono, S., Tada, H., 2018. Facile and sensitive HPLC-UV method for determination of nintedanib in rat plasma, 10.
- Yadav, N.K., Raghuvanshi, A., Sharma, G., Beg, S., Katare, O.P., Nanda, S., 2015. QbD-Based Development and Validation of a Stability-Indicating HPLC Method for Estimating Ketoprofen in Bulk Drug and Proniosomal Vesicular System, pp. 1–13. https://doi.org/10.1093/chromsci/bmv151.
- 5.1.7. https://www.drugbank.ca/drugs/DB09079. 2020. (Accessed 02 March 2020).
Appendix A
Supplementary material
Supplementary data to this article can be found online at https://doi.org/10.1016/j.arabjc.2020.07.014.
Appendix A
Supplementary material
The following are the Supplementary data to this article:Supplementary data 1
Supplementary data 1


