

Translate this page into:
Quality analysis combined with mass spectrometry imaging reveal the difference between wild and cultivated Phyllanthus emblica Linn.: From chemical composition to molecular mechanism
⁎Corresponding authors. hanliyx@163.com (Li Han), zhangdingkun@cdutcm.edu.cn (Dingkun Zhang), 582097013@qq.com (Junzhi Lin)
-
Received: ,
Accepted: ,
This article was originally published by Elsevier and was migrated to Scientific Scholar after the change of Publisher.
Abstract
Abstract
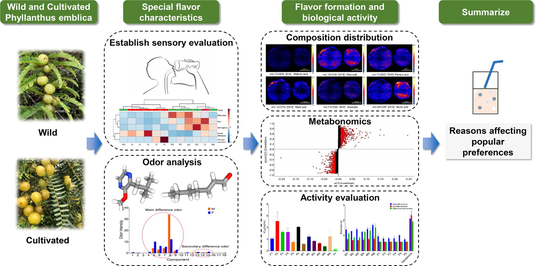
In this paper, the quality of Phyllanthus emblica was evaluated by establishing a comprehensive taste index and odor component analysis method, and the formation mechanism of quality difference was revealed by mass spectrometry imaging and metabolomics. Studies have found that the representative substances of bitterness and astringency in cultivated PE, such as amlaic acid, kaempferol, quercetin and their derivatives, have higher content. Compared with wild PE, cultivated PE has a very lower 2-Isobutyl-3-methoxypyrazine content, a kind of odor molecule that destroys the fruits flavor. Biological activity studies showed that the biological activity of wild PE was stronger than cultivated PE. Mass spectrometry imaging revealed significant differences in the distribution of multiple components between the two types of PE. Metabonomic studies show that their quality differences may be related to the difference of flavonoids and flavonol biosynthesis in PE.
Keywords
Phyllanthus emblica
Wild
Cultivated
Sensory analysis
Metabonomics

1 Introduction
Phyllanthus emblica L. (PE), a common tropical fruit in Southeast Asia, originated in India and Myanmar, which is a tree in the Phyllanthaceae family widely distributed in Southwest China, India, Vietnam and Thailand (Perianayagam et al., 2005), with thousands of years of edible history. Its most attractive flavor feature is, aftertaste-sweetness and stimulation of saliva secretion, which can give lasting comfort to the mouth after a short sour and astringent taste (Huang, Qiu, Lin, Li, Ma, Ran, et al., 2021). Moreover, its juice and dried fruits also have a pleasant fresh fragrance. It is particularly a chief source of vitamin C and minerals compared to other citrus fruits (Variya, Bakrania, & Patel, 2016). PE has high nutritional value and is rich in tannins (33% of the dry weight), vitamins, amino acids, mineral elements, phenolic acids and flavonoids, which gives it strong anti-fatigue, antioxidant, anti-inflammatory, antitumor, cardioprotective and antidiabetic abilities (Grover, Tewari, Sharma, Singh, Yadav, & Naula, 2016; Huang, Qiu, et al., 2021; Liu, Cui, Zhao, Wang, Luo, Yang, et al., 2008; Thirunavukkarasu, Selvaraju, Tapias, Sanchez, Palesty, & Maulik, 2015; Zhao, Sun, Marques, & Witcher, 2015). Because of its unique flavor, rich nutrition and outstanding efficacy (Gantait, Mahanta, Bera, & Verma, 2021), PE is one of the three plants recommended by the United Nations for global cultivation and is favored by the food and functional beverage industry (Liu, Ma, Wan, Li, & Ma, 2020).
China is one of the main producing areas of PE in the world, and the demand is increasing year by year. But at present, PE is still a low-improved economic fruit tree in China, and most of it is still in a wild and semi-wild state (Huang, Ran, Tan, Zhang, Li, Fan, et al., 2021). The most representative wild PE is Chuxiong, Yongren, etc in Yunnan, which has high genetic diversity (Liu, Ma, Wan, Li, & Ma, 2020). The PE produced in Yunnan mainly comes from low-latitude wild mountainous areas at an altitude of 1500–2000 m, which is the largest producing area in China. The weather here is hot and dry during the daytime, with strong ultraviolet radiation and 3–6 times evaporation (compared with local precipitation). Wild PE has the characteristics of small fruit, bitter and astringent taste due to rich tannins and flavonoids (Liu, et al., 2020), which is difficult to be accepted by consumers. Therefore, in the process of cultivation, PE with strong adaptability, high yield and quality are selected purposefully. Such as Guangdong, a hot and humid low-altitude area with abundant precipitation and weak ultraviolet radiation, has a large number of cultivated PE. The PEs in these two places are significantly different in appearance, smell, taste and composition (Li, et al., 2020; Liu, Ma, Wan, Li, & Ma, 2020). However, with the human-made destruction and shrinking of wild resources, cultivated PE has a tendency to gradually replace wild resources (Huang, Ran, et al., 2021; Liu, Ma, Wan, Li, & Ma, 2020). This means that the overall quality of PE in the Chinese market is also gradually changing, which may cause changes in related food and beverage markets and industrial chains (Huang, Ran, et al., 2021). However, there are no reports on the comprehensive qualities (including flavor, composition, biological activity, etc.) differences between them and the chemical essence behind them, and the formation mechanism of their quality differences is unknown. In order to further promote the evaluation and control of its flavor quality, cultivation, quality improvement and development, we must first answer these questions.
To fill the above research gaps, this paper established the temporal dominant description method and the odor rapid analysis method based on Headspace Solid Phase Microextraction equipped with Triple Quadrupole Mass Spectrometry (HS-SPME/GC-QQQ-MS/MS) technology (the built-in database contains 150 kinds of odor components MRM ion pair, threshold, retention time and standard curve), and the differences of special flavor substances between wild and cultivated PE were investigated by the above methods respectively. Secondly, t their biological activity differences were investigated. Finally, metabolomics and mass spectrometry imaging techniques were used to study the formation mechanism of their comprehensive mass differences. We hope that this study can provide reference and guidance for PE quality control, cultivation, pharmaceutical industry, food function and dietary supplement development.
2 Materials and methods
2.1 Ethics statement
Volunteers were given written informed consent forms about the purpose of the study and their right to keep information confidential. Informed written consent was obtained from all participants.
2.2 Materials and chemicals
Water was purified using a Milli Q water purification system (Millipore, Bedford, MA, USA). HPLC-grade methanol was purchased from Fisher Chemical (Pittsburg, PA, USA). HPLC-grade formic acid was obtained from Chengdu KeLong Chemical Factory (Chengdu, China). Anhydrous Ethanol (Analytical purity), Vitamin C was also purchased from Chengdu KeLong Chemical Factory (Chengdu, China). DPPH free radical scavenging ability test kit, ABTS buffer solution was purchased from Solaribio biotechnology Co., Ltd. (Beijing), α-Glucosidase, 4-Nitrophenyl-β-D-glucopyranoside (PNPG, Sigma, USA) and Acarbose (Bayer, Germany). Standards of Citric acid, mucinous acid, malic acid Gallic acid (GA, No. CHB201131), Epicatechin gallate (ECG, No. CHB-B-081), Quercetin(Q, No. CHB-H-040), Corilagin (CR, No. CHB-K-004), Gallocatechin (GC, No.4051109), Catechin (C, No.14051508), Epigallocatechin gallate (EGCG, No.14121608), Gallocatechin gallate (GCG, No.14102009), Ellagic acid (EA, No. CHB-R-039), Chebulagic acid (CLA No. CHB-H-114), Chebulic acid (CA No. CHB-H-140), Chebulinic acid (CBA No. CHB-H-018) were purchased from Chengdu Biopurify Phytochemicals Ltd. (Chengdu, China). The purity of the twelve standards was each above 98.0%.
2.3 Phyllanthus emblica sample collection
12 batches of PE samples were collected from Yunnan and Guangdong, and identified by associate professor Gao Ji-hai from Chengdu University of TCM, and the samples are kept in the National Seed Resource Bank. The specific sampling information is shown in Table 1 and Fig. 1. All the 12 batches were fresh PE fruits collected at mature period.
Batch
Collection place
Origin identification
Altitude (m)
Growing Conditions
Collection time
M1
Chuxiong, Yunnan
Phyllanthus emblica L.
1900
Wild
2021.03
M2
Chuxiong, Yunnan
Phyllanthus emblica L.
1900
Wild
2021.03
M3
Yuanmou, Yunnan
Phyllanthus emblica L.
1800
Wild
2021.03
M4
Yuxi, Yunnan
Phyllanthus emblica L.
1800
Wild
2021.02
M5
Yongren, Yunnan
Phyllanthus emblica L.
1600
Wild
2021.02
M6
Yongren, Yunnan
Phyllanthus emblica L.
1600
Wild
2021.02
F1
Shantou, Guangdong
Phyllanthus emblica L.
120
Cultivation
2021.03
F2
Shantou, Guangdong
Phyllanthus emblica L.
120
Cultivation
2021.03
F3
Chaozhou, Guangdong
Phyllanthus emblica L.
140
Cultivation
2021.03
F4
Chaozhou, Guangdong
Phyllanthus emblica L.
140
Cultivation
2021.02
F5
Chaozhou, Guangdong
Phyllanthus emblica L.
140
Cultivation
2021.03
F6
Shantou, Guangdong
Phyllanthus emblica L.
120
Cultivation
2021.02
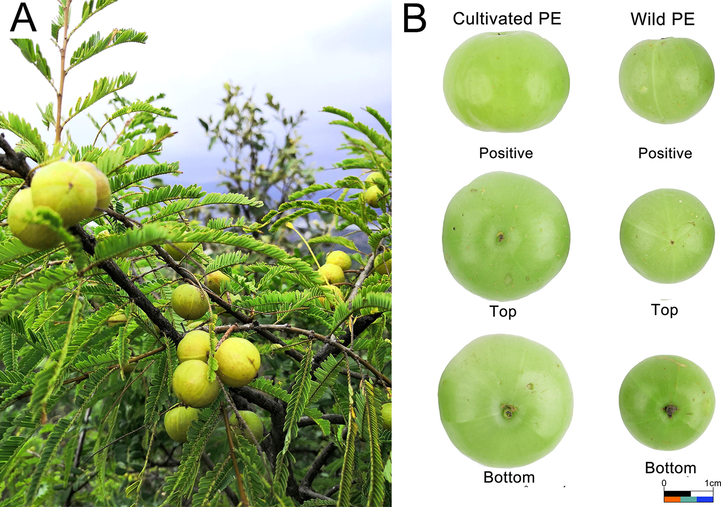
Typical figures of PE plant (A), appearance of wild and cultivated PE (B).
2.4 UPLC-QTOF-Mass conditions
2.4.1 Sample preparation
0.1 g PE freeze-dried powder of each sample was put in clean erlenmeyer flask respectively, added 50 mL of 50% methanol–water solution and ultrasonic for 30 min to dissolve it as a sample solution. Appropriate amount of each reference substance was weighed and made into reference substance solution respectively. All solutions above were filtered through 0.22 μm membranes (Jinteng, Tianjin, China) before injection.
2.4.2 Chromatographic conditions
Samples were analyzed by Acquity UPLC I-class (Waters) ultra performance liquid chromatography system. The Waters ACQUITY UPLC BEH C18 column (2.1 mm × 100 mm, 1.7 μm) was used for the analysis. The mobile phase A was 0.1% formic acid aqueous solution, and the mobile phase B was acetonitrile solution. The gradient elution was 0–3 min, 2%-2% B; 3–5 min, 2%-7% B; 5–15 min, 7% −21% B; 15–20 min, 21%-78% B; 20–21 min, 78%-85% B; 21% −24 % min, 85% −95% B; 24–26 min, 95%-95 %B; 26–28 min, 95%-2%B; 28–30 min, 2%-2%. The column temperature was set as 40 ℃, and the flow rate was 0.3 mL·min−1, and the injection volume was 3 μL.
2.4.3 Mass spectrometry conditions
Samples were analyzed by SYNAPT XS (Waters) high-resolution time-of-flight mass spectrometer. The electrospray ion source (ESI) negative ion mode was used for detection and analysis. The capillary voltage was 4 kV, cone voltage 50 V, ion source temperature 150℃. The atomizing gas was high-purity nitrogen, cone gas flow rate was 50 L·h−1, desolvention gas flow rate was set as 600 L·h−1, and the temperature was set as 250 ℃. The mass spectrum data was collected in MSE mode, ion scanning range was m/z100-1200. Leucine-enkephalin (LE) was used for calibration during data acquisition. LE [M−H]- accurate relative molecular mass was calculated as m/z 554.2615 in negative ion mode.
2.4.4 Data processing and multivariate analysis
Masslynx 4.1 was used to collect data, and the original data was imported into progenesis Qi (V2.0) for processing. The quality error parameter |ppm|<5 was set, and the peak comparison, selection and normalization were performed to obtain the retention times, m/z and peak intensities of each sample. The above information was imported into EZinfo 3.0 for principal component analysis (PCA) and partial least squares discriminant analysis (OPLS-DA) to find the different compounds. Finally, compounds with VIP greater than 1and P < 0.05 were selected as differential metabolites.
2.4.5 Metabolic pathway and function analysis
The selected differential compounds were imported into the MetaboAnalyst 4.0 (http://www.metaboanalyst.ca/) website for pathway analysis Analysis. This website can conduct pathway analysis of compounds through KEGG and HMDB values.
2.5 Mass imaging conditions
PE was cut into even sheet and frozen In −80 degreesC refrigerator. After removal, the slide was covered and compressed, and then freeze-dried as the mass spectrum imaging sample. Samples were analyzed by SYNAPT XS, with DESI ion source. Mass spectrometry conditions were set as follows: negative ion scanning, scanning range100-1500 m/z, spatial resolution 120 um, spray voltage 4.5KV; sampling cone voltage 40 V; sprayer (nitrogen pressure) 0.5 MPa; solvent methyl formic acid (1000: 1), volume flow 2 μL/min; sprayer angle of incidence 70 degrees; collector angle 10 degrees; ion source temperature 150℃; sampling voltage was −40 V. The data acquisition software was Masslynx V4.2 (Waters company, USA) and data processing software was Masslynx HDI V 1.5 software (waters company, USA).
2.6 Establishment of temporal dominant description method
To evaluate the taste difference of PE, a human sensory test using the visual analog scale (VAS) was proposed to verify the results (Han et al., 2018)(Han, Jiang, Han, Xiong, He, Fu, et al., 2018). VAS was a measurement instrument for subjective characteristics or attitudes that cannot be directly measured. It was initially widely used in pain scoring, and then used in the sensory evaluation. With the approval of the medical ethics committee of the Affiliated Hospital of Chengdu University of TCM, 10 well-trained and healthy volunteers (4 males and 6 females, aged 21–28) were selected. Volunteers were selected from graduate students at Chengdu University of TCM. They have no smoking, drinking and drug abuse, no genetic history, no recent oral and throat diseases, and normal taste. All the volunteers were voluntary and signed the informed consent before the experiment.
PE has four basic flavors, which are astringency, bitterness, sourness, aftertaste-sweetness, and one sensations called saliva secretion. Among them, aftertaste-sweetness and salivary secretion are important sensory characteristics of PE. These flavors and sense will appear in sequence during the chewing process, and the last one is sweetness, which is called aftertaste-sweetness. Its precise meaning is that in a certain period of time, a certain taste will occupy an absolute advantage, which makes the flavor of PE have a sense of hierarchy. Previous sensory descriptions cannot accurately evaluate the temporally hierarchical taste of PE. Therefore, it is necessary to establish a special method for PE taste and flavor evaluation, which is called temporal dominant description method (P. Li, Zhang, Lin, Han, Ke, Han, et al., 2019). During the training sessions, volunteers were trained with different concentrations of model solutions (Table 2) so they were accustomed to the evaluation scales and bitterness intensities. After that, the samples were evaluated. A drop of approximately 10 mL of each solution was applied to the upper surface of the tongue for 15 s. Then, the test solution was expectorated. Volunteers were asked to score the “bitterness, sweetness, astringency, acidity” using the 100 mm VAS by placing a mark along a 100 mm line 23. Between each test interval, the mouth was rinsed well with distilled water so that no bitter taste remained. Volunteers were given a break between each session.
Level
Sucralose (sweet)
Tannic acid (astringent)
Citric acid (sour)
Quinine (bitter)
Slight
3.0
0.5
0.5
0.1
Obvious
5.0
1.0
0.8
0.2
Serious
7.0
2.0
1.0
0.3
2.7 HS-SPME/GC-QQQ-MS/MS conditions
2.7.1 HS-SPME conditions
The lyophilized sample was crushed into fine powder (passed through a No. 3 sieve). Accurately weighed 0.5 g PE fine powder and placed in a 20 mL inert headspace bottle, and then equilibrated at 50 degreesC for 40 min. Before and after sample injection, the Solid phase microextraction (SPME) head was automatically aged for 3 min in the 270 ℃ aging device, inserted into the headspace via a PTFE septum, without contact the sample. After extraction and adsorption at a constant temperature of 50℃ for 10 min, the SPME head quickly insert the GC–MS injection port in the pre-operation state, desorb at 250 ℃ for 2 min, and then perform GC–MS/MS analysis (Niu, Wang, Xiao, Zhu, Sun, & Wang, 2019).
2.7.2 Chromatography and mass spectrometry conditions
The PE samples (lyophilized powder) were analyzed by a TQ8050 NX triple quadrupole GC–MS equipped with Aoc-6000 automatic sampler and an electron bombardment ion source (EI), a PAL heating magnetic stirring module and a PAL SPME Arrow solid phase microextraction sampler (1.5 mm × 120 μm × 20 mm, PN: ARR15-DVB/C-WR-120/20CT, CTC Analytics AG, Switzerland). The inertcap pure wax capillary column (30 m × 0.25 mm × 0.25 μm) was used as chromatographic column during analysis. The chromatographic conditions were set as follows: injection temperature was 250 ℃, split ratio was 5:1, injection pressure was 83.5 kPa; carrier gas was high purity helium, carrier gas control mode was constant pressure mode; purge flow was 3.0 % mL/min. The temperature program was set as follows: the initial temperature was 50 ℃ for 5 min, then raised from 10 ℃ to 250 ℃ for 10 min; the column equilibrium time was 2.0 min. The mass spectrometry conditions were set as follows: the ionization energy was 70 EV, the ion source temperature was 200 ℃, the mass spectrum transmission interface temperature was 250 ℃, the collision gas was argon; the mass spectrum monitoring mode was multi reaction monitoring (MRM), the detector voltage was + 0.3kv relative to the tuning result, and the solvent delay time was 1.3 min. In order to improve the sensitivity of the detection, the compounds were monitored by time segment.
2.7.3 Qualitative and quantitative method
Precisely draw 1 μL of the mixed solution of 4 compounds (Acetophenone solution (2 μg/mL, Cat:48292, Sigma), Naphthalene (5 μg/mL, Cat:40053, Sigma), 2,6-Dichlorophenol (2 μg/mL, Cat:40302, Sigma), 2,4,6-Trichloroanisole (2 μg/mL, Cat:47526-U, Sigma) for analysis to evaluate the applicability of the instrument system (Add 5 mL of methanol to a 10 mL volumetric flask, use a pipette to draw 10 μL of each of the 4 compound standard solutions into the volumetric flask, dilute to the mark with methanol, shake well, and use a 0.22 μm microporous filter membrane to filter the solution). Then precisely draw 1 μL of the mixed solution (0.1 μg/mL) containing three internal standards for sample analysis to obtain the peak area of the internal standard. Finally, the samples were measured according to the above conditions. The qualitative of the target compound is confirmed by the m/z ratio and the ion pair. The quantification of the target compound is quantified by the standard curve of 150 compounds built in the Shimadzu TQ8050 reanalysis software (The method parameters and sensory information (odor characteristics and odor threshold, etc.) of about 150 odor compounds were registered in the database.) combined with the measured peak area of the internal standard substance. Through the method package and database, it is very convenient to establish a variety of odor compounds screening methods, and use the built-in standard curve to semi quantify the detected compounds, and confirm the odor causing substances by comparing the results with the threshold.
2.8 Biological activity determination methods
Take the α-glucosidase and PNPG reaction system as a model for testing, and the specific operations were as follows: Added 10 μL of α-glucosidase solution (2U/mL) and 10 μL of the sample solution to each reaction well in turn, mixed well and incubated in a 37 ℃ water bath for 15 min. Then, added 50 μL of PNPG (1 mmol/L), placed it in a 37 ℃ water bath and incubated for 30 min. Finally, added sodium carbonate solution to stop the reaction. Each sample has 3 replicate wells. Measured the absorbance at 405 nm as soon as possible by a multifunctional 96-well plates reader, and repeat for 3 times. Acarbose was used as a positive control, the concentration was 12, 14, 16, 18, 20, 22, 24, 26, 28, 30 mg/mL; the samples were set with 8 concentration gradients of 50, 100, 150, 250, 350, 500, 750, and 1000 μg/mL and calculate the inhibition rate.
According to the DPPH free radical scavenging ability test kit (Solebo biotechnology Co., Ltd.) instructions, prepared the solution and required reagents. Vitamin C was used as a positive control, the concentration was 0.01, 0.05, 0.20, 0.40, 0.60, 0.80, 1.00, 2.00 mg/mL; the samples were set with 8 concentration gradients of 0.20, 0.60, 1.00, 2.00, 4.00, 6.00, 8.00, and 10.00 mg/mL and calculated the scavenging rate. The calculation formula was as follows:
In the formula: A0 was the absorbance value of blank group; A1 was the absorbance value of inhibition group; A2 was the absorbance value of background group. All data were imported into Graphpad prism7.0 software to calculate half inhibitory concentration (IC50).
The antibacterial activity of PE is one of its important biological activities. It has a wide range of antibacterial activities, especially against oral bacteria and common pathogenic bacteria(Staphylococcus aureus, Candida albicans and Aspergillus flavus) (Khan, Hassan, Ullah, Karim, Baseer, Abid, et al., 2013; Thaweboon & Thaweboon, 2011). Staphylococcus aureus, Candida albicans and Aspergillus flavus (purchased from Baina Biological Co., Ltd., China) were inoculated and cultured for 3 generations. Under aseptic conditions, take 0.2 mL of bacterial suspension (the best concentration of bacterial solution is 1 × 10⁶ CFU/mL) and spread it evenly on the surface of the agar plate. The positive group was gentamicin sulfate injection (diluted four times). Take 2 mL of each sample solution (12 times water extract, filter sterilization) into a sterilized EP tube, and then put a 6 mm diameter neutral filter paper into the EP tube to soak for 4 h. Place the filter paper clockwise on the same plate, parallel three groups, and measure the average value after incubation at 37 ℃ for 24 h.
2.9 Data processing and analysis
Statistical analyses were performed using SPSS 22.0 package (SPSS Inc., Chicago, IL, USA) and Oringin 2018 (OriginLab, Hampton, Massachusetts, USA). PCA and OPLS-DA were analyzed by SIMCA-P11.0 (umetrics AB, Umea, Sweden).
3 Results and discussion
3.1 Temporal dominant description evaluation results
PE has 5 basic taste senses, which are bitterness, sourness, astringency, aftertaste-sweetness and stimulate saliva secretion. These five sensations represent the five main kinds of compounds, such as the sourness and saliva secretion comes from organic acids, astringency comes from tannins, aftertaste-sweetness is more complex may come from the comprehensive effect of sugars, amino acids and catechins (Das, Sasmal, & Arora, 2021). Meanwhile, these five sensations will appear in sequence at different times after PE enters the oral cavity. Based on the PE taste characteristics, this paper established a temporal dominant description methods to evaluate the sensory characteristics of wild and cultivated PE(P. Li, et al., 2019). First, 10 volunteers’ VAS scores were used to evaluate 5 sensory scores at different time points. The average scores of 12 batches at different time points were shown by heat map, and the results are shown in Fig. 2 A. It can be clearly seen from the results of the heat map that the five senses of taste are obviously time-dependent. In 0–20 s, sourness, bitterness and astringency were the dominant taste senses, while in 20–40 s were aftertaste and saliva secretion. The tastes appearance time is defined as the taste intensity retention time (TIRT). During the whole tasting process, the bitterness, astringency and sourness intensity (I) of PE showed a downward trend, the rest showed a trend of rising first and then falling. It can be intuitively found from the heat map (Fig. 2 A) that the intensity and duration of bitterness, sourness and astringency of wild PE are significantly stronger than that of cultivated PE. However, many evaluation methods like single oral taste evaluation method, fuzzy mathematics comprehensive evaluation method, sensory simulation evaluation method, etc. cannot accurately reflect the taste dynamic changes in the mouth during chewing. Therefore, it is necessary to establish a method to describe its TIRT.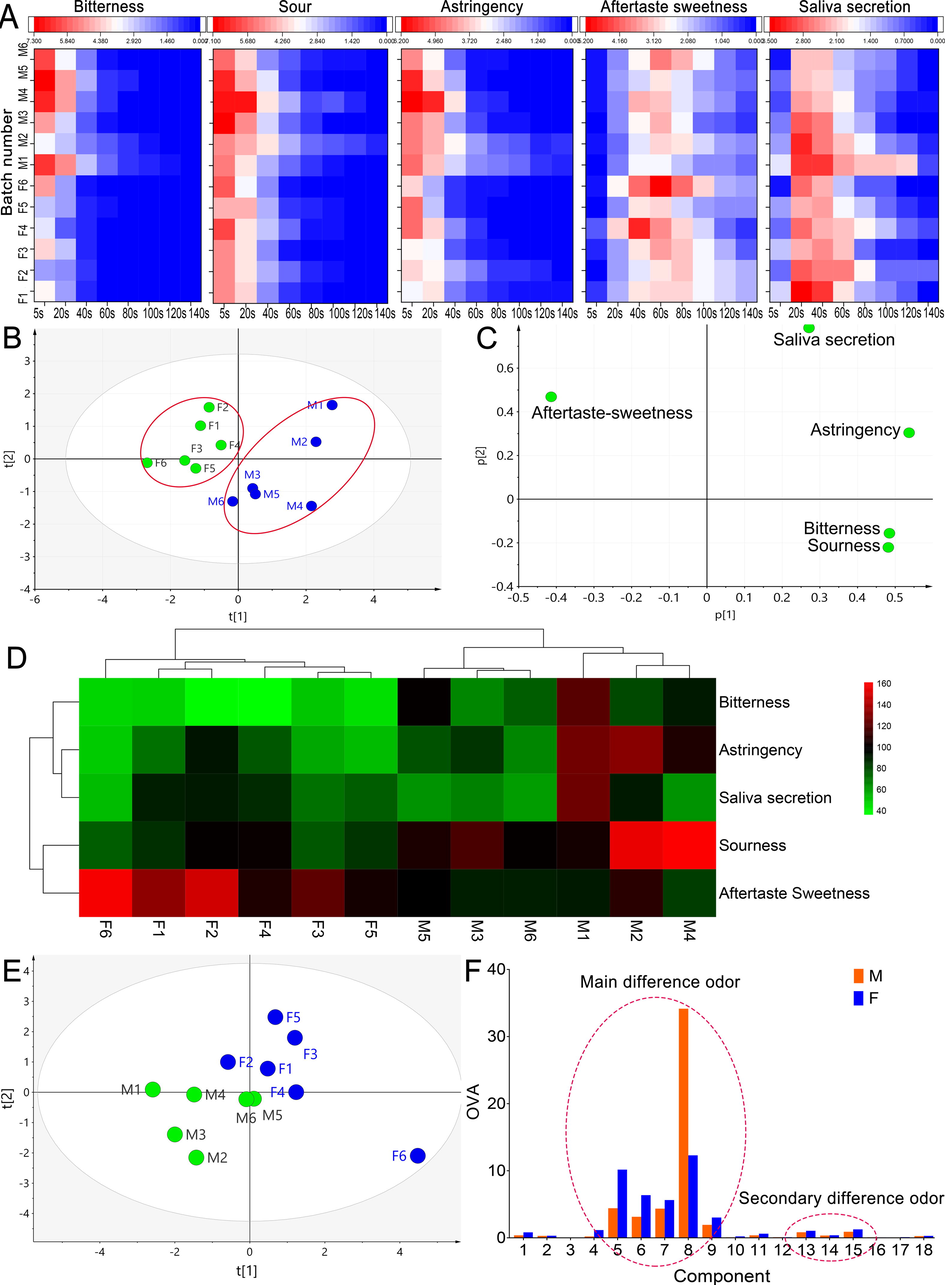
Temporal dominant description evaluation analysis and odor component analysis results, (A) the heatmap of average abundance for the volunteer’s VAS scores at 8 time points, (B) PCA result of comprehensive taste index, (C) loading scatter plot of PCA, (D) clustering heat map of T value, (E) PAC analysis result, (F) comparison result of odor intensity mean value of each component.
It is found through fitting calculation that the sensory intensity and retention time are linearly fitted (y = kx + b), and the fitting results are shown in Table 3. Thus, the slope k value can be easily obtained. The meaning of k value is that the greater the absolute value of k, the shorter the taste retention time. Therefore, it is necessary to establish a function to characterize its retention time. Since the highest taste intensity is 10, the maximum value of the slope (k) is also 10 (the first time point is 0, the second time point is 10, so 0 < │k│〈1 0). There are eight time points in the experiment, and the maximum value is 8. Using the above data, the conversion function f (x) = -0.8x + 8 can be obtained. Here, we introduce its retention time coefficient K to characterize the taste retention time, the formula is as follows:
Batch
KB
R2
KS
R2
KA
R2
KAS1
R2
KAS2
R2
KSS1
R2
KSS2
R2
F1
6.760
0.997
6.792
0.979
6.984
0.970
7.324
0.939
7.640
0.999
6.400
1.000
7.509
0.944
F2
7.360
0.923
7.120
0.938
7.408
0.976
7.408
0.907
7.656
0.936
6.400
1.000
7.600
0.822
F3
6.560
0.991
6.712
0.995
7.216
0.940
7.144
0.977
7.472
0.977
7.520
0.871
7.280
0.871
F4
6.920
0.928
6.872
0.984
6.840
0.989
6.42
0.988
7.311
0.993
6.400
1.000
7.696
0.968
F5
7.120
0.962
6.520
0.968
6.400
0.986
7.36
0.82
7.688
0.848
7.480
0.807
7.560
0.992
F6
6.120
0.988
6.584
0.994
6.840
0.999
6.704
0.972
7.256
0.955
6.000
1.000
7.416
0.976
M1
6.992
0.964
7.084
0.983
7.465
0.924
7.06
0.999
7.736
0.955
6.800
1.000
7.676
0.792
M2
7.440
0.977
7.468
0.948
7.429
0.969
7.24
0.9923
7.656
0.973
6.320
1.000
7.595
0.992
M3
6.736
0.971
6.712
0.998
6.920
0.964
7.088
0.987
7.432
0.902
6.480
1.000
7.504
0.968
M4
6.384
0.910
7.083
0.841
6.528
0.940
6.744
0.989
7.5808
0.981
6.480
1.000
7.624
0.965
M5
6.256
0.996
6.696
0.982
6.592
0.998
7.344
0.928
7.656
0.928
6.800
1.000
7.712
0.952
M6
6.416
0.982
6.976
0.951
6.872
0.985
6.520
0.999
7.4928
0.986
6.480
1.000
7.704
0.907
K represents the TIRT coefficient of 5 tastes, which is defined as: bitterness (KB), astringency (KA), sourness (KS), aftertaste-sweetness (KAS) and stimulate saliva secretion (KSS). In the fitting process, the data starting from 5 s until the taste intensity is greater than or equal to 0.5 are regarded as fitting objects, and the rest are discarded. As can be seen from Fig. 2 A, this rule applies to sourness, bitterness and astringency, so the TIRT coefficient K and R2 can be directly obtained (k < 0, R2 greater than 0.800). However, the intensity of salivary secretion and aftertaste-sweetness increased first and then decreased. Therefore, they have two K values. KAS1 and KSS1 represent the rising stage of taste, and KAS2 and KSS2 correspond to the falling stage (Table. 3). Finally, Multiply the above-mentioned sensory TIRT coefficient K by the sum of various sensory intensities (SI) at each time point to obtain the comprehensive taste index T of each taste. The aftertaste-sweetness and saliva secretion are slightly complex. KAS1 and KSS1 is multiplied by the sum of taste rising stages, KAS2 and KSS2 is multiplied by the sum of taste falling stages. The two are added to get the T value. The calculation formula is as follows:
n is the number of time points in the evaluation process; SI1, n1 represents the rising stage of taste; SI2, n2 is the falling stage. After calculating the T values of 5 taste senses of 12 PE batches, cluster analysis and PCA analysis were performed, and the results are shown in Fig. 2 B. According to the PCA results (Fig. 2 A R2 = 0.804), cultivated and wild PE can be clearly distinguished on the comprehensive taste index, indicating that the model has better discriminative ability. Due to the large difference in the wild environment, it can be clearly found from the PCA result that the dispersion degree of the comprehensive taste index of wild PE is significantly greater than that of the cultivated PE, which indicates that the internal flavor quality of the samples is quite different. In addition, according to the loading scatter plot (Fig. 2 C), cultivated PE is most affected by the aftertaste sweetness, while wild PE has strong bitterness, acidity and astringency, which shows that the aftertaste sweetness intensity is an important factor to distinguish their taste. As the unique flavor of PE, aftertaste sweetness is widely welcomed by consumers. Many related beverages use it as a means of sales promotion. From the results, the reason why cultivated PE can be widely popular also lies in its stronger effect of returning sweet. From the cluster heat map of the comprehensive taste index in Fig. 2 D, it can be found that wild and cultivated can be divided into two groups, further indicating that the model has good discrimination ability. The data will be further correlated with key compounds to screen potential compounds that affect the overall taste of PE.
3.2 HS-SPME/GC-QQQ-MS/MS result
The unique aroma of PE is one of its sensory characteristics. Experienced suppliers will judge its quality according to the strength of its aroma. At present, there is no research on the chemical nature of PE aroma. Based on HS-SPME/GC-QQQ-MS/MS odor analysis technology, combined with retention time, parent ion and MRM monitoring ion pair and built in calibration curve, it can accurately and rapidly identify 150 odorants and analyze their concentration. This paper established a rapid method to identify the chemical components in the special odor of PE, and explored the key differences in the odor components of different types of PE.
Odor threshold refers to the minimum concentration of substances causing human olfaction (pg/mg). The performance of the odor components in PE is not entirely determined by the content, but also the threshold of the components. The threshold indicates the lowest concentration at which the human body can smell the substance. The ratio of the concentration to the threshold is called the odor activity values (OAV):
In the formula: OAV is the odor component intensity; F represents the content of the component (pg); M represents sample mass(mg); T represents the odor threshold of the component (pg/mg). Generally, the components with OAV value greater than 0.1 should be regarded as the components with obvious contribution to their odor, which can affect the flavor of samples in varying degrees. According to the above formula, all batches of PE lyophilized-dried powder were analyzed, and 18 components with OAV greater than 0.1 were found. Their content and OAV are listed in Table 4 and Table 5 respectively.
Serial number
Compounds
Molecular formula
Odor description
Threshold T (pg/mg)
Retention time
(min)Content F (pg)
M1
M2
M3
M4
M5
M6
F1
F2
F3
F4
F5
F6
1
2,3-butanedione
C4H6O2
Butter scent
10.00
2.844
1928.005
0.000
0.000
4014
2405.856
2943.299
1507.128
5908.682
6829.979
2637.664
4205.740
3452.763
2
Valeraldehyde
C5H10O
Almond flavor, spicy flavor, malt flavor
100.00
2.904
15148.190
25988.630
8497.559
16062.26
0.000
20015.940
13592.03
20811.450
0.000
25019.49
0.000
34593.370
3
α-pinene
C10H16
Solvent smell
10.00
3.498
850.857
367.991
198.740
149.664
21.54
171.937
34.682
45.751
58.174
666.949
26.248
559.498
4
Octanal
C8H16O
Sharp and powerful aromas of green and pungent fat and wax, with fruity and jasmine flavor
100.00
9.503
3051.376
20583.17
12610.7
5813.635
10972.24
7764.241
9344.215
6202.305
13409.99
89479.16
8467.164
218757.800
5
Trans-2-Heptenal
C7H12O
Fatty, soap, almond
10.00
10.060
0.000
0.000
0.000
0.000
106189.5
26076.04
52622.45
0.000
65300.28
0.000
24586.04
162342.9
6
Dimethyl trisulfide
C2H6S3
Cabbage, fish, sulfur
0.10
11.064
13.558
143.95
133.921
27.476
245.869
374.392
237.499
196.927
160.608
463.967
170.419
679.289
7
Decanal
C10H20O
Soap, waxy, orange peel
1.00
13.093
793.008
3282.745
2442.16
2087.352
2636.374
1804.386
3192.379
1659.468
3749.547
2355.544
2295.315
3641.778
8
2-isobutyl-3-methoxypyrazine
C9H14N2O
Earthy, spice, green pepper
0.01
13.443
30.002
551.732
266.862
49.027
58.394
68.652
83.193
34.823
94.688
6.061
136.472
13.675
9
Trans-2-Nonenal
C9H16O
Papery
1.00
13.584
554.872
1998.556
1164.004
371.951
1063.255
662.602
2327.227
455.993
2038.206
725.823
1968.747
1564.791
10
Linalool
C10H18O
Floral, lavender
10.00
13.739
650.754
364.046
433.588
209.754
192.378
434.326
909.033
276.518
297.109
1915.447
714.896
2467.23
11
2-Methylisoborneol
C11H20O
Earthy, musty
0.10
14.400
18.36
0.000
0.000
0.000
0.000
92.961
74.801
17.431
0.000
0.000
93.094
0.000
12
Dodecanal
C12H24O
Fatty aroma, with strong aroma similar to pine leaf oil and orange oil
10.00
15.958
0.000
608.232
377.437
615.942
562.941
511.419
649.855
435.348
498.888
323.552
489.484
369.019
13
Methyl salicylate
C8H8O3
Mint flavor
1.00
16.718
1121.976
130.924
180.853
359.083
534.918
165.117
101.29
131.404
170.336
66.625
2582.055
105.118
14
Geraniol
C10H18O
Geranium aroma, rose aroma
1.00
17.556
56.243
255.276
198.44
265.569
59.385
200.793
27.766
22.959
65.366
46.843
226.662
752.436
15
Beta-Ionone
C13H20O
Aroma of violets, raspberries, seaweed
0.10
18.633
9.461
60.156
36.595
25.236
64.355
75.336
48.716
32.381
62.491
78.009
62.867
92.292
16
Heptanoic acid
C7H14O2
Green, orange, soap, gasoline
10.00
18.689
0.000
681.212
579.43
0.000
530.774
472.729
518.78
561.254
573.792
0.000
0.000
487.891
17
1-Dodecanol
C12H26O
Waxy aroma
1.00
18.943
0.000
0.000
0.000
95.009
112.87
0.000
0.000
118.662
0.000
108.78
0.000
80.144
18
M−Cresol
C7H8O
Plastic, fecal smell
0.10
20.151
9.885
22.678
15.058
0.000
18.816
12.419
6.844
14.997
23.718
9.99
18.798
11.589
Serial number
Component
M1
M2
M3
M4
M5
M6
Average
F1
F2
F3
F4
F5
F6
Average
1
2,3-butanedione
0.386
0.000
0.000
0.803
0.481
0.589
0.376
0.301
1.182
1.366
0.528
0.841
0.691
0.818
2
Valeraldehyde
0.303
0.520
0.170
0.321
0.000
0.400
0.286
0.272
0.416
0.000
0.500
0.000
0.692
0.313
3
α-pinene
0.170
0.074
0.040
0.030
0.004
0.034
0.059
0.007
0.009
0.012
0.133
0.005
0.112
0.046
4
Octanal
0.061
0.412
0.252
0.116
0.219
0.155
0.203
0.187
0.124
0.268
1.790
0.169
4.375
1.152
5
Trans-2-Heptenal
0.000
0.000
0.000
0.000
21.238
5.215
4.409
10.524
0.000
13.060
0.000
4.917
32.469
10.162
6
Dimethyl trisulfide
0.271
2.879
2.678
0.550
4.917
7.488
3.131
4.750
3.939
3.212
9.279
3.408
13.586
6.362
7
Decanal
1.586
6.565
4.884
4.175
5.273
3.609
4.349
6.385
3.319
7.499
4.711
4.591
7.284
5.631
8
2-Isobutyl-3-methoxypyrazine
6.000
110.346
53.372
9.805
11.679
13.730
34.156
16.639
6.965
18.938
1.212
27.294
2.735
12.297
9
Trans-2-Nonenal
1.110
3.997
2.328
0.744
2.127
1.325
1.938
4.654
0.912
4.076
1.452
3.937
3.130
3.027
10
Linalool
0.130
0.073
0.087
0.042
0.038
0.087
0.076
0.182
0.055
0.059
0.383
0.143
0.493
0.219
11
2-Methylisoborneol
0.367
0.000
0.000
0.000
0.000
1.859
0.371
1.496
0.349
0.000
0.000
1.862
0.000
0.618
12
Dodecanal
0.000
0.122
0.075
0.123
0.113
0.102
0.089
0.130
0.087
0.100
0.065
0.098
0.074
0.092
13
Methyl salicylate
2.244
0.262
0.362
0.718
1.070
0.330
0.831
0.203
0.263
0.341
0.133
5.164
0.210
1.052
14
Geraniol
0.112
0.511
0.397
0.531
0.119
0.402
0.345
0.056
0.046
0.131
0.094
0.453
1.505
0.381
15
Beta-Ionone
0.189
1.203
0.732
0.505
1.287
1.507
0.904
0.974
0.648
1.250
1.560
1.257
1.846
1.256
16
Heptanoic acid
0.000
0.136
0.116
0.000
0.106
0.095
0.075
0.104
0.112
0.115
0.000
0.000
0.098
0.071
17
1-Dodecanol
0.000
0.000
0.000
0.190
0.226
0.000
0.069
0.000
0.237
0.000
0.218
0.000
0.160
0.103
18
M−Cresol
0.198
0.454
0.301
0.000
0.376
0.248
0.263
0.137
0.300
0.474
0.200
0.376
0.232
0.286
PCA analysis showed that the odor components of wild and cultivated PE could be clearly distinguished (Fig. 2 E). The OAV values of 18 kinds of odor components were compared in pairs (Fig. 2 F). When OAV ≥ 1, it indicates that it is a key odor substance, while 0.1 ≤ OAV < 1 indicates that it plays an important role in changing the overall odor of the sample. The difference components were screened by the following principles: 1. The average OAV value of odor was greater than 0.1; 2. The OAV of odor component was significantly higher than that of other groups; 3. The average value of group F was significantly different from that of group M. Based on the above principles, it was found that No.4–9 and No.13–15 compositions are the substances with the highest odor contribution and the maximum difference in two groups. According to the OVA, it can be divided into the Main and second difference odor components (Fig. 2 F).
Although hundreds of compounds have been identified in PE, only a few compounds actually contribute to sensory of PE flavor. From the results of Fig. 2 F, most of the aroma components are pleasant in cultivated PE, and the OAV is higher than wild PE. For example, trans-2-heptenal has a greasy, fresh, and fruity fragrance, and decanal has an orange peel fragrance. But cultivated PE also mixed with some bad smell, such as dimethyl trisulfide, which described as smelling like cabbage. It should be noted that the OAV of compound 8 in wild PE is much higher than that in cultivated PE. Compound 8, 2-Isobutyl-3-methoxypyrazine (IBMP) has a strong aroma of soil, spices and green pepper, which has a great impact on the overall flavor of PE. IBMP is very common in the food industry, especially in wine and beverage, which will have an adverse effect on the overall flavor of the product (Ling, Zhou, & Lan, 2021). IBMP accumulates during the early growth of fruits, and the content will be affected by photodegradation after the maturity period and the content will decrease rapidly (Sidhu, Lund, Kotseridis, & Saucier, 2015). In the process of fruit ripening, external factors such as climate, environmental conditions and canopy dressing will affect the light and temperature conditions, thus affecting the content of IBMP in the fruit (Gregan et al., 2012); Pickering, Karthik, Inglis, Sears, & Ker, 2008). For example, high temperature may cause the accumulation of IBMP in PE (Lei, Xie, Guan, Song, Zhang, & Meng, 2018). Artificial cultivation and climate change may be an important reason for the great difference of IBMP content between wild and cultivated PE. Therefore, IBMP may be a potential quality marker to distinguish wild PE from cultivated PE. Dimethyl trisulfide, another odor substance with high content in cultivated PE, has a certain meat flavor, which is not conducive to the flavor of PE. According to previous reports, dimethyl trisulfide may come from Strecker degradation of cysteine and methionine (Cho, Roman, Yeboah, & Konishi, 2007). In addition, No. 13, No. 14 and No. 15 compounds have a low contribution rate, but they can change the overall smell of PE and give it a unique aroma. The combination of these odor components makes the overall smell of PE very special, and some people describe cultivated PE as having an apple-like aroma. In short, the smell of cultivated PE is more pleasant. In brief, the smell of cultivated PE is more likely to be pleasant.
3.3 Mass imaging result
MS imaging technology provides a visual method for the characterization of metabolites in PE tissue, which can deeply reveal the component distribution and metabolic differences between wild and cultivated PE from the level of spatial distribution, and provide valuable information for the inner quality and the study of metabolic differences. In the experiment, the compositions were identified based on the literature and HMDB database (Yang, Kortesniemi, Liu, Karonen, & Salminen, 2012). Table.6 shows the main compounds identified in the MS imaging results (Cultivated PE on the left).
No
Compound
(Or isomers)Classification
Molecular formula
Theoretical (m/z)
Measured (m/z)
Molecular ion
Error
(ppm)Intensity
1
Malonic acid
Organic acid
C3H4O4
103.0031
103.0036
[M−H]—
4.8
432
2
Citric acid (or glutamate)
Organic acid
C5H6O4
111.0082
111.0087
[M−H2O]—
4.5
1106
3
Glutaric acid
Organic acid
C5H8O4
113.0238
113.0239
[M−H2O]—
0.9
352
4
Fumaric acid
Organic acid
C4H4O4
115.0031
115.0037
[M−H]—
4.9
1473
5
Malic acid
Organic acid
C4H6O5
133.0137
133.0142
[M−H]—
3.7
4904
6
Glutamic acid
Amino acid
C5H9NO4
146.0453
146.0458
[M−H]—
3.4
291
7
Gallic acid
Phenolic acid
C7H6O5
169.0137
169.0143
[M−H]—
3.5
646
8
Aconitate
Organic acid
C6H6O6
173.0086
173.0092
[M−H]—
3.4
421
9
Vitamin C
Vitamin
C6H8O6
175.0248
175.0242
[M−H]—
0.0
4344
10
Glucose
Saccharides
C6H12O6
179.0555
179.0560
[M−H]—
2.8
1056
11
Citric acid
Organic acid
C6H8O7
191.0191
191.0196
[M−H]—
2.6
17,827
12
Mucic acid
Organic acid
C6H10O8
209.0297
209.0303
[M−H]—
2.8
14,209
13
Glucose(Or fructose, etc)
Saccharides
C6H12O6
215.0322
215.0327
[M + Cl]—
2.3
2972
14
linoleic acid
Fatty acid
C18H32O2
279.2324
279.2327
[M−H]—
1.1
1410
15
Oleic acid
Fatty acid
C18H34O2
281.2481
281.2485
[M−H]—
1.4
2571
16
Malic acid gallate
Phenolic acid
C11H10O9
285.0246
285.0256
[M−H]—
3.5
714
17
Ellagic acid
Phenolic acid
C14H6O8
300.9984
300.9990
[M−H]—
1.9
758
18
Galloylglucose
Phenolic acid
C13H16O10
331.0665
331.0669
[M−H]—
1.2
7998
19
Sucrose
Saccharides
C12H22O11
341.1083
341.1083
[M−H]—
0
461
20
Mucic acid lactone
gallatePhenolic acid
C13H12O11
343.0301
343.0303
[M−H]—
0.5
6110
21
Ellagic acid
Phenolic acid
C14H6O8
347.0039
347.0051
[M + FA-H]—
3.4
403
22
2-O-Galloylgalactaric acid
Phenolic acid
C13H14O12
361.0407
361.0409
[M−H]—
0.5
17,968
23
Vitamin B
Vitamin
C16H20O9
377.0853
377.0854
[M + Na-2H]—
0.2
1670
24
Chebulic acid
Tannin
C14H12O11
355.0302
355.0321
[M−H]—
5.3
286
25
Ellagic acid pentose
Phenolic acid
C19H14O12
433.0407
433.0407
[M−H]—
0
347
26
Epicatechin gallate
Flavonoids
C22H18O10
441.0822
441.0821
[M−H]—
−0.2
203
27
Ellagic acid hexose
Tannin
C20H16O13
463.0513
463.0518
[M−H]—
1.1
475
28
Digalloylglucose
Tannin
C20H20O14
483.0775
483.0782
[M−H]—
1.5
925
29
Mucic acid lactone
digallatePhenolic acid
C20H16O15
495.0411
495.0423
[M−H]—
2.4
497
30
Corilagin
Tannin
C27H22O18
633.0728
633.0732
[M−H]—
0.6
254
31
Trigalloylglucose
Tannin
C27H24O18
635.0885
635.0876
[M−H]—
−1.4
241
32
Digalloyl-HHDP-Glucose
Tannin
C34H26O22
785.0838
785.0836
[M−H]—
−0.2
259
33
Chebulagic acid
Tannin
C41H30O27
953.0896
953.0898
[M−H]—
0.2
220
3.3.1 Distribution characteristics of organic acids
Organic acids are another kind of important secondary metabolites in plants. They play an important role in plant energy metabolism and plant response to external stresses. For example, malic acid is widely involved in photosynthesis and respiration of plants; citric acid, a common plant organic acid, has biological activities such as oxidation resistance and antibacterial activity (Chang, Foo, Loh, Lim, & Abdul Mutalib, 2020). In the mass imaging experiment, 9 organic acids and their distribution characteristics were identified. Among them, aconitic acid, citric acid, malic acid and fumaric acid are the typical components involved in the tricarboxylic acid cycle. As shown in Fig. 3, the contents of all 6 organic acids content are lower in the core and fruit compartment diaphragm (the obvious black lines in the fruit in Fig. 3), but increased significantly near the epidermis. This suggests that the metabolism of tricarboxylic acid in PE may be more vigorous in the tissue structure close to the epidermis. In particular, citric acid and malic acid are the most significant, their content in the epidermis is extremely high, which makes the sour substances preferentially released during the chewing process, causing their sour taste to be prominent. In addition, it is not difficult to find that the content of citric acid and malic acid in this two PEs is significantly different. The content of cultivated PE is lower and even distribution. This is one of the main reasons why the wild tastes extremely sour and difficult to eat.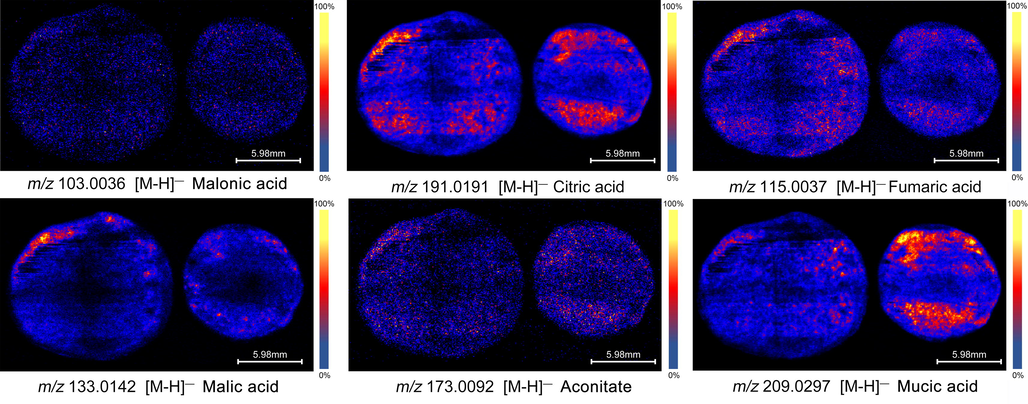
Distribution characteristics of main organic acids in PE tissue.
3.3.2 Distribution characteristics of Tannin and Phenolic acid
Tannin is the second major component in PE fresh fruits, and its highest content can reach 30%-40% of its dry weight (Huang, Ran, et al., 2021), which has strong antioxidant, anti-tumor, antibacterial and anti-hyperglycemic activities (Variya, Bakrania, & Patel, 2016). Like organic acids, they are mainly distributed near the epidermis. From Fig. 4, the distribution of tannins in the two PEs are obviously different, such as ellagic acid, malic acid gallate, mucic acid lactone gallate and galloylglucose.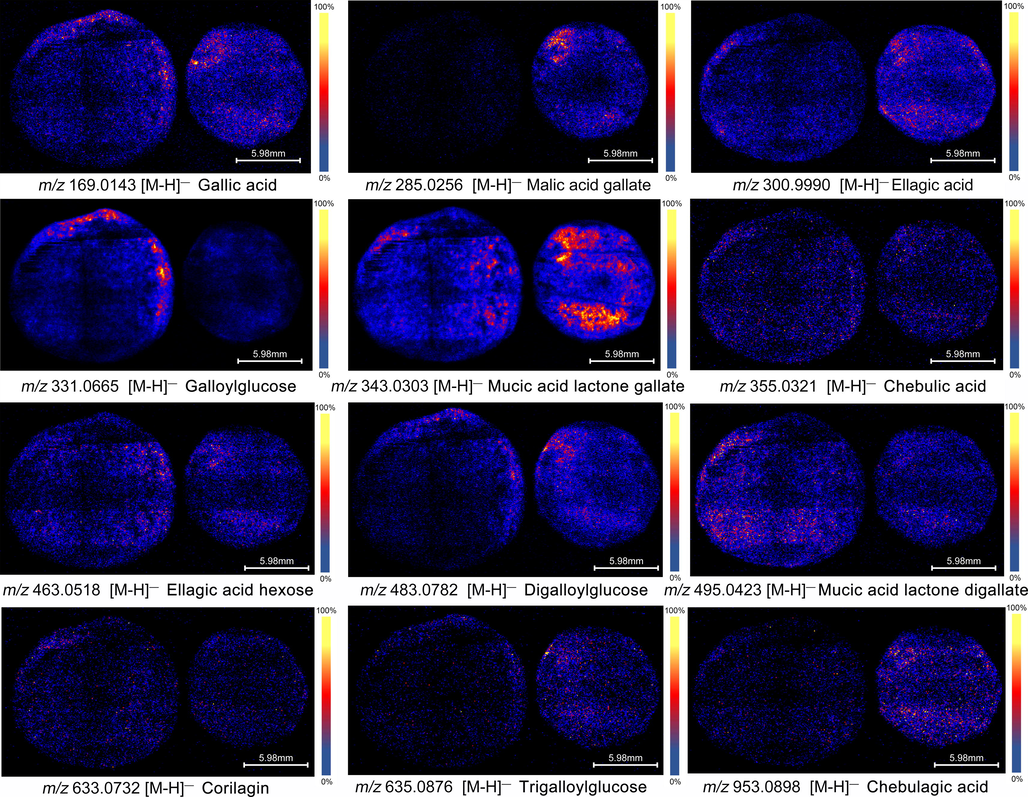
Distribution characteristics of tannin and phenolic acid.
Tannins are important secondary metabolites produced by plants in response to the growth environment. Wild PE grows in a harsh environment of high altitude, drought, heat, and less rain; while-cultivated PE generally grows in a warm and humid low-altitude environment. In the hot and dry environment, plants produce a lot of tannins as defense substances to resist external invasion and prevent the loss of water and other nutrients. Under dry heat stress, plants will promote phenylpropane biosynthesis and flavonoid biosynthesis, and make polyphenols and flavonoids accumulate. They can effectively resist the damage caused by dry heat and ultraviolet radiation, which is the performance of plants against external stress (Kumar et al., 2016). The wild PE epidermis is directly affected by solar radiation and drought, leading to more active metabolism and more accumulation of metabolites. This may explain why it is highly distributed in epidermis (Chen, Liu, Cui, Lu, Wang, Wu, et al., 2018; Morris, Carter, Hauck, Lanot, Theodorou, & Allison, 2021).
3.3.3 Distribution characteristics of nutrients
The nutrition of PE is one of the important properties of its edible value. It not only has high health benefits, but also affects its taste. In the experiment, 8 kinds of nutrients were identified (Fig. 5), including saccharides, vitamins, amino acids and fatty acids. It can be clearly seen from Fig. 5 that the nutrient content of cultivated PE is generally higher, indicating that it is rich in nutrients and more suitable for consumption. For example, the content of vitamins and sugars is higher, which can make the sweetness and aftertaste-sweetness of cultivated PE better. Surprisingly, the distribution of suspected fatty acids was found in the epidermis, which was usually found in the seed nucleus. Based on the above results, most of the components of PE are higher in the part near the epidermis, and from the perspective of the spatial distribution and content of the components, it explains the generation of the taste level of PE and the reason why cultivated PE tastes better than wild PE.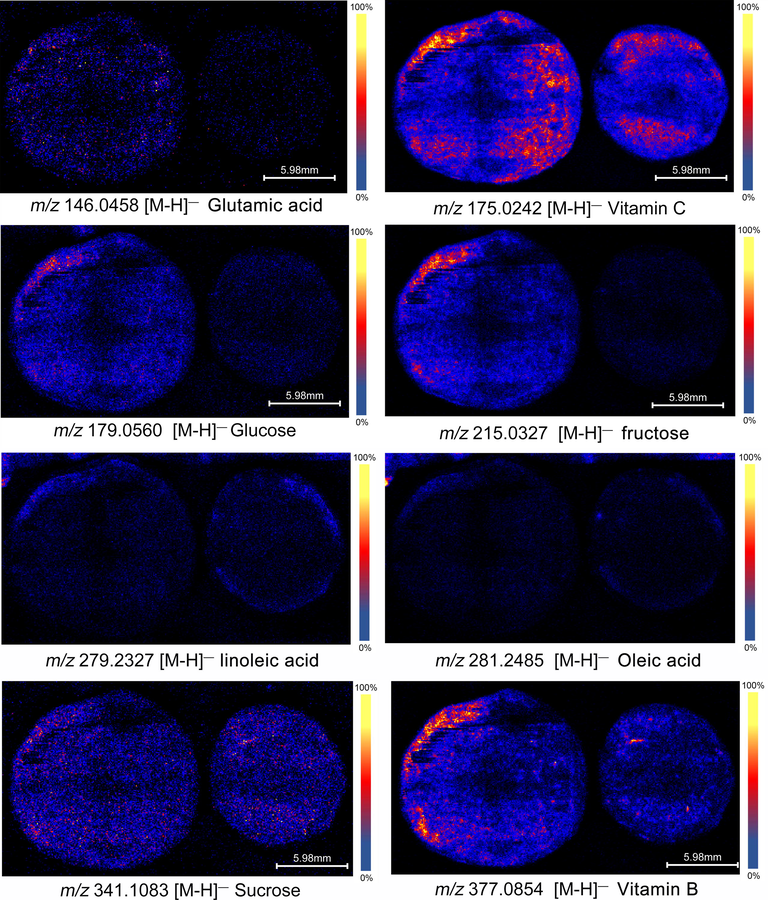
Distribution characteristics of nutrients.
3.4 Metabolomics and taste correlation analysis
In order to further reveal the chemical differences and biological background between wild and cultivated PE, metabonomics method based on UPLC-QTOF-MS was used to study the main differences of their metabolic pathways. The quality control samples (QCS) were prepared by mixing the reference materials. QC samples gathered together showed that the repeatability of the system was good, and the data can be further studied. Through OPLS-DA analysis, it was found that there were significant differences in chemical composition and metabolites between group F and group M in negative ion mode ((Fig. 6 A R2Y = 0.99, Q2 = 0.73). To explore the potential variables, S-plot was carried out. In S-plot (Fig. 6 B), the farther the variable deviates from the origin, the higher the value of the variable importance plot obtains. According to the accurate m/z and fragment characteristics (Ion fragment prediction matching) of the ion characteristic metabolites, and compared with the reference substance, a total of 33 characteristic metabolites were identified in the sample (Fig. 6 G). The results showed that the contents of tannins and flavonoids in wild PE were significantly higher than those in cultivated PE, which may be an important reason for the taste difference. Furthermore, the differential marker data were imported into metaboanalyst 5.0 for pathway enrichment (Fig. 6 C).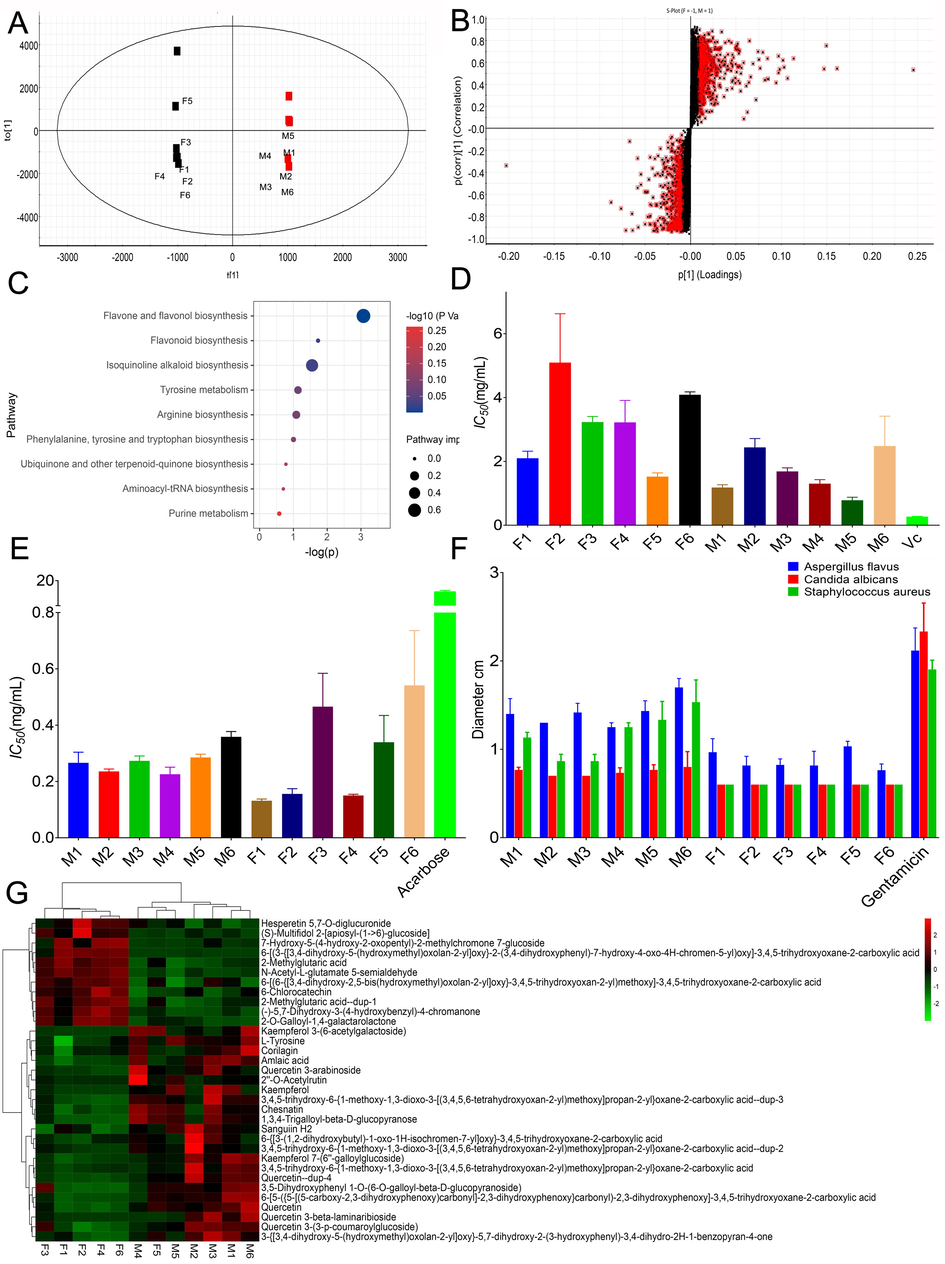
Results of OPLS-DA(A), S-plot(B), pathway enrichment analysis bubble plot (C), antioxidant activities (D), anti-hyperglycemic activities (E), antibacterial activity (F), heat maps of differential markers (G).
The difference markers were marked as HMDB-ID, and imported into MetaboAnalyst5.0 for pathway analysis. The result (Fig. 6 C) shows that the selected metabolites mainly involve flavone and flavonol biosynthesis, flavonoid biosynthesis, histidine metabolism, arginine biosynthesis, pentose phosphate pathway, carbon fixation in photosynthetic organisms, pyrimidine metabolism, cysteine and methionine metabolism. Among them, the enrichment pathway with p < 0.05 was the flavone and flavonol biosynthesis, and flavonoid biosynthesis. Obviously, the generation of this metabolic difference is closely related to its different planting geographical environment. The results showed that the accumulation of phenolic metabolites of wild PE was significantly higher than that of cultivated PE, and the former grew in drought. Phenolic accumulation is very crucial to counteract the negative impacts of drought stress in plants(Ali, Ganai, Kamili, Bhat, Mir, Bhat, et al., 2018). Transcriptomic and metabolomic studies carried out on Arabidopsis plants confirmed that increased flavonoid accumulation under drought stress is very helpful to provide resistance. Accumulation and Biosynthesis of flavonols were also stimulated in plants under water deficit conditions accompanied by enhanced resistance against drought stress (Nakabayashi, Yonekura-Sakakibara, Urano, Suzuki, Yamada, Nishizawa, et al., 2014). For example, contents of flavonoids like kaempferol and quercetin were enhanced in tomato plants accompanied by enhanced drought tolerance (M. Li, Li, Zhang, Li, Gao, Ai, et al., 2018; Sánchez-Rodríguez, Moreno, Ferreres, Rubio-Wilhelmi Mdel, & Ruiz, 2011).
It is well known that plants growing in high altitude areas accumulate more flavonoid phenolics than plants in temperate regions. Under high light/UV radiation, the enhancement of flavonoid accumulation is due to the stimulated flavonoid biosynthesis pathway and its corresponding gene transcription level (Sharma, Shahzad, & Rehman, 2019). Flavonoids also act as light screens due to their capability of absorbing both visible (anthocyanins) and UV radiations (anthocyanins and colorless flavonoids), hence protecting plants from these harmful radiations (Agati, Brunetti, Di Ferdinando, Ferrini, Pollastri, & Tattini, 2013). This also explains why mass spectrometry imaging shows higher levels of secondary metabolites near the epidermis of wild PE. However, the enhanced synthesis of flavonoids and flavanols will increase their bitterness and worsen the taste, which is a phenomenon that should be avoided in beverages.
In order to further clarify the relationship between different compounds and taste, reveal the chemical properties of their taste, and provide a reference for quality control, this paper explored the correlation between differential markers and comprehensive taste index, and initially screens some quality markers that affect taste. Pearson correlation analysis was used in the data processing. It can be found that bitterness substances are closely related to tannins and flavonoids, such as quercetin (0.62), amlaic acid (0.76) and kaempferol (0.62). This further illustrates that the difference in biosynthesis of flavonoids and flavanols is the cause of the difference in flavor. The sourness and astringency are related to tannins such as sanguiin H2 (0.67) and amlaic acid (0.64). The formation of aftertaste sweetness is more complicated, and it has been reported that it is related to the catechins EC and EGC (Zhang, Yin, Chen, Wang, Du, Jiang, et al., 2016). But at present, the findings in this paper are related to some amino acid derivatives and glycosides, such as hesperetin 5,7-O-diglucuronide (0.64) and N-Acetyl-L -glutamate 5-semialdehyde (0.84). It is worth noting that amlaic acid is relevant to all bad tastes, which may be an important potential flavor quality marker. In addition, quercetin and related derivatives can also be used as quality markers that affect flavor.
3.5 Activity evaluation results
As a dietary supplement and functional beverage, PE has higher health benefits, which is due to its strong antioxidant activity and hypoglycemic effect. The anti-hyperglycemic activity of PE is mainly manifested in its anti-hyperglycemic activity α Inhibition of glucosidase (Majeed, Majeed, & Mundkur, 2020). Therefore, the antioxidant and anti-hyperglycemic activities of two PEs were determined respectively to clarify their difference in activity. As shown in Fig. 6 D, due to the different content of polyphenols, flavonoids and organic acids, the antioxidant activity of wild PE was significantly stronger than cultivated PE (p < 0.05). And surprisingly, both wild and cultivated PE in Fig. 6.E showed strong anti-hyperglycemia ability compared with the positive group. Although there are certain differences in activity within the cultivated group, there is no significant difference between the wild and cultivated groups. The antibacterial experiment uses the ultrasonic extract of freeze-dried powder (12 times water, commonly used amount) as the sample solution, which is the commonly used extraction dose of PE in the beverage industry. The results (Fig. 6 F) showed that the antibacterial activity of wild PE was significantly stronger than cultivated PE, and the latter had almost no other antibacterial effect except Aspergillus flavus. This may be closely related to the accumulation of secondary metabolites such as flavonoids and tannins. In addition, because the experiment used a water extract, which made many lipophilic tannins and flavonoids with strong antibacterial activity difficult to dissolve in it, limiting their biological activity (Liu, Zhao, Luo, Yang, & Jiang, 2009). Based on the above results, wild PE has better biological activity.
4 Conclusion
The research shows that cultivated PE has a lower IBMP, a kind of green pepper flavor that destroys the flavor of the foods and beverages. The aftertaste-sweetness is the biggest flavor characteristic of PE, followed by bitterness and astringency, which can directly affect the preference of consumers. In addition, the flavor quality of wild PE is quite different, which makes it difficult to control the quality of the final product. The component distribution of wild PE is mostly concentrated in the epidermis. Combined with metabolomics research, this may be due to the strong ultraviolet radiation in its growth environment, which caused its resistant secondary metabolites such as flavonoids and tannins (quercetin and its derivatives, amlaic acid and kaempferol, etc.) to accumulate bitter and astringent components near the epidermis. This distribution leads to more obvious bad taste such as bitterness and astringency, which further causes the taste of wild PE to decrease. Correspondingly, the content of these components in cultivated PE is low, and the components related to aftertaste-sweetness are significantly higher, making its overall taste better. Although the flavor and taste of wild PE are not as good as cultivated PE, it has stronger antioxidant and antibacterial activities, and it is believed that it also has stronger other biological activities. The mechanism of this phenomenon may involve the metabolic differences of flavone and flavonol biosynthesis, flavonoid biosynthesis, histidine metabolism, arginine biosynthesis, pentose phosphate pathway, etc. This study investigated the quality difference between wild and cultivated Amaryllis, and revealed the chemical nature and biological mechanism of the difference, which provided a reference for artificially-guided cultivation, resource grading and comprehensive utilization of resources in the future.
CRediT authorship contribution statement
Haozhou Huang: Methodology, Data curation, Writing – original draft. Peng Tan: Methodology, Data curation, Writing – original draft. Mengqi Li: Methodology, Data curation. Qinchu Tan: Methodology, Data curation. Jihai Gao: . Xiaoming Bao: . Sanhu Fan: . Taigang Mo: . Wanmin Mao: . Feng Lin: . Li Han: Conceptualization, Supervision, Validation, Writing – review & editing. Dingkun Zhang: Conceptualization, Supervision, Validation, Writing – review & editing. Junzhi Lin: Conceptualization, Supervision, Validation, Writing – review & editing.
Acknowledgements
This study was supported by grants from the National Natural Science Foundation of China (81973493), Study and Research Joint Laboratory Project of Chengdu University of TCM & Sanajon Pharmaceutical Group (2019-YF04-00086-JH) and National interdisciplinary innovation team project of Traditional Chinese Medicine (ZYYCXTD-D-202209) and Sichuan Province Science and Technology Plan Funded Project (2021YFN0100). Thanks to Innovative Institute of Chinese Medicine and Pharmacy of Chengdu University of TCM for its technical support in mass spectrometry imaging work.
Declaration of Competing Interest
The authors declare that they have no known competing financial interests or personal relationships that could have appeared to influence the work reported in this paper.
References
- Functional roles of flavonoids in photoprotection: new evidence, lessons from the past. Plant Physiol Biochem. 2013;72:35-45.
- [Google Scholar]
- Comparative Studies of Inhibitory and Antioxidant Activities, and Organic Acids Compositions of Postbiotics Produced by Probiotic Lactiplantibacillus plantarum Strains Isolated From Malaysian Foods. Front Vet Sci. 2020;7:602280
- [Google Scholar]
- Chen, H., Liu, J., Cui, K., Lu, Q., Wang, C., Wu, H., Yang, Z., & Ding, W. 2018. Molecular mechanisms of tannin accumulation in Rhus galls and genes involved in plant-insect interactions. 8(1), 9841.
- The road to advanced glycation end products: a mechanistic perspective. Curr Med Chem. 2007;14(15):1653-1671.
- [Google Scholar]
- Effect of thermal and non-thermal processing on astringency reduction and nutrient retention in cashew apple fruit and its juice. J Food Sci Technol. 2021;58(6):2337-2348.
- [Google Scholar]
- Advances in biotechnology of Emblica officinalis Gaertn. syn. Phyllanthus emblica L.: a nutraceuticals-rich fruit tree with multifaceted ethnomedicinal uses. 3. Biotech. 2021;11(2):62.
- [Google Scholar]
- Effects of solar ultraviolet radiation and canopy manipulation on the biochemical composition of Sauvignon Blanc grapes. Australian Journal of Grape & Wine Research. 2012;18(2):227-238.
- [Google Scholar]
- Effect of Subgingivally Delivered 10% Emblica officinalis Gel as an Adjunct to Scaling and Root Planing in the Treatment of Chronic Periodontitis - A Randomized Placebo-controlled Clinical Trial. Phytother Res. 2016;30(6):956-962.
- [Google Scholar]
- A novel quantified bitterness evaluation model for traditional Chinese herbs based on an animal ethology principle. Acta Pharm Sin B. 2018;8(2):209-217.
- [Google Scholar]
- Potential effect of tropical fruits Phyllanthus emblica L. for the prevention and management of type 2 diabetic complications: a systematic review of recent advances. Eur J Nutr. 2021
- [Google Scholar]
- Strategies and ideas of comprehensive development and utilization of medicine and food homologous variety Phyllanthus emblica. Zhongguo Zhong Yao Za Zhi. 2021;46(5):1034-1042.
- [Google Scholar]
- Antibacterial activity of Phyllantus emblica, Coriandrum sativum, Culinaris medic, Lawsonia alba and Cucumis sativus. Acta Pol Pharm. 2013;70(5):855-859.
- [Google Scholar]
- De novo Transcriptome Analysis Revealed Genes Involved in Flavonoid and Vitamin C Biosynthesis in Phyllanthus emblica (L.). Front. Plant Sci. 2016;7:1610.
- [Google Scholar]
- Methoxypyrazines biosynthesis and metabolism in grape: A review. Food Chem. 2018;245:1141-1147.
- [Google Scholar]
- Metabolomics analysis reveals that elevated atmospheric CO(2) alleviates drought stress in cucumber seedling leaves. Anal Biochem. 2018;559:71-85.
- [Google Scholar]
- Optimized model for formulation prescription of traditional Chinese medicine buccal tablets based on temporal dominant description of sensations combined with multivariate statistical analysis:an example of Compound Caoshanhu Buccal Tablets. Zhongguo Zhong Yao Za Zhi. 2019;44(14):3035-3041.
- [Google Scholar]
- HPLC fingerprint analysis of Phyllanthus emblica ethanol extract and their antioxidant and anti-inflammatory properties. J Ethnopharmacol. 2020;254:112740
- [Google Scholar]
- Modification of Sensory Expression of 3-Isobutyl-2-methoxypyrazine in Wines through. Blending Technique.. 2021;26(11)
- [Google Scholar]
- Identification of phenolics in the fruit of emblica (Phyllanthus emblica L.) and their antioxidant activities. Food Chem. 2008;109(4):909-915.
- [Google Scholar]
- Genetic Diversity of Phyllanthus emblica From Two Different Climate Type Areas. Front Plant Sci. 2020;11:580812
- [Google Scholar]
- Identification of volatile components in Phyllanthus emblica L. and their antimicrobial activity. J Med Food. 2009;12(2):423-428.
- [Google Scholar]
- Standardized Emblica officinalis fruit extract inhibited the activities of α-amylase, α-glucosidase, and dipeptidyl peptidase-4 and displayed antioxidant potential.. 2020;100(2):509-516.
- Responses of Lotus corniculatus to environmental change 3: The sensitivity of phenolic accumulation to growth temperature and light intensity and effects on tissue digestibility. Planta. 2021;253(2):35.
- [Google Scholar]
- Enhancement of oxidative and drought tolerance in Arabidopsis by overaccumulation of antioxidant flavonoids. Plant J. 2014;77(3):367-379.
- [Google Scholar]
- Evaluation of the perceptual interaction among ester aroma compounds in cherry wines by GC-MS, GC-O, odor threshold and sensory analysis: An insight at the molecular level. Food Chem. 2019;275:143-153.
- [Google Scholar]
- Evaluation of Antidiarrheal Potential of Emblica officinalis. Pharm Biol. 2005;43(4):373-377.
- [Google Scholar]
- Detection thresholds for 2-isopropyl-3-methoxypyrazine in Concord and Niagara grape juice. J Food Sci. 2008;73(6):S262-266.
- [Google Scholar]
- Differential responses of five cherry tomato varieties to water stress: changes on phenolic metabolites and related enzymes. Phytochemistry. 2011;72(8):723-729.
- [Google Scholar]
- Response of Phenylpropanoid Pathway and the Role of Polyphenols in Plants under Abiotic. Stress.. 2019;24(13)
- [Google Scholar]
- Methoxypyrazine analysis and influence of viticultural and enological procedures on their levels in grapes, musts, and wines. Crit Rev Food Sci Nutr. 2015;55(4):485-502.
- [Google Scholar]
- Effect of Phyllanthus emblica Linn. on candida adhesion to oral epithelium and denture acrylic. Asian Pac. J Trop Med. 2011;4(1):41-45.
- [Google Scholar]
- Protective effects of Phyllanthus emblica against myocardial ischemia-reperfusion injury: the role of PI3-kinase/glycogen synthase kinase 3β/β-catenin pathway. J Physiol Biochem. 2015;71(4):623-633.
- [Google Scholar]
- Emblica officinalis (Amla): A review for its phytochemistry, ethnomedicinal uses and medicinal potentials with respect to molecular mechanisms. Pharmacol Res. 2016;111:180-200.
- [Google Scholar]
- Analysis of hydrolyzable tannins and other phenolic compounds in emblic leafflower (Phyllanthus emblica L.) fruits by high performance liquid chromatography-electrospray ionization mass spectrometry. J Agric Food Chem. 2012;60(35):8672-8683.
- [Google Scholar]
- Improving the sweet aftertaste of green tea infusion with tannase. Food Chem. 2016;192:470-476.
- [Google Scholar]
- Anticancer Properties of Phyllanthus emblica (Indian Gooseberry) Oxid Med Cell Longev. 2015;2015:950890
- [Google Scholar]


