

Translate this page into:
Quantitative screening of parabens in Ready-to-eat foodstuffs available in the Saudi market using high performance liquid chromatography with photodiode array detection
⁎Corresponding author at: College of Pharmacy, Department of Pharmaceutical Chemistry, King Saud University, Riyadh 11495, P.O. Box 22452, Saudi Arabia. hadirrona@yahoo.com (Hadir M. Maher) hshalaby@ksu.edu.sa (Hadir M. Maher)
-
Received: ,
Accepted: ,
This article was originally published by Elsevier and was migrated to Scientific Scholar after the change of Publisher.
Peer review under responsibility of King Saud University.
Abstract
Parabens are widely used as preservatives in thousands of consumer’s products including, cosmetics, pharmaceutical products, and foodstuffs. Concern in regards to the safety of parabens has been raised where parabens have been classified as “Endocrine disrupting compounds” with potential link to many tumor types. Despite their wide spread, the occurrence of parabens in foodstuffs available in the Saudi market has not been studied until now. In this work, an HPLC-PDA method was developed and validated for the screening of parabens’ residues in different categories of Ready-to-eat foodstuffs collected from the Saudi market. These categories include: cereals, meat, fish, dairy product, bean products, fruits, vegetables, cookies and snacks, beverages, condiments, and others. Chromatographic analysis of the selected parabens (Methyl paraben MeP, ethyl paraben EtP, propyl paraben PrP, butyl paraben BuP, and isobutyl paraben isoBuP) was performed on Symmetry® C-18 Colum (4.6 × 75 mm, 3.5 μm) with methanol/water (57:43, v/v) as the mobile phase and using simply methanol for sample preparation. The proposed method was fully validated with regards to linearity, limits of detection (LOD) and of quantitation (LOQ), accuracy and precision, extraction recovery, and specificity. Matrix-based calibration curves were linear in the range 0.025–500 μg/g (MeP, EtP), 0.05–500 μg/g (PrP), and 0.125–1250 μg/g (IsoBuP, BuP) with LOQ 0.025 μg/g for MeP, EtP, 0.05 μg/g for PrP, 0.125 μg/g for both BuP and isoBuP. The method was successfully applied for quantitative screening of the five parabens in different Ready-to-eat foodstuffs (n = 215) collected from the Saudi market. The total parabens content was determined and was related to the food category and to the packaging material. The highest paraben content was found in cereals and condiments. The type of the packaging material did not have a significant effect on the paraben content among all food categories. Moreover, the estimated daily intake of parabens among the Saudi adults was calculated and it was found to have an average of 2000 μg/kgbw/day.
Keywords
Parabens
Food analysis
HPLC-PDA
Saudi market

1 Introduction
Endocrine-disrupting chemicals (EDC) are compounds with different abilities to alter the activity of the endocrine system which in turn is responsible for controlling physiological body functions (e.g. metabolism, sleep, mood, growth, …, etc.) (Darbre and Harvey, 2008; Maqbool et al., 2016; Larsson et al., 2014), the most common of which is parabens. Chemically, parabens are esters of p-hydroxybenzoic acid, with different alkyl substituents ranging from methyl paraben (MeP), ethyl paraben (EtP), propyl paraben (PrP), isobutyl paraben (IsoBuP), butyl paraben (BuP), …. and others (Błędzka et al., 2014). Parabens are known for their antimicrobial action and are thus widely used as preservatives in cosmetic products, pharmaceutical preparations, beverages, and different food types (Larsson et al., 2014; Boberg et al., 2010). The wide popularity of parabens’ usage as preservatives has been referred to many of their intrinsic properties, e.g. broad spectrum of antimicrobial activity, inertness, relative safety, chemical stability, good solubility, and ease of production (Błędzka et al., 2014). The endocrine disrupting potential of parabens has been widely studied (Błędzka et al., 2014; Boberg et al., 2010). Parabens have weak estrogenic activity confirmed by both in-vitro and in-vivo studies (Larsson et al., 2014; Pollock et al., 2017). They can bind to the estrogen receptors (ER) α and β with BuP being the most potent (Boberg et al., 2010). The carcinogenic activity of parabens has been postulated particularly that they could increase the proliferation of breast cancer cells in-vitro (Boberg et al., 2010). In-vivo studies have shown parabens’ ability to induce estrogen-related uterine histological changes and to cause alteration in the reproductive parameters of male rats (Boberg et al., 2010; Zhang et al., 2016; Lemini et al., 2004). Oral exposure to MeP has also shown to have estrogenic and antiandrogenic effects on the gebril prostate (Costa et al., 2017). In addition, parabens can produce indirect estrogenic effects by disrupting estrogen homeostasis (Boberg et al., 2010). This could be referred to the parabens’ inhibitory effect on the metabolizing enzymes involved in estrogen metabolism (Boberg et al., 2010). The particular relation between parabens and women health has been investigated and it was concluded that although parabens may not be the direct cause of breast cancer and endometriosis, yet they do increase the carcinogenic risk to exposed women (Jagne et al., 2016). The estrogenic activity of parabens was found to increase with an increase in the length of the alkyl chain in the paraben structure, with BuP being the most potent in this respect (JECFA, 2006). Moreover, MeP has been investigated to reduce the thyroid activity with in-vitro inhibition of the iodine function (Maqbool et al., 2016; Lemini et al., 2004; Vo and Jeung, 2009). Recently, the association between prenatal exposure to parabens and impaired fetal growth has been postulated (Ferguson et al., 2018; Philippat et al., 2014; Wu et al., 2017).
Since food intake has been considered as a cumulative daily source of parabens, different legislation agencies have put regulations for paraben contribution in foodstuffs to ensure consumers’ safety. A risk assessment of parabens has been established by the European Food Safety Authority in 2004 (EFSA, 2004) and Joint FAO/WHO Expert Committee on Food Additives in 2006 (JECFA, 2006). It was concluded that an acceptable daily intake (ADI) of 10 mg/kg body weight (bw)/day could be considered safe for MeP and EtP levels, but no safety evaluations have been determined for other parabens (EFSA, 2004; JECFA, 2006). Also, the European Union (EFSA, 2004), as well as the Codex Committee on Food Additives (CCFA) (CCFA, 1995) specified the Maximum Permitted Level of parabens in certain food types. In China, none of the parabens is allowed to be added to certain food types (e.g. jam, sausage, baby food), as regulated by the Ministry of Health of the People's Republic of China (2011). Also, in Denmark, it is prohibited to use either PrP or BuP in children’s products (SCCS, 2011).
Thus, the determination of parabens in foodstuffs is very essential to ensure good consumers’ health. Different analytical methods have been applied for the determination of parabens in different beverages and food samples. They include HPLC-UV (Saad et al., 2005; Yang et al., 2014; Hou et al., 2014), HPLC-MS/MS (Liao et al., 2013; Cao et al., 2013; Yin et al., 2018; Molognoni et al., 2018; Marta-Sanchez et al., 2018, Song et al., 2017), UPLC-electrochemical detector (UPLC-ECD) (Chuto et al., 2013), GC with flame ionization detector (GC-FID) and positive chemical ionization with mass spectrometric detector (GC-PCI-MS) (Jain et al., 2013), flow-injection analysis with chemiluminescence detection (Myint et al., 2004), and CE (Alshana et al., 2015; Bottoli et al., 2011). However, some of these methods require tedious sample-preparation technique (Yang et al., 2014; Hou et al., 2014; Liao et al., 2013; Cao et al., 2013; Yin et al., 2018; Marta-Sanchez et al., 2018; Jain et al., 2013; Myint et al., 2004; Alshana et al., 2015). Moreover, the use of mass detectors requires particular operators’ skills, in addition to the relative high cost of the LC-MS system (Liao et al., 2013; Cao et al., 2013; Yin et al., 2018; Molognoni et al., 2018; Marta-Sanchez et al., 2018), compared with HPLC-UV.
Review of the literature reveals-to the best of our knowledge- the lack of any study dealing with screening of paraben existence in food samples available in the Saudi market, or even in any country of the Arab world. Thus, this work aims at development and validation of a simple and reliable HPLC method with photodiode array detector (HPLC-PDA) for the simultaneous determination of five parabens (MeP, EtP, PrP, isoBuP, and BuP) in different categories of Ready-to-eat (RTE) foodstuffs collected from the Saudi Market. The proposed method has the advantages of simple sample preparation technique, simply extracting parabens from different food matrices using methanol, and the high specificity of using PDA for parabens’ detection. The paraben content was finally related to the food category and to the packaging material. The estimated daily intake (EDI) of parabens among Saudi populations was also calculated.
2 Experimental
2.1 Chemicals and reagents
Reference standards of MeP, EtP, PrP, and BuP were purchased from LOBA Chemie (Mumbai, India), while IsoBuP was obtained from (Sichuan Benepure Pharmaceutical Co. Ltd, Sichuan Prov., China). The IS, esomeprazole (ESM), was supplied by (Themis Laboratories Pvt. Ltd., Thane). HPLC grade solvents namely, methanol (Chromasolv, Sigma-Aldrich) and acetonitrile (Panreac, E.U.) were used. All other chemicals were of analytical grade namely, sodium dihydrogen phosphate, ortho-phosphoric acid (Avonchem, UK), and sodium hydroxide (DBH Laboratory Supplies, England). Deionized water was obtained using Millipore membrane filters (0.2 µm) (Nihon, Millipore (Yonnezawa, Japan)).
2.2 Instrumentation and chromatographic conditions
The HPLC system (Waters, USA) comprised of Waters 1525 binary HPLC pump, Waters 2707 autosampler, and Waters 2998 photodiode array detector (PDA).
Chromatographic separation was performed on Symmetry C 18 column, 3.5 µm (4.6 × 75 mm) (Waters, USA), using a flow rate of 1 mL/min. Isocratic elution of the studied parabens was carried out using a mobile phase consisting of a mixture of methanol/water in the ratio of 57:43, v/v. Detection was performed using a wavelength of 256 nm. The injection volume of 10 µL was used. The mobile phase was filtered using a Millipore vacuum filtration system supplied with 0.45 µm membrane filters and then degassed by sonication. System control and data acquisition was performed using Breeze™ 2 software (Waters, USA).
2.3 Preparation of stock and standard solutions
Stock solutions of 1 mg/mL of each of the studied parabens (MeP, EtP, PrP, BuP, isoBuP) and IS (ESM) were separately prepared in methanol. Further dilutions of these stock solutions were carried out with methanol to prepared diluted stock solutions of 100 and 10 µg/mL of each paraben. All solutions were kept refrigerated at -4°C for almost 1 month.
2.4 Preparation of matrix-based calibration standards
A series of calibration standards were prepared by spiking separate 2 g of paraben-free food samples with standard solutions of the five parabens to yield final paraben concentrations of 0.025–500 µg/g for MeP, EtP, 0.05–500 µg/g for PrP, and 0.125–500 µg/g for IsoBuP and BuP, along with 25 µL of IS (1000 µg/mL). Spiked samples were then treated as mentioned later under “sample preparation”.
2.5 Analysis of parabens in foodstuffs
2.5.1 Sample collection
This study focuses on screening RTE food stuffs for the presence of parabens. Different RTE food stuffs were collected from the local market in Riyadh, Saudi Arabia, during the period (February-April) of 2018. The samples were purchased from large retail stores and small supermarkets and were selected to cover different available brands including, national brands (made in Saudi Arabia), store brands (specific to the particular store), and international brands (imported items). Different attempts were made to make a reasonable classification of the selected items. Finally, RTE foodstuffs (n = 215) were classified into 11 categories based on the Chinese study (Liao et al., 2013). These categories include, cereals (n = 21), meat products (n = 7), fish (n = 4), dairy products (n = 42), bean products (n = 9), fruits (n = 20), vegetables (n = 10), cookies and snacks (n = 41), beverages (n = 18), condiments (n = 16), and others (n = 27). Details of the different samples belonging to the selected food categories are provided in Table 1. All samples were stored in the refrigerator at -4°C till the day of analysis. a, b: number of food samples in different food items and packaging materials, respectively.
Category
Food items (a)
Packaging materials (b)
Cereals (n = 21)
Bread (4), noodle (3), croissant (5),whole grain (1), oat (1), corn flakes (3), baby cereals (2), rusk (1), baked wheat (1)
Canned (2), plastic (15), cartoon (4)
Meat (n = 7)
Beef (3), chicken (1), Turkey (1), sausages (2)
Canned (1), others (1), plastic (5)
Fish (n = 4)
Tuna (3), sardine (1)
Canned (4)
Dairy products (n = 42)
Milk (4), lactobacillus beverage (4), infant formula (5), yogurt (10), cheese (12), evaporated milk (4), cream (1), butter (1), powdered milk (1)
Canned (12), plastic (20), glass (3), cartoon (5), others (2)
Bean products (n = 9)
Red beans (1), green beans (1), lupines (1), chickpeas (3), white beans (2), fava beans (1)
Canned (6), glass (2), plastic (1)
Fruits (n = 20)
Pineapple (2), peach (1), dried banana (1), almond (1), salted peanuts (1), salted cashews (1), mixed fruits (2), mixed nuts (1), apples (2), blackberries (1), kiwi (1), guava (1), dried peach (1), baby formula (1), dates (3)
Canned (3), plastic (17)
Vegetables (n = 10)
Mushroom (1), corn (1), bell pepper (1), red cabbage (1), zucchini (1), carrot (1), tomato (1), cucumber (1), lettuce (1), broccoli (1)
Canned (2), plastic (8)
Cookies and snacks (n = 41)
Bars (2), chocolate (12), biscuit (10), potato chip (11), waffles (1), cookies (1), cake (4)
Canned (2), paper (2), plastic (36), glass (1)
Beverages (n = 18)
Juice (13), coffee drink (1), soft drink (1), iced tea (1), energy drink (1), non-alcoholic drink (1), condensed drinks (1)
Canned (3), glass (4), Cartoon (9), plastic (2)
Condiments (n = 16)
Salad dressing (2), BBQ sauce (2), soya sauce (1), hot sauce (2), Mayonnaise (1), ketchup (1), Jalapeno cheese sauce (1), tomato paste (2), syrup (4)
Glass (4), plastic (11), cartoon (1)
Others (n = 27)
Jelly (2), honey (1), milk tea powder (1), tea (5), ice cream (6), jam (2), olives (1), soup powder (2), chicken stock cubes (2), coffee (2), stuffed leaves (1), peanut butter (1), candy (1)
Plastic (11), others (4), paper (5), canned (2), glass (5)
2.5.2 Sample preparation
Regarding sample preparation, RTE food samples were categorized into either solid or liquid samples. Solid food samples were initially ground and homogenized using a food processor (Braun Food Processor, China). Accurate amounts (2.0 ± 0.1 g) of all samples were transferred into screw-capped test tubes and then separately spiked with 25 µL of IS (1000 µg/mL). Samples were extracted with methanol (2 × 5 mL). Following the addition of methanol (5 mL), the samples were sonicated for 30 min, and then centrifuged. The clear supernatants were separately transferred into clean test tubes. The residues were further extracted by additional 5 mL methanol. The combined extracts were filtered by passing through 0.45 µm membrane filters before being injected into the HPLC systems.
3 Results and discussion
3.1 Optimization of chromatographic conditions
The optimum goal of chromatographic analysis is to get sharp, symmetric, and well-resolved peaks. The peaks should also be eluted within reasonable runtime. For this purpose, different chromatographic parameters were optimized. The most important parameter which plays a significant role in the chromatographic separation is the mobile phase composition. All separations were carried out on a C 18 column (4.6 × 75 mm, 3.5 µm i.d.), being the most common stationary phase available in almost all laboratories. Standard paraben solutions were chromatographed using mixtures of methanol/phosphate buffer of different pH values, as the mobile phase. Initially, the percentage of methanol in the mobile phase was investigated in the ratio of 50–80%, along with phosphate buffer pH 5.0 as the mobile phase. As expected for RP-HPLC, increasing the organic modifier content in the mobile phase resulted in decreased retention. With regards to resolution, peak shape, and analysis time, 57% methanol in the mobile phase was found optimum. Higher methanol content (>57%) caused improper baseline separation between MeP and EtP peaks (methanol content ≥70%), isoBuP and BuP peaks (methanol content >57%). However, methanol content <57% resulted in increased retention time for MeP, EtP, and PrP, with no improvement in the resolution between the two compounds, isoBuP and BuP. Secondly, isocratic elution of the tested parabens was performed using a mixture of methanol/phosphate buffer (pH range 3–7). It was practically revealed that the pH of the phosphate buffer had no significant effect on the retention time, peak shape, and the response of any of the tested parabens. The effect of phosphate buffer strength (10–40 mM) on the chromatographic behavior was also tested where no significant effect was observed. Since pH of the phosphate buffer did not cause any effect on the chromatographic behavior of the tested parabens, it was practically easier to use simply water as the aqueous phase. Thus the mobile phase was composed of 57% aqueous methanol. Fig. 1 shows the effect of mobile phase composition on the chromatographic behavior of the studied parabens.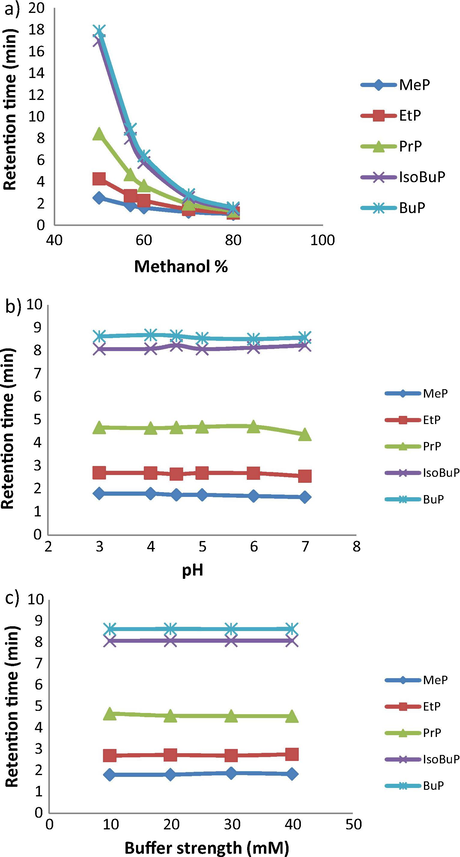
The effect of mobile phase composition on the chromatographic behavior of the studied parabens, (a) effect of methanol % in the mobile phase, (b) pH of phosphate buffer, and (c) effect of buffer strength.
3.2 Selection of the internal standard (IS)
The use of IS method is generally recommended for the analysis of complex samples where the use of peak area ratio of the analyte to that of IS is more realistic in overcoming the experimental errors, compared with the external standard method. Since the IS should not be expected to be present in the analyzed samples, paraben derivatives could not be used. Different chemical compounds were tested for their ability to be used as an IS for the analysis of parabens in food samples. Experimental trials were based on selecting a compound that did not overlap with any of the tested parabens, produced comparable response, and eluted within the chromatographic runtime. Under the optimized chromatographic conditions, with the exception of ESM, the other tested compounds showed insufficient retention (metformin, labetalol, metoclopramide, caffeine, paracetamol, ascorbic acid, hydrochlorothiazide, ornithine), peak broadening (losartan, cinacalcet, ketoprofen, dexamethasone, losartan), or overlapping with MeP peak (dimethoxyanthracene, fexofenadine, lamotrigine). According, final analysis was performed isocratically using a mobile phase of methanol: water (57: 43, v/v) at a flow rate of 1 mL/min and using 256 nm as the wavelength of detection. The proposed method achieved proper resolution of the analytes, along with the IS, without the need to apply gradient elution that is practically more troublesome compared with the isocratic elution. Under the applied chromatographic conditions, ESM was eluted as sharp symmetric, well-resolved from the eluted parabens, with good response and within suitable retention time. Under these optimized conditions, MeP was eluted at (1.81 ± 0.04 min), EtP at (2.71 ± 0.06) min, ESM at (3.15 ± 0.13) min, PrP at (4.68 ± 0.06) min, isoBuP at (8.09 ± 0.25) min, and BuP at (8.64 ± 0.45) min, for a total runtime of 10 min. Fig. 2 shows the typical HPLC chromatogram of a standard mixture of the studied parabens, along with their absorption spectra as measured by PDA. It is clear that all of the five parabens show identical UV absorbance spectral characteristics (λmax around 256 nm). Thus their chromatographic resolution is a mandatory step prior to actual analysis, even in the presence of PDA selective detector.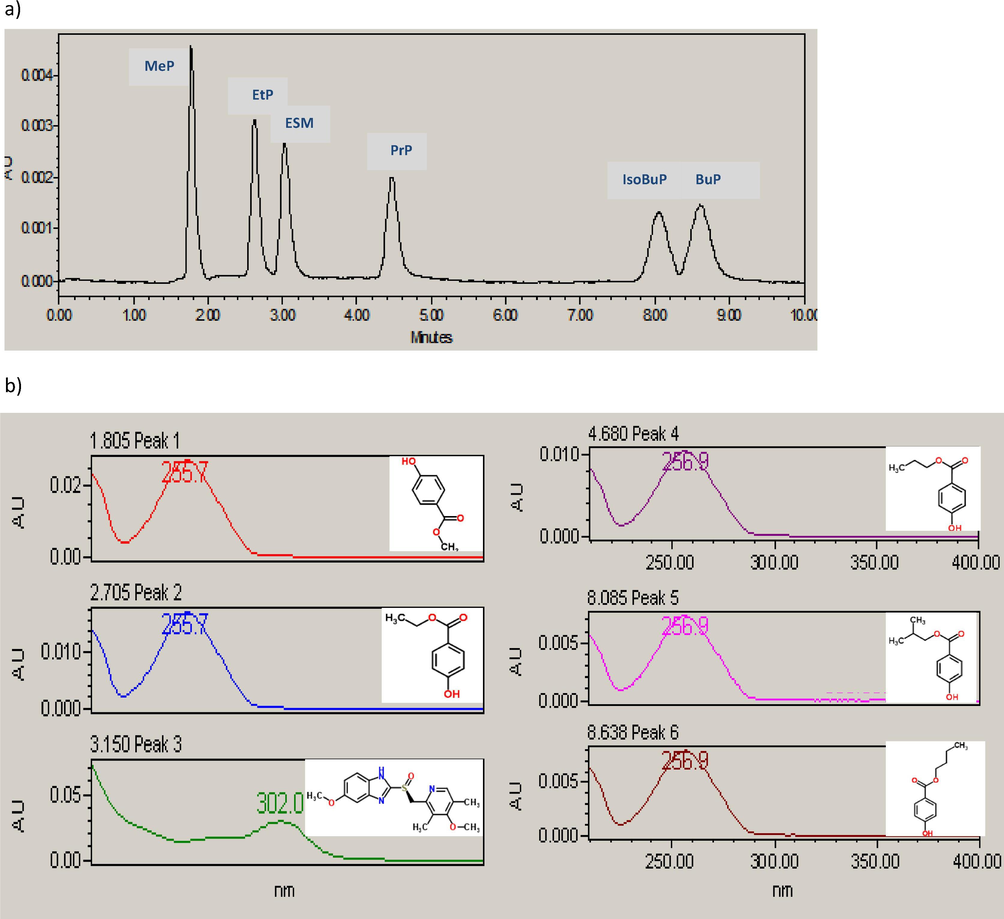
A typical HPLC chromatogram of a standard mixture of 0.5 µg/mL of each of the studied parabens: peak 1: methyl paraben (MeP), peak 2: ethyl paraben (EtP), peak 4: propyl paraben (PrP), peak 5: isobutyl paraben (isoBuP), and peak 6: butyl paraben (BuP), along with peak 3: esomeprazole (ESM) internal standard (IS), 2.5 µg/mL, under the optimized chromatographic conditions, (a), and the corresponding absorption spectra of the studied parabens, (b).
3.3 Sample preparation
For the determination of parabens in different types of food matrices, it was essential to ensure adequate extraction of parabens, as well as elimination of endogenous interfering compounds that may hinder actual analysis. In this work, simply 100% methanol was used for both clean-up and parabens’ extraction. The extraction efficiency of methanol was investigated by calculating the % recovery from different paraben-free food matrices fortified with different concentrations of standard parabens (0.2, 20, 400 µg/g). For all parabens, error values of no more than 11% ensure the efficiency of methanol as the extracting solvents. This simple extraction method with organic solvents was previously used in previous reports for the determination of preservatives in foodstuffs (Saad et al., 2005; Molognoni et al., 2018).
3.4 Method validation
3.4.1 Linearity, limits of detection (LOD) and of quantitation (LOQ)
Seven-point matrix-based calibration graphs were constructed for each paraben using the IS method. Paraben-free food samples selected from each of the 11 food categories were spiked with different concentrations of the tested parabens. The peak area ratios of each paraben to that of the ESM (IS) were related to the corresponding paraben concentration using the method of least squares. Linear relationships were obtained in the range 0.025–500 µg/g for MeP, EtP, 0.05–500 µg/g for PrP, and 0.125–500 µg/g for IsoBuP and BuP. Table 2 shows the regression characteristics calculated for each paraben. High values of correlation coefficients (r not less than 0.99) indicate high degree of linearity.
Matrix
Paraben
Regression equation
Linearity range (µg/g)
r
LOD
LOQ
Cereals
MeP
y = −0.0166 + 0.2394x
0.025–500
0.9975
0.005
0.025
EtP
y = 0.0446 + 0.1570x
0.025–500
0.9999
0.005
0.025
PrP
y = 0.0136 + 0.1498x
0.05–500
0.9999
0.020
0.05
isoBuP
y = −0.0330 + 0.1610x
0.125–500
0.9995
0.05
0.125
BuP
y = −0.0053 + 0.1244x
0.125–500
0.9999
0.05
0.125
Meat, Fish
MeP
y = −0.0046 + 0.0862x
0.025–500
0.9972
0.005
0.025
EtP
y = −0.0084 + 0.1501x
0.025–500
0.9988
0.005
0.025
PrP
y = −0.0056 + 0.1442x
0.05–500
0.9978
0.020
0.05
isoBuP
y = −0.0315 + 0.1567x
0.125–500
0.9998
0.05
0.125
BuP
y = −0.0046 + 0.0862
0.125–500
0.9998
0.05
0.125
Dairy products
MeP
y = 0.0061 + 0.3691x
0.025–500
0.9995
0.005
0.025
EtP
y = −0.0289 + 0.3447x
0.025–500
0.9999
0.005
0.025
PrP
y = 0.0033 + 0.3321x
0.05–500
0.9988
0.020
0.05
isoBuP
y = −0.0406 + 0.3136x
0.125–500
0.9997
0.05
0.125
BuP
y = 0.0328 + 0.2147x
0.125–500
0.9965
0.05
0.125
Bean products
MeP
y = −0.0346 + 0.1684x
0.025–500
0.9994
0.005
0.025
EtP
y = 0.0389 + 0.2194x
0.025–500
0.9999
0.005
0.025
PrP
y = −0.1579 + 0.6456x
0.05–500
0.9910
0.020
0.05
isoBuP
y = 0.1375 + 0.3086x
0.125–500
0.9996
0.05
0.125
BuP
y = 0.1044 + 0.6603x
0.125–500
0.9993
0.05
0.125
Fruits
MeP
y = −0.0442 + 0.2194x
0.025–500
0.9996
0.005
0.025
EtP
y = −0.0111 + 0.1684x
0.025–500
0.9999
0.005
0.025
PrP
y = −0.011 + 0.1739x
0.05–500
0.9986
0.020
0.05
isoBuP
y = −0.0048 + 0.1325x
0.125–500
0.9965
0.05
0.125
BuP
y = −0.2048 + 0.5617x
0.125–500
0.9978
0.05
0.125
Vegetables
MeP
y = −0.0049 + 0.0817x
0.025–500
0.9996
0.005
0.025
EtP
y = −0.0049 + 0.0778x
0.025–500
0.9992
0.005
0.025
PrP
y = 0.0063 + 0.0798x
0.05–500
0.9980
0.020
0.05
isoBuP
y = 0.0085 + 0.0520x
0.125–500
0.9967
0.05
0.125
BuP
y = −0.0108 + 0.0868x
0.125–500
0.9986
0.05
0.125
Cookies
MeP
y = −0.1137 + 0.4220x
0.025–500
0.9964
0.005
0.025
EtP
y = −0.0103 + 0.2276x
0.025–500
0.9990
0.005
0.025
PrP
y = −0.0072 + 0.2240x
0.05–500
0.9999
0.020
0.05
isoBuP
y = 0.0074 + 0.1733x
0.125–500
0.9982
0.05
0.125
BuP
y = 0.0271 + 0.1384x
0.125–500
0.9998
0.05
0.125
Beverages
MeP
y = 0.0048 + 0.0604x
0.025–500
0.9967
0.005
0.025
EtP
y = 0.0056 + 0.1146x
0.025–500
0.9995
0.005
0.025
PrP
y = 0.0027 + 0.1179x
0.05–500
0.9995
0.020
0.05
isoBuP
y = −0.0054 + 0.0796x
0.125–500
0.9976
0.05
0.125
BuP
y = −0.0016 + 0.0289x
0.125–500
0.9999
0.05
0.125
Condiments
MeP
y = 0.0780 + 0.7516x
0.025–500
0.9948
0.005
0.025
EtP
y = −0.1134 + 0.6813x
0.025–500
0.9997
0.005
0.025
PrP
y = 0.0379 + 0.5229x
0.05–500
0.9941
0.020
0.05
isoBuP
y = −0.083 + 0.2707x
0.125–500
0.9927
0.05
0.125
BuP
y = −0.0457 + 0.1062x
0.125–500
0.9954
0.05
0.125
Others
MeP
y = 0.0139 + 0.0522x
0.025–500
0.9974
0.005
0.025
EtP
y = 0.0139 + 0.1079x
0.025–500
0.9998
0.005
0.025
PrP
y = 0.0032 + 0.1077x
0.05–500
0.9984
0.020
0.05
isoBuP
y = 0.0064 + 0.0478x
0.125–500
0.9980
0.05
0.125
BuP
y = −0.0211 + 0.1755x
0.125–500
0.9917
0.05
0.125
Values of LOD and LOQ were selected based on S/N ratio of 3 and 10, respectively. For each of the studied parabens, the lower limit of the linearity range was taken as LOQ. Values of LOQ ranged from 0.025 to 0.125 µg/g while those of LOD ranged from 0.005 to 0.02 µg/g. The obtained values of LOQ were low enough to determine any trace levels of parabens in food. Compared with the HPLC-UV methods which were previously reported for the analysis of parabens in food stuffs (Saad et al., 2005; Yang et al., 2014; Hou et al., 2014), the proposed method yielded lower LOQ and LOD values for the determined parabens. Thus, allowing the trace analysis of parabens in foodstuffs.
3.4.2 Extraction recovery
Extraction recovery was assessed using selected types of food samples with ND, not detected, paraben levels, being used as a blank, fortified with the five parabens at three different concentration levels (low 0.2 µg/g, medium 20 µg/g, high 400 µg/g). The response obtained following extraction was compared with those of standard solutions having the same nominal concentrations. The obtained recoveries ranged from 89.21 to 99.51% indicating high efficiency of the extraction procedure for paraben determination from food samples.
3.4.3 Accuracy and precision
Method accuracy and precision was evaluated at two levels, intra-day by repeating the analysis three times on the same day (n = 3) and inter-day by performing the analysis on three consecutive days (n = 9). This was performed by analyzing food samples fortified with the five parabens at the three concentration levels as those used for assessing the extraction recovery. The found concentrations were calculated with reference to matrix-based calibration. For all parabens, recovery values ranging from 90.25 to 108.04% indicate high degree of method accuracy, while RSD% values of 1.09–8.57% indicate high degree of method precision (Table 3).
Food category
Mean % recovery (RSD)a
Intra-day level (n = 3)
Inter-day level (n = 9)
MeP
EtP
PrP
IsoBuP
BuP
MeP
EtP
PrP
IsoBuP
BuP
Cereals
101.25
(2.22)102.22
(4.58)101.58
(6.21)92.58
(1.87)92.25
(2.25)103.38
(8.25)104.90
(6.27)102.28
(3.08)98.21
(2.55)103.68
(4.22)
Meat
107.65
(7.08)101.16
(3.25)103.50
(4.09)90.96
(5.55)95.08
(1.99)108.22
(1.55)91.25
(7.22)106.22
(4.35)94.22
(2.05)101.22
(3.33)
Fish
108.04
(8.01)104.44
(4.25)105.52
(3.25)101.25
(6.02)92.55
(3.85)104.98
(2.88)92.88
(6.02)108.00
(3.88)93.88
(5.24)105.55
(4.52)
Dairy products
101.61
(6.21)98.02
(1.32)104.23
(4.02)103.72
(2.52)102.14
(5.02)98.02
(7.87)104.23
(8.22)103.72
(3.92)102.14
(8.02)91.00
(5.88)
Bean products
90.12
(2.20)91.12
(1.58)90.10
(3.25)97.73
(1.99)92.39
(4.25)89.59
(5.22)92.02
(3.58)90.82
(3.89)94.88
(7.25)93.22
(9.00)
Fruits
99.58
(5.02)102.25
(2.33)103.88
(6.02)105.89
(4.22)104.58
(3.88)102.25
(5.88)103.88
(5.66)105.89
(6.88)104.58
(7.99)94.02
(4.55)
Vegetables
102.77 (2.25)
102.16
(3.01)106.81
(1.89)94.55
(1.25)91.28
(2.22)102.94
(3.55)107.43
(4.02)107.25
(3.05)101.58
(3.55)92.88
(5.88)
Cookies, snacks
92.87 (1.55)
91.88
(2.88)92.02
(3.05)93.58
(2.88)95.87
(5.02)92.00
(4.55)94.25
(3.33)91.22
(4.22)91.88
(6.58)96.25
(8.01)
Beverages
98.17
(3.88)94.02
(1.58)93.52
(2.55)102.55
(1.98)104.25
(6.88)99.50
(3.89)92.5
(1.25)90.88
(3.25)101.55
(7.25)107.58
(8.57)
Condiments
94.25
(5.02)92.22
(2.25)91.54
(3.02)99.25
(5.02)91.54
(1.55)92.55
(6.22)90.90
(5.84)101.25
(4.02)96.22
(5.82)91.00
(7.02)
Others
90.25
(1.58)96.25
(1.99)98.55
(2.25)95.28
(2.97)93.58
(1.09)91.89
(2.88)98.58
(4.05)97.52
(3.55)94.77
(4.28)95.55
(4.88)
3.4.4 Solution stability
Standard paraben solutions remained stable when kept in the refrigerator at −4 °C for 30 days.
3.5 Analysis of parabens in food samples
The applicability of the method was extended to the analysis of parabens in foodstuffs collected from the Saudi market in Riyadh. Food samples (n = 215) were selected to cover the most common food categories (11 food categories). Following sample preparation, each sample was injected in triplicates into the HPLC system using the optimized chromatographic conditions. The identification of each paraben depends on comparing both the retention time and the absorption spectra, obtained using the PDA. Also, spiking with the suspected paraben was essential in some situations. The calculated purity index within the threshold limits indicated the peak purity. Five parabens were examined in the analyzed samples. Summary of the paraben content in the different food categories was given in Table 4. Typical HPLC chromatograms of selected samples of each food category were given in Fig. 3. Paraben profiles were related to food categories as shown in Fig. 4a.
Average content (µg/g)
MeP
EtP
PrP
IsoBuP
BuP
Total
Cereals
75.77
0.13
0.01
19.40
0.57
95.88
Meat
28.95
0.55
0.01
0.71
ND
30.22
Fish
0.51
ND
ND
0.01
0.02
0.53
Dairy products
26.28
13.16
ND
0.01
ND
39.45
Bean products
0.00
0.98
ND
0.13
0.06
1.17
Fruits
0.15
0.96
0.96
0.01
ND
2.08
Vegetables
0.05
0.07
0.02
0.01
ND
0.15
Cookies, snacks
0.17
0.28
0.01
0.41
ND
0.87
Beverages
23.60
0.26
ND
0.02
ND
23.88
Condiments
495.70
0.69
0.01
0.16
0.11
496.67
Others
13.99
3.35
0.12
1.92
19.46
38.84

Typical HPLC chromatograms of selected samples of each food category showing the paraben analyzed in each sample.
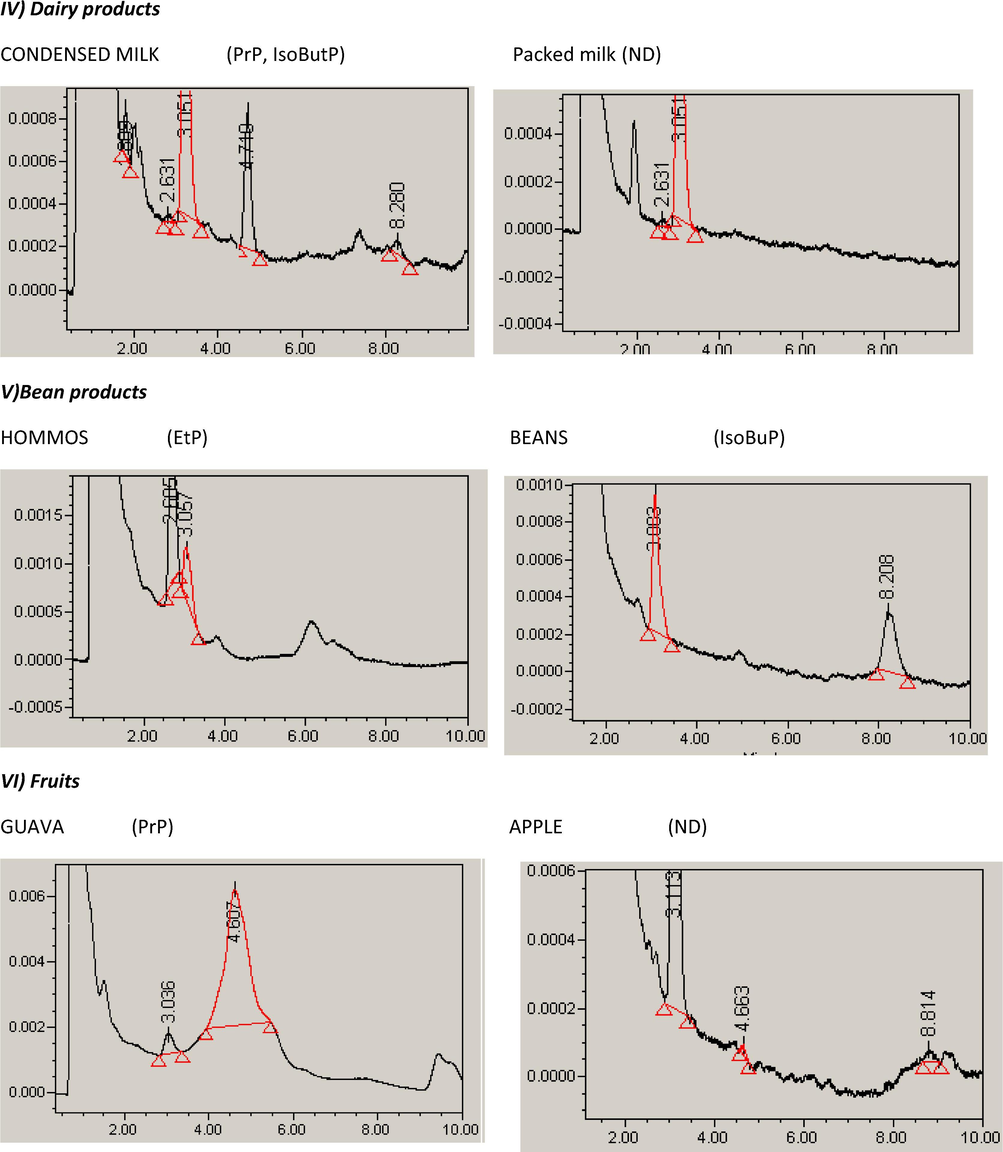
Typical HPLC chromatograms of selected samples of each food category showing the paraben analyzed in each sample.
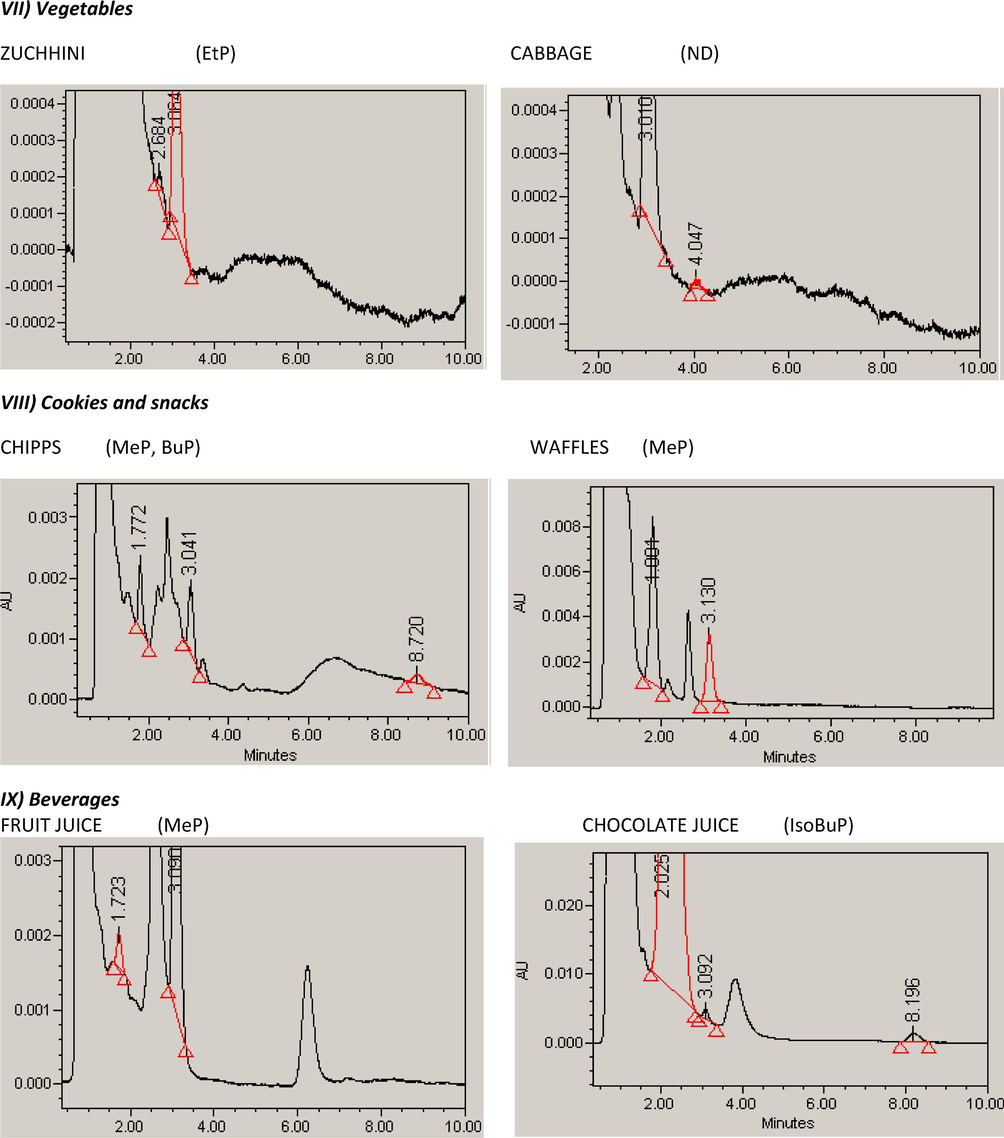
Typical HPLC chromatograms of selected samples of each food category showing the paraben analyzed in each sample.
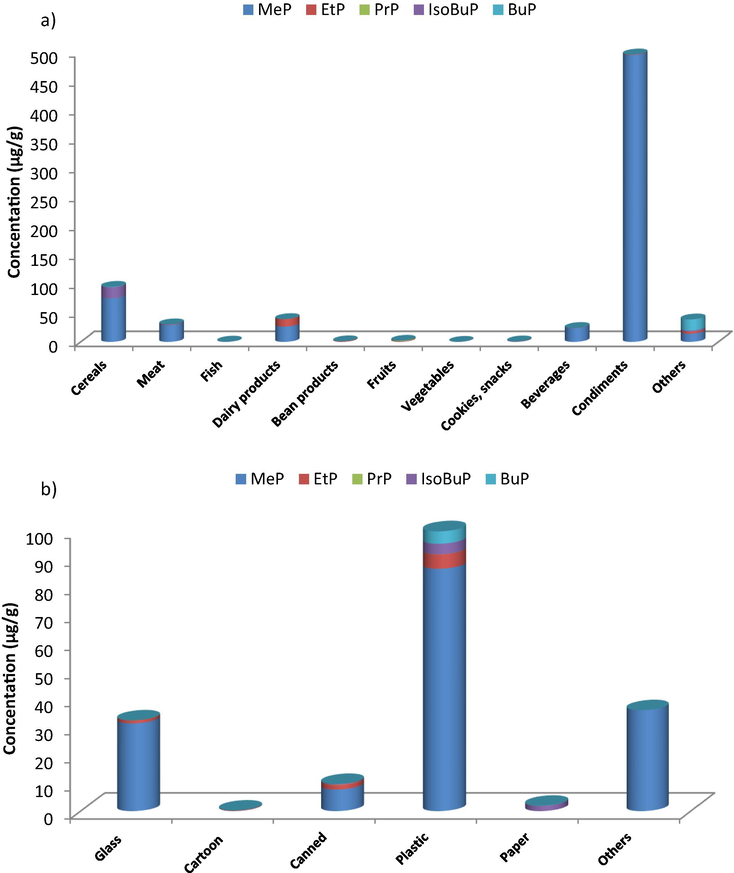
Composition profiles of parabens in foodstuffs as related to different food categories, (a), and different packaging material, (b).
Analysis of food samples revealed that almost all investigated samples contain parabens with varying concentration (0–1113 µg/g for the total paraben content, being the most abundant in condiments. Significant difference between the paraben content among different food categories were verified by the ANOVA testing at p = 0.05 (Table 5). Since the calculated F-values exceeded the critical value, a significant difference of the total paraben content among different food categories was recoded. It was also clear from Table 6 that in all food categories, MeP was the most predominant among all parabens (22%, ranging from 0 to 496 µg/g), followed by EtP (15%, ranging from 0 to 13 µg/g). Although banned, some samples still have preservatives of higher M.wt. (e.g. PrP, 8%, ranging from 0 to 0.20 µg/g, isoBuP, 24%, ranging from 0.005 to 19 µg/g, and BuP 7%, ranging from 0 to 20 µg/g). PrP was found in beverages (6%, n = 1 out of 18), meat (28.6%, n = 2 out of 7), cookies and snacks (9.8%, n = 4 out of 41), condiments (12.5%, n = 2 out of 16), dairy products (9.5%, n = 4 out of 42), fruits (15%, n = 3 out of 20), vegetables (30%, n = 3 out of 10), cereals (14.3%, n = 3 out of 21), and others (7.4%, n = 2 out of 27). IsoBuP was found in beverages (16.7%, n = 3 out of 18), meat (28.6%, n = 2 out of 7), cookies and snacks (26.8%, n = 11 put of 41), condiments (31.3%, n = 5 out of 16), dairy products (26.2%, n = 11 out of 42), fruits (10%, n = 2 out of 20), vegetables (30%, n = 3 out of 10), beans (22.2%, n = 2 out of 9), cereals (28.6%, n = 6 out of 21), and others (22.2%, n = 6 out of 27). BuP was found in beverages (22.2%, n = 4 out of 18), beans (11.1%, n = 1 out of 9), cereals (28.6%, n = 6 out of 21), and others (11.1%, n = 3 out of 27). ND: Not detected.
Anova: Single Factor
SUMMARY
Groups
Count
Sum
Average
Variance
Cereals
21
2013.597
95.8855481
34495.6838
Meat
7
211.5098
30.21568
5469.9415
Fish
4
2.125649
0.53141225
0.98798575
Dairy products
42
1656.997
39.45230929
10909.8046
Bean products
9
10.49195
1.165772222
1.99667021
Fruits
20
41.55729
2.07786425
29.6584132
Vegetables
10
1.445989
0.1445989
0.04706993
Cookies&snacks
41
35.68831
0.870446512
5.45404517
Beverages
18
429.739
23.87438778
9889.51002
Condiments
16
7946.865
496.6790506
903015.305
Others
27
1048.67
38.83961481
14491.2572
ANOVA
Source of Variation
SS
df
MS
F
P-value
F crit
Between Groups
3,428,001
10
342800.1021
4.58236045
7.1081E−06
1.87734106
Within Groups
15,260,960
204
74808.62879
Total
18,688,961
214
Parabens
% Relative occurrence
Range (µg/g)
MeP
22%
0–496
EtP
15%
0–13
PrP
11%
0–20
IsoBuP
24%
0.005–19
BuP
7%
0–20
Analysis summary of parabens in regulated foodstaffs based on CODEX STAN 192-1995 was given in Table 7. Regarding MeP and EtP content, many types of the analyzed samples were found within the acceptable limits, e.g. semi-preserved fish, chocolate-based products, dried fruits, nuts, vegetables, fat spreads, coffee and tea products. While some of the analyzed sausages, processed cheese, dairy-based desserts, jams, and jellies exceeded the permitted levels.
Food type
Found range (µg/g)
Maximum allowed level (µg/g)
Notes
Edible casings (sausages)
0.07–197.88
36
One out of six samples (16.7%) exceeds the limits
Semi-preserved fish
0–2.02
1000
None of the four samples exceeds the limits
Chocolate products
0–10.65
300
None of the fourteen samples exceeds the limits
Processed cheese
0–368.88
300
One out of thirteen samples (7.7%) exceeds the limits
Dairy-based desserts
0–132.62
120
One out of nine samples (11.11%) exceeds the limits
Dried fruits
0–0.11
800
None of the three samples exceeds the limits
Nuts
0–19.19
1000
None of the four samples exceeds the limits
Vegetables (mushrooms, roots, tubers, …)
0–0.62
1000
None of the nine samples exceeds the limits
Fat spreads and emulsions
0–37.18
300
None of the five samples exceeds the limits
Jams, jellies
0–370.99
250
One out of four samples (25%) exceeds the limits
Coffee and tea products
0–0.45
450
None of the four samples exceeds the limits
Based on EFSA, MeP and EtP are permitted as preservatives in certain types of processed foods. Some regulated samples were found within the permitted level in this particular food type, e.g. candies, 0.87 µg/g < 0.3 g/kg, jelly-coated patisserie such as paté, 144 µg/g < 1 g/kg, and beverages, 23.84 µg/g, <2 g/kg).
Table 8 shows a summary of the paraben content with regards to the packaging material. Although it was apparent from Fig. 4b that plastic exhibited the most contribution to paraben content in all samples, yet ANOVA testing showed that the relation between the packing materials and the found parabens was insignificant at 95% confidence level since the calculated F value was less than F critical as shown in Table 9. ND: Not detected.
Average content (µg/g)
MeP
EtP
PrP
IsoBuP
BuP
Total
Glass
29.72
0.91
0.01
0.03
ND
30.67
Cartoon
0.05
0.18
0.01
ND
ND
0.25
Canned
7.76
1.55
0.07
0.30
ND
9.68
Plastic
84.25
5.00
0.03
3.69
4.32
97.29
Paper
ND
ND
ND
1.90
0.06
1.96
Others
36.02
ND
ND
ND
ND
36.02
Anova: Single Factor
SUMMARY
Groups
Count
Sum
Average
Variance
Glass
19
582.754
30.67126
8907.223
Cartoon
19
4.67323
0.245959
0.284424
Canned
38
367.862
9.680578
2262.787
Plastic
125
12161.21
97.28969
145294.6
Paper
7
13.75596
1.965137
25.0536
Others
7
252.1733
36.02476
8207.158
ANOVA
Source of Variation
SS
df
MS
F
P-value
F crit
Between Groups
380,734
5
76146.79
0.86918
0.502662
2.257274
Within Groups
18,309,987
209
87607.59
Total
18,690,721
214
Moreover, the average estimated daily intake (EDI) of parabens was calculated according to the following formula (Liao et al., 2013) where Ci is the average concentration of parabens found in each food category, DCi is the average daily consumption of each food category, and bw is the average body weight.
Based on the allowable daily food intake in the healthy diet and with reference to the diet habits among the Saudi population, the mean EDI of each paraben and the total parabens for both males and females were calculated, taking 65 kg as the average for Saudi woman and 85 kg as the average bw for adult Saudi men (Table 10). It was found that EDI had an average of 2262 and 2038 µg/kgbw/day for women and men, respectively. The highest EDI was found for MeP with an average of 1501 and 1509 µg/kgbw/day for men and women, respectively, accounting for nearly 75% of all paraben content.
Male
Female
MeP
1501.26
1599.66
EtP
155.04
168.10
PrP
2.58
3.55
IsoBuP
112.57
113.51
BuP
266.17
376.87
2037.62
2261.69
3.6 Comparison of human paraben exposure among Saudi population and worldwide
Based on the 67th meeting of the Joint FAO/WHO Expert Committee on Food Additives 2006, the EDI of parabens among the American and European consumers was ranged from 3.7 to 7.8 mg/kgbw per day and from 1.2 to 5.3 mg/kgbw per day for the American and European populations, respectively. Estimations were based on an average adult weight of 60 kg and proposing that the maximum permitted levels of parabens are used in all food types (JECFA, 2006). Another study also showed that an over-estimation of parabens’ existence at a high level in all consumed food types would result in an average intake of 466 mg paraben/day, 7.7 mg/kgbw/day, and a more realistic estimation of down to 1 mg paraben/day, 17 µg/kgbw/day (Soni et al., 2005). However, a much less estimate of the paraben content in foodstuffs was established for a Chinese study, accounting for an average of 1 µg/kgbw/day (Liao et al., 2013). Yet, our study revealed that the levels found in the Saudi market were much higher (nearly 2–2.2 mg/kgbw/day) than the previous average estimations (Soni et al., 2005; Liao et al., 2013). However, our findings for the EDI among the Saudi population are comparable to both the American and European nations (JECFA, 2006). Although, the estimated paraben levels were still within the acceptable limits of 0–10 mg/kg bw/day, one should pay attention to the major contribution of cosmetic products and pharmaceuticals to paraben exposure (Błędzka et al., 2014). Thus, all food stuffs should be checked for their paraben content in order to ensure the safety level regarding consumers’ health.
4 Conclusion
In this work, a simple, fast, and convenient HPLC-PDA method was developed and validated for the simultaneous determination of five parabens in food samples. The straight-forward sample preparation technique, just by direct extraction with methanol, impacts to the simplicity and time-saving of the clean-up procedure. Moreover, the use of HPLC-PDA is considered less expensive, simpler, and easily applicable, compared with the more sophisticated technique (eg. GC–MS, LC-MS/M).
The applicability of the proposed method has been extended to the determination of MeP, EtP, PrP, Iso BuP, and BuP in different foodstuffs (n = 215) collected from the Saudi market.
Although not exceeding the permitted level of 0–10 mg/kg per day, stated by the European Food Safety Authority EFSA for MeP and EtP, further studies should be conducted to cover more Saudi cities and also to relate the health habits of different ages and perhaps different educational levels with paraben exposure.
Conflict of interest
The authors declared that there is no conflict of interest.
Acknowledgments
The authors would like to extend their appreciation to the Deanship of Scientific Research at King Saud University for its funding of this research through the research group project no. RGPVPP-331.
References
- Determination of parabens in human milk and other food samples by capillary electrophoresis after dispersive liquid–liquid microextraction with back-extraction. Food Chem.. 2015;181:1-8.
- [Google Scholar]
- Parabens. From environmental studies to human health. Environ. Int.. 2014;67:27-42.
- [Google Scholar]
- Possible endocrine disrupting effects of parabens and their metabolites. Reprod. Toxicol.. 2010;30:301-312.
- [Google Scholar]
- Determination of parabens in sweeteners by capillary electrochromatography. Braz. J. Pharm. Sci.. 2011;47(4):779-785.
- [Google Scholar]
- Development of an HPLC–MS/MS method for the simultaneous analysis of six kinds of parabens in food. Anal. Methods.. 2013;5:1016-1023.
- [Google Scholar]
- CCFA (The Codex Committee on Food Additives and Contaminants), 1995. General standard for food additives, CODEX STAN 192–1995. https://ec.europa.eu/food/safety/international_affairs/standard_setting_bodies/codex/ccfa_en.
- A rapid separation and highly determination of paraben species by ultra-performance liquid chromatography—electrochemical detection. Detection. 2013;2013(1):21-29.
- [Google Scholar]
- Endocrine-disrupting effects of methylparaben on the adult gerbil prostate. Environ. Toxicol.. 2017;32(6):1801-1812.
- [Google Scholar]
- Paraben esters: review of recent studies of endocrine toxicity, absorption, esterase and human exposure, and discussion of potential human health risks. J. Appl. Toxicol.. 2008;28(5):561-578.
- [Google Scholar]
- EFSA (the European Food Safety Authority), September, 2004. EFSA advises on the safety of paraben usage in food. European Union. Available: https://www.efsa.europa.eu/en/press/news/040929 (accessed 15.04.18)].
- Environmental phenol associations with ultrasound and delivery measures of fetal growth. Environ. Int.. 2018;112:243-250.
- [Google Scholar]
- Determination of parabens in beverage samples by dispersive liquid–liquid microextraction based on solidification of floating organic droplet. J. Chromatogr. Sci.. 2014;52(10):1332-1338.
- [Google Scholar]
- Endocrine-disrupting chemicals: adverse effects of bisphenol a and parabens to women’s health. Water Air Soil Pollut.. 2016;227:182.
- [Google Scholar]
- Simultaneous derivatisation and preconcentration of parabens in food and other matrices by isobutyl chloroformate and dispersive liquid–liquid microextraction followed by gas chromatographic analysis. Food Chem.. 2013;141(1):436-443.
- [Google Scholar]
- JECFA (the Joint FAO/WHO Expert Committee on Food Additives), 2006. Evaluation of certain food additives and contaminants. Sixty-seventh report of the Joint FAO/WHO Expert Committee on Food Additives, WHO Technical Report Series no. 940, Rome, Italy. Available: http://www.who.int/ipcs/publications/jecfa/reports/trs940.pdf (accessed 30.04.18).
- Exposure determinants of phthalates, parabens, bisphenol A and triclosan in Swedish mothers and their children. Environ. Int.. 2014;73:323-333.
- [Google Scholar]
- Morphometric analysis of mice uteri treated with the preservatives methyl, ethyl, propyl, and butylparaben. Toxicol. Ind. Health. 2004;20(6–10):123-132.
- [Google Scholar]
- Occurrence of parabens in foodstuffs from China and its implications for human dietary exposure. Environ. Int.. 2013;57–58:68-74.
- [Google Scholar]
- Trace analysis of parabens preservatives in drinking water treatment sludge, treated, and mineral water samples. Environ. Sci. Pollut. Res. Int. 2018 Ahead of print.
- [CrossRef] [Google Scholar]
- Review of endocrine disorders associated with environmental toxicants and possible involved mechanisms. Life Sci.. 2016;145:265-273.
- [Google Scholar]
- Ministry of Health of the People's Republic of China, 2011. National Standards of the People’s Republic of China GB 2760–2011. Available: http://www.svscr.cz/wp-content/files/zivocisne-produkty/GB_2760-2011_Food-Additives.pdf (accessed 10.05.18).
- A multi-purpose tool for food inspection: Simultaneous determination of various classes of preservatives and biogenic amines in meat and fish products by LC-MS. Talanta. 2018;178:1053-1066.
- [Google Scholar]
- Flow injection-chemiluminescence determination of paraben preservative in food safety. Anal. Chim. Acta. 2004;517:119-124.
- [Google Scholar]
- Butyl paraben and propyl paraben modulate bisphenol A and estradiol concentrations in female and male mice. Toxicol. Appl. Pharmacol.. 2017;325:18-24.
- [Google Scholar]
- Simultaneous determination of preservatives (benzoic acid, sorbic acid, methylparaben and propylparaben) in foodstuffs using high-performance liquid chromatography. J. Chromatogr. A. 2005;1073:393-397.
- [Google Scholar]
- SCCS (Scientific Committee on Consumer Safety), 2011. Clarification on opinion SCCS/1348/10 in the light of the Danish clause of safeguard banning the use of parabens in cosmetic products intended for children under three years of age. European Commission, Brussels, Belgium. Available: https://ec.europa.eu/health/scientific_committees/consumer_safety/docs/sccs_o_069.pdf (accessed 10.05.18).
- Safety assessment of esters of p-hydroxybenzoic acid (parabens) Food Chem.Toxicol.. 2005;43(7):985-1015.
- [Google Scholar]
- Determination of six paraben residues in fresh-cut vegetables using QuEChERS with multi-walled carbon nanotubes and high-performance liquid chromatography–tandem mass spectrometry. Food Anal. Methods. 2017;10:3972-3979.
- [Google Scholar]
- An evaluation of estrogenic activity of parabens using uterine calbindin-D9k gene in an immature rat model. Toxicol. Sci.. 2009;112(1):68-77.
- [Google Scholar]
- Maternal urinary paraben levels and offspring size at birth from a Chinese birth cohort. Chemosphere. 2017;172:29-36.
- [Google Scholar]
- Simultaneous determination of six parabens in foods by matrix liquid-phase dispersion extraction combined with high-performance liquid chromatography. Food Anal. Methods. 2014;7(8):1693-1702.
- [Google Scholar]
- Dispersive liquid–liquid microextraction followed by magnetic solid-phase extraction for determination of four parabens in beverage samples by ultra-performance liquid chromatography tandem mass spectrometry. Food Anal. Methods. 2018;11:797-807.
- [Google Scholar]
- n-butylparaben induces male reproductive disorders via regulation of estradiol and estrogen receptors. J. Appl. Toxicol.. 2016;36:1223-1234.
- [Google Scholar]


