

Translate this page into:
Quartzite an efficient adsorbent for the removal of anionic and cationic dyes from aqueous solutions
⁎Corresponding author at: Department of Chemistry, Abdul Wali Khan University, Mardan 23200, Pakistan. shahhussain129@gmail.com (Shah Hussain)
-
Received: ,
Accepted: ,
This article was originally published by Elsevier and was migrated to Scientific Scholar after the change of Publisher.
Peer review under responsibility of King Saud University.
Abstract
Abstract
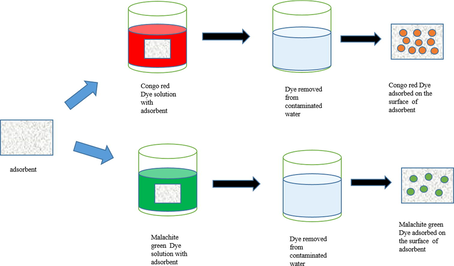
Quartzite obtained from local source was investigated for the removal of anionic dye congo red (CR) and cationic dye malachite green (MG) as an adsorbent from aqueous solution in batch experiment. The adsorption process was studied as a function of dye concentration, contact time, pH and temperature. Adsorption process was described well by Langmuir and Freundlich isotherms. The adsorption capacity remained 666.7 mg/g for CR dye and 348.125 mg/g for MG dye. Data was analyzed thermodynamically, ΔH0 and ΔG0 values proved that adsorption of CR and MG is an endothermic and spontaneous process. Adsorption data fitted best in the pseudo-first order kinetic model. The adsorption data proved that quartzite exhibits the best adsorption capacity and can be utilized for the removal of anionic and cationic dyes.
Keywords
Adsorption
Quartzite
Congo red
Malachite green

1 Introduction
Effluents having unspent dyes are released into the water bodies from industries like textile, leather, printing, plastics and food. Due to complex structures, higher stability they are a source of serious environmental concern (Zhang et al., 2014). The ever increasing demand of the textile products and the economic boom associated with it has led to the development of the textile industry (Zou et al., 2019).
Globally textile industry is one of the major polluter. About 72 toxic chemicals are released into the water supplies by textile dyeing process. The presence of even a smaller amount of the dye in water makes it esthetically displeasing (Valli Nachiyar et al., 2014). The aquatic flora and fauna are badly effected by the presence of these dyes (Liang et al., 2018) as they are responsible for obstructing the penetration of sunlight and high chemical oxygen demand(COD) (Ganesan et al., 2019). Not only to the aquatic flora and fauna but rather the entire natural ecosystem is badly affected by the persistent release of these hazardous pollutants into the environment (Khan et al., 2019). In azo dyes aromatic amines are used as intermediates they are notorious for damaging DNA and proteins (Brüschweiler and Merlot, 2017).
The removal of dyes and their products from the industrial wastewaters is a daunting challenge because of their carcinogenicity, mutagenicity and toxicity (Rocha et al., 2017, Atun et al., 2019). Various techniques have been used for the removal of the unwanted dyes from the contaminated waters such as decolorization of the industrial effluents by micro-organisms (Costa et al., 2018), electric coagulation (Núñez et al., 2019), catalytic ozonation (Ghuge and Saroha, 2018). Flocculation followed by ultrafiltration has also been used to minimize the toxic effect of the dyes in waters (Beluci et al., 2019). Cellulose ampholytes prepared from carboxymethyl cellulose have been used through flocculants for the removal of dyes(Kono and Kusumoto, 2015). Due to convenience and effectiveness adsorption technique has been found as the best one (Hassan and Carr, 2018) so far various substances have been used as adsorbents in this technique. Variety of materials have been used as adsorbents with higher uptake ability like SBA-15/ graphene oxide nanocomposites, functionalized SBA-15 (Mirabi et al., 2017c, Sadeghi et al., 2019) and ceramic membrane (Ahmad et al., 2019) for the adsorption purpose. Materials with enhanced porosity and higher surface area like multi wall carbon nanotubes (Mirabi et al., 2017a), and SBA-15/Diphenyl Carbazon/SDS Nanocomposite (Mirabi et al., 2017b) have shown excellent uptake ability. Synthesized starch coated magnetic nanoparticles and polymeric nanocomposites have been used for the removal of the unspent dyes from the industrial effluents (Stan et al., 2019) and aqueous solutions (Binaeian et al., 2018). Acid modified zeolites have also proved their worth as useful adsorbents (Adinehvand et al., 2016; Shokrolahzadeh Tehrani et al., 2017). Biosorbent materials as promising adsorbents have been used for the removal of dyes from the industrial effluents (Deniz, 2019). Polyaniline/Fe3O4 magnetic nanoparticles have also proved their worth in the removal of textile dye from industrial waste waters (Tayebi et al., 2016).
Keeping in consideration the high cost of various costly adsorbents which are used for the adsorption of the unspent textile dyes in the textile industrial effluents the objective set for this study is the development of an efficient, low cost, locally and abundantly available adsorbent for the adsorption of anionic as well as cationic textile dyes especially in the third world countries where the textile industry remains the back bone of economy and the environment is persistently polluted with the unspent dyes in the form of industrial effluents and it remains unnoticed due to high cost of remedial measures.
2 Materials and methods
2.1 Materials
Quartzite samples obtained from a selected location were thoroughly washed with distilled water and dried in an oven. Quartzite samples were crushed to powder and sieved through a 200 µm screen and dried overnight in a vacuum oven to reach a constant weight. The pore size, diameter and volume of the screened quartzite was determined by using NOVA 2200e model. Usign cubix XRF spectrometer (PW2300, Netherland) sample composition was determined. Scanning Electron Microscopy (SEM) (JSM-5910-JEOL JAPAN) was used to determine the surface morphology.
Specific surface area and porosity was determined using model NOVA 2200, crystallinity was determined by XRD diffractometer (Rigaku Japan XRD). FTIR spectra was recorded in the range 4000–400 cm−1 using model (Shimadzu IR Prestige-21). From a registered dealer procured analytical grade anionic dye Congo red (Sigma Aldrich No. S241294) and Analytical grade cationic dye Malachite green (Merck No. B581740). The concentrations of the dye solutions ranged from 6.10−4 mol.dm−3 to 10−3 mol.dm−3.
2.2 Batch adsorption study
Batch experiments were carried out for the adsorption of congo red and malachite green dyes on quartzite. 50 ml solution of each dye of 10−3 mol.dm−3 concentration was interacted with 0.2 g of adsorbent in separate stoppered flasks and were shaken in a temperature controlled digital shaking bath. Using a UV-visible spectrophotometer the residual concentration of congo red was determined at λmax = 490 nm and for malachite green at λmax = 620 nm. The amount of each dye adsorbed in mg/g in their equilibrium time was calculated by using Eq. (1) (Dali Youcef et al., 2019).
The effect of the contact time was determined by varying the time from 0 to 180 min. The equilibrium time recorded for congo red remained 60 min and for malachite green remained 90 min. The optimized pH for congo red was 4.0 and for malachite green was 6.0. pH of the solution was adjusted using HCl (0.1 mol/L) and NaOH (0.1 mol/L) solutions and monitored with pre calibrated Hanna HI-8418 model pH meter The effect of the dye concentration was studied by ranging the concentration between 6 × 10⁻⁴ mol/L to 10−3 mol/L. The effect of temperature on adsorption process was studied at 10 0C, 20 0C, 30 0C, 40 0C, 50 °C and 60 0C.
3 Results and discussion
3.1 Characterization
By means of vacuum pump the degassing of the sample was carried out specific surface area was determined by means of Brunauer-Emmett-Teller (BET) method(Fischer and Gaupp, 2004), surface analysis is given in Table 1.
Parameters
Values
Surface area
16.331 m2/g
Pore volume
0.006 cm3/g
Pore radius
14.473 A0
The surface analysis, pore size and pore diameter were determined through N2 adsorption-desorption technique. The reason for the high adsorption capacity of the quartzite is due to their large surface area 16.221 m2/g, small pore volume 0.006 cm3/g and small pore radius 14.47 0A. All these parameters signify the strongest adsorption capability of quartzite as indicate in Table 1.
The XRF studies shows that the main chemical compound in quartzite are silicon dioxide (SiO2), aluminum oxide (Al2O3), iron oxide (Fe2O3), calcium oxide (CaO), magnesium oxide (MgO), potassium oxide (K2O) in different concentrations as given in Table 2.
Composition
Percentage (%)
SiO2
36.98
Al2O3
9.72
Fe2O3
3.03
CaO
13.83
MgO
9.92
K2O
4.69
Na2O
0.14
SO3
0.01
The XRD pattern (Deng et al., 2017) has been given Fig. 1(a) from 2°–80° range of 2θ (degree) diffraction angle was used in this diffractometry. prominent peaks have been observed for quartz, carbonate and calcite.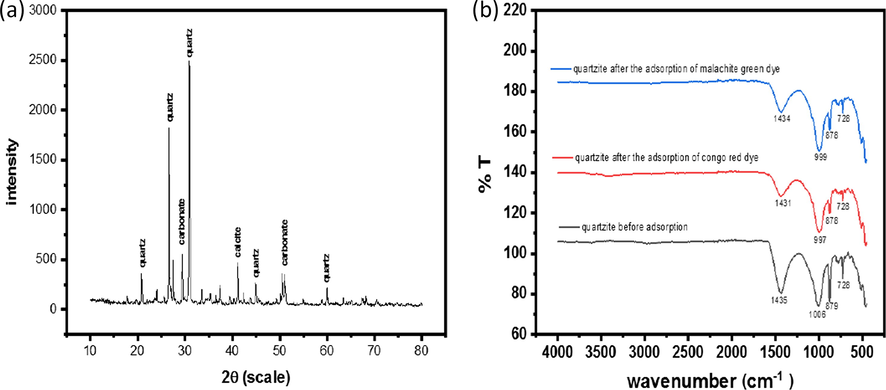
XRD pattern of quartzite (a) FTIRS of quartzite before adsorption, after adsorption of conog red and malachite green dye.
FTIR spectrum for quartzite was recorded in the range 400–4000 cm−1. Before and after the adsorption of Congo red and malachite green dyes different functional groups were analyzed. The change in the structure of the adsorbent was measured before and after the adsorption of congo red and malachite green dyes. Peaks observed at 1435, 1006, 879 and 728 cm−1 are due to C⚌C, C—O stretching vibrations. The intensity of the peaks after the adsorption of the dyes has considerably reduced showing the adsorption of the dyes onto the adsorbent surface. Nonetheless peaks appeared at approximately the same absorption, showing that the dyes molecules are interlocked in the adsorbent surface due to its high porosity.
Surface morphology of quartzite was studied using field emission scanning electron microscopy shown in Fig. 2. The subtle difference before and after the adsorption in the images have been highlighted with red circles inside the images. SEM micrographs before adsorption shows voids of porosity. The presence of pores before adsorption Fig. 2(a) and their filling after the adsorption of congo red dye Fig. 2(b) and malachite green Fig. 2(c). The change in the surface morphology of quartzite after the adsorption is easily observable confirming the adsorption of these dyes on the surface of quartzite.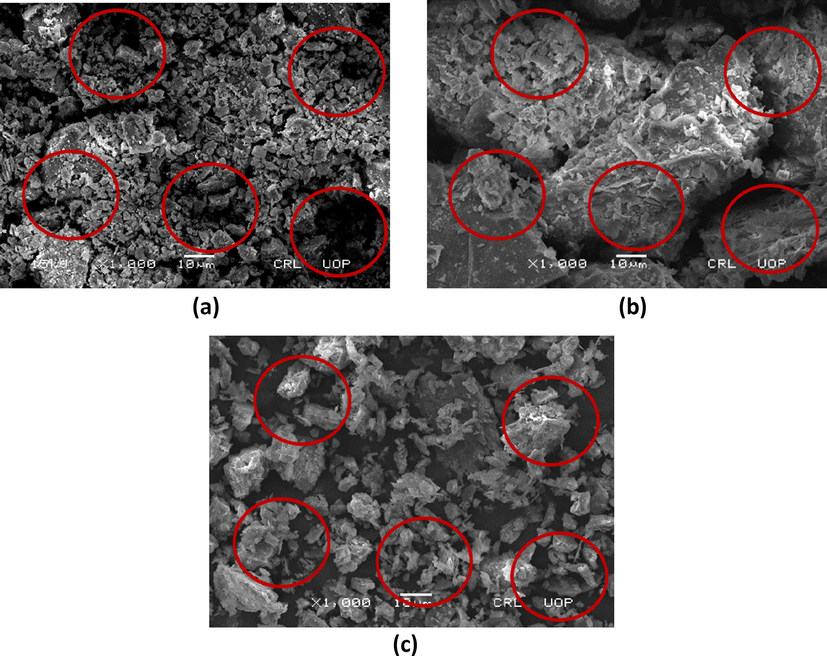
FESEM images of quartzite before adsorption (a) quartzite after congo red dye adsorption (b) quartzite after malachite green dye adsorption (c).
3.2 Effect of contact time and temperature
Effect of the contact time of the congo red and malachite green dyes shown in Fig. 3. For both of the dyes the initial uptake is very fast and then gradually tapers off toward the equilibrium achievement. The faster uptake in the initial time is due to the availability of large number of vacant sites and higher adsorbate molecules concentration. The slower rate of adsorption with time is attributed to the saturation of the adsorbent sites and slight decrease in the solute concentration. The equilibrium contact time remained 60 min for congo red and 90 min for malachite green dye. Adsorption of congo red and malachite green dyes on quartzite was studied at six different temperatures from 10 °C to 60 °C shown in Fig. 3(a) and (b). With increase in temperature the uptake of the dyes by the adsorbent increases. The higher uptake at elevated temperatures is attributed to the faster mobility and rapid penetration of the adsorbate molecules into the pores of the adsorbent. The removal remained 95.72% for congo red dye and 95.46% for malachite green dye as shown in Fig. 3(e).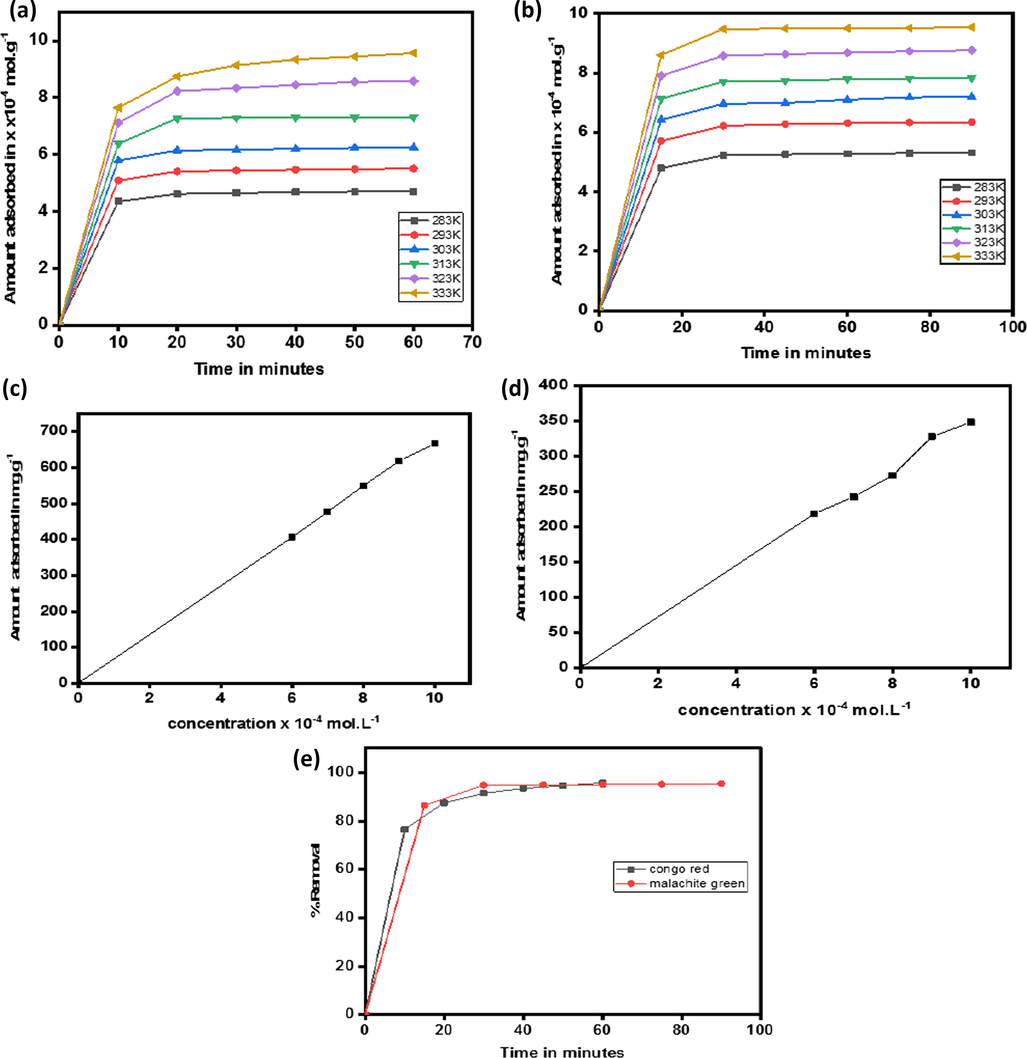
Effect of temperature on adsorption of congo red on quartzite (a) on adsoption of malachite green on quartzite (b), effect of concentration on adsorption of congo red on quartzite (c), effect of concentration on adsorption of malachite green on quartzite (d) % removal of congo red and malachite green (e).
3.3 Effect of dye concentration
With increase in the dye concentration the uptake of dye by the adsorbent increased as shown in Fig. 3(c) for congo red dye and in Fig. 3(d) for malachite green dye. The uptake of the congo red onto the surface of quartzite increased from 406.155 mg/g to 666.7 mg/g with the increase of concentration from 6 × 10⁻⁴ mol. L−1 to 10−3 mol. L−1. Malachite green dye adsorption increased from 218.58 mg/g to 348.125 mg/g with the increase of dye concentration from 6 × 10⁻⁴ mol. L−1 to 10−3 mol. L−1. The dosage of adsorbent remained fixed in all the cases. The enhanced uptake by the adsorbent is attributed to the higher gradient of concentration between the adsorbate molecules and the pores of the adsorbent.
3.4 Adsorption isotherms
Adsorption isotherm explains at constant temperature the release of molecules from aqueous phase to the solid phase (Limousin et al., 2007). In this study two important adsorption isotherms Langmuir (Langmuir, 1917) and Freundlich (Krishna Murthy et al., 2019) were tested by the adsorption data. According to Langmuir isotherm homogenous adsorption occurs only at specific sites of the adsorbent surface (Gimbert et al., 2008). Langmuir equation is given by
Ce is the equilibrium concentration in mol.L−1 qt is the amount adsorbed in mol.g−1 in time “t” Xm represents monolayer adsorption capacity in mol.g−1, K1 is the Langmuir constant representing the binding energy constant is determined from the intercept of the Ce/qt plot vs Ce.
The plot of Ce/qt vs Ce gives straight lines both for congo red dye adsorption on quartzite as shown in Fig. 4(a) and for malachite green dye adsorption on quartzite shown in Fig. 4(b). The straight lines obtained shows the favorability of the adsorption process in both the cases. Values of Xm and K1 obtained for both dyes at different temperatures as shown in Tables 3 and 4 shows that adsorption of both dyes is in agreement with Langmuir isotherm model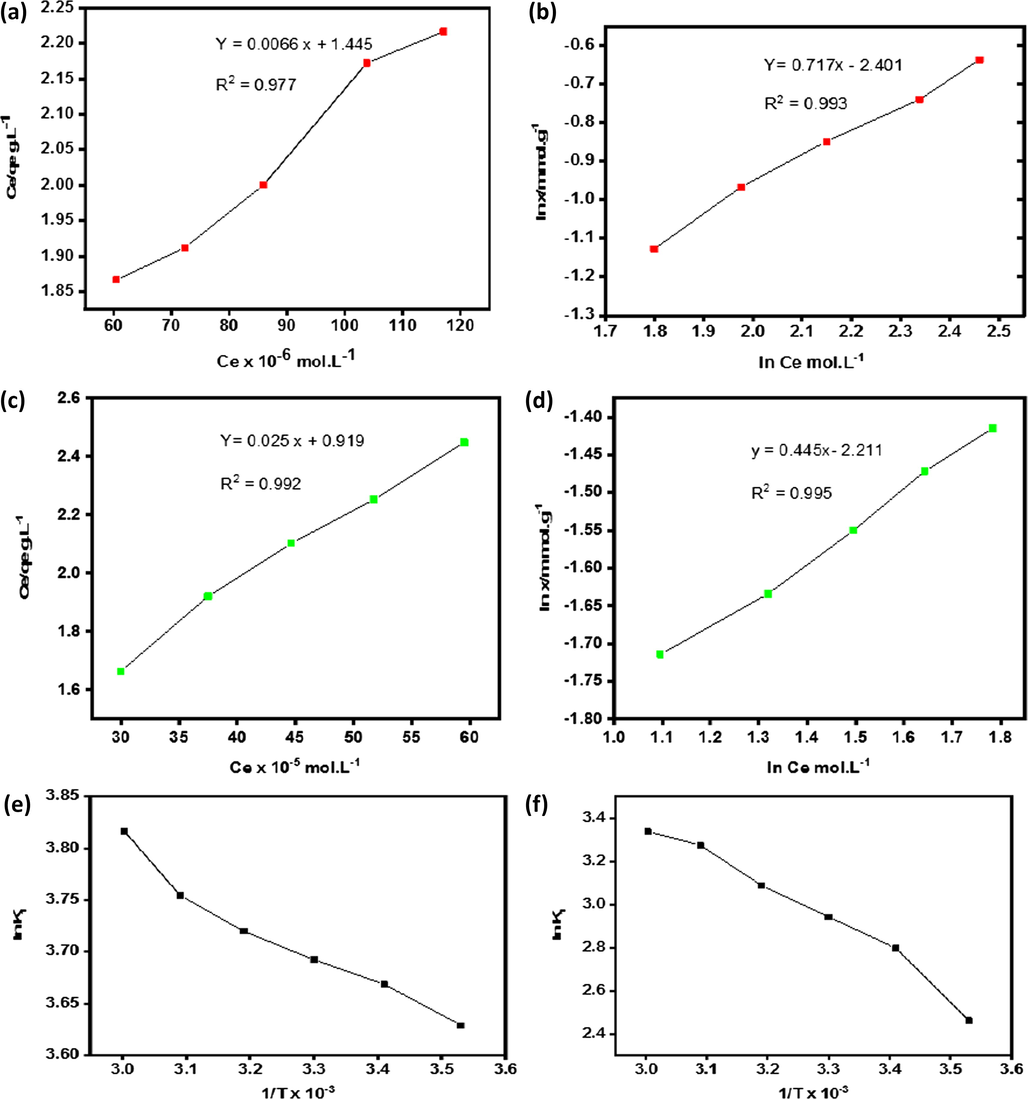
Langmuir plot for adsorption of congo red on quartzite (a) Freundlich plot for adsorption of congo red on quartzite (b) Langmuir plot for adsorption of malachite green on quartzite (c) Freundlich plot for adsorption of malachite green on quartzite (d) Van’t Hoff’s plot for congo red adsorption on quartzite (e) Van’t Hoff’s plot for malachite green adsorption on quartzite (f).
Values of various parameters
kelvin1/T × 10−3
Xm (10 −5) (mol/g)
K1(10 −3) (L/mol)
ln K1
ΔH0 (KJ/mol)
ΔS0
ΔS0
(KJ/mol .K)ΔG0 (KJ/mol)
3.53
142.85
37.68
3.629129
2.718776
39.72157
0.039722
−8.52243
3.41
144.92
39.2
3.668677
−8.91964
3.3
147.05
40.14
3.692373
−9.31686
3.19
153.84
41.26
3.719894
−9.71407
3.09
153.84
42.72
3.754667
−10.1113
3.003
142.85
45.45
3.816613
−10.5085
Values of various parameters
kelvin1/T × 10−3
Xm (10 −5) (mol/g)
K1 (10 −3) (L/mol)
lnK1
ΔH0
(KJ/mol)ΔS0
ΔS0
(KJ/mol .K)ΔG0 (KJ/mol)
3.53
55.2486
11.725
2.461723
13.45337
68.5805
0.068581
−5.95491
3.41
40.8163
16.409
2.79783
−6.64072
3.3
39.21569
18.963
2.94249
−7.32652
3.19
41.32231
21.933
3.087992
−8.01233
3.09
39.52569
26.415
3.273932
−8.69813
3.003
35.58719
28.161
3.337938
−9.38394
Like Langmuir model adsorption process is also described well by the Freundlich model (Adinehvand et al., 2016). For liquid phase adsorption on surface with heterogeneous energy distribution the Freundlich isotherm is applied, it is represented by the equation
Values of parameters
Values for congo red dye
Values for malachite green dye
Temperature(K)
1/n (g/dm3)
K1 (10−5mol/g)
1/n (g/dm3)
K1 (10−5mol/g)
283
0.712
0.07643611
0.6292
0.06395343
293
0.7183
0.077537
0.5774
0.075417018
303
0.721
0.079714
0.5219
0.080741708
313
0.7263
0.0838605
0.5052
0.09310755
323
0.7273
0.08589754
0.4615
0.10448622
333
0.7247
0.08894829
0.4459
0.109569087
The Langmuir model described two parameters maximum adsorption and affinity constant and also considered homogeneous adsorption sites for adsorption. However, the Freundlich model also described two parameters, the non-ideality and average affinity that is heterogeneity. The benefit of using both the models for the adsorption studies is that they can be easily linearized by obtaining different parameters through simple linear regression models. The linear regression values were obtained for both the dyes by application of Langmuir and Freundlich models, R2 value of Langmuir isotherm remained 0.977 for congo red and 0.992 for malachite green dye adsorption, while for Freundlich isotherm it remained 0.993 for congo red and 0.995 for malachite green dye adsorption. This reflects that data approximately fitted well in both models for both dyes as shown in Table 6.
R2 values of Langmuir plots
R2 values of Freundlich plots
For Congo red dye adsorption
For Malachite green dye adsorption
For Congo red dye adsorption
For Malachite green dye adsorption
R2 = 0.977
R2 = 0.992
R2 = 0.993
R2 = 0.995
3.5 Adsorption kinetics
Adsorption data was analyzed kinetically fitted best in the pseudo first order kinetic equation (Puri and Sumana, 2018) represented as
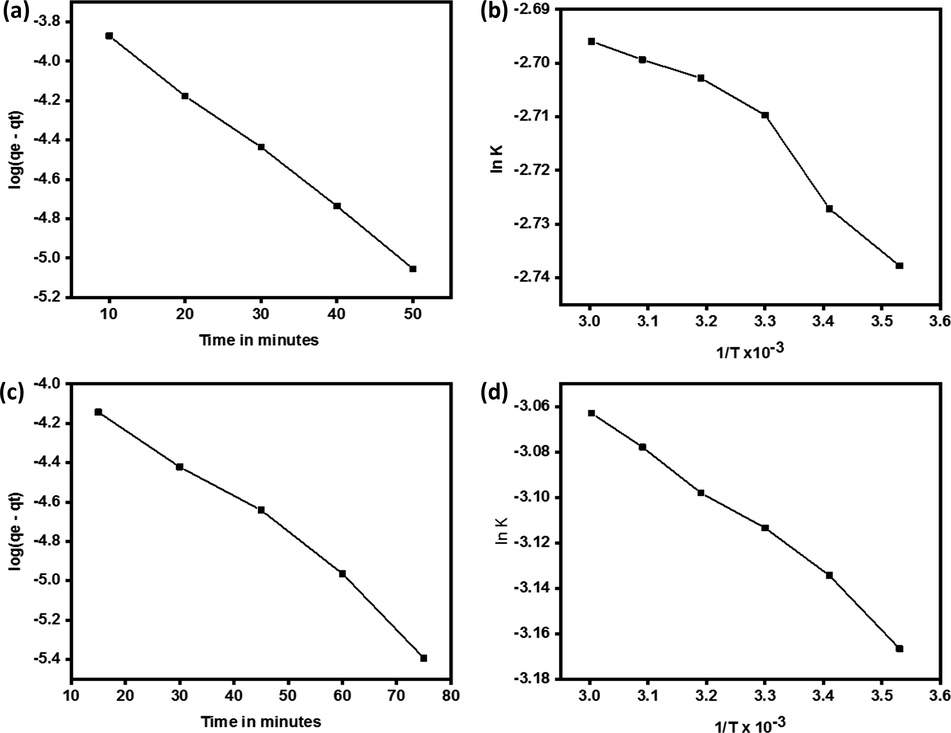
Lagergren plot for adsorption of congo red on quartz (a) Arrhenius plot for adsorption of congo red on quartz (b) Lagergren plot for adsorption of malachite green on quartz (c) Arrhenius plot for adsorption of malachite green on quartz (d).
The activation energy for adsorption process (Liu et al., 2018, Hasan et al., 2008) was determined by the application of the Arrhenius equation
Values of Activation energy (Ea) determination for congo red and malachite green dyes adsorption on quartzite
Congo red dye
Malachite green dye
Temperature 0C
Kelvin scale
Kelvin 1/T
kelvin1/T × 10−3
Value of k
ln k
Ea kj/mole
value of k
ln k
Ea kj/mole
10
283
0.003534
3.53
0.064714
−2.73777
0.679278
0.042145
−3.16664
1.583874
20
293
0.003413
3.41
0.065405
−2.72715
0.043527
−3.13438
30
303
0.0033
3.3
0.066557
−2.7097
0.044448
−3.11344
40
313
0.003195
3.19
0.067017
−2.7028
0.045139
−3.09801
50
323
0.003096
3.09
0.067248
−2.69937
0.04606
−3.07778
60
333
0.003003
3.003
0.067478
−2.69596
0.046751
−3.06292
3.6 Adsorption thermodynamics
Various thermodynamic parameters such as ΔH0, ΔS0 and ΔG0 were determined for the adsorption of congo red and malachite green dyes on quartzite at different temperatures, 10, 20, 30, 40, 50 and 60 °C. Using the data from obtained at different temperatures various thermodynamic parameters were determined. Standard free energy changes (ΔG0) were calculated using the equation
ln K1 was plotted vs 1/T values of ΔH0 were calculated from the slope of the plot and ΔS0 values were determined from the intercept of the slope shown in Fig. 4(e) and (f). Values of ΔH0 remained positive both for congo red and malachite green dyes adsorption on quartzite as shown in Tables 3 and 4 showing the endothermic nature of the adsorption process. Positive values of ΔS0 and negative values of ΔG0 showing the spontaneous nature of the adsorption process. Values of ΔG0 with increasing temperature is showing greater favorability of the dyes adsorption at higher temperature.
It was concluded that the highest adsorption capacity of quartzite for CR is possibly due to the London dispersion forces as compared to MG, because the points of attachment of the CR to quartzite are more as compared to MG. The more points of attachment to the quartzite through London dispersion forces is due to more benzene rings in CR as compared to MG as shown in the pictorial representation of Fig. 6.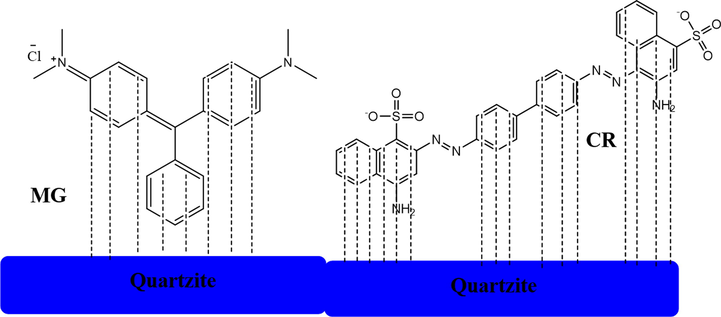
Pictorial representation of the attachment of MG and CR dyes with the quartzite through London dispersion forces.
4 Conclusion
This study was carried out to assess the ability of locally, cheaply and abundantly available quartzite for the adsorption of anionic and cationic dyes. Quartzite was used for the adsorption of congo red an anionic dye and malachite green a cationic dye. Quartzite proved itself as an efficient adsorbent for both dyes, Adsorption equilibrium was achieved at 60 mins for congo red dye and 90 mins for malachite green dye. The uptake of the dyes by the adsorbent remained exceptionally good with 666.7 mg/g for congo red dye and 348.125 mg/g for malachite green dye. Adsorption process was described well by Langmuir and Freundlich isotherms. However, the Freundlich isotherm model with R2 value 0.993 for congo red dye adsorption and R2 value 0.995 for malachite green dye adsorption comparatively remained better.
Various thermodynamic parameters indicated that adsorption remained endothermic and spontaneous process. The research studies show that quartzite can be utilized as low cost adsorbent for both anionic and cationic dyes.
Acknowledgments
Authors are thankful to department of chemistry Abdul Wali khan university Mardan, centralized research lab university of Peshawar, Govt. Postgraduate College Nowshera for research facilitation. Thanks are paid to the department of Physics Allama Iqbal Open university Islamabad in providing help in samples characterization study.
Declaration of Competing Interest
Authors have no conflict of interest.
Funding sources
This research didn’t receive any fund or grant from any public or private funding agency.
References
- Acid-treated Zeolite (clinoptilolite) and its potential to zinc removal from water sample. Int. J. Environ. Sci. Technol.. 2016;13:2705-2712.
- [Google Scholar]
- Structural characteristics of hazardous organic dyes and relationship between membrane fouling and organic removal efficiency in fluidized ceramic membrane reactor. J. Cleaner Prod.. 2019;232:608-616.
- [Google Scholar]
- A comparison of sorptive removal of anthraquinone and azo dyes using fly ash from single and binary solutions. J. Hazard. Mater.. 2019;371:94-107.
- [Google Scholar]
- Hybrid treatment of coagulation/flocculation process followed by ultrafiltration in TIO2-modified membranes to improve the removal of reactive black 5 dye. Sci. Total Environ.. 2019;664:222-229.
- [Google Scholar]
- Adsorption of acid blue on synthesized polymeric nanocomposites, PPy/MCM-41 and PAni/MCM-41: Isotherm, thermodynamic and kinetic studies. J. Macromol. Sci. Part A. 2018;55(3):269-279.
- [Google Scholar]
- Azo dyes in clothing textiles can be cleaved into a series of mutagenic aromatic amines which are not regulated yet. Regul. Toxicol. Pharm.. 2017;88:214-226.
- [Google Scholar]
- Color removal from industrial dyeing and laundry effluent by microbial consortium and coagulant agents. Process Saf. Environ. Prot.. 2018;118:203-210.
- [Google Scholar]
- Adsorption of a cationic methylene blue dye on an Algerian palygorskite. Applied Clay Science.. 2019;1(179):105145.
- [Google Scholar]
- Effects of microstructure of clay minerals, montmorillonite, kaolinite and halloysite, on their benzene adsorption behaviors. Appl. Clay Sci.. 2017;143:184-191.
- [Google Scholar]
- Bioremediation potential of waste biomaterials originating from coastal Zostera marina L. meadows for polluted aqueous media with industrial effluents. Prog. Biophys. Mol. Biol.. 2019;145:78-84.
- [Google Scholar]
- Multi-scale rock surface area quantification—a systematic method to evaluate the reactive surface area of rocks. Geochemistry. 2004;64:241-256.
- [Google Scholar]
- Amine activated diatom xerogel hybrid material for efficient removal of hazardous dye. Mater. Chem. Phys.. 2019;235:121738
- [Google Scholar]
- Catalytic ozonation of dye industry effluent using mesoporous bimetallic Ru-Cu/SBA-15 catalyst. Process Saf. Environ. Prot.. 2018;118:125-132.
- [Google Scholar]
- Adsorption isotherm models for dye removal by cationized starch-based material in a single component system error analysis. J. Hazard. Mater.. 2008;157:34-46.
- [Google Scholar]
- Adsorption of reactive dye onto cross-linked chitosan/oil palm ash composite beads. Chem. Eng. J.. 2008;136:164-172.
- [Google Scholar]
- A critical review on recent advancements of the removal of reactive dyes from dyehouse effluent by ion-exchange adsorbents. Chemosphere. 2018;209:201-219.
- [Google Scholar]
- Mutagenicity and genotoxicity evaluation of textile industry wastewater using bacterial and plant bioassays. Toxicol. Rep.. 2019;6:193-201.
- [Google Scholar]
- Removal of anionic dyes in aqueous solution by flocculation with cellulose ampholytes. J. Water Process Eng.. 2015;7:83-93.
- [Google Scholar]
- Studies on batch adsorptive removal of malachite green from synthetic wastewater using acid treated coffee husk: Equilibrium, kinetics and thermodynamic studies. Microchem. J.. 2019;146:192-201.
- [Google Scholar]
- The constitution and fundamental properties of solids and liquids. J. Franklin Inst.. 1917;183:102-105.
- [Google Scholar]
- Toxicity evaluation of textile dyeing effluent and its possible relationship with chemical oxygen demand. Ecotoxicol. Environ. Saf.. 2018;166:56-62.
- [Google Scholar]
- Sorption isotherms: A review on physical bases, modeling and measurement. Appl. Geochem.. 2007;22:249-275.
- [Google Scholar]
- Adsorption characteristics of Direct Red 23 azo dye onto powdered tourmaline. Arabian J. Chem.. 2018;11:1281-1291.
- [Google Scholar]
- Preparation of Modified MWCNT with Dithiooxamide for Preconcentration and Determination of Trace Amounts of Cobalt Ions in Food and Natural Water Samples. ChemistrySelect. 2017;2:4439-4444.
- [Google Scholar]
- Application of SBA-15/Diphenyl Carbazon/SDS nanocomposite as solid-phase extractor for simultaneous determination of Cu(II) and Zn(II) Ions. Arabian J. Sci. Eng.. 2017;43:3547-3556.
- [Google Scholar]
- Preparation of SBA-15/graphene oxide nanocomposites for preconcentration and determination of trace amounts of rutoside in blood plasma and urine. Sens. Actuat. B. 2017;253:533-541.
- [Google Scholar]
- Application of electrocoagulation for the efficient pollutants removal to reuse the treated wastewater in the dyeing process of the textile industry. J. Hazard. Mater.. 2019;371:705-711.
- [Google Scholar]
- Highly effective adsorption of crystal violet dye from contaminated water using graphene oxide intercalated montmorillonite nanocomposite. Appl. Clay Sci.. 2018;166:102-112.
- [Google Scholar]
- Ecotoxicological risk assessment of the “Acid Black 210” dye. Toxicology. 2017;376:113-119.
- [Google Scholar]
- Functionalization of SBA-15 by dithiooxamide towards removal of Co (II) ions from real samples: Isotherm, thermodynamic and kinetic studies. Adv. Powder Technol.. 2019;30:1823-1834.
- [Google Scholar]
- Modification of nano Clinoptilolite zeolite using sulfuric Acid and its application toward removal of Arsenic from water sample. J. Nanoanal.. 2017;4(1):48-58.
- [Google Scholar]
- Starch-coated green synthesized magnetite nanoparticles for removal of textile dye Optilan Blue from aqueous media. J. Taiwan Inst. Chem. Eng.. 2019;100:65-73.
- [Google Scholar]
- Synthesis of polyaniline/Fe3O4 magnetic nanoparticles for removal of reactive red 198 from textile waste water: kinetic, isotherm, and thermodynamic studies. Desalination Water Treat.. 2016;57(47):22551-22563.
- [Google Scholar]
- Bioremediation of textile effluent containing Mordant Black 17 by bacterial consortium CN-1. J. Water Process Eng. 2014;1(4):196-200.
- [Google Scholar]
- Removal of malachite green and crystal violet cationic dyes from aqueous solution using activated sintering process red mud. Appl. Clay Sci.. 2014;93–94:85-93.
- [Google Scholar]
- The agricultural use potential of the detoxified textile dyeing sludge by integrated Ultrasound/Fenton-like process: A comparative study. Ecotoxicol. Environ. Saf.. 2019;172:26-32.
- [Google Scholar]


