

Translate this page into:
Rapid and non-invasive estimation of total phenol content and species identification in dried wild edible bolete using FT-NIR spectroscopy
⁎Corresponding authors. honggaoliu@126.com (Honggao Liu), boletus@126.com (Yuanzhong Wang)
-
Received: ,
Accepted: ,
This article was originally published by Elsevier and was migrated to Scientific Scholar after the change of Publisher.
Abstract
Abstract
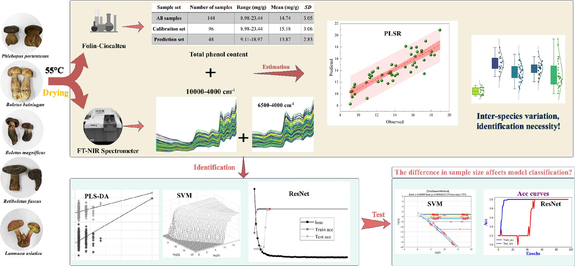
The market for dried wild edible mushrooms is characterized by quality discrepancies and species disorganization, which are a matter of concern. The feasibility of using fourier transform near-infrared (FT-NIR) spectroscopy with chemometrics to predict the total phenol content and identify species was investigated in dried bolete. For the determination of total phenolic content, FT-NIR spectral acquisition, and two-dimensional correlation spectroscopy (2DCOS) image acquisition, five common species of dried edible bolete (n = 144) were utilized. The results showed that partial least squares regression (PLSR) combined with Fourier transform near-infrared spectroscopy could predict the total phenol content of dried boletes, with the best prediction coefficient of determination (R2p) = 0.79. The partial least squares discriminant analysis (PLS-DA) model accurately identified Phlebopus portentosus, with Matthews correlation coefficient (MCC), Precision (PRC), Sensitivity (SEN), and Specificity (SPE) all being 1. The support vector machines (SVM) model is performed optimally to identify processing edible bolete (Lanmaoa asiatica) with an accuracy of 100 % in the test set. 2DCOS images combined with the residual convolutional neural networks (ResNet) model demonstrated the feasibility of FT-NIR full spectral bands (10,000–4,000 cm−1) and characteristic spectral bands (6,500–4,000 cm−1) for species identification of boletes. The method applies to the case of consistent or inconsistent sample sizes between groups, with an accuracy of 1.00 for both the training and test sets. The study serves as a rapid, non-invasive, and convenient method for real-time evaluation of the quality of dried edible bolete in the market.
Keywords
Dried wild edible bolete
Total phenol content
Prediction
Identification
FT-NIR
ResNet

1 Introduction
Edible wild mushrooms have attracted enormous interest worldwide for their organoleptic, nutritional, and medicinal properties (Marçal et al., 2021; Subramaniam et al., 2021; Tan et al., 2022; Zhang et al., 2018). Their chemical composition is the factor that confers these properties. For instance, phenolic compounds are regarded as the most significant contributors to free radical scavenging activity. The potential benefit of phenolic compounds in human health, including their antioxidant, anti-inflammatory, and anti-tumor qualities, is excellent (Bristy et al., 2022; Palacios et al., 2011). It was proved that mushroom phenolic content was responsible for the changes in antioxidant activity of mushroom extracts and there was a close correlation between the two (Contato et al., 2020). Significant antidiabetic properties have been demonstrated by mushrooms' polyphenols and flavonoids (Kato et al., 2009). Due to these properties, mushroom polyphenols are used as functional foods and nutraceuticals. In addition, mushroom phenolic compounds have skincare activity as cosmeceuticals (Abdelshafy et al., 2022). The high production of edible wild boletes in Yunnan, China has led to their export to other countries (Chen et al., 2022). Nevertheless, the shelf-life of fresh wild edible boletes is challenging due to high moisture content, high respiration rate, high enzyme activity, and the presence of microorganisms (Marçal et al., 2021; Zhang et al., 2018). Post-harvest drying is commonly used to extend the shelf life of boletes (Zheng et al., 2023b).
Drying affects the content and composition of total phenols, owing to their sensitivity to high temperatures (Zheng et al., 2023b). Moreover, after the boletes is dried, the difficulty of species identification increases, making it easy for species confusion, substitution of good for bad, and even adulteration of toxic species, threatening the health of consumers and disrupting the market. Consequently, producers are struggling to find rapid, reliable, and efficient analytical methods for total phenol assessment and species identification of dried wild edible bolete.
Traditional chemical content determination requires the consumption of chemical reagents, which is time-consuming and expensive. Chromatographic techniques, for example, provide accurate data but are demanding on the operator and require sophisticated equipment. Furthermore, traditional methods of species identification mainly rely on methods such as morphology and molecular biology, the technique is time-consuming and requires experienced operators. In this context, Fourier transform near-infrared (FT-NIR) spectroscopy technology has the advantages of being fast, non-invasive, and simple to operate. It achieves superior results in the determination of nutrients, physicochemical properties, sensory characteristics, and species identification studies of various food products. Such as cocoa (Drees et al., 2023), coffee (Baqueta et al., 2023), butteroil (da Silva Medeiros et al., 2023), Monechma ciliatum (Elrasheid Tahir et al., 2023). Nevertheless, spectral data are large and complex, which are unfavorable for analysis. Chemometrics can solve this challenge, such as principal component analysis (PCA), partial least squares regression (PLSR), partial least squares discriminant analysis (PLS-DA), support vector machines (SVM), and residual convolutional neural networks (ResNet) models have the advantage of being fast and stable (Lin et al., 2023; Liu et al., 2023a; Yan et al., 2023).
This study develops a method for the prediction of total phenolic content and species identification in dried wild edible bolete by FT-NIR spectroscopy. The total phenolic content of five dried bolete species was determined by the Folin-Ciocalteu method, and the PLSR model was chosen to establish the relationship between observations and spectral data for the total phenolic content determination. Species identification analysis was performed using PLS-DA, and SVM combined with spectral data. Two-dimensional correlation spectroscopy (2DCOS) images were used for FT-NIR to be analyzed and then combined with ResNet models to verify the feasibility of FT-NIR for the identification of bolete. A quick, convenient, and non-destructive solution for quality control and regulation of dried bolete in the market.
2 Materials and methods
2.1 Sample collection
For the 144 wild edible bolete samples that were collected from Yunnan China, they were categorized according to species name into A (Phlebopus portentosus: 18), B (Boletus bainiugan: 19), C (Boletus magnificus: 45), D (Retiboletus fuscus: 26), and E (Lanmaoa asiatica: 36). All samples were dried in a dry dehydrator (Ezidri Ultra FD1000, China) with 55 °C for 48 h. Finally, 144 samples were ground into a fine powder, and then the powder passing through a 100 mesh sieve was used for FT-NIR spectra acquisition and total phenol content determination.
2.2 Collection of FT-NIR spectra
FT-NIR spectra of all samples were acquired by Antaris II FT-NIR spectrometer (Thermo Fisher Scientific INC., USA) in the spectral range of 10,000–4,000 cm−1 and diffuse reflectance mode. The spectral resolution was 8 cm−1 and the acquisition parameters were 64 times, with two repetitions per sample, and the final average value was selected. The background was collected at 64-minute intervals.
2.3 Two-dimensional correlation spectral (2DCOS) image acquisition
It is generated by Matlab (R2017b. MathWorks, USA) run scripts, 2DCOS, presenting subtle changes in the spectra caused by changes in the chemical structure of the sample molecules. The column vector k represents the dynamic spectral intensity (Eq. (1)) when the spectra are recorded in equal intervals in n steps.
The strength of the simultaneous two-dimensional correlation between variables i1 and i2 is expressed as (Eq. (2)):
2.4 Determination of observed values of total phenolic content
The Folin-Ciocalteu method was used for the replicate determination of the total phenol content of bolete (Díaz-Maroto et al., 2023). A UV–Vis spectrophotometer (Shanghai Metash Instruments Co., Ltd, China) was used for the total phenol absorbance determination, and the results were expressed as milligrams of gallic acid equivalents per gram of dry weight of sample (mg GAE/g DW).
2.5 Chemometrics analysis
2.5.1 Data set partitioning
The study selected the joint x-y distance (SPXY) algorithm and the Kernard-Stone (K-S) algorithm to divide the dataset for prediction and identification models. The SPXY algorithm separated all bolete spectra into calibration and prediction sets at 2/3:1/3 for total phenol content prediction modeling and performance prediction, respectively. The K-S algorithm partitioned each dataset into 2/3 (train set) and 1/3 (test set) for building and evaluating bolete species identification models.
2.5.2 Pretreatment
FT-NIR spectroscopy is affected by noise and background due to random interference from equipment and the environment (Ni et al., 2023). At the same time, it may mislead the data to model prediction, irrelevant information such as particle size differences between samples, chemical differences, etc. First-order derivative (FD) removes the effects of baseline and linear slope effects (Ni et al., 2023); second derivative (SD) distinguishes overlapping peaks in the spectrum and removes interference from chemical differences (Chen et al., 2008); multivariate scattering correction (MSC) removes the scattering effect of particle size differences on the spectrum; standard normal variable transformation (SNV) removes the additive light scattering effect (Cruz-Tirado et al., 2023); and Savitzky-Golay (SG) removes the noise effect (Xu et al., 2015). The combination of preprocessing methods has been observed by previous authors to help optimize model performance (Yan et al., 2023). Consequently, this study coupled FD, SD, MSC, SNV, and SG preprocessing methods to filter out the most suitable combination for further modeling analysis.
2.5.3 The quantitative models
The PLSR model is used as a classical regression model to find the best linear correlation between the independent matrix X (spectra) and the measured parameter Y (total phenol content) of the sample. The calibration and prediction statistics for each regression include calibration set root mean square error (RMSEc); prediction set root mean square error (RMSEp); and coefficient of determination (R2), which is close to 1 when the predicted value of the model is close to the observed value obtained from chemical analysis.
2.5.4 The classification models
PCA clusters the samples relatively within a certain area, reflecting their similarities and differences while retaining more of the original information. It was used to explore the distribution of clusters among bolete species. It characterizes the distribution distances between samples employing score plots, presenting the distribution characteristics between spectral data.
They were used as supervised discrimination methods, PLS-DA, and SVM for the discrimination of dried boletes of different species. The model performance was evaluated based on the statistics of the PLS-DA model, including latent variables (LVs) and R2; which indicate the prediction ability of the model to new data (Q2);. Root mean square error of estimation (RMSEE); Root mean square error of cross-validation (RMSEcv); Root mean square error of prediction (RMSEP) and accuracy. A superior PLS-DA model involves smaller LVs and errors, close to 1 for R2, Q2, and accuracy. The parameters precision (PRC), sensitivity (SEN), specificity (SPE), and Matthews correlation coefficient (MCC) were chosen for the study to compare the classification performance of the FT-NIR spectral bands and the pretreatment methods for each Bolete species. They were calculated as follows.
The SVM model, a nonlinear classification algorithm, constructs a hyperplane in the high-dimensional feature space for classification (Dai et al., 2014; Liu, Wang et al., 2023). The SVM model performance was additionally evaluated by c and g values, with c values indicating the risk of model overfitting and g values reflecting the speed of model training and prediction. Smaller c values and g values are indicative of better model performance (Zheng et al., 2023a).
The ResNet model, specialized in image recognition, has been applied to various plant species such as Wolfiporia cocos, Gentiana rigescens (Liu et al., 2022), and the genus Amomum (He et al., 2023).
The synchronized 2DCOS image dataset was divided into training, prediction, and external validation sets in 70 %, 20 %, and 10 % ratios, respectively. A 12-layer ResNet model was built with a weight decay coefficient λ of 0.0001 and a learning rate of 0.01. It adds the Identify block and Convolution block (Conv block) can avoid network degradation with depth and make the dimensionality consistent and the output result dimensional with the input consequence. The constant block is considered when the dimensionality of input and output is coherent and vice versa Conv block is considered. The ResNet model works as follows (Fig. 1):
Input data are normalized through the Batchnorm layer after convolutional layer operation; (2) Relu function to achieve nonlinear activation; (3) The data is fed into the Identify block and Conv block for feature extraction; (4) The main features are extracted through the Global average pooling layer; (5) The flatten layer downscales the multidimensional features to one-dimensional features and softmax outputs are performed through the fully connected layer.
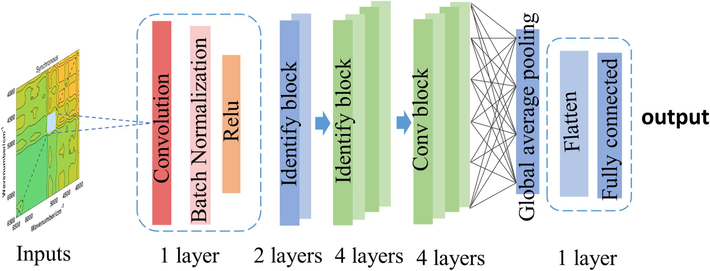
- ResNet model structure.
The model performance is assessed based on the loss function curve and accuracy.
3 Results and discussion
3.1 Fourier-transform near-infrared spectra analysis
Fig. 2 exhibits the average FT-NIR reflectance spectra of the five bolete species, as well as the main spectral features. The spectral profiles of the samples are comparable to those reported by (Yan et al., 2022) on bolete. As observed by the NIR spectra, the complex chemical composition of bolete results in abundant overtones and combinatorial bands. The absorption band 8467 cm−1 corresponds to O–H stretching. This may be linked to bolete moisture content (Yan et al., 2022). The band near 6920 cm−1 can be assigned to the first overtone of O–H of phenolic hydroxyl groups and C–H of aromatic structures (Burns & Ciurczak, 2007). The band at 6820 cm−1 is linked to the first overtone of the N–H stretching vibration in proteins (Osborne, 2000). The 6800–6300 cm−1 spectrum is involved in the O–H stretching of starch and the N–H stretching of amines in bolete (Liu et al., 2023b). The band near 5795 cm−1 is ascribed to the CH2 structural correlation of lipid and aromatic groups and corresponds to the first overtone of C–H (Díaz-Maroto et al., 2023). The vicinity of this wave number contains the characteristic band of the benzene ring typical of phenolic compounds. The spectral band 5190 cm−1 is allocated to a combination of the vibrational modes associated with the OH group and the vibrational modes accompanied by the corresponding aromatic rings in phenols (De Oliveira et al., 2018). The band near 4670 cm−1 is mainly associated with C–H from phenolic compounds (Frizon et al., 2015). The band centered at 4344 cm−1 is assigned to a combination of molecular vibrations in the C–H and CH2 structures (Prades et al., 2012). Also, it was not difficult to find that Phlebopus portentosus had the lowest absorbance compared to the others (Fig. 2a), and the same result was also found after second derivative infrared (SD-IR) spectroscopy (Fig. 2b). This phenomenon could be that Phlebopus portentosus has a lower content of chemicals. This is because SD pretreatment can further amplify the minor inconsistencies in the FT-NIR spectra, and the intensity of the peaks in the SD-IR spectroscopy accurately represents the variance in the content of the chemical constituents of bolete (Lin et al., 2023).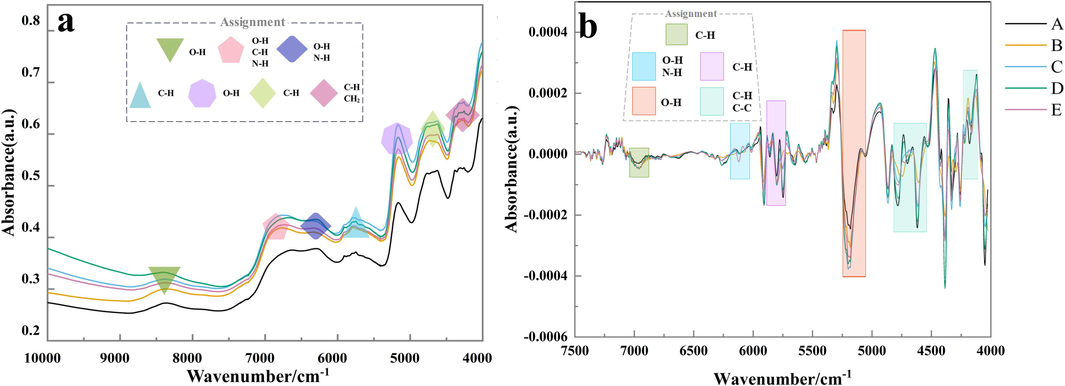
(a) RAW spectra and (b) SD pre-treatment spectra of (A) Phlebopus portentosus (B) Boletus bainiugan (C) Boletus magnificus (D) Retiboletus fuscus (E) Lanmaoa asiatica.
The C–H first overtone stretch of phenolic compounds occurs at 7067–6613 cm−1 (De Oliveira et al., 2018). The absorption band near 6352 cm−1 is attributed to the O–H or N–H first overtone stretching vibrations. The stretching of the first overtone of C–H occurs at 5882–5555 cm−1 (De Oliveira et al., 2018). Another study found the 5200–5100 cm−1 band to be associated with O–H functional groups, with binding bands resulting from ring interactions, which may be related to polyphenols (Guo et al., 2016). As shown by the SD-IR Spectroscopy, the individual peaks in the 6500–4000 cm−1 band, Retiboletus fuscus were more intense, probably due to the higher chemical content of this species. Overall SD-IR spectra show more chemical information, but they also have more overlapping bands, which can be compensated by 2DCOS images.
2DCOS images with higher spectral resolution, calculated according to the math of Noda2DCOS (Lin et al., 2023). One-dimensional spectra are profuse in chemical information, demonstrating variability among bolete species, yet appear to overlap in information (Fig. 2a). 2DCOS can distinguish highly overlapping spectral information, and Fig. 2b shows a synchronized 2DCOS image of bolete in the 10,000–4,000 cm−1 spectral band. Auto peaks, which indicate the sensitivity of the correlation spectrum in different regions to changes in spectral intensity owing to perturbation, appear on the diagonal. The more sensitive the auto-peak is to the perturbing variable, the stronger its intensity is considered to be. The cross peak is located on a non-diagonal line and is generated by synchronized changes of chemical groups with different wave numbers. It reveals that there may be strong synergies or interactions between groups or chemical bonds (He et al., 2023). The 3-dimensional image visualized the intensity and position of each peak (Fig. 3c), which corresponded to the synchronized 2DCOS. A broader and weaker auto peak appeared in the 9,000–8,000 cm−1 band, which might be related to the moisture content in the bolete (Fig. 3d).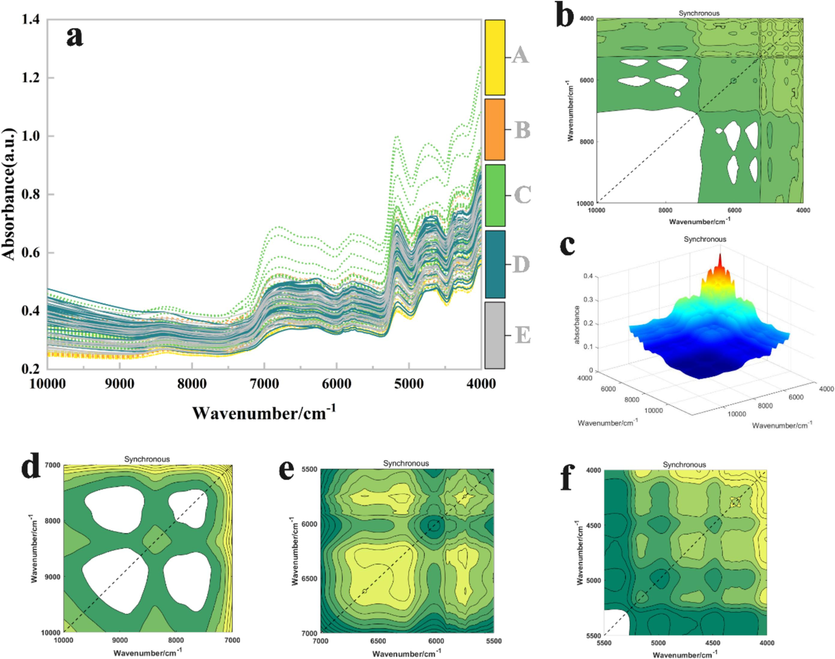
Synchronized 2DCOS images of Bolete. (a) FT-NIR; (b) 10000–4000 cm−1; (c) 3DCOS; (d) 10000–7000 cm−1; (e) 7000–5500 cm−1; (f) 5500–4000 cm−1.
3.2 Quantitative analysis of total phenols in bolete
3.2.1 Total polyphenol content of the calibration and prediction sets
The SPXY method was chosen to divide the dataset into a calibration set (96) and a prediction set (48), and the reference values of the total phenol content of the five bolete species are given in Table 1. The range of total phenol content of the calibration set was consistent with the whole samples as 8.98–23.44 mg/g, and the total phenol content of the prediction set varied from 9.11-18.97 mg/g within the calibration set. The ranges of total phenol values of the reference total phenol values in the calibration and prediction sets were wider, which helped to establish a robust prediction model. Note: SD: Standard deviation.
Sample set
Number of samples
Range (mg/g)
Mean (mg/g)
SD
All samples
144
8.98–23.44
14.74
3.05
Calibration set
96
8.98–23.44
15.18
3.06
Prediction set
48
9.11–18.97
13.87
2.83
3.2.2 Partial least squares regression
To extract the total phenol content from the NIR data by chemometrics, the total phenol content was determined using the Folin-Ciocalteu method. PLSR models were constructed using a total of 144 samples of five bolete species to correlate FT-NIR with total phenol content. FD, SD, MSC, SNV, and SG smoothing were selected to preprocess the data to de-emphasize the spectra subjected to noise, baseline drift, and sample particle size effects before calibration. Regression modeling was performed with total phenol content as Y and spectral data as X. The quality of the developed PLSR model was evaluated using leave-one-out cross-validation. Table 2 presents the results of the regression of PLSR on total phenol content, which was noticed, and the model results were divided into two categories according to the pretreatment related to FD or SD. The FD, FD-MSC-SG, and FD-SNV-SG pretreatments resulted in regression models with prediction set decision coefficients (Rp2) ≥ 0.76. They obtained optimal results for the LVs of 4, 1, and 4, respectively. The SD, SD-MSC-SG, and SD-SNV-SG preprocessing resulted in Rp2 ≥ 0.73. The predicted and observed values of total phenol content obtained from the cross-validation were plotted in Fig. 4, which directly shows the scatter plot of predicted and observed values of the prediction set with a good fitting relationship. Overall, the lowest mean bias (Calibration set: 2.059, Prediction set: 1.845) was observed for the pretreatment associated with FD and can be used as a novel method for the prediction of total phenol content in bolete. Note: LVs: latent variables; R2c: Calibration set coefficient of determination; R2p: Prediction set coefficient of determination; RMSEc: calibration set root mean square error; RMSEp: prediction set root mean square error; Bias: Mean absolute bias; FD: First derivative; SD: Second derivative; MSC: Multiplicative signal correction; SNV: Standard normal variate; SG: Savitzky-Golay.
Spectral pretreatment
LVs
Calibration set
Prediction set
Rc2
RMSEc
Bias
Rp2
RMSEp
Bias
FD
4
0.73
2.1
2.059
0.76
1.4
1.845
FD-MSC-SG
1
0.72
2.6
2.063
0.77
1.38
2.235
FD-SNV-SG
4
0.74
2.42
2.144
0.79
1.33
2.268
SD
4
0.83
1.88
2.185
0.73
1.49
2.231
SD-MSC-SG
5
0.87
1.93
2.274
0.75
1.46
2.187
SD-SNV-SG
5
0.87
1.94
2.278
0.75
1.46
2.186
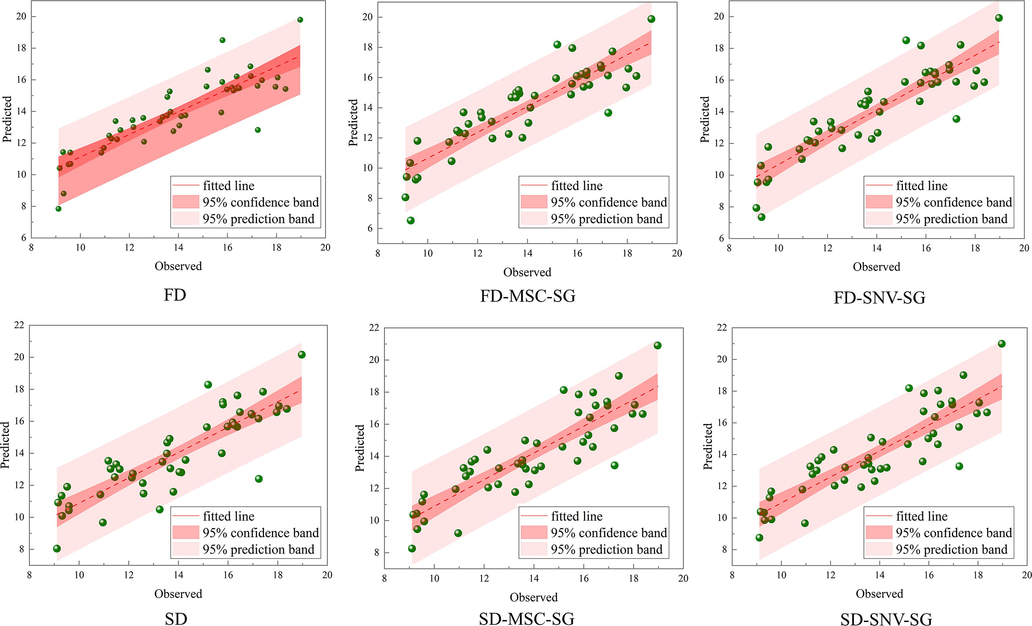
Scatterplot of predicted and observed values for the prediction set. FD: first-order derivative, SD: second-order derivative, MSC: multiple scattering correction, SNV: standard normal variation.
3.2.3 Total phenolic content analysis of five species of bolete
Box line plots were made to compare the total phenol content of the five bolete species (Fig. 5). Their mean total phenol values were observed as Phlebopus portentosus = 10.16 mg/g; Boletus bainiugan = 17.27 mg/g; Boletus magnificus = 14.95 mg/g; Retiboletus fuscus = 16.08 mg/g, and Lanmaoa asiatica = 14.47 mg/g. This indicates that there are differences in the total phenolic content of different bolete species. To avoid differences in the quality (total phenol content) of boletes caused by the adulteration phenomenon of bolete, which jeopardizes the legitimate rights and interests of consumers, it is important to identify the species of bolete. Species identification of bolete is essential for food quality control.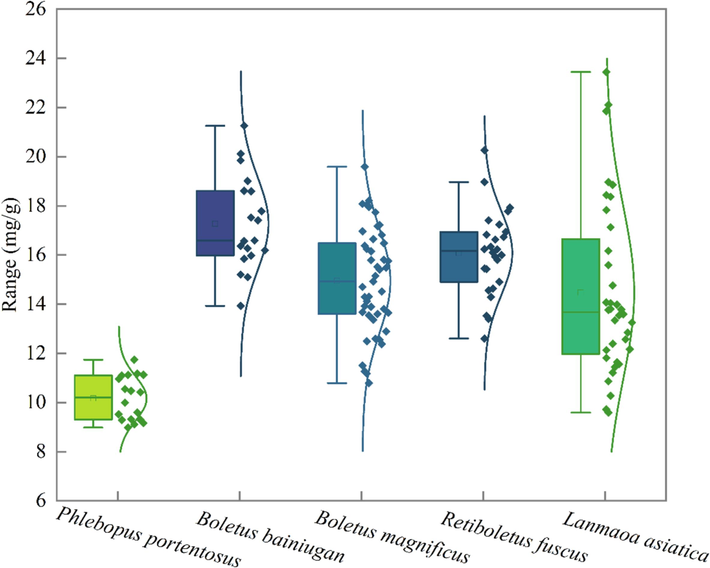
Total phenolic content of five bolete species.
3.3 Classification and identification of bolete
3.3.1 PCA results of bolete
To further illustrate the seeming differences and correlations between the FT-NIR spectra of bolete species, PCA was used (Jiang et al., 2023). Fig. 6a shows the PCA model with its R2X and Q2 both amounting to 0.997. The score plots for PC1 and PC2 represent 98 % of the data of the cumulative variance in the data. Thus, this can represent most of the variation in the FT-NIR spectra of bolete. A (Phlebopus portentosus) exhibited a tendency to segregate from both C (Boletus magnificus) and D (Retiboletus fuscus) and a tendency to cluster with B (Boletus bainiugan). It demonstrates that the chemical composition of Phlebopus portentosus may be more similar to Boletus bainiugan. And they were mainly distributed in the negative scoring regions of PC1 and PC2. Retiboletus fuscus samples were distributed in the positive scoring areas of PC1 and PC2. It is conceivable to link the sample distribution in the PCA score plot with the moiety or chemical bonds through the loading plot (He, Lin, et al., 2023). The PC2 negative loads of 6000 cm−1 (lipids), 5300 cm−1, and 4400 cm−1 (phenols) contributed to the scores of Phlebopus portentosus and Boletus bainiugan as shown in Fig. 6b. Overall, PCA is not appropriate for the clustering and separation of bolete species for this study.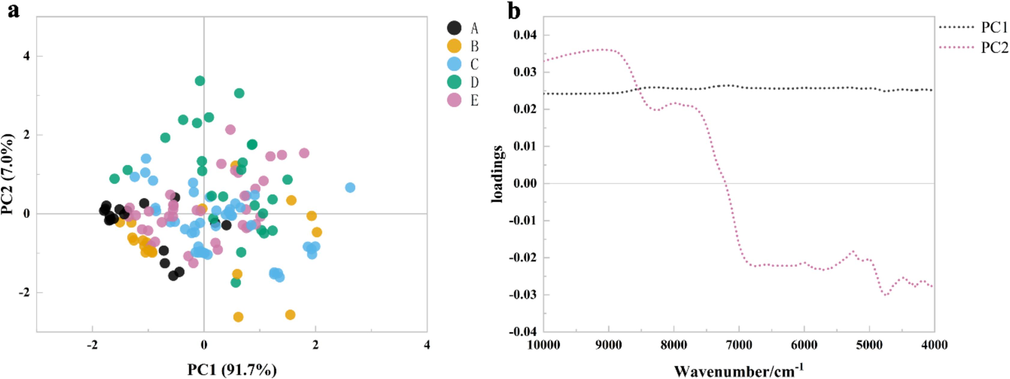
(a) PCA score plot and (b) load plot.
3.3.2 Establishment of partial least squares discriminant analysis model
Several pre-processing possibilities were evaluated for the FT-NIR spectra full spectral (10,000–4,000 cm−1) and SD featured spectral bands (6,500–4,000 cm−1). Table 3 summarizes the PLS-DA model performance in combination with different preprocessing. LVs, coefficient of determination (R2), Q2, RMSEE, RMSEcv, RMSEP, Train acc, and Test acc compare them. It was first observed that the featured spectral band is superior to the full spectrum when based on the original spectrum. Interestingly, after preprocessing, the PLS-DA model built based on the full spectrum performs better than the featured spectral band. The reason may be that the 10,000–6,500 cm−1 spectral band contains data points that are useful for classification, and subtle differences in the raw spectra between samples in this band were observed. The two spectral bands are observed separately and the preprocessing effectively improves the model performance. For 10,000–4,000 cm−1, SD preprocessing resulted in optimal model performance, with LVs reduced to 8, R2 and Q2 exceeding 0.50, and each error value as low as 0.22, giving an accuracy of 0.98. Also, SD-MSC-SG and SD-SNV-SG preprocessing have superior results and the model parameters are shown in Table 3. For the featured spectral band, the model performance was next to the full spectral. the FD-SNV-SG preprocessing had the optimal results with R2 = 0.75, Q2 = 0.52, RMSEP=0.13, Train acc = 0.94, Test acc = 0.90. The next best results were the MSC and FD-SNV-SG preprocessing. Note: LVs: latent variables; R2: Coefficient of determination; Q2: Indicates the prediction ability of the model to new data; RMSEE: Root mean square error of estimation; RMSEcv: Root mean square error of cross-validation; RMSEP: Root mean square error of prediction; RAW: raw spectra; FD: First derivative; SD: Second derivative; MSC: Multiplicative signal correction; SNV: Standard normal variate; SG: Savitzky-Golay.
Spectral band/cm−1
Spectral pretreatment
LVs
R2
Q2
RMSEE
RMSEcv
RMSEP
Train acc
Test acc
10000–4000
RAW
12
0.04
0.02
0.31
0.31
0.29
0.45
0.45
FD
3
0.32
0.22
0.27
0.29
0.24
0.72
0.80
SD
8
0.77
0.53
0.18
0.22
0.19
0.99
0.98
MSC
3
0.28
0.25
0.28
0.28
0.23
0.58
0.63
SNV
3
0.28
0.25
0.28
0.28
0.23
0.57
0.61
FD-MSC-SG
4
0.37
0.28
0.22
0.24
0.18
0.71
0.73
FD-SNV-SG
8
0.67
0.52
0.19
0.22
0.18
0.86
0.88
SD-MSC-SG
7
0.74
0.52
0.19
0.23
0.18
0.98
0.92
SD-SNV-SG
7
0.75
0.54
0.19
0.22
0.17
0.98
0.96
6500–4000
RAW
3
0.19
0.14
0.30
0.30
0.25
0.51
0.69
FD
2
0.23
0.19
0.29
0.29
0.26
0.46
0.69
SD
7
0.63
0.39
0.20
0.27
0.18
0.92
0.88
MSC
12
0.70
0.53
0.18
0.22
0.17
0.88
0.90
SNV
12
0.70
0.49
0.17
0.20
0.14
0.89
0.92
FD-MSC-SG
11
0.75
0.52
0.15
0.23
0.13
0.94
0.90
FD-SNV-SG
11
0.75
0.51
0.15
0.23
0.13
0.93
0.88
SD-MSC-SG
8
0.69
0.42
0.20
0.25
0.17
0.92
0.86
SD-SNV-SG
11
0.77
0.49
0.15
0.22
0.14
0.95
0.86
The model with the better of the two spectral bands was chosen for the individual species identification analysis. It was visualized how well the five species of bolete were classified in the PLS-DA model by SEN, SPE, and PRC, as well as more comprehensively assessed by the MCC (Table 4). MCC is an indicator of equilibrium between categories and is more suitable for evaluating the performance of the model, taking the value of 1.00 to indicate that all samples are perfectly categorized (Oliveri & Downey, 2012). For the full spectrum, the MCC values of all selected models ranged from 0.82 to 1.00, and the PRC, SEN, and SPE were also close to 1, indicating that the SD, SD-MSC-SG, and SD-SNV-SG preprocessed FT-NIR combined with the PLS-DA model are suitable for the identification of dried bolete (Table 4). Among them, SD pretreatment accurately identified D (Retiboletus fuscus) and E (Lanmaoa asiatica) with others, while SD-MSC-SG and SD-SNV-SG favored the identification of A (Phlebopus portentosus). Since all the metrics in the train and test sets are 1. The result was not as good as the full spectrum when viewed against the fingerprint area, which had MCC values in the 0.73–1.00 range. Among them, FD-MSC-SG and FD-SNV-SG favored the distinction of A (Phlebopus portentosus). Note: FD: First derivative; SD: Second derivative; MSC: Multiplicative signal correction; SNV: Standard normal variate; SG: Savitzky-Golay; LVs: Latent variables; FP: False positive rates; TP: True positive rates; FN: False negative rates; TN: True negative rates; MCC: Matthews correlation coefficient; PRC: Precision; SEN: Sensitivity; SPE: Specificity; A: Phlebopus portentosus; B: Boletus bainiugan; C: Boletus magnificus; D: Retiboletus fuscus; E: Lanmaoa asiatica.
Spectral pretreatment
Spectral band/cm−1
Train set
Test set
LVs
Class
TP
TN
FP
FN
MCC
PRC
SEN
SPE
TP
TN
FP
FN
MCC
PRC
SEN
SPE
10000–4000
SD
8
A
12
82
1
0
0.95
0.99
1.00
0.99
6
42
0
0
1.00
1.00
1.00
1.00
B
12
82
0
0
1.00
1.00
1.00
1.00
6
42
0
1
0.91
0.98
0.86
1.00
C
29
65
0
1
0.98
0.99
0.97
1.00
15
33
1
0
0.95
0.98
1.00
0.97
D
17
77
0
0
1.00
1.00
1.00
1.00
9
39
0
0
1.00
1.00
1.00
1.00
E
24
70
0
0
1.00
1.00
1.00
1.00
12
36
0
0
1.00
1.00
1.00
1.00
SD-MSC-SG
7
A
12
81
0
0
1.00
1.00
1.00
1.00
6
39
0
0
1.00
1.00
1.00
1.00
B
11
82
0
1
0.95
0.99
0.92
1.00
6
39
0
1
0.91
0.98
0.86
1.00
C
30
63
1
0
0.98
0.99
1.00
0.98
14
31
2
1
0.86
0.94
0.93
0.94
D
16
77
0
1
0.96
0.99
0.94
1.00
9
36
1
2
0.82
0.94
0.82
0.97
E
24
69
1
0
0.97
0.99
1.00
0.99
10
35
1
0
0.94
0.98
1.00
0.97
SD-SNV-SG
7
A
12
81
0
0
1.00
1.00
1.00
1.00
6
41
0
0
1.00
1.00
1.00
1.00
B
11
82
0
1
0.95
0.99
0.92
1.00
6
41
0
1
0.91
0.98
0.86
1.00
C
30
63
1
0
0.98
0.99
1.00
0.98
14
33
1
1
0.90
0.96
0.93
0.97
D
16
77
0
1
0.96
0.99
0.94
1.00
9
38
0
0
1.00
1.00
1.00
1.00
E
24
69
1
0
0.97
0.99
1.00
0.99
12
35
1
0
0.95
0.98
1.00
0.97
6500–4000
MSC
12
A
10
74
0
2
0.90
0.98
0.83
1.00
5
39
0
1
0.90
0.98
0.83
1.00
B
11
73
0
1
0.95
0.99
0.92
1.00
7
37
0
0
1.00
1.00
1.00
1.00
C
24
60
4
6
0.75
0.89
0.80
0.94
12
32
1
3
0.80
0.92
0.80
0.97
D
16
68
0
1
0.96
0.99
0.94
1.00
8
36
0
1
0.93
0.98
0.89
1.00
E
23
61
7
1
0.80
0.91
0.96
0.90
12
32
4
0
0.82
0.92
1.00
0.89
FD-MSC-SG
11
A
12
77
0
0
1.00
1.00
1.00
1.00
6
38
0
0
1.00
1.00
1.00
1.00
B
11
78
0
1
0.95
0.99
0.92
1.00
6
38
0
1
0.91
0.98
0.86
1.00
C
26
63
1
4
0.88
0.95
0.87
0.98
13
31
2
2
0.81
0.92
0.87
0.94
D
16
73
0
1
0.96
0.99
0.94
1.00
8
36
0
1
0.93
0.98
0.89
1.00
E
24
65
5
0
0.88
0.95
1.00
0.93
11
33
3
1
0.79
0.92
0.92
0.92
FD-SNV-SG
11
A
12
76
0
0
1.00
1.00
1.00
1.00
6
37
0
0
1.00
1.00
1.00
1.00
B
11
77
0
1
0.95
0.99
0.92
1.00
6
37
0
1
0.91
0.98
0.86
1.00
C
26
62
2
4
0.85
0.94
0.87
0.97
13
30
3
2
0.76
0.90
0.87
0.91
D
16
72
0
1
0.96
0.99
0.94
1.00
8
35
0
1
0.93
0.98
0.89
1.00
E
23
65
5
1
0.85
0.94
0.96
0.93
10
33
3
2
0.73
0.90
0.83
0.92
Additionally, it was conducted, 200-iteration permutation test to determine if the models were overfitted. The results of the optimal model are presented in Fig. 7 and the rest in Figs. S1 and S2. All the models are free of overfitting as the Q2 and R2 values after replacement (on the left side) are smaller than the original data (on the right side). Additionally, the intercept of the Q2 regression line is lower than 0.4.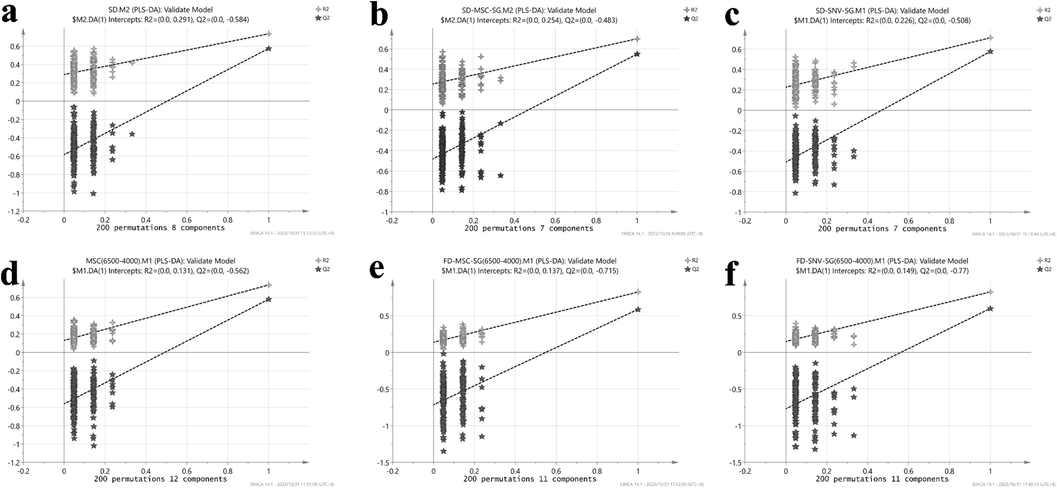
200-iteration permutation test of the optimal PLS-DA model for spectral bands 10,000–4,000 (a, b, c) and 6,500–4,000 (d, e, f).
3.3.3 Establishment of support vector machine models
The full spectrum and featured spectral bands were further analyzed to detect the presence of nonlinear distributions in FT-NIR. The model kernel function is a radial basis function, and the grid search (GS) algorithm is used to find the optimal combination of c and g. All SVM models achieved an accuracy of 0.79, indicating perfect model performance, yet they had excessive c values, implying an inferior model generalization (Table 5). Also, raw spectral accuracies are superior to the PLS-DA model, suggesting that they may have nonlinear distributions to some extent. Note: c: penalty factor; g: kernel parameter; RAW: raw spectra; FD: First derivative; SD: Second derivative; MSC: Multiplicative signal correction; SNV: Standard normal variate; SG: Savitzky-Golay.
Spectral band/cm−1
Spectral pretreatment
c
g
Train acc/%
Test acc/%
10000–4000
raw
3.71 × 10⁵
4.88 × 10⁻⁴
0.80
0.90
FD
4.53 × 101
4.42 × 10⁻²
0.87
0.84
SD
4
1.10 × 10⁻²
0.95
0.82
MSC
3.62 × 10²
2.21 × 10⁻²
0.88
0.86
SNV
1.81 × 10²
3.13 × 10⁻²
0.88
0.86
FD-MSC-SG
9.05 × 101
1.10 × 10⁻²
0.91
0.94
FD-SNV-SG
7.24 × 10²
1.38 × 10⁻³
0.92
0.90
SD-MSC-SG
5.66
1.10 × 10⁻²
0.92
0.84
SD-SNV-SG
5.66
1.10 × 10⁻²
0.92
0.84
6500–4000
raw
9.27 × 10⁴
4.88 × 10⁻⁴
0.79
0.80
FD
1.81 × 10²
1.10 × 10⁻²
0.89
0.96
SD
6.40 × 101
1.10 × 10⁻²
0.89
0.96
MSC
9.27 × 10⁴
1.38 × 10⁻³
0.84
0.80
SNV
6.55 × 10⁴
1.38 × 10⁻³
0.86
0.84
FD-MSC-SG
3.20 × 101
4.42 × 10⁻²
0.88
0.96
FD-SNV-SG
9.05 × 101
1.10 × 10⁻²
0.91
0.96
SD-MSC-SG
2.26 × 101
2.21 × 10⁻²
0.95
0.88
SD-SNV-SG
1.60 × 101
2.21 × 10⁻²
0.95
0.88
A single preprocessing does not contribute to optimizing model performance and considering a combination of preprocessing methods can optimize the model. Higher model accuracy was achieved by combining FD-SNV-SG, SD-MSC-SG, and SD-SNV-SG, compared to FD, SD, SNV, and MSC. This featured spectral band is more suitable for the identification of dried bolete species. Fig. 8 shows the results of the SVM model training set and confusion matrix for the three preprocesses in this region. FD-SNV-SG: A (Phlebopus portentosus), B (Boletus bainiugan), D (Retiboletus fuscus), and E (Lanmaoa asiatica) all classified accurately; SD-MSC-SG: Boletus bainiugan, and Lanmaoa asiatica were classified 100 % accurately; SD-SNV-SG: Phlebopus portentosus, Boletus bainiugan, and Lanmaoa asiatica were classified 1.00 accurately.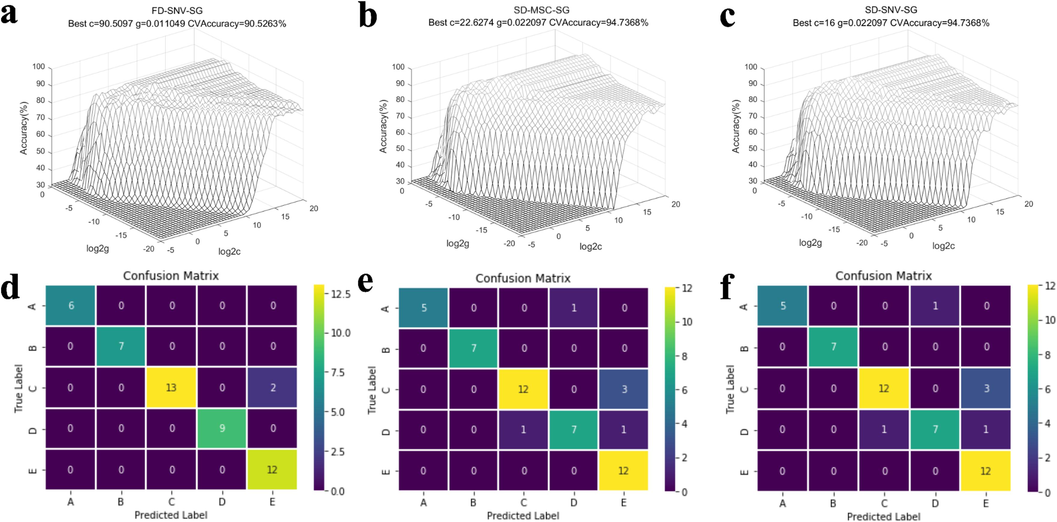
Training set (a, b, c) and confusion matrix (d, e, f) of the optimal SVM model for the featured spectral band (6500-4000c m−1).
3.3.4 Establishment of the ResNet model
The feasibility of using FT-NIR full spectrum (10,000–4,000 cm−1) and featured spectral band (6,500–4,000 cm−1) for species identification of bolete was verified by synchronizing the 2DCOS and ResNet models. Fig. 9 provides full details of the model results. The results obtained from both the full spectrum and featured spectral band bands are similar. As the number of Epochs increases, the train accuracy and test accuracy both reach 1, while the loss value is almost 0. Furthermore, the confusion matrices for both bands are highly accurate in classifying all five types of dried bolete. In addition, the full-spectrum ResNet model outperforms fingerprint area spectral segments with acc and loss functions for the full spectrum being the first to reach 1 and the minimum, respectively. Fig. 9a displays the results of the full spectrum-based model: Epoch 11-train acc and test acc are 1; Epoch 45-loss value is 0.005. For the fingerprint area, Epoch 10 accuracy is 1; Epoch 47-loss value is 0.003. All cases revealed that the FT-NIR full spectrum and featured spectral band bands were suitable for the authentication of five dried bolete species.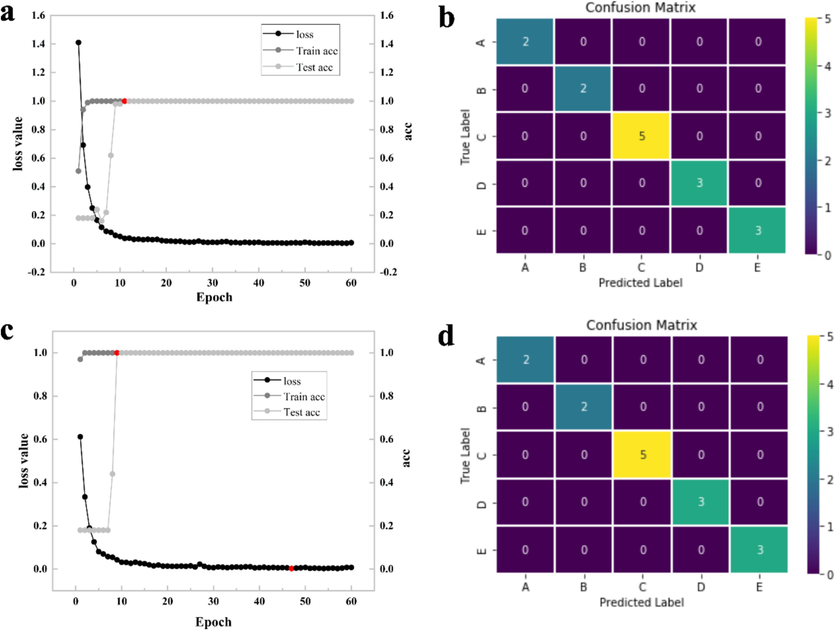
ResNet model accuracy, loss function, and confusion matrix. (a), (b): 6500–4000 cm−1; (c), (d): 10000–4000 cm−1.
3.4 Optimal model performance test
To rule out the effect of large differences in the number of individual samples on model performance, we repeatedly ran the optimal classification model using the same number of samples. We used the lowest number of samples as a criterion (Phlebopus portentosus: 18) to determine the sample size for all species. We selected 90 samples (Phlebopus portentosus:18, Boletus bainiugan:18, Boletus magnificus:18, Retiboletus fuscus:18, and Lanmaoa asiatica:18) to use for model classification performance testing. The training and test sets for each species were 12 and 6, respectively. Classification models based on all data were selected as the optimal model for validation, PLS-DA: SD preprocessed full band, SVM: SD-SNV-SG preprocessed featured spectral band, and ResNet: synchronized 2DCOS (10,000–4,000 cm−1 and 6,000–4,000 cm−1).
Table 6 displays the test results of the optimal model. The results demonstrat that the performance of the PLS-DA model is most affected by the difference in sample size, and the R2, Q2, and accuracy of the model decrease when the sample size is the same for all categories. Whereas the sample size has less effect on the performance of the SVM model, the model's performance is improved when the sample size is the same, c = 5.6569, g = 0.005243, training set accuracy = 1.00, and prediction set accuracy = 0.90 (Fig. S3). For the ResNet model, the difference in sample size had the least impact on the model classification accuracy. Despite the same samples, Epochs of 50 were needed for the full spectrum with an accuracy of 1.00, and Epochs of 56 were needed for the featured spectral band with an accuracy of 1.00 (Fig. S3). Therefore, ResNet was optimal for classifying the five bolete species in this study. Note: PLS-DA: Partial least squares discriminant analysis; SVM: Support vector machine; ResNet: Residual convolutional neural network; SD: Second order derivative; SNV: Standard normal variation; SG: Savitzky-Golay Smoothing; R2: Coefficient of determination; Q2: Indicates the prediction ability of the model to new data c: penalty factor; g: kernel parameter.
models
data set
parameters
Train acc
Test acc
PLS-DA
SD (10000–4000 cm−1)
R2 = 0.71
Q2 = 0.40
0.97
0.87
SVM
SD-SNV-SG
(6000–4000 cm−1)Best c = 5.6569
Best g = 0.0055243
1.00
0.90
ResNet
Synchronous 2DCOS
(10000–4000 cm−1)Epochs = 50
Loss value = 0.320
1.00
1.00
Synchronous 2DCOS
(6000–4000 cm−1)Epochs = 56
Loss value = 0.326
1.00
1.00
4 Discussions
This study simulates the dried wild edible bolete in the market, the prediction of physicochemical indexes (total phenolic content), and species identification, to ensure the stability of the market order and to protect the rights of consumers. The maximum value of R2p for the prediction model in this study reaches 0.79, indicating that the model performance is good (Budiman and Alex, 2012). However, the overall average absolute deviation value is large, indicating that the model needs to be further improved. In the future, it is necessary to increase the sample size and train the model when using the method for actual market detection. At the same time, a suitable feature extraction method can be selected. Nonlinear regression modeling should be carried out simultaneously.
For species identification, the spectral model without preprocessing the PLS-DA model gave inferior results. The SVM model outperformed the PLS-DA model, probably due to the tendency of the dataset to be nonlinear (Zheng et al., 2023a). An outside possibility is that the amount of study data is a small sample, which is very favorable for SVM (Dai et al., 2014). The results of the PLS-DA model classification for each species were analyzed and it was noticed that A (Phlebopus portentosus) was tested with an accuracy of 1 in all cases, which could be a result of the total phenols conferred. The PCA score plot and total phenol content analysis found that A (Phlebopus portentosus) was different from the other species. For discrimination of species E (Lanmaoa asiatica), PLS-DA combined with SD, SD-MSC-SG, and SD-SNV-SG pretreatments had optimal results; SVM model results appeared to have 1.00 classification accuracy in the FD-SNV-SG, SD-MSC-SG, and SD-SNV-SG preprocessing conditions. Additionally, spectral interpretation was evidenced by the fact that the phenolic composition of the maps varied in the vicinity of 7067–6613 cm−1, 5200–5100 cm−1, and 4670 cm−1. In addition, ResNet modeling examined the feasibility of using full spectrum and featured bands to identify dried bolete in this study with 1.00 accuracy in both cases.
Each of the 5 boletus species was selected with 18 samples for optimal PLS-DA, SVM, and ResNet model training prediction to explore the effect of inconsistency in the number of samples on classification. The PLS-DA model was seriously affected by the number of samples, the SVM model was affected to a lesser extent, and the classification results of the ResNet model were the most stable. Thus, the ResNet model in conjunction with synchronous 2DCOS can be used as an advantageous technique for sample classification.
5 Conclusions
This study provided good PLSR prediction models with a maximum R2p value of 0.79 for quality control of dried boletes. By analyzing the storage of boletes in real time, this method helps to ensure the quality assessment of dried boletes in the market. PLS-DA, SVM, and ResNet models demonstrated the feasibility of Fourier transform near-infrared full spectrum (10,000–4,000 cm−1) and eigen-spectral bands (6,500–4,000 cm−1) in identifying dried boletes species. Among them, their best prediction accuracies were 0.98, 0.96, and 1.00, respectively. Exploring the effect of sample size on the classification of the optimal model, the results showed that the difference in sample size affected the classification results of PLS-DA and SVM models; There is no effect on the classification accuracy of ResNet, which is 1.00 for both full and eigenbands. The study proves that the ResNet model combined with synchronous 2DCOS has the prospect of application in the dried boletes market to avoid the quality differentiation phenomenon generated by the chaotic sales of boletes and to maintain the market order.
CRediT authorship contribution statement
Chuanmao Zheng: Writing – review & editing, Writing – original draft, Data curation, Conceptualization. Jieqing Li: Visualization, Validation, Funding acquisition, Formal analysis. Honggao Liu: Resources, Project administration, Methodology, Funding acquisition. Yuanzhong Wang: Validation, Supervision, Software, Funding acquisition.
Acknowledgments
This work was supported by National Natural Science Foundation of China [Grant Number: 32160735]; General Program Project of Joint Special Project on Basic Agricultural Research in Yunnan Province [Grant Number: 202301BD070001-167]; Special Program for the Major Science and Technology Projects of Yunnan Province [Grant Number: 202202AE090001].
Declaration of Competing Interest
The authors declare that they have no known competing financial interests or personal relationships that could have appeared to influence the work reported in this paper.
References
- A comprehensive review on phenolic compounds from edible mushrooms: Occurrence, biological activity, application and future prospective. Crit. Rev. Food Sci. Nutr.. 2022;62(22):6204-6224.
- [CrossRef] [Google Scholar]
- Brazilian Canephora coffee evaluation using NIR spectroscopy and discriminant chemometric techniques. J. Food Compos. Anal.. 2023;116:105065
- [CrossRef] [Google Scholar]
- Evaluation of Total Phenolic Content, HPLC Analysis, and Antioxidant Potential of Three Local Varieties of Mushroom: A Comparative Study. Int. J. Food Sci.. 2022;2022:1-11.
- [CrossRef] [Google Scholar]
- Why you don’t need to use RPD. In: Nair P.K.R., Garrity D., eds. Agroforestry—the Future of Global Land Use. Vol vol. 9. Netherlands: Springer; 2012. p. :455-462.
- [CrossRef] [Google Scholar]
- Burns D.A., Ciurczak E.W., eds. Handbook of near-Infrared Analysis (0 ed.). CRC Press; 2007.
- [CrossRef]
- Rapid identification of total phenolic content levels in boletes by two-dimensional correlation spectroscopy combined with deep learning. Vib. Spectrosc. 2022;121:103404
- [CrossRef] [Google Scholar]
- Discrimination of Ganoderma lucidum according to geographical origin with near infrared diffuse reflectance spectroscopy and pattern recognition techniques. Anal. Chim. Acta. 2008;618(2):121-130.
- [CrossRef] [Google Scholar]
- Comparison between the aqueous extracts of mycelium and basidioma of the edible mushroom Pleurotus pulmonarius: Chemical composition and antioxidant analysis. J. Food Meas. Charact.. 2020;14(2):830-837.
- [CrossRef] [Google Scholar]
- Prediction of protein and lipid content in black soldier fly (Hermetia illucens L.) larvae flour using portable NIR spectrometers and chemometrics. Food Control. 2023;153:109969
- [CrossRef] [Google Scholar]
- Portable NIR spectrometer and chemometric tools for predicting quality attributes and adulteration levels in butteroil. Food Control. 2023;144:109349
- [CrossRef] [Google Scholar]
- Recent Advances in Data Mining Techniques and Their Applications in Hyperspectral Image Processing for the Food Industry: Recent advances in data mining techniques. Compr. Rev. Food Sci. Food Saf.. 2014;13(5):891-905.
- [CrossRef] [Google Scholar]
- New strategy for determination of anthocyanins, polyphenols and antioxidant capacity of Brassica oleracea liquid extract using infrared spectroscopies and multivariate regression. Spectrochim. Acta A Mol. Biomol. Spectrosc.. 2018;194:172-180.
- [CrossRef] [Google Scholar]
- Rapid and non-invasive estimation of total polyphenol content and antioxidant activity of natural corks by NIR spectroscopy and multivariate analysis. Food Packag. Shelf Life. 2023;38:101099
- [CrossRef] [Google Scholar]
- Rapid determination of the shell content in cocoa products using FT-NIR spectroscopy and chemometrics. Talanta. 2023;256:124310
- [CrossRef] [Google Scholar]
- Classification of Black Mahlab seeds (Monechma ciliatum) using GC–MS and FT-NIR and simultaneous prediction of their major volatile compounds using chemometrics. Food Chem.. 2023;408:134948
- [CrossRef] [Google Scholar]
- Determination of total phenolic compounds in yerba mate (Ilex paraguariensis) combining near infrared spectroscopy (NIR) and multivariate analysis. LWT Food Sci. Technol.. 2015;60(2):795-801.
- [CrossRef] [Google Scholar]
- Color compensation and comparison of shortwave near infrared and long wave near infrared spectroscopy for determination of soluble solids content of ‘Fuji’ apple. Postharvest Biol. Technol.. 2016;115:81-90.
- [CrossRef] [Google Scholar]
- A rapid identification based on FT-NIR spectroscopies and machine learning for drying temperatures of Amomum tsao-ko. J. Food Compos. Anal.. 2023;118:105199
- [CrossRef] [Google Scholar]
- Non-destructive quality determination of frozen food using NIR spectroscopy-based machine learning and predictive modelling. J. Food Eng.. 2023;343:111374
- [CrossRef] [Google Scholar]
- Inhibitory effect of rhetsinine isolated from Evodia rutaecarpa on aldose reductase activity. Phytomedicine. 2009;16(2–3):258-261.
- [CrossRef] [Google Scholar]
- Direct Identification and Quantitation of Protein Peptide Powders Based on Multi-Molecular Infrared Spectroscopy and Multivariate Data Fusion. J. Agric. Food Chem.. 2023;71(28):10819-10829.
- [CrossRef] [Google Scholar]
- Building deep learning and traditional chemometric models based on Fourier transform mid-infrared spectroscopy: Identification of wild and cultivated Gastrodia elata. Food Sci. Nutr.. 2023;11(10):6249-6259.
- [CrossRef] [Google Scholar]
- Solving the identification problems of Bolete origins based on multiple data processing: Take Boletus bainiugan as an example. J. Food Compos. Anal.. 2023;124:105693
- [CrossRef] [Google Scholar]
- Main components determination and rapid geographical origins identification in Gentiana rigescens Franch. Based on HPLC, 2DCOS images combined to ResNet. Ind. Crop. Prod.. 2022;187:115430
- [CrossRef] [Google Scholar]
- Impact of postharvest preservation methods on nutritional value and bioactive properties of mushrooms. Trends Food Sci. Technol.. 2021;110:418-431.
- [CrossRef] [Google Scholar]
- Non-destructive detection of polysaccharides and moisture in Ganoderma lucidum using near-infrared spectroscopy and machine learning algorithm. LWT. 2023;184:115001
- [CrossRef] [Google Scholar]
- Multivariate class modeling for the verification of food-authenticity claims. TrAC Trends Anal. Chem.. 2012;35:74-86.
- [CrossRef] [Google Scholar]
- Near-Infrared Spectroscopy in Food Analysis. In: Meyers R.A., ed. Encyclopedia of Analytical Chemistry (1st ed.). Wiley; 2000.
- [CrossRef] [Google Scholar]
- Antioxidant properties of phenolic compounds occurring in edible mushrooms. Food Chem.. 2011;128(3):674-678.
- [CrossRef] [Google Scholar]
- Discriminant Analysis of Geographical Origin of Cork Planks and Stoppers by Near Infrared Spectroscopy. J. Wood Chem. Technol.. 2012;32(1):66-85.
- [CrossRef] [Google Scholar]
- Impact of post-harvest processing or thermal dehydration on physiochemical, nutritional and sensory quality of shiitake mushrooms. Compr. Rev. Food Sci. Food Saf.. 2021;20(3):2560-2595.
- [CrossRef] [Google Scholar]
- Chemical profiles and health-promoting effects of porcini mushroom (Boletus edulis): A narrative review. Food Chem.. 2022;390:133199
- [CrossRef] [Google Scholar]
- The Feasibility of Using Near Infrared Spectroscopy for Rapid Discrimination of Aged Shiitake Mushroom (Lentinula edodes) after Long-Term Storage. J. Chem.. 2015;2015:1-7.
- [CrossRef] [Google Scholar]
- Superiority of two-dimensional correlation spectroscopy combined with ResNet in species identification of bolete. Infrared Phys. Technol.. 2022;125:104303
- [CrossRef] [Google Scholar]
- Qualitative and quantitative analysis of Lanmaoa asiatica in different storage years based on FT-NIR combined with chemometrics. Microchem. J.. 2023;189:108580
- [CrossRef] [Google Scholar]
- Recent advances in quality preservation of postharvest mushrooms (Agaricus bisporus): A review. Trends Food Sci. Technol.. 2018;78:72-82.
- [CrossRef] [Google Scholar]
- Data fusion of FT-NIR and ATR-FTIR spectra for accurate authentication of geographical indications for Gastrodia elata Blume. Food Biosci.. 2023;56:103308
- [CrossRef] [Google Scholar]
- Review of postharvest processing of edible wild-grown mushrooms. Food Res. Int.. 2023;173:113223
- [CrossRef] [Google Scholar]
Appendix A
Supplementary data
Supplementary data to this article can be found online at https://doi.org/10.1016/j.arabjc.2024.106011.
Appendix A
Supplementary data
The following are the Supplementary data to this article:Supplementary Data 1
Supplementary Data 1


